2015 Aug 01 (expected)
Discovery of a New Blue Quasar: SDSS J022218.03-062511.1
Abstract
We report the discovery of a bright blue quasar: SDSS J022218.03-062511.1. This object was discovered spectroscopically while searching for hot white dwarfs that may be used as calibration sources for large sky surveys such as the Dark Energy Survey or the Large Synoptic Survey Telescope project. We present the calibrated spectrum, spectral line shifts and report a redshift of and a rest-frame -band luminosity of .
keywords:
quasars: blue – stars: individual: (SDSS J022218.03-062511.1) – spectroscopy1 Introduction
Discovered in the 1960s, Quasi-Stellar Objects (QSOs or quasars) are among the most luminous and most distant objects in the observable universe. Due to these properties, quasars have been effective probes of many facets of the high-energy and of the high-redshift Universe, including supermassive black holes (Ghisellini et al. 2014), the intergalactic medium (Noterdaeme et al. 2012), the large scale structure of the Universe (Springel et al. 2005; Croom et al. 2009), and the era of reionization (Becker et al. 2001). The Sloan Digital Sky Survey (SDSS) (York et al. 2000) and the Two-Degree Fields Survey (2dF) (Boyle et al. 2000) discovered thousands of these objects and enabled extensive studies of quasars (e.g., Richards et al. 2004; Richards et al. 2005) and the discovery of unusual QSOs (e.g., Hall et al. 2002). Spectroscopic targeting of the SDSS quasars (Richards et al. 2002 for SDSS-I/II; Ross et al. 2012 for SDSS-III) ensured a uniformly selected sample of objects for study in the SDSS. That said, due to (among other things) variations in the surface density of quasars on the sky, conflicts for fibers with other SDSS programs (e.g., galaxies and stars), and the need to avoid fiber collisions, not all potential quasar targets were in fact assigned a fiber by the SDSS spectroscopic targeting algorithms.
Here, we report the serendipitous discovery of the bright, blue quasar, SDSS J022218.03-062511.1. It was missed in the original SDSS program since it was south of the footprint. It was imaged, but not targeted for spectroscopy by SDSS-III spectroscopic targeting. However, based on its SDSS colors, it was selected as a candidate white dwarf for our program to construct a “Golden Sample” of well-characterized, pure-hydrogen-atmosphere (“DA”) white dwarfs. This sample is being developed to aid in the photometric calibration of ongoing and future Southern-sky CCD imaging survey projects such as the Dark Energy Survey (DES) (Sánchez 2010; Diehl et al. 2014) and the Large Synoptic Survey Telescope (LSST) (Tyson 2008). In the following sections, we describe our targeting, observations, and data reductions of this “candidate white dwarf” (Section 2), as well as describe the the properties of this newly discovered quasar (Section 3).
2 Target Selection, Observations & Reductions
To support the photometric calibration of the DES, we have embarked on a project to obtain a “Golden Sample” of at least 30–100 well-characterized DA white dwarfs scattered over the DES footprint to use as spectrophotometric standards. This program is connected to the DES project but uses external (non-DES) observing resources to obtain imaging and spectroscopic data for candidate DA white dwarf targets in the DES footprint. For LSST, we anticipate this sample will need to be increased to 150-250 stars, based solely on scale-up of the survey areal coverage plans.
The program to characterize the DAs for survey calibration draws both candidate and known white dwarfs from several sources, notably the SuperCOSMOS white dwarf survey (Rowell & Hambly 2011) and the SDSS DR4 and DR7 white dwarf catalogs (Eisenstein et al. 2006; Kleinman et al. 2013 respectively). Additional targets were color selected from the SDSS DR10 (Ahn et al. 2014) with special attention being paid to those candidates that were in or near the planned DES SNe fields. One of the SDSS DR10 color selected objects was SDSS J022218.03-062511.1, which is in the DES X-2 supernova field. This object was noted to be fairly blue with colors corresponding to a hot white dwarf. A search of the literature shows this object was first identified as a blue object (PHL 1269) by Chavira (1990) and is identified on their Figure 1. It was later re-identified in the SDSS survey as a blue object but was not selected as a spectroscopic target.
We observed this target as part of our candidate white dwarf follow-up program on 2013 January 3 using three 400 second exposures with the Dual-Imaging Spectrograph (DIS) on the 3.5-m ARC telescope at Apache Point Observatory (APO), New Mexico. The DIS was set to use the standard low-blue/low-red configuration and a 2.0 slit width. For the DIS red channel we used the R300 grating, which covers 4620 Å at 2.31 Å/pix resolution, and for the the blue channel we used the B400 grating, which covers 3660 Å at 1.83 Å/pix resolution. The combined coverage with these two gratings runs from 3600 to 9000 Å. All of the data were processed using the standard IRAF 111IRAF is distributed by the National Optical Astronomy Observatory, which is operated by the Association of Universities for Research in Astronomy (AURA) under cooperative agreement with the National Science Foundation. spectroscopic packages supplemented with the DIStools IRAF external package developed by Gordon Richards, which is specifically used to reduce data taken using the DIS instrument at APO.
3 Results and Discussion
Comparing the SDSS J022218.03-062511.1 spectrum, Figure 1, to QSO spectra observed by SDSS we determined which spectral lines were visible. The four visible lines were identified and these were used to calculate the associated redshift. These values are given in Table 1. The average redshift for this QSO is determined to be . This redshift was verified by visual inspection and cross-comparison of the SDSS spectra of QSOs of similar redshift within the SDSS DR7 quasar catalog (Schneider et al. 2010).

| Spectral Line | [Å] | [Å] | |
|---|---|---|---|
| MgII | 2796 | 4256.577 | 0.522 |
| H | 4341.69 | 6617.334 | 0.524 |
| H | 4862.69 | 7387.625 | 0.519 |
| OIII | 5008.24 | 7601.456 | 0.518 |
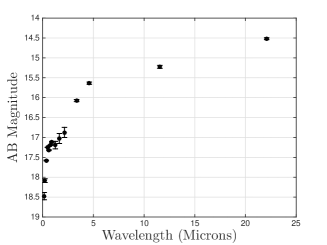
A search of the NED222https://ned.ipac.caltech.edu/ database showed this object was a previously identified X-ray source and further, it was observed by ROSAT333http://www.xray.mpe.mpg.de/rosat/survey/rass-bsc/ (Voges et al. 1999), GALEX444http://galex.stsci.edu/GR6/ (Martin et al. 2005), 2MASS555http://www.ipac.caltech.edu/2mass/releases/allsky/ (Skrutskie et al. 2006), and WISE666http://wise2.ipac.caltech.edu/docs/release/allsky/ (Wright et al. 2010). However until now, no spectrum was ever obtained so it remained unidentified as a quasar. The USNO parallax observations (Monet et al. 2003) are consistent with the zero proper motion expected of a quasar. Table 2 lists the pertinent coordinate and ID information. Table 3 lists the available ROSAT, GALEX, SDSS, 2MASS, and WISE photometry. The 2MASS and WISE values are also converted to AB values following Odenwald et al. (2003) and the prescription given on the WISE IPAC website as noted in Table 3; the errors were not changed. As the data show, this is a fairly bright quasar that had avoided identification to date. Figure 2 shows the far-ultraviolet to mid-infrared spectral energy distribution (SED) for this quasar based on archival data from GALEX, SDSS, 2MASS, and WISE.
| ID/Coordinate | Value |
|---|---|
| SDSS ID | J022218.03-062511.1 |
| SDSS photo ObjID | 1237679439351644175 |
| RA (J2000) | 35.57513 deg. |
| Dec (J2000) | -6.41976 deg. |
| l | 173.24232 |
| b | -60.08776 |
| RASS-6dFGS | 6dF J0222181-062511 |
| ROSAT | 1RXS J022218.0-062513 |
| GALEXASC | J022218.05-062510.2 |
| 2MASS | J02221804-0625111 |
| WISE | J022218.03-062511.0 |
| Filter | value | uncertainty | unit |
|---|---|---|---|
| ROSAT-1RXS | 2.04 | 2.348 | erg/cm2/s |
| GALEX-FUV | 18.4747 | 0.0920 | AB-mag |
| GALEX-FUV | 18.7425 | 0.1099 | Vega-mag |
| GALEX-NUV | 18.0863 | 0.0465 | AB-mag |
| GALEX-NUV | 17.6210 | 0.0347 | Vega-mag |
| SDSS-u | 17.58 | 0.01 | AB-mag |
| SDSS-g | 17.25 | 0.00 | AB-mag |
| SDSS-r | 17.32 | 0.01 | AB-mag |
| SDSS-i | 17.19 | 0.01 | AB-mag |
| SDSS-z | 17.11 | 0.01 | AB-mag |
| 2MASS-J | 17.194 | 0.095 | AB-mag* |
| 2MASS-J | 16.354 | 0.095 | Vega-mag |
| 2MASS-H | 17.027 | 0.126 | AB-mag* |
| 2MASS-H | 15.657 | 0.126 | Vega-mag |
| 2MASS-K | 16.874 | 0.127 | AB-mag* |
| 2MASS-K | 15.034 | 0.127 | Vega-mag |
| WISE-W1 | 16.073 | 0.027 | AB-mag* |
| WISE-W1 | 13.39 | 0.027 | Vega-mag |
| WISE-W2 | 15.636 | 0.029 | AB-mag* |
| WISE-W2 | 12.317 | 0.029 | Vega-mag |
| WISE-W3 | 15.226 | 0.037 | AB-mag* |
| WISE-W3 | 9.984 | 0.037 | Vega-mag |
| WISE-W4 | 14.519 | 0.024 | AB-mag* |
| WISE-W4 | 7.915 | 0.024 | Vega-mag |
-
•
*The 2MASS and WISE values were converted to AB values following Odenwald et al. (2003) and the prescription given on the WISE IPAC website (wise2.ipac.caltech.edu/docs/release/prelim/expsup/sec4_3g.html)
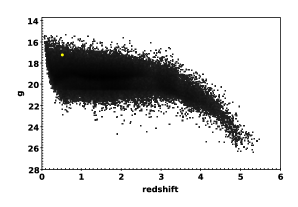
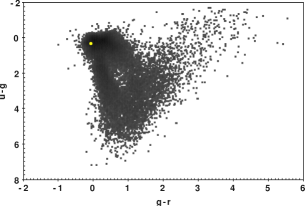
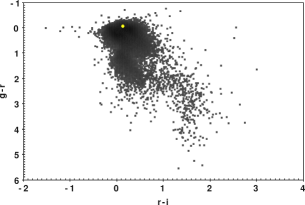
A comparison to the SDSS DR7 quasar catalog (Schneider et al. 2010) shows this object would fall in the brightest 1.1% of the SDSS quasars based on its -band (apparent) magnitude. It is significantly brighter than the average SDSS DR7 quasar in the same redshift range, based on an average of 213 objects in our redshift plus or minus the uncertainty. While this is not the brightest of these quasars, it would be one of the brightest 3–6 in each SDSS filter in the redshift range had it been included in the DR7 catalog. To illustrate the comparison to the SDSS DR7 catalog we present Figure 3 to show how this compares with the 100,000 DR7 quasars. We also show in Figure 4 and Figure 5 where this quasar falls in observed color-color space. Other than being bright, though, this quasar does not appear to be remarkable in any other manner.
A search of other quasar catalogs derived from the SDSS data show this object would still avoid detection given the search parameters used in developing those catalogs. Abraham et al. (2012) searched the SDSS-DR7 data set, so this object had not yet been observed. Bovy et al. (2011) searched DR8 but used a bright cutoff of : this object would be too bright to be included in their study. Ross et al. (2012) searched the area where this quasars is found, but it was too close in redshift to be included.
Finally, we derive the -band luminosity of SDSS J022218.03-062511.1. The luminosity distance for this redshift quasar is Mpc ( km/s; ; = 0.714; assuming a flat Universe) (Wright 2006, Bennett et al. 2014).777http://www.astro.ucla.edu/wright/CosmoCalc.html The -band k-correction (Oke & Sandage 1968), calculated via synthetic photometry of the rest-frame and the observed-frame ARC 3.5m spectrum, is mag. (We are able to calculate the k-correction for the -band directly from the ARC-3.5m spectrum because we have complete spectral coverage for -band in both the observed and the transformed rest frames. The - and -bands however, do not provide complete coverage in both the observed and transformed rest frames.) The -band interstellar extinction, taken from the SDSS DR12 CAS888http://skyserver.sdss.org/dr12, is mag. Taking these values, we compute an interstellar extinction corrected -band absolute magnitude for this quasar of , which is equivalent to a rest-frame g-band luminosity of (where the -band absolute magnitude of the Sun is ).
Acknowledgements.
Partial support for MBF and JAS was provided by the Department of Energy Visiting Faculty Program run by the Department of Energy Office of Science. Additional support came from the Fermilab Center for Particle Astrophysics. Based on observations obtained with the Apache Point Observatory 3.5-meter telescope, which is owned and operated by the Astrophysical Research Consortium. DIStools is used for spectral reductions at Apache Point and was developed by Gordon Richards while at the University of Chicago. Funding for SDSS-III has been provided by the Alfred P. Sloan Foundation, the Participating Institutions, the National Science Foundation, and the U.S. Department of Energy Office of Science. The SDSS-III web site is http://www.sdss3.org/. SDSS-III is managed by the Astrophysical Research Consortium for the Participating Institutions of the SDSS-III Collaboration including the University of Arizona, the Brazilian Participation Group, Brookhaven National Laboratory, Carnegie Mellon University, University of Florida, the French Participation Group, the German Participation Group, Harvard University, the Instituto de Astrofisica de Canarias, the Michigan State/Notre Dame/JINA Participation Group, Johns Hopkins University, Lawrence Berkeley National Laboratory, Max Planck Institute for Astrophysics, Max Planck Institute for Extraterrestrial Physics, New Mexico State University, New York University, Ohio State University, Pennsylvania State University, University of Portsmouth, Princeton University, the Spanish Participation Group, University of Tokyo, University of Utah, Vanderbilt University, University of Virginia, University of Washington, and Yale University. This publication makes use of data products from the Two Micron All Sky Survey, which is a joint project of the University of Massachusetts and the Infrared Processing and Analysis Center/California Institute of Technology, funded by the National Aeronautics and Space Administration and the National Science Foundation. This research has made use of the NASA/IPAC Extragalactic Database (NED), which is operated by the Jet Propulsion Laboratory, California Institute of Technology, under contract with the National Aeronautics and Space Administration. This research has made use of the SIMBAD database, operated at CDS, Strasbourg, France. This research made use of data from the GALEX mission. GALEX is a NASA small explorer, launched in 2003 April. It is operated for NASA by Caltech under NASA contract NAS5-98034. This publication makes use of data products from the Wide-field Infrared Survey Explorer, which is a joint project of the University of California, Los Angeles, and the Jet Propulsion Laboratory California Institute of Technology, funded by the National Aeronautics and Space Administration. The TOPCAT software package999http://www.starlink.ac.uk/topcat/ was used in much of the plotting and analysis in this work.References
- [Abraham et al.(2012)] Abraham, S., Philip, N. S., Kembhavi, A., Wadadekar, Y. G., & Sinha, R.: 2012, MNRAS, 419, 80
- [Ahn et al.(2014)] Ahn, C. P., Alexandroff, R., Allende Prieto, C., et al.: 2014, ApJS, 211, 17
- [Becker et al.(2001)] Becker, R. H., Fan, X., White, R. L., et al.: 2001, AJ, 122, 2850
- [Bennett et al.(2014)] Bennett, C. L., Larson, D., Weiland, J. L., & Hinshaw, G.: 2014, ApJ, 794, 135
- [Bovy et al.(2011)] Bovy, J., Hennawi, J. F., Hogg, D. W., et al.: 2011, ApJ, 729, 141
- [Boyle et al.(2000)] Boyle, B. J., Shanks, T., Croom, S. M., et al.: 2000, MNRAS, 317, 1014
- [Chavira (1990)] Chavira, E.: 1990, Rev. Mex. Astro. Astrofis., 20, 47
- [Croom et al.(2009)] Croom, S. M., Richards, G. T., Shanks, T.: 2009, MNRAS, 399, 1755
- [Diehl et al.(2014)] Diehl, H. T., Abbott, T. M. C., Annis, J., et al.: 2014, SPIE, 9149, 31
- [Eisenstein et al.(2006)] Eisenstein, D. J., Liebert, J., Harris, H. C., et al.: 2006, ApJS, 167, 40
- [Ghisellini et al.(2014)] Ghisellini, G., Tavecchio, F., Maraschi, L., Celotti, A., & Sbarrato, T.: 2014, Nature, 515, 376
- [Hall et al.(2002)] Hall, P. B., Anderson, S. F., Strauss, M. A., et al.: 2002, ApJS, 141, 267
- [Kleinman et al.(2013)] Kleinman, S. J., Kepler, S. O., Koester, D., et al.: 2013, ApJS, 204, 5
- [Martin et al.(2005)] Martin, D. C., Fanson, J., Schiminovich, D., et al.: 2005, ApJ, 619, L1
- [Monet et al.(2003)] Monet, D. G., Levine, S. E., Casian, B., et al.: 2003, AJ, 125, 984
- [Noterdaeme et al.(2012)] Noterdaeme, P., Petitjean, P., Carithers, W. C., et al.: 2012, A&Ap, 547L, 1
- [Odenwald et al.(2003)] Odenwald, S., Kashlinsky, A., Mather, J. C., Skrutskie, M. F., & Cutri, R. M.: 2003, ApJ, 583, 535
- [Oke & Sandage(1968)] Oke, J. B., & Sandage, A.: 1968, ApJ, 154, 21
- [Richards et al.(2005)] Richards, G. T., Croom, S. M., Anderson, S. F., et al.: 2005, MNRAS, 360, 839
- [Richards et al.(2002)] Richards, G. T., Fan, X., Newberg, H. J., et al.: 2002, AJ, 123, 2945
- [Richards et al.(2004)] Richards, G. T., Nichol, R. C., Gray, A. G., et al.: 2004, ApJS, 155, 257
- [Ross et al.(2012)] Ross, N. P., Myers, A. D., Sheldon, E. S., et al.: 2012, ApJS, 199, 3
- [Rowell & Hambly(2011)] Rowell, N. & Hambly, N. C.: 2011, MNRAS, 417, 93
- [Sánchez (2010)] Sánchez, E. (for the DES Collaboration): 2010, JPhCS, 259, 2080
- [Schneider et al.(2010)] Schneider, D. P., Richards, G. T., Hall, P. B., et al.: 2010, AJ, 139, 2360
- [Skrutskie et al.(2006)] Skrutskie, M. F., Cutri, R. M., Stiening, R., et al.: 2006, AJ, 131, 1163
- [Springel et al.(2005)] Springel, V., White, S. D. M., Jenkins, A., et al.: 2005, Nature, 435, 629
- [Tokunaga & Vacca(2005)] Tokunaga, A. T. & Vacca, W. D.: 2005, PASP, 117, 1459
- [Tyson(2008)] Tyson, T.: 2008, Space Telescope Science Institute Symposium “A Decade of Dark Energy”, 25
- [Voges et al.(1999)] Voges, W., Aschenbach, B, Boller, Th., et al.: 1999, A&Ap, 349, 389
- [Wright(2006)] Wright, E. L.: 2006, PASP, 118, 1711
- [Wright et al.(2010)] Wright, E. L., Eisenhardt, P. R. M., Mainzer, A. K., et al.: 2010, AJ, 140, 1868
- [York et al.(2000)] York, D. G., Adelman, J., Anderson, J. E. et al.: 2000, AJ, 120, 1579