A Placement Vulnerability Study in Multi-Tenant Public Clouds††thanks: This is the full version of an earlier paper published at USENIX Security 2015 [32].
Abstract
Public infrastructure-as-a-service clouds, such as Amazon EC2, Google Compute Engine (GCE) and Microsoft Azure allow clients to run virtual machines (VMs) on shared physical infrastructure. This practice of multi-tenancy brings economies of scale, but also introduces the risk of sharing a physical server with an arbitrary and potentially malicious VM. Past works have demonstrated how to place a VM alongside a target victim (co-location) in early-generation clouds and how to extract secret information via side-channels. Although there have been numerous works on side-channel attacks, there have been no studies on placement vulnerabilities in public clouds since the adoption of stronger isolation technologies such as Virtual Private Clouds (VPCs).
We investigate this problem of placement vulnerabilities and quantitatively evaluate three popular public clouds for their susceptibility to co-location attacks. We find that adoption of new technologies (e.g., VPC) makes many prior attacks, such as cloud cartography, ineffective. We find new ways to reliably test for co-location across Amazon EC2, Google GCE, and Microsoft Azure. We also find ways to detect co-location with victim web servers in a multi-tiered cloud application located behind a load balancer.
We use our new co-residence tests and multiple customer accounts to launch VM instances
under different strategies that seek to maximize the likelihood of
co-residency. We find that it is much easier (10 higher success rate)
and cheaper (up to $114 less) to achieve co-location in these three clouds
when compared to a secure reference placement policy.
Keywords: co-location detection, multi-tenancy, cloud security
1 Introduction
Public cloud computing offers easy access to relatively cheap compute and storage resources. Cloud providers are able to sustain this cost-effective solution through multi-tenancy, where the infrastructure is shared between computations run by arbitrary customers over the Internet. This increases utilization compared to dedicated infrastructure, allowing lower prices.
However, this practice of multi-tenancy also enables various security attacks in the public cloud. Should an adversary be able to launch a virtual machine on the same physical host as a victim, making the two VMs co-resident (sometimes the term co-located is used), there exist attacks that break the logical isolation provided by virtualization to breach confidentiality [39, 37, 40, 35, 30, 34] or degrade the performance [31, 41] of the victim. Perhaps most notable are the side-channel attacks that steal private keys across the virtual-machine isolation boundary by cleverly monitoring shared resource usage [39, 37, 40].
Less understood is the ability of adversaries to arrange for co-residency in the first place. In general, doing so consists of using a launch strategy together with a mechanism for co-residency detection. The only prior work on obtaining co-residency [30] showed simple network-topology-based co-residency checks along with low-cost launch strategies that obtain a high probability of achieving co-residency compared to simply launching as many VM instances as possible. When such advantageous strategies exist, we say the cloud suffers from a placement vulnerability. Since then, Amazon has made several changes to their architecture, including removing the ability to do the simplest co-residency check. Whether placement vulnerabilities exist in other public clouds has, to the best of our knowledge, never been explored.
In this work, we provide a framework to systematically evaluate public clouds for placement vulnerabilities and show that three popular public cloud providers may be vulnerable to co-location attacks. More specifically, we set out to answer four questions:
-
Can co-residency be effectively detected in modern public clouds?
-
Are known launch strategies [30] still effective in modern clouds?
-
Are there any new exploitable placement vulnerabilities?
-
Can we quantify the money and time required of an adversary to achieve a certain probability of success?
We start by exploring the efficacy of prior co-residency tests (§ 4) and develop more reliable tests for our placement study (§ 4.1). We also find a novel test to detect co-residency with VMs uncontrolled by the attacker by just using their public interface even when they are behind a load balancer (§ 4.3).
We use multiple customer accounts across three popular cloud providers, launch VM instances under different scenarios that may affect the placement algorithm, and test for co-residency between all launched instances. We analyze three popular cloud providers, Amazon Elastic Compute Cloud (EC2) [2], Google Compute Engine (GCE) [6] and Microsoft Azure (Azure) [16], for vulnerabilities in their placement algorithm. After exhaustive experimentation with each of these cloud providers and at least 190 runs per cloud provider, we show that an attacker can still successfully arrange for co-location (§ 5). We find new launch strategies in these three clouds that obtain co-location faster (10x higher success rate) and cheaper (up to $114 less) when compared to a secure reference placement policy.
2 Background
Public clouds.
Infrastructure-as-a-service (IaaS) public clouds, such as Amazon EC2, Google Compute Engine and Microsoft Azure, provide a management interface for customers to launch and terminate VM instances with a user-specified configuration. Typically, users register with the cloud provider for an account and use the cloud interface to specify VM configuration, which includes instance type, disk image, data center or region to host the VMs, and then launch VM instances. In addition, public clouds also provide many higher-level services that monitor load and automatically launch or terminate instances based on the workload [14, 4, 8]. These services internally use the same mechanisms as users to configure, launch and terminate VMs.
The provider’s VM launch service receives from a client a desired set of parameters describing the configuration of the VM. The service then allocates resources for the new VM; this process is called VM provisioning. We are most interested in the portion of VM provisioning that selects the physical host to run a VM, which we call the VM placement algorithms. The resulting VM-to-host mapping we call the VM placement. The placement for a specific virtual machine may depend on many factors: the load on each machine, the number of machines in the data center, the number of concurrent VM launch requests, etc.
| Type | Variable |
|---|---|
| # of customers | |
| # of instances launched per customer | |
| Placement | Instance type |
| Parameters | Data Center (DC) or Region |
| Time launched | |
| Cloud provider | |
| Time of the day | |
| Environment | Days of the week |
| Variable | Number of in-use VMs |
| Number of machines in DC |
While cloud providers do not generally publish their VM placement algorithms, there are several variables under the control of the user that could affect the VM placement, such as time-of-day, requested data center, and number of instances. A list of some notable parameters are given in Figure 1. By controlling these variables, an adversary can partially influence the placement of VMs on physical machines that may also host a target set of VMs. We call these variables placement variables and the set of values for these variables form a launch strategy. An example launch strategy is to launch 20 instances 10 minutes after triggering an auto-scale event on a victim application. This is, in fact, a launch strategy suggested by prior work [30].
Placement policies.
VM placement algorithms used in public clouds often aim to increase data center efficiency, quality of service, or both by realizing some placement policy. For instance, a policy that aims to increase data center utilization may pack launched VMs on a single machine. Similarly policies that optimize the time to provision a VM, which involves fetching an image over the network to the physical machine and booting, may choose the last machine that used the same VM image, as it may already have the VM image cached on local disks. Policies may vary across cloud providers, and even within a provider.
Public cloud placement policies, although undocumented, often exhibit behavior that is externally observable. One example is parallel placement locality [30], in which VMs launched from different accounts within a short time window are often placed on the same physical machine. Two instances launched sequentially, where the first instance is terminated before the launch of the second one, are often placed on the same physical machine, a phenomenon called sequential placement locality [30].
These placement behaviors are artifacts of the two placement policies described earlier, respectively. Other examples of policies and resulting behaviors exist as well. VMs launched from the same accounts may either be packed on the same physical machine to maximize locality (and hence co-resident with themselves) or striped across different physical machines to maximize redundancy (and hence never co-resident with themselves). In the course of normal usage, such behaviors are unlikely to be noticed, but they can be measured with careful experiments.
Launch strategies.
An adversary can exploit placement behaviors to increase the likelihood of co-locating with target victims. As pointed out by Ristenpart et al. [30], parallel placement locality can be exploited by triggering a scale-up event on target victim by increasing their load, which will cause more victim VMs to launch. The adversary can then simultaneously (or after a time lag) launch multiple VMs some of which may be co-located with the newly launched victim VM(s).
In this study, we develop a framework to systematically evaluate public clouds against launch strategies and uncover previously unknown placement behaviors. We approach this study by (i) identifying a set of placement variables that characterize a VM, (ii) enumerating the most interesting values for these variables, and (iii) quantifying the cost of such a strategy, if it in fact exposes a co-residency vulnerability. We repeat this for three major public cloud providers: Amazon EC2, Google Compute Engine, and Microsoft Azure. Note that the goal of this study is not to reverse engineer the exact details of the placement policies, but rather to identify launch strategies that can be exploited by an adversary.
Co-residency detection.
A key technique for understanding placement vulnerabilities is detecting when VMs are co-resident on the same physical machine (also termed co-locate). Ristenpart et al. [30] proposed several co-residency detection techniques and used them to identify several placement vulnerabilities in Amazon EC2. As co-resident status is not reported directly by the cloud provider, these detection methods are usually referred to as side-channel based techniques, which can be further classified into two categories: logical side-channels or performance side-channels.
Logical side-channels: Logical side-channels allow information leakage via logical resources that are observable to a software program, e.g., IP addresses, timestamp counter values. Particularly in Amazon EC2, each VM is assigned two IP addresses, a public IP address for communication over the Internet, and a private or internal IP address for intra-datacenter communications. The EC2 cloud infrastructure allowed translation of public IP addresses to their internal counterparts. This translation revealed the topology of the internal data center network, which allowed a remote adversary to map the entire public cloud infrastructure and determine, for example, the availability zone and instance type of a victim. Furthermore, co-resident VMs tended to have adjacent internal IP addresses.
Logical side-channels can also be established via shared timestamp counters. In prior work, skew in timestamp counters were used to fingerprint a physical machine [28], although this technique has not yet been explored for co-residency detection. Co-residency detection can possibly be performed via any shared software state between the two customers. In the context of container-based platform-as-a-service (PaaS) clouds, where customers share the same operating system, example of logical side-channels include interrupt counts and process statistics reported in procfs.
Performance side-channels: Performance side-channels are created when performance variations due to resource contention are observable. Such variations can be used as an indicator of co-residency. For instance, network performance has been used for detecting co-residence [30, 31]. This is because hypervisors often directly relay network traffic between VMs on the same host, providing detectably shorter round-trip times than between VMs on different hosts.
Covert channels, as a special case of side-channels, can be established between two VMs that are cooperating in order to detect co-residency. For purposes of co-residency detection, covert channels based on shared hardware resources, such as last level caches (LLCs) or local storage disks, can be exploited by one VM to detect performance degradation caused by a co-resident VM. Covert channel detection techniques require control over both VMs, and are usually used in experimentation rather than in practical attacks. We later refer to such approaches as cooperative co-residency detection.
Placement study in PaaS.
While we mainly studied placement vulnerabilities in the context of IaaS, we also experimented with Platform-as-a-Service (PaaS) clouds. PaaS clouds offer elastic application hosting services. Unlike IaaS where users are granted full control of a VM, PaaS provides managed compute tasks (or instances) for the execution of hosted web applications, and allow multiple such instances to share the same operating system. These clouds use either process-level isolation via file system access controls, or increasingly Linux-style containers (see [40] for a more detailed description). As such, logical side-channels alone are usually sufficient for co-residency detection purposes. For instance, in PaaS clouds, co-resident instances often share the same public IP address as the host machine. This is because the host-to-instance network is often configured using Network Address Translation (NAT) and each instance is assigned a unique port under the host IP address for incoming connections.
We found that many such logical side-channel-based co-residency detection approaches worked on PaaS clouds, even on those using containers. Specifically, we used both system-level interrupt statistics via /proc/interrupts and shared public IP addresses of the instances to detect co-location in Heroku [10]. Note that both these techniques either require direct access to victim instances, or a software vulnerability to access procfs or initiate reverse connections, respectively.
Our brief investigation of co-location attacks in Heroku [11] showed that naïve strategies like scaling two PaaS web applications to 30 instances with a time interval of 5 minutes between them, resulted in co-location in 6 out of 10 attempts. Moreover, since the co-location detection was simple and quick including the time taken for application scaling, we were able to do these experiments free of cost. This result reinforces prior findings on PaaS co-location attacks [40] and confirms the existence of cheap launch strategies to achieve co-location and easy detection mechanisms to verify it. We do not investigate PaaS clouds further in the rest of this paper.
3 Threat Model
Co-residency attacks in public clouds, as mentioned earlier, involve two steps: a launch strategy and co-residency detection. We assume that the adversary has access to tools to identify a set of target victims, and either knows victim VMs’ launch characteristics or can directly trigger their launches. The latter is possible by increasing load in order to cause the victim to scale up by launching more instances. The focus of this study is to identify if there exists any launch strategy that an adversary can devise to increase the chance of co-residency with a set of targeted victim VMs.
In our threat model, we assume that the cloud provider is trusted and the attacker has no affiliation of any form with the cloud provider. This also means that the adversary has no internal knowledge of the placement policies that are responsible for the VM placements in the public cloud. An adversary also has the same interface for launching and terminated VMs as regular customers, and no other special interfaces. Even though there may be per-account limits on the number of VMs that a cloud provider imposes, an adversary has access to an unlimited number of accounts and hence has no limit on the number of VMs he could launch at any given time.
No resource-limited cloud provider is a match to an adversary with limitless resources and hence realistically we assume that the adversary is resource-limited. For the same reason, a cloud provider is vulnerable to a launch strategy only when it is trivial or cost-effective for an adversary. As such, we aim to (i) quantify the cost of executing a launch strategy by an adversary, (ii) define a reference placement policy with which the placement policies of real clouds can be compared, and (iii) define metrics to quantify a placement vulnerability as existing when there are cost-effective launch strategies that do better than they would against the reference policy.
Cost of a launch strategy.
Quantifying the cost of a launch strategy is straightforward: it is the cost of launching a number of VMs and running tests to detect co-residency with one or more target victim VMs. To be precise, the cost of a launch strategy is given by . Here is the number of attacker VMs of type launched to get co-located with one of the victim VMs. is the price of running one VM of type for a unit time. is the time (in billing units) to detect co-residency between all pairs of attackers and victim VMs, excluding pairs within each group. For simplicity, we assume that the attacker is running all instances until the last co-residency check completes or that, equivalently. When the time to finish co-residency checks is within the granularity of one unit of billing time (e.g., one hour on EC2), this is equivalent to a more refined model.
Reference placement policy.
In order to define placement vulnerability, we need a yardstick to compare various placement policies and the launch strategies that they may be vulnerable to. To aid this purpose, we define a simple reference placement policy that has good security properties against co-residency attacks and use it to gauge the placement policies used in public clouds. Let there be machines in a data center and let each machine have unlimited capacity. Given a set of unordered VM launch requests, the mapping of each VM to a machine follows a uniform random distribution. Let there be victim VMs assigned to unique machines among , where . The probability of at least one collision (i.e. co-residency) under the random placement policy and the above attack scenario when attacker launches instances is given by . We call this probability the reference probability.***This probability event follows a hypergeometric distribution. Recall that for calculating the cost of a launch strategy under this reference policy, we also need to define the price function, . For simplicity, we use the most competitive minimum price offered by any cloud provider as the price for the compute resource under the reference policy. For example, at the time of this study, Amazon EC2 offered t2.small instances at $0.026 per hour of instance activity, which was the cheapest price across all three clouds considered in this study.
Note that the reference placement policy makes several simplifying assumptions, but these only benefit the attacker. This is conservative as we will compare our experimental results to the best possible launch strategy under the reference policy. For instance, the assumption on unlimited capacity of the servers only benefits the attacker as it never limits the number of victim VMs an attacker could potentially co-locate with. We use a conservative value of 1000 for , which is at least an order-of-magnitude less than the number of servers (50,000) in the smallest reported Amazon EC2 data centers [5]. Similarly, the price function of this placement policy also favors an attacker as it provides the cheapest price possible in the market even though in reality a secure placement policy may demand a higher price. Hence, it would be troubling if the state-of-the-art placement policies used in public clouds does not measure well even against such a conservative reference placement policy.
Placement Vulnerability.
Putting it all together, we define two metrics to gauge any launch strategy against a placement policy: (i) normalized success rate, and (ii) cost-benefit. The normalized success rate is the success rate of the launch strategy in the cloud under test normalized to the success rate of the same strategy under the reference placement policy. The cost-benefit of a strategy is the additional cost that is incurred by the adversary in the reference placement policy to achieve the same success rate as the strategy in the placement policy under test. We define that a placement policy has a placement vulnerability if and only if there exists a launch strategy with a normalized success rate that is greater than 1.
Note that the normalized success rate quantifies how easy it is to get co-location. On the other hand, the cost benefit metric helps to quantify how cheap it is to get co-location compared to a more secure placement policy. These metrics can be used to compare launch strategies under different placement policies, where a higher value for any of these metrics indicate that the placement policy is relatively more vulnerable to that launch strategy. An ideal placement policy should aim to reduce both the success rate and the cost benefit of any strategy.
4 Detecting Co-Residence
An essential prerequisite for the placement vulnerability study is access to a co-residency detection technique that identifies whether two VMs are resident on the same physical machine in a third-party public cloud.
Challenges in modern clouds.
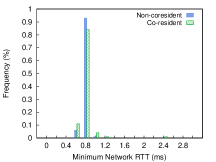
Applying the detection techniques mentioned in Section 2 is no longer feasible in modern clouds. In part due to the vulnerability disclosure by Ristenpart et al. [30], modern public clouds have adopted new technologies that enhance the isolation between cloud tenants and thwart known co-residence detection techniques. In the network layer, virtual private clouds (VPCs) have been broadly employed for data center management [21, 18]. With VPCs, internal IP addresses are private to a cloud tenant, and can no longer be used for cloud cartography. Although EC2 allowed this in older generation instances (called EC2-classic), this is no longer possible under Amazon VPC setting. In addition, VPCs require communication between tenants to use public IP addresses for communication. As shown in Figure 2, the network timing test is also defeated, as using public IP addresses seems to involve routing in the data center network rather than short-circuiting through the hypervisor. Here, the ground-truth of co-residency is detected using memory-based covert-channel (described later in this section). Notice that there is no clear distinction between the frequency distribution of the network round trip times of co-resident and non-coresident pairs on all three clouds.
In the system layer, persistent storage using local disks is no longer the default. For instance, many Amazon EC2 instance types do not support local storage [1]; GCE and Azure provide only local Solid State Drives (SSD) [7, 15], which are less susceptible to detectable delays from long seeks. In addition, covert channels based on last-level caches [30, 31, 35, 38] are less reliable in modern clouds that use multiple CPU packages. Two VMs sharing the same machine may not share LLCs to establish the covert channel. Hence, these LLC-based covert-channels can only capture a subset of co-resident instances.
As a result of these technology changes, none of the prior techniques for detecting co-residency reliably work in modern clouds, compelling us to develop new approaches for our study.
4.1 Co-residency Tests
We describe in this subsection a pair of tools for co-residency tests, with the following design goals:
-
Applicable to a variety of heterogeneous software and hardware stacks used in public clouds.
-
Detect co-residency with high confidence: the false detection rate should be low even in the presence of background noise from other neighboring VMs.
-
Detect co-residency fast enough to facilitate experimentation among large sets of VMs.
We chose a performance covert-channel based detection technique that exploits shared hardware resources, as this type of covert-channels are often hard to remove and most clouds are very likely to be vulnerable to it.
A covert-channel consists of a sender and a receiver. The sender creates contention for a shared resource and uses it to signal another tenant that potentially share the same resource. The receiver, on the other hand, senses this contention by periodically measuring the performance of that shared resource. A significant performance degradation measured at the receiver results in a successful detection of a sender’s signal. Here the reliability of the covert-channel is highly dependent on the choice of the shared resource and the level of contention created by the sender. The sender is the key component of the co-residency detection techniques we developed as part of this study.
// allocate memory multiples of 64 bits char_ptr = allocate_memory((N+1)*8) //move half word up unaligned_addr = char_ptr + 2
loop forever: loop i from (1..N): atomic_op(unaligned_addr + i, some_value) end loop end loop \theverbbox
Memory-locking sender.
Modern x86 processors support atomic memory operations, such as XADD for atomic addition, and maintain their atomicity using cache coherence protocols. However, when a locked operation extends across a cache-line boundary, the processor may lock the memory bus temporarily [34]. This locking of the bus can be detected as it slows down other uses of the bus, such as fetching data from DRAM. Hence, when used properly, it provides a timing covert channel to send a signal to another VM. Unlike cache-based covert channels, this technique works regardless of whether VMs share a CPU core or package.
We developed a sender exploiting this shared memory-bus covert-channel. The psuedocode for the sender is shown in Figure 3. The sender creates a memory buffer and uses pointer arithmetic to force atomic operations on unaligned memory addresses. This indirectly locks the memory bus even on all modern processor architectures [34].
size = LLC_size * (LLC_ways +1) stride = LLC_sets * cacheline_sz) buffer = alloc_ptr_chasing_buff(size, stride)
loop sample from (1..10): //number of samples start_rdtsc = rdtsc() loop probes from (1..10000): probe(buffer); //always hits memory end loop time_taken[sample] = (rdtsc() - start_rdtsc) end loop \theverbbox
Receivers.
With the aforementioned memory-locking sender, there are several ways to sense the memory-locking contention induced by the sender in another co-resident tenant instance. All the receivers measure the memory bandwidth of the shared system. We present two types of receivers that we used in this study that works on heterogeneous hardware configurations.
Memory-probing receiver uses carefully crafted memory requests that always miss in the cache hierarchy and always hit memory. This is ensured by constricting the data accesses of the receiver into a single LLC set. In order to evade hardware prefetching, we use a pointer-chasing buffer to randomly access a list of memory addresses (pseudocode shown in Figure 4). The time needed to complete a fixed number of probes (e.g., 10,000) provides a signal of co-residence: when the sender is performing locked operations, loads from memory proceed slowly.
Memory-locking receiver is similar to the sender but measures the
number of unaligned atomic operations that could be completed per unit
time. Although it also measures the memory bandwidth, unlike the memory-probing
receiver, it works even when the cache architecture of the machine is unknown.
The sender along with these two receivers form our two novel co-residency detection methods that we use in this study: memory-probing test and memory-locking test (named after their respective receivers). These comprise our co-residency test suite. Each test in the suite starts by running the receiver on one VM while keeping the other idle. The performance measured by this run is the baseline performance without contention. Then the receiver and the sender are run together. If the receiver detects decreased performance, the tests conclude that the two VMs are co-resident. We use a slowdown threshold to detect when the change in receiver performance indicates co-residence (discussed later in the section).
| Machine | Cores | Memory | Memory | Socket |
|---|---|---|---|---|
| Architecture | Probing | Locking | ||
| Xeon E5645 | 6 | 3.51 | 1.79 | Same |
| Xeon X5650 | 12 | 3.61 | 1.77 | Same |
| Xeon X5650 | 12 | 3.46 | 1.55 | Diff. |
Evaluation on local testbed.
In order to measure the efficacy of this covert-channel we ran tests in our local testbed. Results of running memory-probing and -locking tests under various configurations are shown in Figure 5. The hardware architectures of these machines are similar to what is observed in the cloud [22]. Across these hardware configurations, we observed a performance degradation of at least 3.4 compared to not running memory-locking sender on a non-coresident instance (i.e. a baseline run with idle sender), indicating reliability. Note that this works even when the co-resident instances are running on cores on different sockets, which does not share the same LLC (works on heterogeneous hardware). Further, a single run takes one tenth of a second to complete and hence is also quick.
Note that for this test suite to work in the real world, an attacker requires control over both the VMs under test, which includes the victim. We call this scenario as co-residency detection under cooperative victims (in short, cooperative co-residency detection). Such a mechanism is sufficient to observe placement behavior in public clouds (Section 4.2). We further investigated approaches to detect co-residency under a realistic setting with an uncooperative victim. In Section 4.3 we show how to adapt the memory-probing test to detect co-location with one of the many webservers behind a load balancer.
4.2 Cooperative Co-residency Detection
In this section, we describe the methodology we used to detect co-residency in public clouds. For the purposes of studying placement policies, we had the flexibility to control both VMs that we test for co-residence. We did this by launching VMs from two separate accounts and test them for pairwise co-residence. We encountered several challenges when running the co-residency test suite on three different public clouds - Google Computer Engine, Amazon EC2 and Microsoft Azure.
First, we had to handle noise from neighboring VMs sharing the same host. Second, hardware and software heterogeneity in the three different public clouds required special tuning process for the co-residency detection tests. Finally, testing co-residency for a large set of VMs demanded a scalable implementation. We elaborate on our solution to these challenges below.
Handling noise.
Any noise from neighboring VMs could affect the performance of the receiver with and without the signal (or baseline) and result in misdetection. To handle such noise, we alternate between measuring the performance with and without the sender’s signal, such that any noise equally affects both the measurements. Secondly, we take ten samples of each measurement and only detect co-residence if the ratios of both the mean and median of these samples exceed the threshold. As each run takes a fraction of a second to complete, repeating 10 times is still fast enough.
| Cloud | Machine | Clock | LLC |
| Provider | Architecture | (GHz) | (Ways Set) |
| EC2 | Intel Xeon E5-2670 | 2.50 | 20 20480 |
| GCE | Generic Xeon* | 2.60* | 20 16384 |
| Azure | Intel E5-2660 | 2.20 | 20 16384 |
| Azure | AMD Opteron 4171 HE | 2.10 | 48 1706 |
Tuning thresholds.
As expected, we encountered different machine configurations on the three different public clouds (shown in Figure 6) with heterogeneous cache dimensions, organizations and replacement policies [12, 27]. This affects the performance degradation observed by the receivers with respect to the baseline and the ideal threshold for detecting co-residency. This is important because the thresholds we use to detect co-residence yield false positives, if set too low, and false negatives if set too high. Hence, we tuned the threshold to each hardware we found on all three clouds.
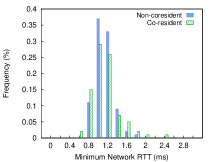
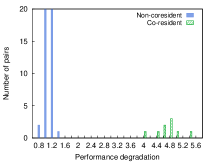
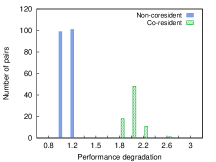
We started with a conservative threshold of 1.5 and tuned to a final threshold of 2 for GCE and EC2 and 1.5 for Azure for both the memory-probing and -locking tests. Figure 7 shows the distribution of performance degradation under the memory-probing tests across Intel machines in EC2, GCE, and Azure. For GCE and EC2, a performance degradation threshold of 2 clearly separates co-resident from non-coresident instances. For all Intel machines we encountered, although we ran both memory-locking and -probing tests, memory-probing was sufficient to detect co-residency. For Azure, overall we observe lower performance degradation and the initial threshold of 1.5 was sufficient to detect co-location on Intel machines.
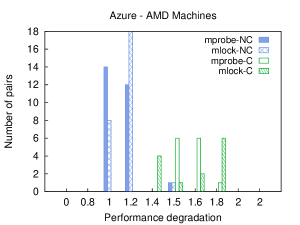
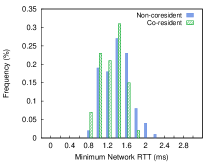
The picture for AMD machines in Azure differs significantly as shown in Figure 8. The distribution of performance degradation for both memory-locking and memory-probing shows that, unlike for other architectures, co-residency detection is highly sensitive to the choice of the threshold for AMD machines. This may be due to the more associative cache (48 ways vs. 20 for Intel), or different handling of locked instructions. For these machines, a threshold of 1.5 was high enough to have no false positives, which we verified by hand checking the instances using the two covert-channels and observed consistent performance degradation of at least 50%. We determine a pair of VMs as co-resident if the degradation in either of the tests is above this threshold. We did not detect any cross-architecture (false) co-residency detection in any of the runs.
Scaling co-residency detection tests.
Testing co-residency at scale is time-consuming and increases quadratically with the number of instances: checking 40 VM instances, involves 780 pair-wise tests. Even if each run of the entire co-residency test suite takes only 10 seconds, a naïve sequential execution of the tests on all the pairs will take 2 hours. Parallel co-residency checks can speed checking, but concurrent tests may interfere with each other.
To parallelize the test, we partition the set of all VM pairs () into sets of pairs with no VMs twice; we run one of these sets at a time and record which pairs detected possible co-residence. After running all sets, we have a set of candidate co-resident pairs, which we test sequentially. Parallelizing co-residency tests significantly decreased the time taken to test all co-residency pairs. For instance, the parallel version of the test on one of the cloud providers took 2.4 seconds per pair whereas the serial version took almost 46.3 seconds per pair (a speedup of 20x). While there are faster ways to parallelize co-residency detection, we chose this approach for simplicity.
Veracity of our tests.
Notice that a performance degradation of 1.5x, 2x and 4x corresponds to 50%, 100% and 300% performance degradation. Such high performance degradation (even 50%) is clear enough signal to declare co-residency due to resource sharing. Furthermore, we hand checked by running the two tests in isolation on the detected instance-pairs for a significant fraction of the runs for all clouds and observed a consistent covert-channel signal. Thus our methodology did not detect any false positives, which are more detrimental to our study than false negatives. Although co-residency here implies sharing of memory channel, which may not always mean sharing of cores or other per-core hardware resources.
4.3 Co-residency Detection on Uncooperative Victims
Until now, we described a method to detect co-residency with a cooperative victim. In this section, we look at a more realistic setting where an adversary wishes to detect co-residency with a victim VM with accesses limited to only public interfaces like HTTP or a key-value (KV) store’s put-get interface. We show that the basic cooperative co-residency detection can also be employed to detect co-residency with an uncooperative victim in the wild.
Attack setting.
Unlike previous attack scenarios, we assume the attacker has no access to the victim VMs or its application other than what is permitted to any user on the Internet. That is, the victim application exposes a well-known public interface (e.g., HTTP, FTP, KV-store protocol) that allows incoming requests, which is also the only access point for the attacker to the victim. The front end of this victim application can range from caching or data storage services (e.g., memcached, cassandra) to generic webservers. We also assume that there may be multiple instances of this front-end service running behind a load balancer. Under this scenario, the attacker wishes to detect co-location with one or more of the front-facing victim VMs.
Co-residency test.
We adapt the memory tests used in previous section by running the memory-locking sender in the attacker instance. For a receiver, we use the public interface exposed by the victim by generating a set of requests that potentially makes the victim VMs hit the memory bus. This can be achieved by looping through a large number of requests of sizes approximately equal or greater than the size of the LLC. This creates a performance side-channel that leaks co-residency information. This receiver runs in an independent VM under the adversary’s control, which we call the co-residency detector.
Experiment setup.
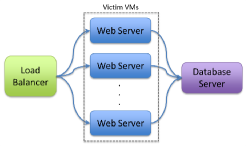
To evaluate the efficacy of this method, we used the Olio multi-tier web application [13] that is designed to mimic a social-networking application. We used an instance of this workload from CloudSuite [23]. Although Olio supports several tiers (e.g., memcached to cache results of database queries), we configured it with two tiers as shown in Figure 9, with each webserver and the database server running in a separate VM of type t2.small on Amazon EC2. Multiple of these webserver VMs are configured behind a HAProxy-based load balancer [9] running in an m3.medium instance (for better networking performance). The load balancer follows the standard configuration of using round-robin load balancing algorithm with sticky client sessions using cookies. We believe such a victim web application and its configuration is a reasonable generalization of real world applications running in the cloud.
For the attacker, we use an off-the-shelf HTTP performance measurement utility called HTTPerf [29] as the receiver in the co-residency detection test. This receiver is run inside a t2.micro instance (for free of charge). We used a set of 212 requests that included web pages and web objects (images, PDF files). We gathered these requests using the access log of manual navigation around the web application from a web browser.
Evaluation methodology.
We start with a known co-resident VM pair using the cooperative co-residency detection method. We configure one of the VMs as a victim webserver VM and launch four more VMs: two webservers, one database server and a load balancer, all of which are not co-resident with the attacker VM.
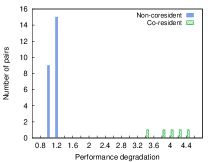
Co-residency detection starts by measuring the average request latency at the receiver inside the co-residency detector for the baseline (with idle attacker) and contended case with the attacker running the memory-locking sender. A significant performance degradation between the baseline and the contended case across multiple samples reveal co-residency of one of the victim VMs with the attacker VM. On Amazon EC2, with the above setup we observed an average request latency of ms in the baseline case and a ms in the memory-locked case, i.e., a performance degradation of .
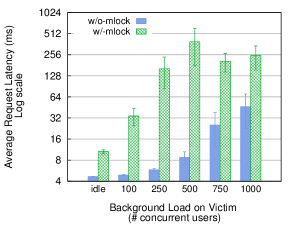
Background noise.
The above test was performed when the victim web application was idle. In reality, any victim in the cloud might experience constant or varying background load on the system. False positives or negatives may occur when there is spike in load on the victim servers. In such case, we use the same solution as in Section 4.2 — alternating between measuring the idle and the contended case.
In order to gauge the efficacy of the test under constant background load, we repeated the above experiment with varying load on the victim. The result of this experiment is summarized in Figure 10. Counterintuitively, we found that a constant load on the background server exacerbates the performance degradation gap, hence resulting in a clearer signal of co-residency. This is because running memory-locking on the co-resident attacker increases the service time of all requests as majority of the requests rely on memory bandwidth. This increases the queuing delay in the system and in turn increasing the overall request latency. Interestingly, this aforementioned performance gap stops widening at higher loads of 750 to 1000 concurrent users as the system hits a bottleneck (in our case a network bottleneck at the load balancer) even without running the memory-locking sender. Thus, detecting co-residency with a victim VM that is part of a highly loaded and bottlenecked application would be hard using this test.
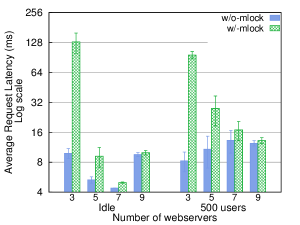
We also experimented with increasing the number of victim webservers behind the load balancer beyond 3 (Figure 11). As expected, the co-residency signal grew weaker with increasing victims, and at 9 webservers, the performance degradation was too low to be useful for detecting co-residency.
5 Placement Vulnerability Study
In this section, we evaluate three public clouds, Amazon EC2, Google Compute Engine and Microsoft Azure, for placement vulnerabilities and answer the following questions: (i) what are all the strategies that an adversary can employ to increase the chance of co-location with one or more victim VMs? (ii) what are the chances of success and cost of each strategy? and (iii) how do these strategies compare against the reference placement policy introduced in Section 3?
5.1 Experimental Methodology
Before presenting the results, we first describe the experiment setting and methodology that we employed for this placement vulnerability study.
Experiment settings.
Recall VM placement depends on several placement variables (shown in Figure 1). We assigned reasonable values to these placement variables and enumerated through several launch strategies. A run corresponds to one launch strategy and involves launching multiple VMs from two distinct accounts (i.e., subscriptions in Azure and projects in GCE) and checking for co-residency between all pairs of VMs launched. One account was designated as a proxy for the victim and the other for the adversary. We denote a run configuration by , where is the number of victim instances and is the number of attacker instances launched in that run. We varied and for all , and restricted them to the inequality, , as it increases the likelihood of achieving co-residency.
Other placement variables that are part of the run configuration include: victim launch time (including time of the day, day of the week), delay between victim and attacker VM launches, victim and attacker instance types and data center location or region where the VMs are launched. We repeat each run multiple times across all three cloud providers. The repetition of experiments is especially required to control the effect of certain environment variables like time of day. We repeat experiments for each run configuration over various times of the day and days of the week. We fix the instance type of VMs to small instances (t2.small on EC2, g1.small on GCE and small or Standard-A1 on Azure) and data center regions to us-east for EC2, us-central1-a for GCE and east-us for Azure, unless otherwise noted. All experiments were conducted over 3 months between December 2014 to February 2015.
We used a single, local Intel Core i7-2600 machine with 8 SMT cores to launch VM instances, log instance information and run the co-residency detection test suite.
| Delay | Config. | Mean | S.D. | Min | Median | Max |
| (hr.) | ||||||
| 0 | 10x10 | 0.11 | 0.33 | 0 | 0 | 1 |
| 0 | 10x20 | 0.2 | 0.42 | 0 | 0 | 1 |
| 0 | 10x30 | 0.5 | 0.71 | 0 | 0 | 2 |
| 0 | 20x20 | 0.43 | 0.65 | 0 | 0 | 2 |
| 0 | 20x30 | 1.67 | 1.22 | 0 | 2 | 4 |
| 0 | 30x30 | 1.6 | 1.65 | 0 | 1 | 5 |
| 1 | 10x10 | 0.25 | 0.46 | 0 | 0 | 1 |
| 1 | 10x20 | 0.33 | 0.5 | 0 | 0 | 1 |
| 1 | 10x30 | 1.6 | 1.07 | 0 | 2 | 3 |
| 1 | 20x20 | 1.27 | 1.22 | 0 | 1 | 4 |
| 1 | 20x30 | 2.44 | 1.51 | 0 | 3 | 4 |
| 1 | 30x30 | 3 | 1.12 | 1 | 3 | 5 |
| Delay | Config. | Mean | S.D. | Min | Median | Max |
| (hr.) | ||||||
| 0 | 10x10 | 2 | 1.73 | 1 | 1 | 4 |
| 0 | 10x20 | 2.67 | 1.53 | 1 | 3 | 4 |
| 0 | 10x30 | 3 | 2.65 | 1 | 2 | 6 |
| 0 | 20x20 | 3.67 | 1.53 | 2 | 4 | 5 |
| 0 | 20x30 | 2.75 | 2.06 | 0 | 3 | 5 |
| 0 | 30x30 | 12.33 | 2.08 | 10 | 13 | 14 |
| 1 | 10x10 | 2 | 1 | 1 | 2 | 3 |
| 1 | 10x20 | 2 | 1 | 1 | 2 | 3 |
| 1 | 10x30 | 2 | 1.73 | 1 | 1 | 4 |
| 1 | 20x20 | 4.67 | 5.51 | 1 | 2 | 11 |
| 1 | 20x30 | 3.75 | 2.5 | 1 | 3.5 | 7 |
| 1 | 30x30 | 10 | 3 | 7 | 10 | 13 |
| Delay | Config. | Mean | S.D. | Min | Median | Max |
|---|---|---|---|---|---|---|
| (hr.) | ||||||
| 0 | 0 | 0 | 0 | 0 | 0 | |
| 1 | 10x10 | 0.44 | 0.73 | 0 | 0 | 2 |
| 1 | 10x20 | 1.11 | 1.17 | 0 | 1 | 3 |
| 1 | 10x30 | 1.4 | 1.43 | 0 | 1.5 | 4 |
| 1 | 20x20 | 3.57 | 2.59 | 0 | 3.5 | 9 |
| 1 | 20x30 | 3.78 | 1.79 | 1 | 4 | 7 |
| 1 | 30x30 | 3.89 | 2.09 | 2 | 3 | 9 |
| Delay | Config. | Mean | S.D. | Min | Median | Max |
| (hr.) | ||||||
| 0 | 0 | 0 | 0 | 0 | 0 | |
| 0 | 20x20 | 10.33 | 8.96 | 0 | 15 | 16 |
| 1 | 10x10 | 1.67 | 0.58 | 1 | 2 | 2 |
| 1 | 10x20 | 2.33 | 0.58 | 2 | 2 | 3 |
| 1 | 10x30 | 5.33 | 2.52 | 3 | 5 | 8 |
| 1 | 20x20 | 8.33 | 4.51 | 4 | 8 | 13 |
| 1 | 20x30 | 5.5 | 3.87 | 2 | 4.5 | 11 |
| 1 | 30x30 | 8.33 | 6.66 | 4 | 5 | 16 |
| Delay (hr.) | Config. | Mean | S.D. | Min | Median | Max |
|---|---|---|---|---|---|---|
| 0 | 10x10 | 15.22 | 19.51 | 0 | 14 | 64 |
| 0 | 10x20 | 3.78 | 4.71 | 0 | 3 | 14 |
| 0 | 10x30 | 4.25 | 6.41 | 0 | 2.5 | 19 |
| 0 | 20x20 | 9.67 | 8.43 | 0 | 8 | 27 |
| 0 | 20x30 | 2.38 | 1.51 | 1 | 2 | 5 |
| 0 | 30x30 | 24.57 | 36.54 | 1 | 6 | 99 |
| 1 | 10x10 | 2.78 | 3.87 | 0 | 1 | 12 |
| 1 | 10x20 | 0.78 | 1.2 | 0 | 0 | 3 |
| 1 | 10x30 | 0.75 | 1.39 | 0 | 0 | 3 |
| 1 | 20x20 | 0.67 | 1.66 | 0 | 0 | 5 |
| 1 | 20x30 | 0.86 | 0.9 | 0 | 1 | 2 |
| 1 | 30x30 | 4.71 | 9.89 | 0 | 1 | 27 |
Implementation and the Cloud APIs.
In order to automate our experiments, we used Python and the libcloud†††We used libcloud version 0.15.1 for EC2, and a modified version of 0.16.0 for GCE to support the use of multiple accounts in GCE. library [3] to interface with EC2 and GCE. Unfortunately, libcloud did not support Azure. The only Azure cloud API on Linux platform was a node.js library and a cross-platform command-line interface (CLI). We built a wrapper around the CLI. There were no significant differences across different cloud APIs except that Azure did not have any explicit interface to launch multiple VMs simultaneously.
As mentioned in the experiment settings, we experimented with various delays between the victim and attacker VM launches (0, 1, 2, 4 …hours). To save money, we reused the same set of victim instances for each of the longer runs. That is, for the run configuration of 10x10 with 0, 1, 2, and 4 hours of delay between victim and attacker VM launches, we launched the victim VMs only once at the start of the experiment. After running co-residency tests on the first set of VM pairs, we terminated all the attacker instances and relaunched attacker VM instances after appropriate delays (say 1 hour) and rerun the tests with the same set of victim VMs. We repeat this until we experiment with all delays for this configuration. We call this methodology the leap-frog method. It is also important to note that zero delay here means parallel launch of VMs from our test machine (and not sequential launch of VMs from one account after another), unless otherwise noted.
In the sections below, we take a closer look at the effect of varying one placement variable while keeping other variables fixed across all the cloud providers. In each case, we use three metrics to measure the degree of co-residency: chances of getting at least one co-resident instance across a number of runs (or success rate), average number of co-resident instances over multiple runs and average coverage (i.e., fraction of victim VMs with which attacker VMs were co-resident). Although these experiments were done with victim VMs under our control, the results can be extrapolated to guide an attacker’s launch strategy for an uncooperative victim. We also discuss a set of such strategic questions that the results help answer. At the end of this section, we summarize and calculate the cost of several interesting launch strategies and evaluate the public clouds against our reference placement policy.
5.2 Effect of Number of Instances
In this section, we observe the placement behavior while varying the number of victim and attacker instances. Intuitively, we expect the chances of co-residency to increase with the number of attacker and victim instances.
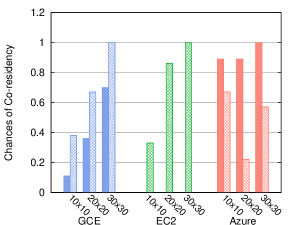
Varying number of attacker instances.
Keeping all the placement variables constant including the number of victim instances, we measure the chance of co-residency over multiple runs. The result of this experiment helps to answer the question: How many VMs should an adversary launch to increase the chance of co-residency?
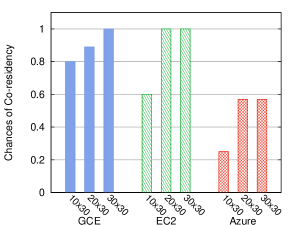
As is shown in Figure 15, the placement behavior changes across different cloud providers. For GCE and EC2, we observe that higher the number of attacker instances relative to the victim instances, the higher the chance of co-residency is. Figure 12(a) and 13(a) show the distribution of number of co-resident VM pairs on GCE and EC2, respectively. The number of co-resident VM pairs also increases with the number of attacker instances, implying that the coverage of an attack could be increased with larger fraction of attacker instances than the target VM instances if the launch times are coordinated.
Contrary to our expectations, the placement behavior observed on Azure is the inverse. The chances of co-residency with 10 attacker instances are almost twice as high as with 30 attacker instances. This is also reflected in the distribution of number of co-residency VM pairs (shown in Figure 14). Further investigation revealed a correlation between the number of victim and attacker instances launched and the chance of co-residency. That is, for the run configuration of 10x10, 20x20 and 30x30, where number of victim and attacker instances are the same, and with 0 delay, the chance of co-residency were equally high for all these configurations (between 0.9 to 1). This suggests a possible placement policy that collates VM launch requests together based on their request size and places them on the same group of machines.
Varying number of victim instances.
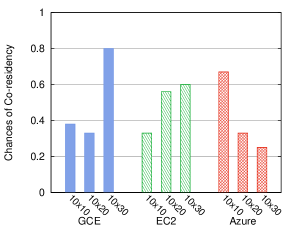
Similarly, we also varied the number of victim instances by keeping the number of attacker instances and other placement variables constant (results shown in Figure 16). We expect the chance of co-residency to increase with the number of victims targeted. Hence, the results presented here help an adversary answer the question: What are the chances of co-residency with varying sizes of target victims?
As expected, we see an increase in the chances of co-residency with increasing number of victim VMs across all cloud providers. We see that the absolute value of the chance of co-residency is lower for Azure than other clouds. This may be the result of significant additional delay between victim and attacker launch times in Azure as a result of our methodology (more on this later).
5.3 Effect of Instance Launch Time
In this section, we answer two questions that aid an adversary to design better launch strategies: How quickly should an attacker launch VMs after the victim VMs are launched? Is there any increase in chance associated with the time of day of the launch?
Varying delay between attacker and victim launches.
The result of varying the delay between 0 (i.e., parallel launch) and 1 hour delay is shown in Figure 17. We can make two immediate observations from this result.
| Delay | Mean | S.D. | Min | Median | Max | Success |
| rate | ||||||
| 0+ | 0.6 | 1.07 | 0 | 0 | 3 | 0.30 |
| 5 min | 1.38 | 0.92 | 0 | 1 | 3 | 0.88 |
| 1 hr | 3.57 | 2.59 | 0 | 3.5 | 9 | 0.86 |
The first observation reveals a significant artifact of EC2’s placement policy: VMs launched within a short time window are never co-resident on the same machine. This observation helps an adversary to avoid such a strategy. We further investigated placement behaviors on EC2 with shorter non-zero delays in order to find the duration of this time window in which there are zero co-residency (results shown in Figure 18). We found that this time window is very short and that even a sequential launch of instances (denoted by 0+) could result in co-residency.
The second observation shows that non-zero delay on GCE and zero delay on Azure increases the chance of co-residency and hence directly benefits an attacker. It should be noted that on Azure, the launch delays between victim and attacker instances were longer than 1 hour due to our leap-frog experimental methodology; the actual delays between the VM launches were, on average, 3 hours (with a maximum delay of 10 hours for few runs). This higher delay was more common in runs with larger number of instances as there were significantly more false positives, which required a separate sequential phase to resolve (see Section 4.2).
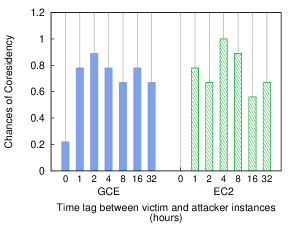
We also experimented with longer delays on EC2 and GCE to understand whether and how quickly the chance of co-residency drops with increasing delay (results shown in Figure 19). Contrary to our expectation, we did not find the chance of co-residency to drop to zero even for delays as high as 16 and 32 hours. We speculate that the reason for this observation could be that the system was under constant churn where some neighboring VMs on the victim’s machine were terminated. Note that our leap-frog methodology may, in theory, interfere with the VM placement. But it is noteworthy that we observed increased number of unique co-resident pairs with increasing delays, suggesting fresh co-residency with victim VMs over longer delays.
| Chances of Co-residency | |||
|---|---|---|---|
| Cloud | Morning | Afternoon | Night |
| 02:00 - 10:00 | 10:00 - 18:00 | 18:00 - 02:00 | |
| GCE | 0.68 | 0.61 | 0.78 |
| EC2 | 0.89 | 0.73 | 0.6 |
Effect of time of day.
Prior works have shown that churn or load is often correlated with the time of day [33]. Our simple reference placement policy does not have a notion of load and hence have no effect on time of day. In reality, with limited number of servers in datacenters and limited number of capacity per host, load on the system has direct effect on the placement behavior of any placement policy.
As expected, we observe small effect on VM placement based on the time of day when attacker instances are launched (results shown in Figure 20). Specifically, there is a slightly higher chance of co-residency if the attacker instances are launched in the early morning for EC2 and at night for GCE.
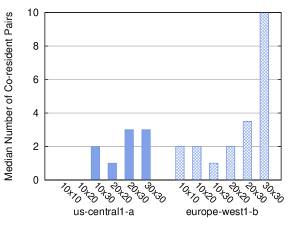
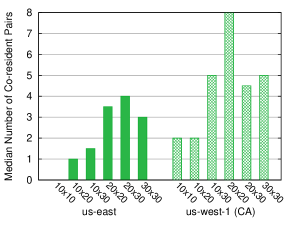
5.4 Effect of Data Center Location
All the above experiments were conducted on relatively popular regions in each cloud (especially true for EC2 [33]). In this section, we report the results on other smaller and less popular regions. As the regions are less popular and have relatively fewer machines, we expect higher co-residency rates and more co-resident instances. Figure 21 shows the median number of co-resident VM pairs placed in these regions alongside the results for popular regions. The distribution of number of co-resident instances is shown in Figure 12(b) and 13(b).
The main observation from these experiments is that there is a higher chance of co-residency in these smaller regions than the larger, more popular regions. Note that we placed at least one co-resident pair in all the runs in these regions. Also the higher number of co-resident pairs also suggests a larger coverage over victim VMs in these smaller regions.
One anomaly that we found during two 20x20 runs on EC2 between and of January 2015, when we observed an unusually large number of co-resident instances (including three VMs from the same account). We believe this anomaly may be a result of an internal management incident in the Amazon EC2 us-west-1 region.
5.5 Other Observations
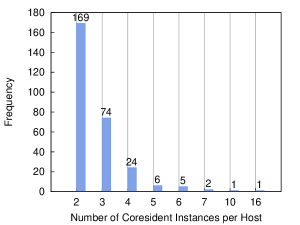
We report several other interesting observations in this section. First, we found more than two VMs can be co-resident on the same host on both Azure and GCE, but not on EC2. Figure 22 shows the distribution of number of co-resident instances per host. Particularly, in one of the runs, we placed 16 VMs on a single host.
Another interesting observation is related to co-resident instances from the same account. We term them as self-co-resident instances. We observed many self-co-resident pairs on GCE and Azure (not shown). On the other hand, we never noticed any self co-resident pair on EC2 except for the anomaly in us-west-1. Although we did not notice any effect on the actual chance of co-residence, we believe such placement behaviors (or the lack of) may affect VM placement.
We also experimented with medium instances and successfully placed few co-located VMs on both EC2 and GCE by employing similar successful strategies learned with small instances.
5.6 Cost of Launch Strategies
| Run | Average Cost ($) | Maximum Cost ($) | ||||
| config. | GCE | EC2 | Azure | GCE | EC2 | Azure |
| 10x10 | 0.137 | 0.260 | 0.494 | 0.140 | 0.260 | 0.819 |
| 10x20 | 0.370 | 0.520 | 1.171 | 0.412 | 0.520 | 1.358 |
| 10x30 | 1.049 | 0.780 | 2.754 | 1.088 | 1.560 | 3.257 |
| 20x20 | 0.770 | 0.520 | 2.235 | 1.595 | 1.040 | 3.255 |
| 20x30 | 1.482 | 1.560 | 3.792 | 1.581 | 1.560 | 4.420 |
| 30x30 | 1.866 | 1.560 | 5.304 | 2.433 | 1.560 | 7.965 |
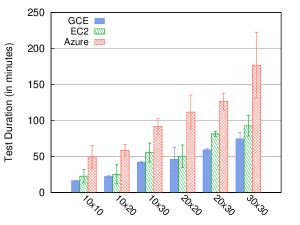
Recall that the cost of a launch strategy from Section 3, . In order to calculate this cost, we need which is the time taken to detect co-location with attackers and victims. Figure 23 shows the average time taken to complete launching attacker instances and complete co-residency detection for each run configuration. Here the measured co-residency detection is the parallelized version discussed in Section 4.2 and also includes time taken to detect co-residency within each tenant account. Hence, for these reasons the time to detect co-location is an upper bound for a realistic and highly optimized co-residency detection mechanism.
We calculate the cost of executing each launch strategy under the three public clouds. The result is summarized in Figure 24. Note that we only consider the cost incurred by the compute instances because the cost for other resources such as network and storage, was insignificant. Also note that EC2 bills every hour even if an instance runs less than an hour [17], whereas GCE and Azure charge per minute of instance activity. This difference is considered in our cost calculation. Overall, the maximum cost we incurred was about $8 for running 30 VMs for 4 hours 25 minutes on Azure and a minimum of 14 cents on GCE for running 10 VMs for 17 minutes. We incurred the highest cost for all the launch strategies in Azure because of overall higher cost per hour and partly due to longer tests due to our co-residency detection methodology.
5.7 Summary of Placement Vulnerabilities
In this section, we return to the secure reference placement policy introduced in Section 3 and use it to identify placement vulnerabilities across all the three clouds. Recall that the probability of at least one pair of co-residency under this random placement policy is given by , where is the random variable denoting the number of co-location observed when placing attacker VMs among total machines where machines are already picked for the victim VMs. First, we evaluate this probability for various run configurations that we experimented with in the public clouds. The probabilities are shown in Figure 25.
| Run Config. | 10x10 | 10x20 | 10x30 | 20x20 | 20x30 | 30x30 |
|---|---|---|---|---|---|---|
| 0.10 | 0.18 | 0.26 | 0.33 | 0.45 | 0.60 |
| Strategy | & | Cost benefit ($) | Normalized | |
|---|---|---|---|---|
| success | ||||
| S1 & S2 | 10 | 688 | 113.87 | 10 |
| S3 | 30 | 227 | 32.75 | 1.67 |
| S4(i) | 20 | 105 | 4.36 | 2.67 |
| S4(ii) | 20 | 342 | 53.76 | 3.03 |
| S5 | 20 | 110 | 4.83 | 1.48 |
Recall that a launch strategy in a cloud implies a placement vulnerability in that cloud’s placement policy if its normalized success rate is greater than 1. The normalized success rate of the strategy is the ratio of the chance of co-location under that launch strategy to the probability of co-location in the reference policy (). Below is a list of selected launch strategies that escalate to placement vulnerabilities using our reference policy with their normalized success rate in parenthesis.
-
(S1)
In Azure, launch ten attacker VMs closely after the victim VMs are launched (1.0/0.10).
-
(S2)
In EC2 and GCE, if there are known victims in any of the smaller datacenters, launch at least ten attacker VMs with a non-zero delay (1.0/0.10).
-
(S3)
In all three clouds, launch 30 attacker instances, either with no delay (Azure) or one hour delay (EC2, GCE) from victim launch, to get co-located with one of the 30 victim instances (1.00/0.60).
-
(S4)
(i) In Amazon EC2, launch 20 attacker VMs with a delay of 5 minutes or more after the victims are launched (0.88/0.33). (ii) The optimal delay between victim and attacker VM launches is around 4 hours for a 20x20 run (1.00/0.33).
-
(S5)
In Amazon EC2, launch the attacker VMs with 1 hour after the victim VMs are launched where the time of day falls in the early morning, i.e., 02:00 to 10:00hrs PST (0.89/0.60).
Cost benefit.
Next, we quantify the cost benefit of each of these strategies over the reference policy. As the success rate of any launch strategy on a vulnerable placement policy is greater than what is possible in the reference policy, we need more attacker instances in the reference policy to achieve the same success rate. We calculate this number of attacker instances using: , where, is the success rate of a strategy with run configuration of . The result of this calculation is presented in Figure 26. The result shows that the best strategy, S1 and S2, on all three cloud providers is $114 cheaper than what is possible in the reference policy.
It is also evident that these metrics enable evaluating and comparing various launch strategies and their efficacy on various placement policies both on robust placements and attack cost. For example, note that although the normalized success rate of S3 is lower than S4, it has a higher cost benefit for the attacker.
5.8 Limitations
Although we exhaustively experimented with a variety of placement variables, the results have limitations. One major limitation of this study is the number of placement variables and the set of values for the variables that we used to experiment. For example, we limited our experiments with only one instance type, one availability zone per region and used only one account for the victim VMs. Although different instance types may exhibit different placement behavior, the presented results hold strong for the chosen instance type. The only caveat that may affect the results is if the placement policy uses account ID for VM placement decisions. Since, we experimented with only one victim account (separate from the designated attacker account) across all providers, these results, in the worst case, may have captured the placement behavior of an unlucky victim account that was subject to similar placement decisions (and hence co-resident) as that of the VMs from the designated attacker account.
Even though we ran at least 190 runs per cloud provider over a period of 3 months to increase statistical significant of our results, we were still limited to at most 9 runs per run configuration (with 3 runs per time of day). These limitations have only minor bearing on the results presented, if any, and the reported results are significant and impactful for cloud computing security research.
6 Related Work
VM placement vulnerability studies.
Ristenpart et al. [30] first studied the placement vulnerability in public clouds, which showed that a malicious cloud tenant could place one of his VMs on the same machine as a target VM with high probability. Placement vulnerabilities exploited in their study include publicly available mapping of VM’s public/internal IP addresses, disclosure of Dom0 IP addresses, and a shortcut communication path between co-resident VMs. Their study was followed by Xu et al. [35] and further extended by Herzberg et al. [26]. However, the results of these studies have been outdated by the recent development of cloud technologies, which is the main motivation of our work.
Concurrent with our work, Xu et al. [36] conducted a systematic measurement study of co-resident threats in Amazon EC2. Their focus, however, is in-depth evaluation of co-residency detection using network route traces and quantification of co-residence threats on older generation instances with EC2’s classic networking (prior to Amazon VPC). In contrast, we study placement vulnerabilities in the context of VPC on EC2, as well as on Azure and GCE. The two studies are mostly complementary and strengthen the arguments made by each other.
Co-residency detection techniques.
Techniques for co-residency detection have been studied in various contexts. We categorize these techniques into one of the two classes: side-channel approaches to detecting co-residency with uncooperative VMs and covert-channel approaches to detecting co-residency with cooperative VMs.
Side-channels allow one party to exfiltrate secret information from another; therefore these approaches may be adapted in practical placement attack scenarios with targets not controlled by the attackers. Network round-trip timing side-channel was used by Ristenpart et al. [30] to detect co-residency. Zhang et al. [38] developed a system called HomeAlone to enable VMs to detect third-party VMs using timing side-channels in the last level caches. Bates et al. [20] proposed a side-channel for co-residency detection by causing network traffic congestion in the host NICs from attacker-controlled VMs; the interference of target VM’s performance, if the two VMs are co-resident, should be detectable by remote clients. Kohno et al. [28] explored techniques to fingerprint remote machines using timestamps in TCP or ICMP based network probes, although their approach was not designed for co-residency detection. However, none of these approaches works effectively in modern cloud infrastructures.
Covert-channels on shared hardware components can be used for co-residency detection when both VMs under test are cooperative. Coarse-grained covert-channels in CPU caches and hard disk drives were used in Ristenpart et al. [30] for co-residency confirmation. Xu et al. [35] established covert-channels in shared last level caches between two colluding VMs in the public clouds. Wu el al. [34] exploited memory bus as a covert-channel on modern x86 processors, in which the sender issues atomic operations on memory blocks spanning multiple cache lines to cause memory bus locking or similar effects on recent processors. However, covert-channels proposed in the latter two studies were not designed for co-residency detection, while those developed in our work are tuned for this purpose.
7 Conclusion and Future Work
Multi-tenancy in public clouds enable co-residency attacks. In this paper, we revisited the problem of placement — can an attacker achieve co-location? — in modern public clouds. We find that while past techniques for verifying co-location no longer work, insufficient performance isolation in hardware still allows detection of co-location. Furthermore, we show that in the three popular cloud providers (EC2, GCE and Azure), achieving co-location is surprisingly simple and cheap. It is even simpler and costs nothing to achieve co-location in some PaaS clouds. Our results demonstrate that even though cloud providers have massive datacenters with numerous physical servers, the chances of co-location are far higher than expected. More work is needed to achieve a better balance of efficiency and security using smarter co-location-aware placement policies.
Acknowledgments
This work was funded by the National Science Foundation under grants CNS-1330308, CNS-1546033 and CNS-1065134. Swift has a significant financial interest in Microsoft Corp.
References
- [1] Amazon ec2 instance store. http://docs.aws.amazon.com/AWSEC2/latest/UserGuide/InstanceStorage.html.
- [2] Amazon elastic compute cloud. http://aws.amazon.com/ec2/.
- [3] Apache libcloud. http://libcloud.apache.org/.
- [4] Aws elastic beanstalk. http://aws.amazon.com/elasticbeanstalk/.
- [5] Aws innovation at scale, re:invent 2014, slide 9-10. http://www.slideshare.net/AmazonWebServices/spot301-aws-innovation-at-scale-aws-reinvent-2014.
- [6] Google compute engine. https://cloud.google.com/compute/.
- [7] Google compute engine – disks. https://cloud.google.com/compute/docs/disks/.
- [8] Google compute enginer autoscaler. http://cloud.google.com/compute/docs/autoscaler/.
- [9] Haproxy: The reliable, high performance tcp/http load balancer. http://www.haproxy.org/.
- [10] Heroku devcenter: Dynos and the dyno manager, ip addresses. https://devcenter.heroku.com/articles/dynos#ip-addresses.
- [11] Heroku PaaS system. https://www.heroku.com/.
- [12] Intel Ivy Bridge cache replacement policy. http://blog.stuffedcow.net/2013/01/ivb-cache-replacement/.
- [13] Olio workload. https://cwiki.apache.org/confluence/display/OLIO/The+Workload.
- [14] Rightscale. http://www.rightscale.com.
- [15] Virtual machine and cloud service sizes for azure. https://msdn.microsoft.com/en-us/library/azure/dn197896.aspx.
- [16] Windows azure. http://www.windowsazure.com/.
- [17] Amazon ec2 pricing, 2015. http://aws.amazon.com/ec2/pricing/.
- [18] Amazon Web Services. Extend your it infrastructure with amazon virtual private cloud. Technical report, Amazon, 2013.
- [19] Y. Azar, S. Kamara, I. Menache, M. Raykova, and B. Shepard. Co-location-resistant clouds. In In Proceedings of the ACM Workshop on Cloud Computing Security, pages 9–20, 2014.
- [20] A. Bates, B. Mood, J. Pletcher, H. Pruse, M. Valafar, and K. Butler. Detecting co-residency with active traffic analysis techniques. In Proceedings of the 2012 ACM Workshop on Cloud Computing Security Workshop, pages 1–12. ACM, 2012.
- [21] B. Beach. Virtual private cloud. In Pro Powershell for Amazon Web Services, pages 67–88. Springer, 2014.
- [22] B. Farley, A. Juels, V. Varadarajan, T. Ristenpart, K. D. Bowers, and M. M. Swift. More for your money: Exploiting performance heterogeneity in public clouds. In Proceedings of the Third ACM Symposium on Cloud Computing. ACM, 2012.
- [23] M. Ferdman, A. Adileh, O. Kocberber, S. Volos, M. Alisafaee, D. Jevdjic, C. Kaynak, A. D. Popescu, A. Ailamaki, and B. Falsafi. Clearing the clouds: a study of emerging scale-out workloads on modern hardware. In Proceedings of the seventeenth international conference on Architectural Support for Programming Languages and Operating Systems. ACM, 2012.
- [24] Y. Han, T. Alpcan, J. Chan, and C. Leckie. Security games for virtual machine allocation in cloud computing. In Decision and Game Theory for Security. Springer International Publishing, 2013.
- [25] Y. Han, J. Chan, T. Alpcan, and C. Leckie. Virtual machine allocation policies against co-resident attacks in cloud computing. In IEEE International Conference on Communications,, 2014.
- [26] A. Herzberg, H. Shulman, J. Ullrich, and E. Weippl. Cloudoscopy: Services discovery and topology mapping. In 2013 ACM Workshop on Cloud Computing Security Workshop, pages 113–122, 2013.
- [27] D. Kanter. L3 cache and ring interconnect. http://www.realworldtech.com/sandy-bridge/8/.
- [28] T. Kohno, A. Broido, and K. Claffy. Remote physical device fingerprinting. In Security and Privacy, 2005 IEEE Symposium on, pages 211–225. IEEE, 2005.
- [29] D. Mosberger and T. Jin. httperf—a tool for measuring web server performance. ACM SIGMETRICS Performance Evaluation Review, 26(3):31–37, 1998.
- [30] T. Ristenpart, E. Tromer, H. Shacham, and S. Savage. Hey, you, get off of my cloud: Exploring information leakage in third-party compute clouds. In Proceedings of the 16th ACM conference on Computer and communications security, pages 199–212. ACM, 2009.
- [31] V. Varadarajan, T. Kooburat, B. Farley, T. Ristenpart, and M. M. Swift. Resource-freeing attacks: Improve your cloud performance (at your neighbor’s expense). In Proceedings of the 2012 ACM conference on Computer and communications security, pages 281–292. ACM, 2012.
- [32] V. Varadarajan, Y. Zhang, T. Ristenpart, and M. Swift. A placement vulnerability study in multi-tenant public clouds. In 24th USENIX Security Symposium. USENIX Association, 2015.
- [33] L. Wang, A. Nappa, J. Caballero, T. Ristenpart, and A. Akella. Whowas: A platform for measuring web deployments on IaaS clouds. In Proceedings of the 2014 Conference on Internet Measurement Conference, pages 101–114. ACM, 2014.
- [34] Z. Wu, Z. Xu, and H. Wang. Whispers in the hyper-space: High-speed covert channel attacks in the cloud. In USENIX Security symposium, pages 159–173, 2012.
- [35] Y. Xu, M. Bailey, F. Jahanian, K. Joshi, M. Hiltunen, and R. Schlichting. An exploration of L2 cache covert channels in virtualized environments. In Proceedings of the 3rd ACM workshop on Cloud computing security workshop, pages 29–40. ACM, 2011.
- [36] Z. Xu, H. Wang, and Z. Wu. A measurement study on co-residence threat inside the cloud. In USENIX Security Symposium, 2015.
- [37] Y. Yarom and K. Falkner. Flush+reload: A high resolution, low noise, L3 cache side-channel attack. In 23rd USENIX Security Symposium, pages 719–732. USENIX Association, 2014.
- [38] Y. Zhang, A. Juels, A. Oprea, and M. K. Reiter. Homealone: Co-residency detection in the cloud via side-channel analysis. In Proceedings of the 2011 IEEE Symposium on Security and Privacy, pages 313–328. IEEE Computer Society, 2011.
- [39] Y. Zhang, A. Juels, M. K. Reiter, and T. Ristenpart. Cross-VM side channels and their use to extract private keys. In Proceedings of the 2012 ACM conference on Computer and communications security, pages 305–316. ACM, 2012.
- [40] Y. Zhang, A. Juels, M. K. Reiter, and T. Ristenpart. Cross-tenant side-channel attacks in PaaS clouds. In Proceedings of the 2014 ACM SIGSAC Conference on Computer and Communications Security, pages 990–1003. ACM, 2014.
- [41] F. Zhou, M. Goel, P. Desnoyers, and R. Sundaram. Scheduler vulnerabilities and attacks in cloud computing. CoRR, abs/1103.0759, 2011.