Institut für Physik, Humboldt-Universität zu Berlin, Newtonstr. 15, 12489 Berlin, Germany
\alsoaffiliationInstitut für Physik, Humboldt-Universität zu Berlin, Newtonstr. 15, 12489 Berlin, Germany
Charité - Universitätsmedizin Berlin]Medizinische Klinik für Nephrologie, Charité , Hindenburgdamm 30, Charité -Campus Benjamin Franklin, 12203 Berlin
Charité - Universitätsmedizin Berlin]Medizinische Klinik für Nephrologie, Charité , Hindenburgdamm 30, Charité -Campus Benjamin Franklin, 12203 Berlin
RWTH Aachen]Institute for Molecular Cardiovascular Research IMCAR, RWTH Aachen, Pauvelsstr. 30, 52074 Aachen
\alsoaffiliationInstitut für Physik, Humboldt-Universität zu Berlin, Newtonstr. 15, 12489 Berlin, Germany
\alsoaffiliationInstitut für Physik, Humboldt-Universität zu Berlin, Newtonstr. 15, 12489 Berlin, Germany
{tocentry}
![[Uncaptioned image]](/html/1507.02938/assets/x1.png)
Interaction of Human Serum Albumin with short Polyelectrolytes: A study by Calorimetry and Computer Simulation
keywords:
Human Serum Albumin, Polyelectrolyte, ITC, etc.We present a comprehensive study of the interaction of human serum albumin (HSA) with poly(acrylic acid) (PAA; number average degree of polymerization: 25) in aqueous solution. The interaction of HSA with PAA is studied in dilute solution as the function of the concentration of added salt (20 - 100 mM) and temperature (25 - 37∘C). Isothermal titration calorimetry (ITC) is used to analyze the interaction and to determine the binding constant and related thermodynamic data. It is found that only one PAA chain is bound per HSA molecule. The free energy of binding increases with temperature significantly. decreases with increasing salt concentration and is dominated by entropic contributions due to the release of bound counterions. Coarse-grained Langevin computer simulations treating the counterions in an explicit manner are used study the process of binding in detail. These simulations demonstrate that the PAA chains are bound in the Sudlow II site of the HSA. Moreover, is calculated from the simulations and found to be in very good agreement with the measured data. The simulations demonstrate clearly that the driving force of binding is the release of counterions in full agreement with the ITC-data.
1 Introduction
Human Serum Albumin (HSA) is an important transport protein that interacts with substrates as e.g. fatty acids 1, 2 and pharmaceuticals in a specific manner. 3 Also, transport by HSA plays an important role for renal clearance and the interaction of HSA with typical uremic toxins 4 as e.g. phenylacetic acid, indoxyl sulfate, and p-cresyl sulfate needs to be understood in detail. 5 Uremic toxins play an essential role in the excessive cardiovascular mortality and all cause mortality in patients with end stage renal disease. Elimination of these substances is essential to reduce the high cardiovascular disease risk. 6, 7 The obvious biological importance of this transport has led to a great number of studies of the interaction of HSA with various substrates, most notably by crystallography, 8, 9 electron paramagnetic resonance spectroscopy, 10 and isothermal titration calorimetry (ITC). 11, 12 Thus, it is well established that the interaction of various substrates with HSA takes place mainly on the Sudlow I and the Sudlow II site. 13 ITC has been used to elucidate the thermodynamics of this interaction and by this the number of substrates adsorbed onto the surface of the protein. 14, 15, 11, 16, 17
Charge-charge interaction plays an essential role in the process of adsorption 18, 19, 20 and a number of ITC-studies explore the dependence of the adsorption constant on ionic strength. 21, 22, 23, 24 Recently, Jankowski and coworkers 25, 26 have demonstrated that raising the ionic strength in the infusion fluid leads to an improved clearance of protein-bound toxins (PBT). Thus, raising the concentration of NaCl to 600 mM led to a significantly better removal of of uremic toxins as e.g. phenylacetic acid. This result points clearly to the central importance of Coulombic interactions for the binding strength of such toxins to HSA and to proteins in general. Charged toxins as phenylacetic acid are difficult to remove by conventional dialysis and exploring their interaction is of central importance for devising improved techniques for dialysis. 25
Here we analyze the role of the interaction of charged substrates with HSA as the function of ionic strength and temperature. As a substrate we chose a short polyelectrolyte, namely poly(acrylic acid) (PAA) with 25 repeating units only. This substrate allows us to explore the Coulombic interaction of HSA with charged molecules in general. In addition to this, synergetic effects of adjacent carboxyl groups onto the binding constant can be elucidated. At the same time, PAA can be regarded as a model of charged toxins with molecular weight above 500 g/Mol. 5 ITC is used to obtain the binding constant and the number of bound PAA-molecules per protein and the temperature is varied between 25∘C and 37∘C. A first study of the interaction of polyelectrolytes with proteins by ITC has been presented by Schaaf et al. who demonstrated the general suitability of this method for the study of protein-polyelectrolyte interaction. 27
The interaction of long polyelectrolytes with proteins in aqueous solution has been the subject of longstanding research that has led to an enormous literature. 28, 18, 29 Proteins can form complex coacervates with polyelectrolyte of opposite charge in aqueous solution and the strength of interaction is mediated by the ionic strength in the system. 30 If the ionic strength of the system is low enough, interaction may take place even on the “wrong side“ of the isoelectric point, that is, proteins associate with polyelectrolytes of like charge. In many cases the formation of complexes between the protein and the polyelectrolyte is followed by precipitation and phase separation that may also lead to non-equilibrium states. 23, 28 Here we use a very short polyelectrolyte and low concentrations to avoid multiple interactions and phase separation. The results from the present experiments, however, may be directly utilized for a better understanding of complex coacervates.
Evidently, protein crystallography cannot be used to elucidate the structure of the complex between HSA and PAA. First of all, even in the bound state the non-bound segments of the polyelectrolyte will explore their conformational freedom in solution and the entropic contribution deriving therefrom will be an important part of the resulting change of free energy. Moreover, crystals of HSA will certainly not accommodate substrates of the size of a polyelectrolyte having 25 units. In order to make progress on a detailed structural investigation, we employ coarse-grained Langevin Dynamics (LD) computer simulations with an implicit solvent whereas the co- and counterions are treated in an explicit manner. 31, 32, 33 The protein is treated within the Cα - G model, that is, each amino acid of HSA is modelled by a single bead bearing a charge or not. The polyelectrolyte PAA is also treated as a coarse-grained charged polymer. The combination of these models allows us to elucidate the details of the complex of PAA and HSA in solution with full structural resolution. In addition to this, LD-simulations allow us to calculate the free enthalpy of binding and to compare these data with measured values. Thus, the combination of ITC with computer simulation can be used to elucidate structural and thermodynamic details that are available by no other method.
2 Experimental
Materials. Polyacrylic acid (PAA) with MW=1800 g/mol was purchased from Sigma-Aldrich (Schnelldorf, Germany) and used after several weeks of dialysis to match pH without changing ionic strength in the system. Human Serum Albumin (HSA) was also purchased from Sigma-Aldrich (lyophilized powder, Fatty acid free, Globulin free, ) with molecular weight calculated MW=66400 g/mol and its purity verified by sds-gelelectrophoresis. The buffer morpholin-N-oxide (MOPS) was purchased from Sigma-Aldrich and used as received.
2.1 Isothermal Titration Calorimetry
ITC experiments were performed using a VP-ITC instrument (Microcal, Northampton, MA). All samples were prepared in a pH 7.2 buffer solution using 10 mM MOPS and 10 mM, 40 mM, 60 mM and 90 mM NaCl to adjust ionic strength. All samples were dialyzed against buffer solution with according pH and degassed prior to experiment. For dialysis, the dialysis-system Float-a-Lyzer by Spectrum Labs with molecular weight cut-off (MWCO) 500-1000 Da for PAA and MWCO 20 kDa for HSA were used respectively. The samples were thermostatted and the instrument stabilized for 1 h to ensure thermal equilibrium and stability of the system. A total of 298 L PAA solution was titrated with 75 successive 4 L injections, stirring at 307 rpm and a time interval of 300-350 s between each injection into the cell containing 1.4 mL protein solution. The concentration of PAA and HSA were 1.3 g/L and 0.9 g/L respectively. We choose these low concentrations in order to study the interaction of single PAA-chains with only one HSA-molecule. Moreover, possible complications by coacervate formation are circumvented in this way. The experiments were performed at 25, 27.5, 30, 33, 37 oC and ionic strengths 20 mM, 50 mM, 70 mM and 100 mM.
As a first step of the ITC data analysis, the integration of the measured heat over time is carried out to obtain the incremental heat as a function of the molar ratio between polyelectrolyte and protein. For each experiment, the heat of dilution of PAA were measured separately by titrating the according polyelectrolyte into blank buffer solution and subtracted from adsorption heats. After correction, the resulting binding isotherm are fitted using a supplied module for Origin 7.0 (Microcal).
2.1.1 Data analysis.
For the analysis, we chose the single set of independent binding sites (SSIS) model to fit all data. 34 This model is based on the Langmuir equation, which assumes an equilibrium between the empty adsorption sites, the no. of proteins in solution and the occupied adsorption sites. This leads to the binding constant :
| (1) |
where denotes the fraction of sites occupied by the polyelectrolyte and the concentration of free polyelectrolyte. Since only the total concentration of PAA in the solution is known, is connected to the as follows:
| (2) |
where is the number of free binding sites and the total protein concentration in solution. Following these equations, the binding number , binding affinity and the overall enthalpy change measured can be obtained by fitting the isotherm. In the following, we will show that only one PAA is adsorbed onto HSA in all cases. Therefore the parameter was fixed to unity for all subsequent fits. In this case the interaction of PAA and HSA can be formulated as a conventional chemical equilibrium:
| (3) |
where denotes the total protein concentration in the solution and the concentration of PAA-HSA complex. Furthermore, the binding free energy can be derived by
| (4) |
Furthermore using the following two equations, the entropy can be either calculated for one temperature or extracted from its temperature dependence:
| (5) |
| (6) |
2.2 Theoretical Methods
2.2.1 Computer simulation model and parameters
In our simulations we employ an implicit-water coarse-grained (CG) model, where each of the amino acids, PAA monomers, and salt ions is explicitly represented by a single interaction bead. Hence, the water is modeled by a dielectric background continuum while the salt is explicitly resolved. The dynamics of each of the beads in our simulations is governed by Langevin’s equation of motion 35
| (7) |
where and are the mass and friction constant of the th bead, respectively. is the system potential energy and includes harmonic angular and bonded interactions between neighbouring beads in HSA and PAA, dihedral potential in the case of the HSA, and interatomic Lennard-Jones (LJ) between all non-neighbouring beads, including ions. Coulomb interactions govern the electrostatic pair potential between all charged beads. The random force is a Gaussian noise process and satisfies the fluctuation-dissipation theorem
| (8) |
The simulations are performed using the GROMACS 4.5.4 software package. 36 A leap-frog algorithm with a time step of 2 fs is used to integrate the equations of motion. A cubic box with side lengths of nm is employed and periodically replicated to generate a quasi-infinite system in the canonical ensemble. The Langevin friction is ps-1 that dissipates the energy at constant temperature . Center of mass translation of the system is removed every 10 steps. The cutoff radius is set to 3.0 nm to calculate the real-space interactions while Particle-Mesh-Ewald 37 (PME) is implemented to account for long-range electrostatics. The PME method is computed in the reciprocal space with a FFT grid of 0.12 nm spacing and a cubic interpolation of fourth-order. The solvent is modelled as a continuous medium with a static dielectric constant of and 78.2 for temperatures C and 37∘C, respectively. All beads have mass amu, diameter nm, energy well kT and integer charges = 0, +1 or -1 e. The mass was chosen artificially low to enhance orientational fluctuations and sampling. Clearly, equilibrium properties, as investigated in this work, are not affected by any reasonable mass choices as long as the simulations are ergodic.
The protein sequence for the HSA is provided by PDB databank: ID=1N5U. 38 Every amino acid is described by a single bead positioned at its atom. The native structure of the protein is maintained by a Go-model like force field as provided from the SMOG webtool for biomolecular simulations. 39, 40 All beads corresponding to basic and acidic amino acids are assigned a charge of +1 and -1, according to their titration state at physiological pH = 7.4, that is, ARG and LYS residues are assigned a charge +1, while ASP and GLU are -1, and HIS is neutral. With that the net charge of the simulated HSA is -14.
A single flexible PAA polyelectrolyte is modeled in a coarse-grained fashion as a sequence of freely jointed beads. Each bead represents a monomer with a radius and carries an electric charge of . The PAA monomers are connected by a harmonic bond potential with an equilibrium bond length nm and a force constant kJ mol-1 nm-2. The flexibility of the PAA chain is defined via a harmonic angle potential in which the angle between a triplet of monomer is and the force constant is kJ mol-1 rad-2. As in the experiments we consider short PAA chains with monomers. The simulation box contains one HSA, while the amount of PAA and ions are characterized by the molar ratio , ranging from 1 to 10, and salt concentration , ranging from 20 to 100 mM, respectively.
2.2.2 Binding and free energy calculations
The stoichiometry, in our case the average number of bound PAA chains on one HSA, can be determined through a calculation of the normalized density distribution function , where is the distance between the centers-of-mass (COM) coordinates of the HSA and PAA and is the PAA bulk concentration. Integration of the further leads to the PAA coordination number
| (9) |
which describes how many PAA chains are bound on average at a distance . For each molar ratio we simulated 120 ns in order to calculate the equilibrium coordination (binding) numbers of PAA to HSA.

To quantify the number of bound and released ions upon complexation, we count the average number of ions , , that are bound (’condensed’) on the PAA chain or on the positive protein patches, respectively, and make a comparison before and after PAA/HSA association. An ion is defined as ’condensed’ if it is located in the first binding layer, that is closer than a cut-off distance nm from the charged bead, while double-counting in overlapping volumes is avoided. The average is over long (ca. 30 ns) trajectories in the fully separated and stable bound states.
To calculate the potential mean force (PMF) between the HSA and the PAA we employed steered Langevin Dynamics simulations using the pull code as provided by GROMACS. 36 Here, the center of mass of the PAA is restrained in space by an external time-dependent force. This force is applied as a constraint, i.e. harmonic potential, and moved with a constant pulling velocity to steer the particle in the prescribed direction.41 After several test runs, the pulling rate nm/ns was chosen and a harmonic force constant kJ mol-1 nm-2. The simulations were performed for 100 ns. Given the pulling speed above, this simulation time is required to bring the two macromolecules from a separated state ( nm) to a final state ( nm). The standard deviation was calculated by standard block averages to specify the statistical error. The friction force was subtracted from the constraint force and the result averaged within a specific interval of discrete spacing to obtain the mean force of the interaction potential. According to the simulation setup, the mean force was integrated backwards to get the potential of mean force (PMF). Because the CPPM were radially constraint in 3D space, the PMF has to be corrected for translational entropy 42 by
| (10) |
where is the integrated mean force. The binding affinity of the PAA can then be defined as the free energy value at the global minimum of the PMF in the stable complex as
| (11) |
where the reference is set to zero. However, before making a comparison with the experiment, we had to consider that provided by the experiment is defined as a standard free energy, which refers to the standard binding volume of one liter per mol. 43 Hence, the binding constant generated from experiment is formulated as . In our simulations we average the accessible volume of the COM of the PAA in the bound state.
As a result, the standard binding free energy from the simulation can be obtained as 43
| (12) |
with a term is the entropy correction arising from the accessible volume of the COM of the PAA in the bound state.
3 Results and Discussion
We performed a systematic series of ITC experiments comprising four ionic strengths and five different temperatures ranging from room temperature (25∘C) to the physiological temperature (37∘C). The experiments were performed at pH 7.2 in buffer solution. This pH is well above the isoelectric point of the protein HSA used for this experiment leading to a net effective charge of -14. PAA is a weak acid with a pKa of 4.5 and hence a net charge of -25 at pH 7.2. Thus, we study the adsorption on the "wrong side" of the isoelectric point where both the protein as well as the polyelectrolyte is charged negatively.
ITC is certainly the method of choice for the determination of the adsorption constant of a given substrate to HSA. 15, 21, 44 However, the concentrations of the protein and PAA are small and the evolved heat will be concomitantly small. Hence, all effects leading to spurious heat signals must be considered in detail and carefully excluded. The main problem is the adjustment of the same pH and ionic strength in both the solution of the protein and of the polyelectrolyte. This is done by extensive dialysis which turned out to be decisive for obtaining meaningful ITC-data. Since the concentrations of both PAA and HSA are low, all spurious effects leading to a heat signal must be considered. Since PAA-solutions are added in small portions to the solution of HSA, the heat of dilution of PAA must be determined carefully and subtracted from the raw signal.
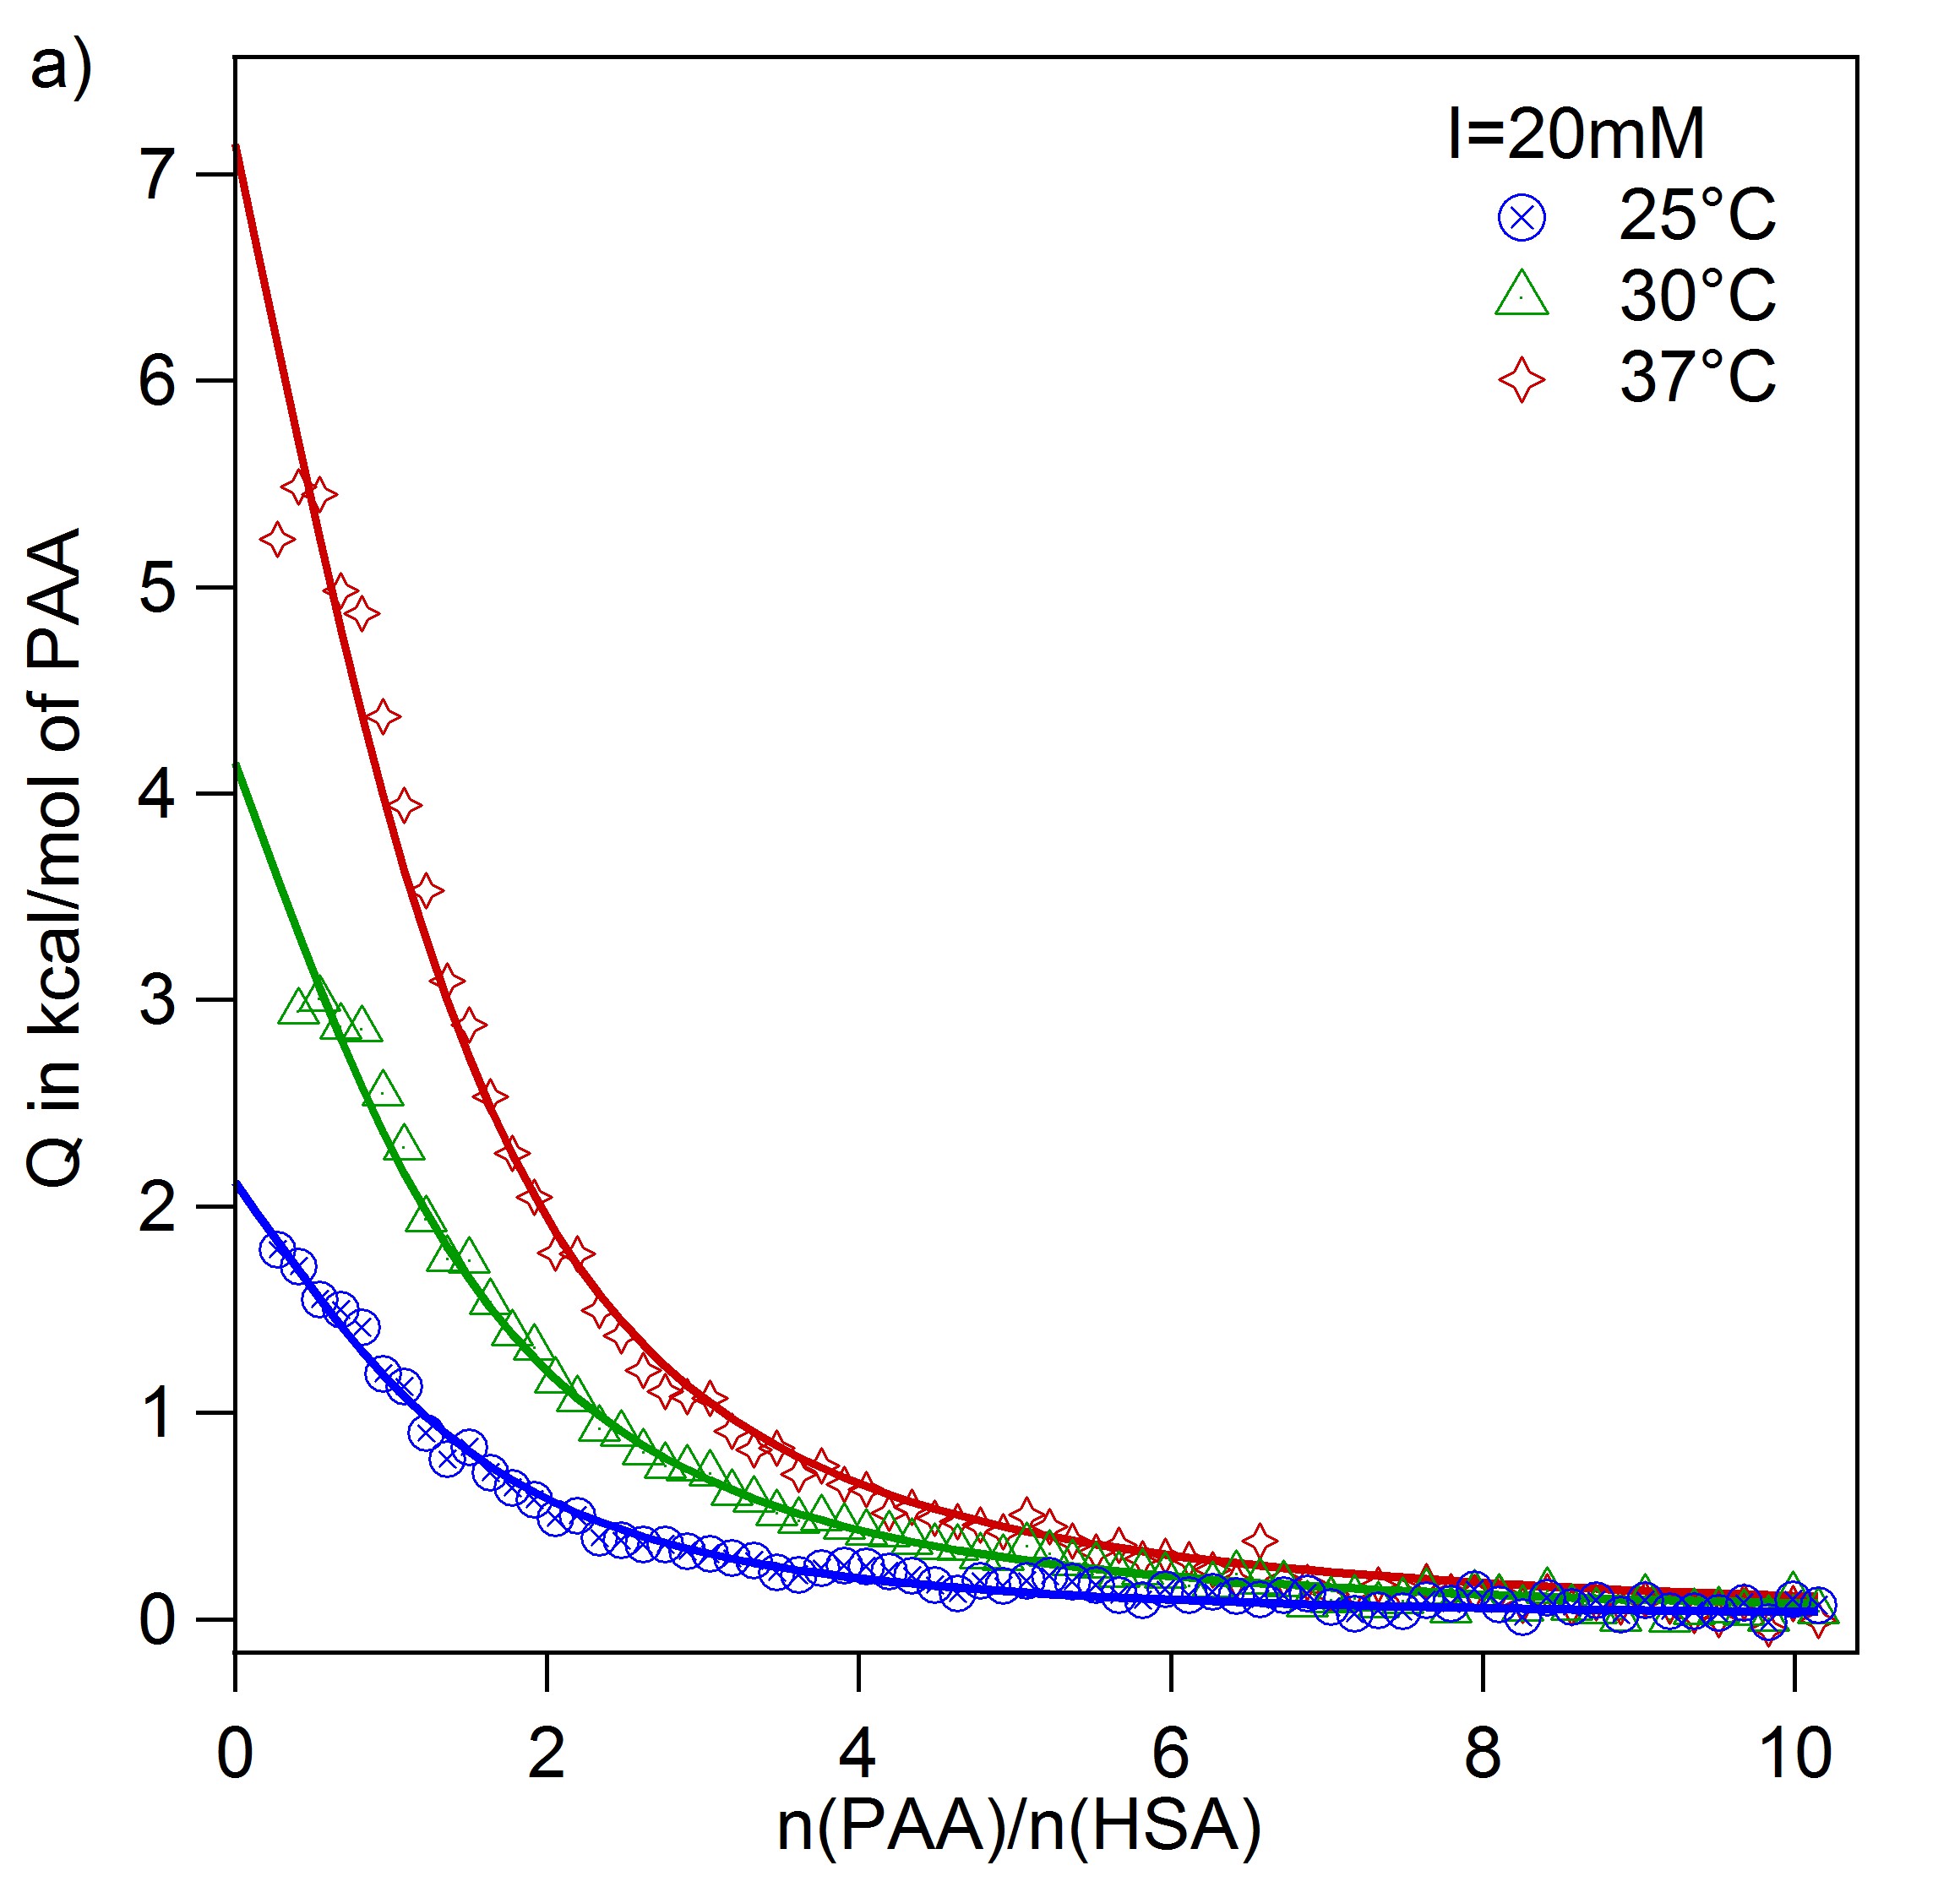
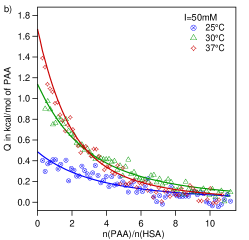

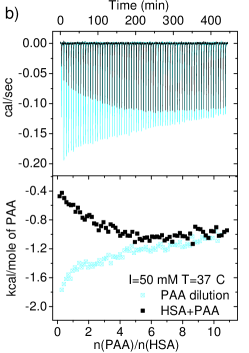
Fig. 1 and Fig. S1 of the SI displays the raw ITC-signals of PAA onto HSA (black curves and points) as well as the heat of dilution of PAA (green points). The signal is weakly endothermic at I=20 mM but exothermic at I=50 mM (see Fig. 1). Dilutions are in all cases exothermic and the effect becomes stronger with increasing salt content as expected (blue curves and points). For higher ionic strength, the heat of dilution has a dominant effect on the overall signal and determines the sign of the signal at I>20 mM. For data analysis, the heats of dilution are subtracted from the heats of adsorption prior to fitting. Here, special attention must be paid to this step, as for some cases there remains a constant residue after subtraction of the heat of dilution. Even though this offset signal is very small and usually less than 0.1 kcal/mol, it cannot be neglected due to the small overall heat. We assign this offset to a slight mismatch of the pH or salt titrant and the solution in the cell. In order to take this effect into account, a flat background was fitted to all isotherms after the first step of subtraction and used to correct the data in the second step.
The panel on the right-hand side of Fig. 1 displays a set of typical results thus obtained. Evidently, the heat of adsorption is positive and we find this for all conditions under consideration here. Hence, the driving force for the process of adsorption must be entropic. This point will be discussed in more detail below and is well borne out from the simulations, too.
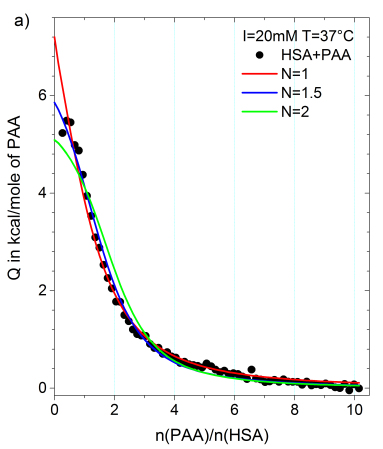
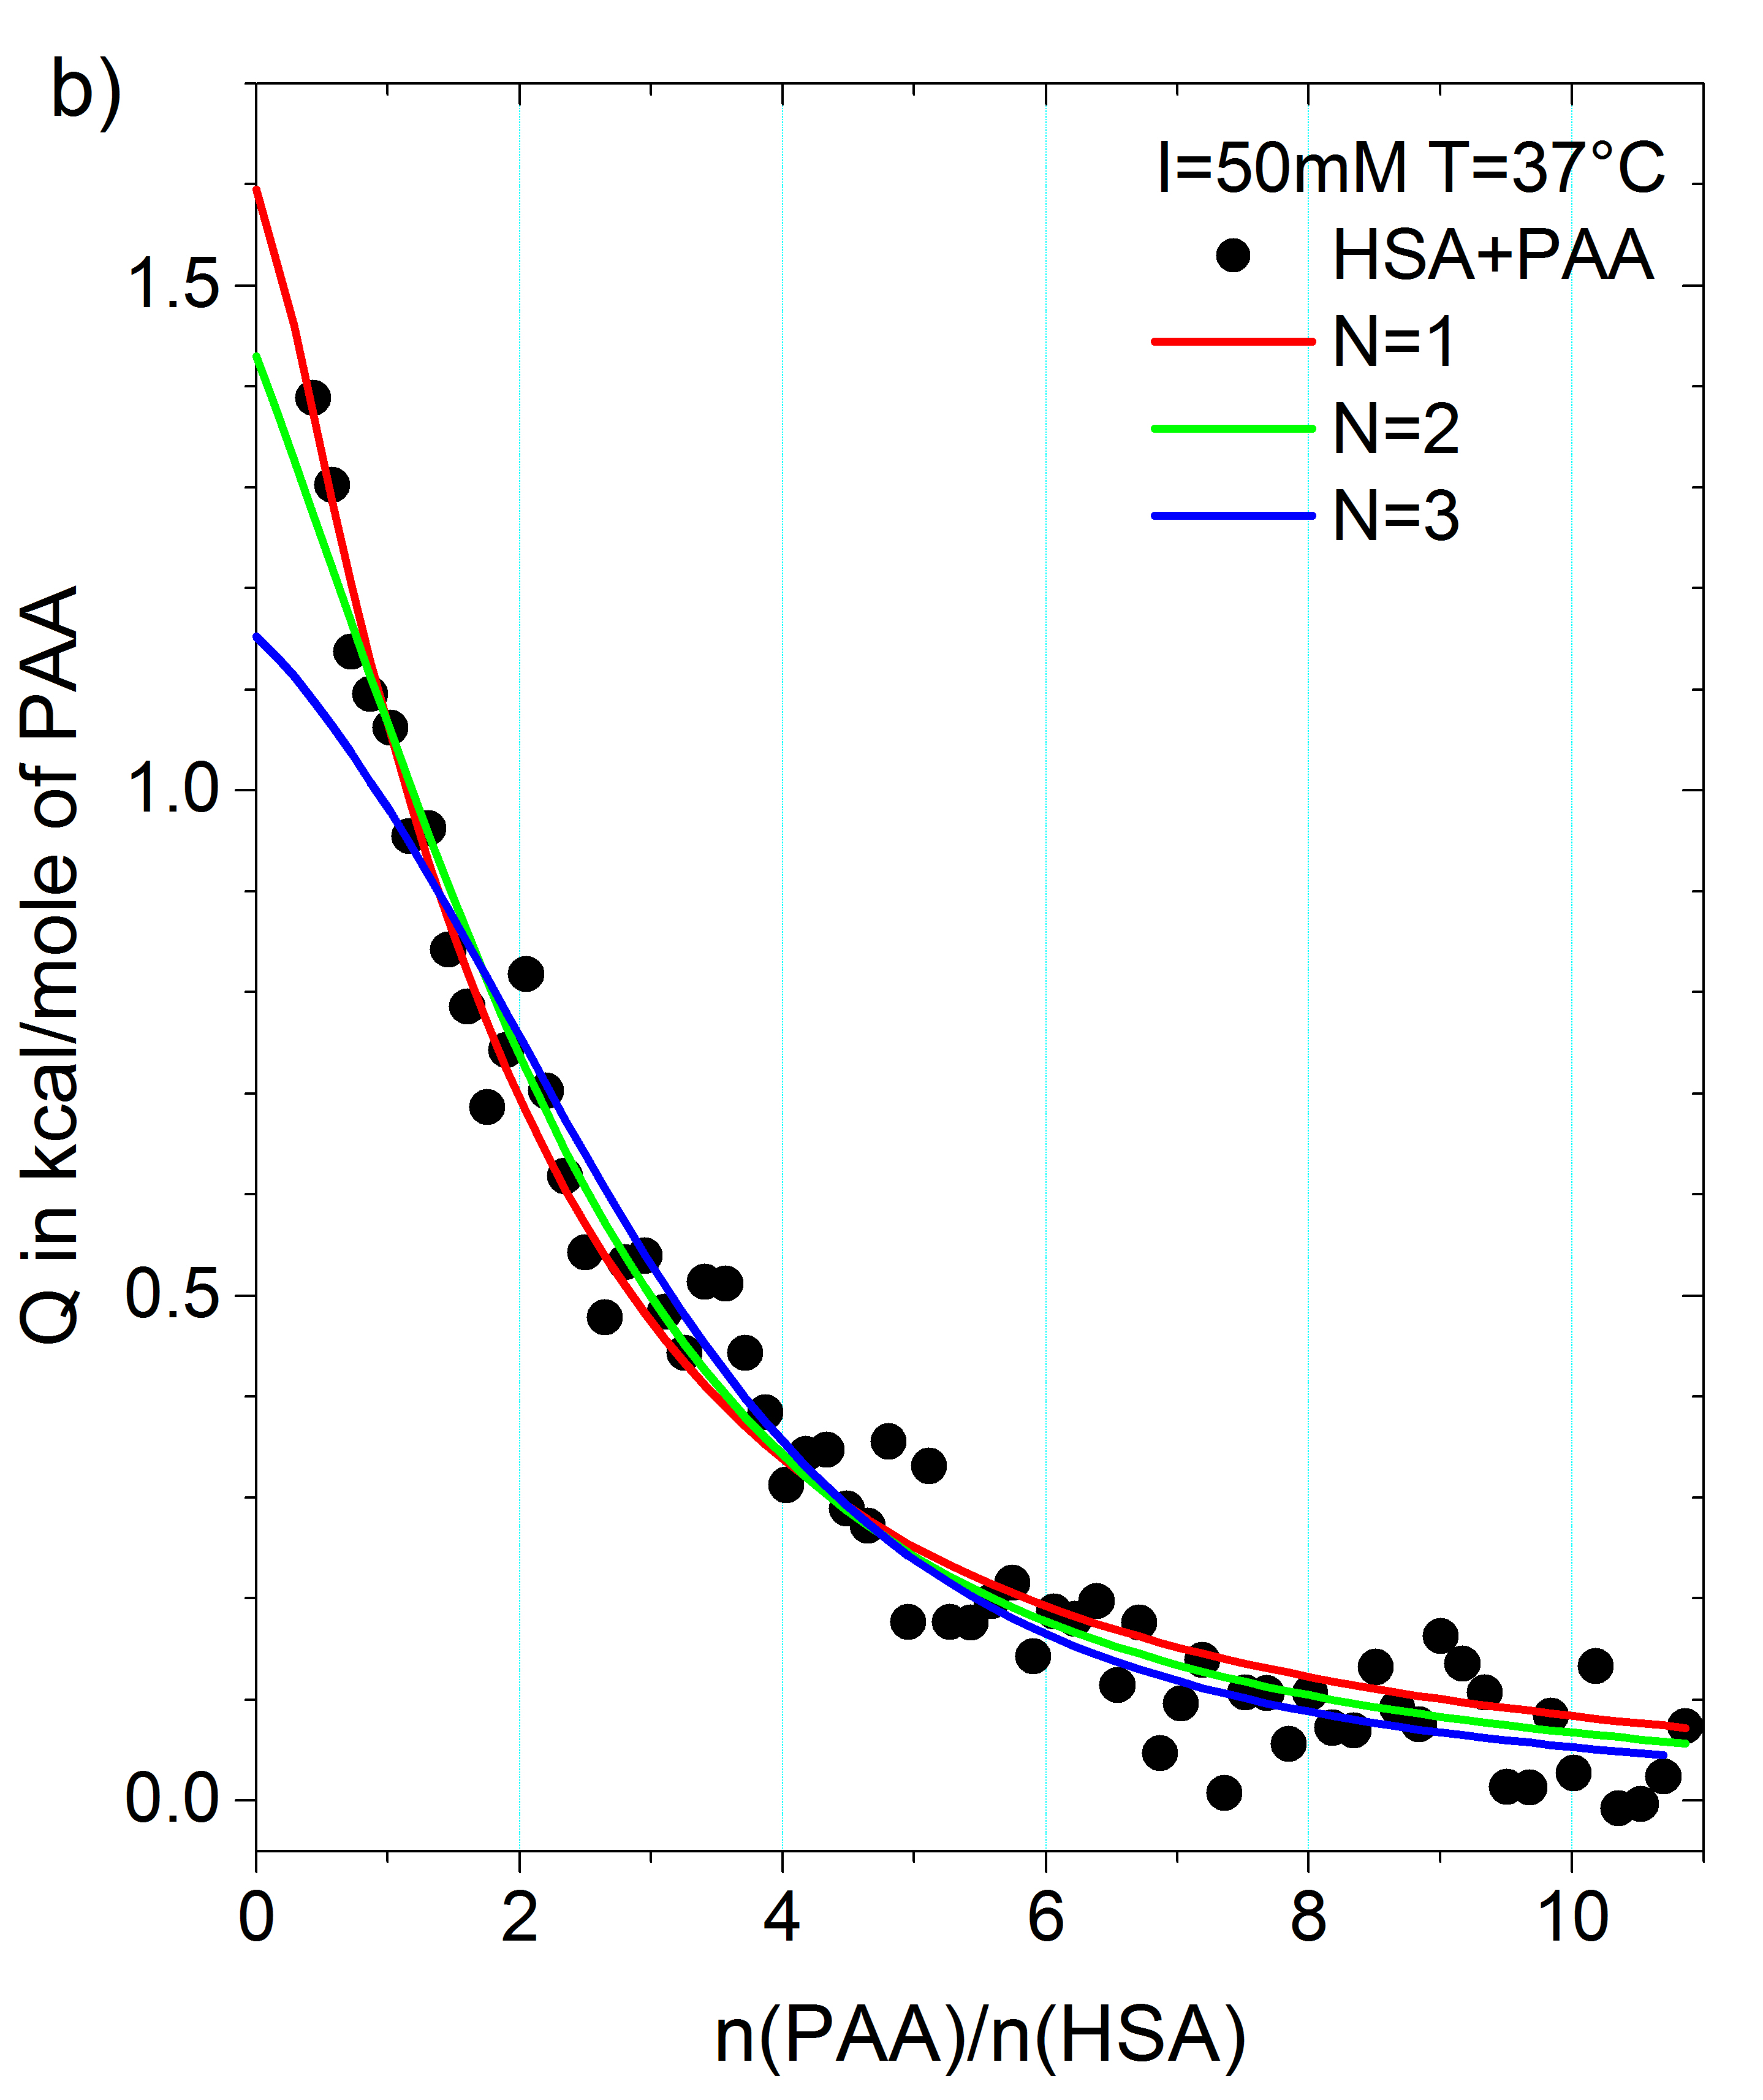
In order to obtain the number of PAA-molecules bound to one HSA-molecule, the data were first fitted using the SSIS model as described in Section 2.1.1. Fig. 2 shows a comparison of the parameter for the two data sets as in Fig. 1. The colored curves showing different fixed values of reveal that the data clearly justify as the best choice for fitting. This observation is true for any other sets of data. Deviations from are not significant and we can safely assume in all subsequent analysis (see eq. 3 in Section 2.1.1).
| Ionic Strength (mM) | T (∘C) | |||||
|---|---|---|---|---|---|---|
| (kJ/mol) | (mol-1) | (kJ/mol) | (kJ/mol/K) | (kJ/mol) | ||
| 25 | 16.40.3 | 7.70.5 | -27.91.3 | |||
| 27.5 | 32.80.6 | 5.80.3 | -27.41.4 | |||
| 20 | 30 | 34.00.5 | 6.90.3 | -28.11.1 | 0.170.01 | 154 |
| 33 | 45.60.9 | 8.10.5 | -28.81.6 | |||
| 37 | 53.41.0 | 8.30.5 | -29.21.5 | |||
| 25 | 13.61.1 | 1.30.2 | -23.40.5 | |||
| 27.5 | 14.40.9 | 1.60.2 | -24.20.3 | |||
| 50 | 30 | 24.80.7 | 1.70.1 | -24.60.1 | 0.270.02 | 448 |
| 33 | 27.60.9 | 1.80.2 | -24.90.2 | |||
| 37 | 26.40.6 | 2.60.1 | -26.20.1 | |||
| 70 | 37 | 21.90.7 | 1.00.1 | -23.60.5 | 0.12 (37∘C) | |
| 100 | 37 | 35.511.6 | 0.30.1 | -20.71.2 | 0.10 (37∘C) |
3.1 Strength of interaction as the function of temperature
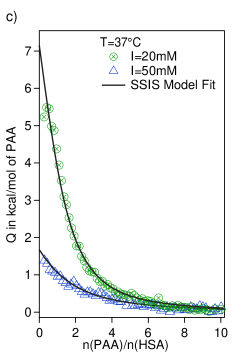
Fig. 3 presents two series of temperature dependency studies for the ionic strengths I=20 mM and 50 mM. For better clarity, only 3 temperatures are displayed in these graphs. The data for two more temperatures are displayed in Figure S1 of the Supporting Information. The data taken at both ionic strength reveal a significant increase of enthalpy with increasing temperature from 25∘C to 37∘C. This effect is more pronounced for I=20 mM than at I=50 mM. Additionally, the overall enthalpy of adsorption becomes weaker with increasing salt content, which points directly to the importance of electrostatic interaction on the binding of PAA onto HSA. All data are very well described by the model assuming . Data taken at higher salinity are more noisy but the raise of the signal with temperature is clearly discernible. Since there is no plateau in the ITC signal, the parameter might be overestimated by the fits.
The results of these fits are listed in Table 1 with and as fitting parameters, being fixed to unity (see above). The free energy of binding was calculated from the fitting parameter Kb using equation 4.
The temperature dependence of the binding can now be analyzed according to van’t Hoff’s law:
| (13) |
Fig. 3 c) shows the resulting van’t Hoff plot. A linear correlation between logarithm of the binding constant and the inverse temperature is seen within the limits of errors. The binding enthalpy can be obtained from the slope of the linear fit and from the intercept. The resulting data are gathered in Table 1. In general, the values of HITC are larger than the data resulting from the van’t Hoff analysis. Similar finding have been made in a recent study of the interaction of proteins with charged microgels. 45 Reasons may be sought in additional processes as e.g. the hydration of freed counterions that are not directly coupled to the process of binding (see below). Also, the heat of adsorption taken directly from the ITC data might be slightly overestimated (see above).
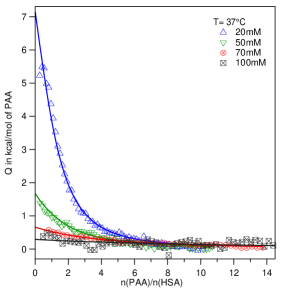
3.2 Dependence on ionic strength.
To study the dependence of the binding process on ionic strength, we carried out two more experiments at 37∘C and I=70 mM and 100 mM (see Fig. 4, raw data are shown in Figure S2). With increasing ionic strength, the measured enthalpy approaches zero and the ITC method reaches its instrumental limits. As described above, we fix the parameter for both salt concentrations to unity. Table 1 gathers all data obtained from these experiments.
The data exhibit a very consistent decrease of binding constant with increasing salt concentration (see Tab. 1). This observation combined with the fact that only about one PAA molecule is adsorbed on the HSA leads to the conclusion that the driving force of the interaction is an attractive electrostatic potential between the negative PAA with patches of positive charge on the surface of HSA molecule. These patches are known to act as multivalent counterions for the polyelectrolyte. Binding of such a polyelectrolyte to such a patch thus leads to a release of its counterions. 46, 45, 47 This “counterion release force“ was considered many years ago by Record and Lohman who predicted a linear correlation between the logarithms of binding constant and salt concentration 48:
| (14) |
where Kb is the binding constant, csalt the salt concentration and the number of counterion release upon adsorption. This behavior is observed for the present data as well if the ionic strengths is above 20 mM (see Fig. 5). Application of eq. 14 to the data in Fig. 5 yields , that is, approximately 3 ions are released upon binding of one PAA-molecule to a HSA molecule. The deviation from linearity for low ionic strength has been observed as well by Dubin et al. for the interaction between Bovine Serum Albumin and the polyanion Heparin at pH 6.8. 22 Here, electrostatic interactions become long-ranged and the relative contributions of the counterion release mechanism significantly decrease.
Extrapolation of the linear fit reveals that interaction still persists at physiological ionic strengths and temperature. At I=150 mM and 37∘C, we derive from our plot a finite binding free energy of around -17 kJ/mol and it only decays to small values at around 750 mM. This concentration has been found to be necessary in dialysis to remove protein-bound uremic retention solutes. 25 Evidently, there is still some binding under physiological conditions and much higher salt concentrations are needed to remove the toxins from the surface of HSA. These results show also that ITC-experiments can be deceptive when enthalpies of different reaction in the system compensate in such a way that they vanish. Thus, in the present case interaction still exists under physiological conditions but does not lead to measurable enthalpies.

4 Comparison with computer simulations
All simulations presented in the following are using an implicit-water coarse-grained (CG) structure-based model, where the CG protein is held in its native structure by semi-empricial force-fields. 40 Here the amino acids, the PAA monomers, and the salt ions are modelled explicitly on a single bead level. Water is modelled by a dielectric background continuum while the salt ions are explicitly resolved. Similar methods have been used repeatedly to study, e.g., protein folding 49 and the pair potential 50 between proteins. They provide a reasonable picture of the interactions of a given molecule with the amino acids localized at the surface of the protein because they retain native structure, thermal motion, and ion-induced mechanisms in a well-resolved fashion. Hence, this type of simulations provides a full microscopic picture of the interaction of PAA with HSA, in particular the identification of the sites where PAA docks on. Moreover, the simulations can be used to obtain realistic free enthalpies of binding as will be further shown below.
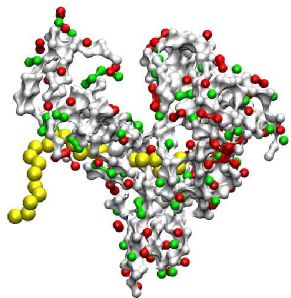
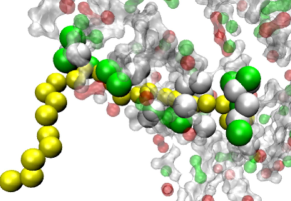
Our computer simulations demonstrate that the HSA binds only one PAA chain, independent of temperature, salt concentration, and molar ratio in the considered parameter ranges. Hence, it reconfirms the result obtained previously by ITC. A representative simulation snapshot of the bound complex with one PAA is presented in Fig. 6. From a thorough screening of our simulation trajectories it emerges that this structure is highly reproducible and assumed in 80% of the simulation time. It is hence a highly stable and probable configuration. Additional analysis reveals that the PAA chain spans the sub-domains II A, III A, and III B, involving the Sudlow II binding site. As expected for a negatively charged polyelectrolyte we find that it favorably binds positively charged amino acids, arginine (R) and lysine (K) at positions R410, R484, R485, R413, R538, K541, K199, K195, see also the green opaque spheres in Fig. 6. This is certainly a central result of the present analysis inasmuch as it defines the precise location of the binding of a highly charged molecule as PAA.
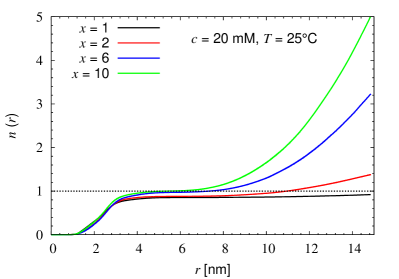
To demonstrate that only one PAA forms a complex with HSA, the running coordination number of the PAA around HSA is shown in Fig. 7 for molar ratios , 2, 6, and 10. The quantity is the total number of PAA-molecules around a given HSA as the function of distance. The plateau of the curves between separations of and 6 nm just above the average value of the HSA radius is a proof that the binding number does not exceed one, irrespective of the molar ratio. Only at larger distances is increasing beyond unity since here the entire solution is explored. We find qualitatively similar results for the other investigated salt concentrations and temperatures. This finding again is in direct agreement with the results of the ITC-experiments (see also the normalized density profiles in Fig. S5).
It is furthermore interesting to see the temporal evolution of the complex of HSA with PAA. The PAA chain slides along the Sudlow II site much in a way of a threading through an orifice. A series of snapshots combined with a movie can be found the in Fig. S4 of the supplementary information. At the one hand, this fact demonstrates the strong binding of PAA by this side. On the other hand, the threading through this site leads to a strongly increased number of configurations of the complex and thus increases the entropy of the complex. This fact certainly leads to the binding of the PAA-chain at the Sudlow II site and not on other positive patches on the surface of HSA.
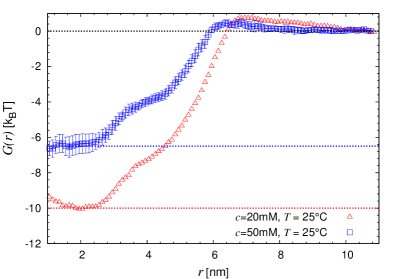
Our simulations allow us to calculate the free energy profiles (potential of a mean force) along the HSA-PAA distance coordinate. Examples for this interaction free energy between a single uncomplexed HSA and one PAA at two salt concentrations is presented in Fig. 8. For larger distances of approach, nm, a small repulsive barrier can be observed stemming from the monopole charge repulsion which dominates for large separations as expected. The barrier decreases and shifts slightly to shorter distances with higher salt concentration. At about nm the onset of a strong attraction takes place until a global minimum is observed at closer approach at about nm. The onset of attraction happens right at values comparable to half of the contour length of the PAA chain at which one of its ends is first able to get in contact with the HSA surface. We never found a stable free energy minimum for the adsorption of a second PAA. This is due to a too strong monopole charge repulsion and the covering of the high-potential binding spot by the firstly bound PAA.
For the stable HSA/PAA complex, the binding free energy can be calculated from the difference of the global minimum and the reference free energy at large distances (horizontal lines in Fig. 8). The values of the simulation binding free energy, corrected to yield the standard free energy of binding from the simulations (see Methods), are summarized in Table 2 for various salt concentrations and temperatures. We find a very good agreement for all systems with largest deviation of only 13% for the case of 50 mM salt at 37∘ C temperature. As in the experiments, the binding affinity decreases in the simulations with higher salt concentrations and increases with rising temperature. The highly quantitative description by the simulations, however, is actually somewhat surprising given the simplicity of the underlying model and the neglect of hydration effects and should be discussed with caution. However, we take it as a strong indication that relatively generic electrostatic interactions rule the complexation process and hydration contributions (such as hydrophobic or van der Waals (vdW) attractions) are rather small.
| Conditions | (kJ/mol) | () | (kJ/mol) | (kJ/mol) | (kJ/mol) |
|---|---|---|---|---|---|
| 20 mM, 25∘C | 3.0 | ||||
| 20 mM, 37∘C | 5.9 | ||||
| 50 mM, 25∘C | 16.0 | ||||
| 50 mM, 37∘C | 7.5 |
In order to test our hypothesis introduced above that the binding free energy is essentially dominated by the entropy of released counterions from the PAA chain and/or a positive patches on the HSA, we have counted the number of released ions upon complexation. In brief, we define an ion as ’condensed’ if it is located in the first bound layer near a charged HSA or PAA monomer, defined by a cut-off radius of 0.5 nm. Hence, the number of released ions is calculated as the difference of the average number of condensed ions in the fully separated and the stable bound states (see Fig. S5). For a temperature of 25∘C and 20 mM and 50 mM salt concentrations, our analysis shows that on average indeed 2.5 condensed ions are diluted away into the bulk upon complexation. This is indeed in good agreement with the Record-Lohman-analysis of the experiment data discussed above (cf. the discussion of Fig. 5).
Deeper inspection shows that 2 of those ions come from the PAA, at which they where bound in a high density state (see Fig. S6 for ionic profiles around PAA monomers). If we now just consider the PAA-condensed ions and their average concentration in the bound state mol/l, this implies that a favorable entropy contributions of about and is gained per ion upon its release into 20 mM and 50 mM bulk concentrations, respectively. The total release free energies estimated by this analysis are thus roughly -21 and -17 kJ/mol for 20 mM and 50 mM salt, respectively, which is close to the binding free energies from both experimental data and from simulations. Hence, the binding of PAA is to a great part ruled by a counterion release mechanism and entropy. We note, however, that the matching of these numbers may be fortunate since other non-negligible interactions such as (repulsive) chain entropy, vdW attractions, and multipolar charge interactions beyond the bound ion layer (that is, from screening ions), all present in both simulation and experiment, have been neglected in this simple counterion release concept. The present comparison with experimental data, however, indicates that these contributions are of comparable magnitude and cancel each other roughly for the present system.
Evidently, we obtained the leading contribution of the ions directly condensed on the PAA chain. Hence, the estimate of the entropy of counterion release given above should be considered a lower bound for the absolute entropy contribution. Other contributions not included in the theoretical analysis apparently lead to experimental entropies that are higher by a factor of 2-3 (see cf. Table 1). The good agreement between the measured and the calculated , however, demonstrates that these additional entropic contributions are canceled out by an enthalpic contribution of equal magnitude. This “enthalpy-entropy compensation“ is well-known for various processes as e.g. solute hydration, protein folding, or proteins association. 27, 44 The present comparison of theory and experiment allows us to discern among these terms and the leading contribution to .
5 Conclusions
We presented a study of the binding of short PAA chains to HSA by combining calorimetry, that is, ITC and computer simulation. Both ITC experiments and simulation results show that there exists a strong attractive interaction between PAA and HSA at “the wrong side of pI“, where both are negatively charged. Computer simulations demonstrate that the binding of the PAA takes place at the Sudlow II site. ITC measurements for a series of salt concentrations between 20 mM and 100 mM show that the dependence of binding affinity on ionic strengths is mainly determined by the counterion release mechanism and can be described by the Record-Lohman relation see eq. 14 (see Fig. 5). The binding affinity decreases with high ionic strength, until it practically vanishes at around 750 mM. Both the analysis of the experimental data as well as the simulations find that approximately 3 ions are released in the binding process. The binding affinity can be calculated from simulations with good accuracy. Combining simulations with calorimetry is hence a powerful tool to elucidate the interaction of proteins with given substrates or possible toxins. Thus, this combination of theory and experiment is now capable of solving biochemical problems of direct medical importance.
The Helmholtz Virtual Institute for Multifunctional Biomaterials for Medicine are gratefully acknowledged for financial support. The authors thank the Helmholtz Association for funding of this work through Helmholtz-Portfolio Topic "Technology and Medicine". X. Xu is sponsored by the China Scholarship Council (CSC). In addition, J. Jankowski was supported by the grant "NPORE" of the BMBF/IGSTC (01DQ13006A).
References
- Curry et al. 1998 Curry, S.; Mandelkow, H.; Brick, P.; Franks, N. Crystal structure of human serum albumin complexed with fatty acid reveals an asymmetric distribution of binding sites. Nat. Struct. Mol. Biol. 1998, 5, 827–35
- Fasano et al. 2005 Fasano, M.; Curry, S.; Terreno, E.; Galliano, M.; Fanali, G.; Narciso, P.; Notari, S.; Ascenzi, P. The extraordinary ligand binding properties of human serum albumin. IUBMB life 2005, 57, 787–96
- Barbosa et al. 2005 Barbosa, S.; Taboada, P.; Mosquera, V. Analysis of the interactions between human serum albumin/amphiphilic penicillin in different aqueous media: an isothermal titration calorimetry and dynamic light scattering study. Chem. Phys. 2005, 310, 51–58
- Jankowski et al. 2003 Jankowski, J.; van der Giet, M.; Jankowski, V.; Schmidt, S.; Hemeier, M.; Mahn, B.; Giebing, G.; Tölle, M.; Luftmann, H.; Schlüter, H.; Zidek, W.; M., T. Increased plasma phenylacetic acid in patients with end-stage renal failure inhibits iNOS expression. J. Clin Invest. 2003, 112, 256–264
- Vanholder et al. 2003 Vanholder, R.; de Smet, R.; Glorieux, G.; Zidek, W. Review on uremic toxins : Classification , concentration , and interindividual variability. Kidney Int. 2003, 63, 1934–1943
- Duranton et al. 2012 Duranton, F.; Cohen, G.; De Smet, R.; Rodriguez, M.; Jankowski, J.; Vanholder, R.; Argiles, A. Normal and Pathologic Concentrations of Uremic Toxins. . J Am Soc Nephrol. 2012, 23, 1258–1270
- Duranton et al. 2013 Duranton, F.; Cohen, G.; De Smet, R.; Rodriguez, M.; Jankowski, J.; Vanholder, R. CORRECTION. J. Am. Soc. Nephrol. 2013, 24, 2127–2129
- Bhattacharya et al. 2000 Bhattacharya, a. a.; Grüne, T.; Curry, S. Crystallographic analysis reveals common modes of binding of medium and long-chain fatty acids to human serum albumin. J. Mol. Biol. 2000, 303, 721–32
- Matsuda et al. 2014 Matsuda, R.; Bi, C.; Anguizola, J.; Sobansky, M.; Rodriguez, E.; Vargas Badilla, J.; Zheng, X.; Hage, B.; Hage, D. S. Studies of metabolite-protein interactions: a review. J. Chromatogr., B: Anal. Technol. Biomed. Life Sci. 2014, 966, 48–58
- Reichenwallner and Hinderberger 2013 Reichenwallner, J.; Hinderberger, D. Using bound fatty acid to disclose functional structure of serum albumin. Biochim. Biophys. Acta 2013, 5382–5393
- Chatterjee et al. 2012 Chatterjee, T.; Pal, A.; Dey, S.; Chatterjee, B. K.; Chakrabarti, P. Interaction of virstatin with human serum albumin: spectroscopic analysis and molecular modeling. PloS ONE 2012, 7, e37468
- Rehman et al. 2014 Rehman, M. T.; Shamsi, H.; Khan, A. U. Insight into the binding mechanism of imipenem to human serum albumin by spectroscopic and computational approaches. Mol. Pharm. 2014, 11, 1785–97
- Sudlow et al. 1975 Sudlow, G.; Birkett, D.; Wade, D. The characterization of two specific drug binding sites on human serum albumin. Mol.Pharmacol. 1975, 11, 824–832
- Roselin et al. 2010 Roselin, L. S.; Lin, M.-S.; Lin, P.-H.; Chang, Y.; Chen, W.-Y. Recent trends and some applications of isothermal titration calorimetry in biotechnology. Biotechnol. J. 2010, 5, 85–98
- Bouchemal 2008 Bouchemal, K. New challenges for pharmaceutical formulations and drug delivery systems characterization using isothermal titration calorimetry. Drug Discov. Today 2008, 13, 960–972
- Keswani et al. 2010 Keswani, N.; Choudhary, S.; Kishore, N. Interaction of weakly bound antibiotics neomycin and lincomycin with bovine and human serum albumin: biophysical approach. J. Biochem. 2010, 148, 71–84
- Sivertsen et al. 2014 Sivertsen, A.; Isaksson, J.; Leiros, H.-k. S.; Svenson, J.; Svendsen, J.-s.; Brandsdal, B. r. O. Synthetic cationic antimicrobial peptides bind with their hydrophobic parts to drug site II of human serum albumin. BMC Struct. Biol. 2014, 14
- Cooper et al. 2005 Cooper, C.; Dubin, P.; a.B. Kayitmazer,; Turksen, S. Polyelectrolyte-protein complexes. Curr. Opin. Colloid Interface Sci. 2005, 10, 52–78
- da Silva and Jönsson 2009 da Silva, F. L. B.; Jönsson, B. Polyelectrolyte-protein complexation driven by charge regulation. Soft Matter 2009, 5, 2862
- Becker et al. 2012 Becker, A. L.; Henzler, K.; Welsch, N.; Ballauff, M.; Borisov, O. Proteins and polyelectrolytes: A charged relationship. Curr. Opin. Colloid Interface Sci. 2012, 17, 90–96
- Ball and Maechling 2009 Ball, V.; Maechling, C. Isothermal microcalorimetry to investigate non specific interactions in biophysical chemistry. Int. J. Mol. Sci. 2009, 10, 3283–315
- Seyrek et al. 2003 Seyrek, E.; Dubin, P. L.; Tribet, C.; Gamble, E. a. Ionic strength dependence of protein-polyelectrolyte interactions. Biomacromolecules 2003, 4, 273–82
- Du et al. 2014 Du, X.; Dubin, P. L.; Hoagland, D. a.; Sun, L. Protein-selective coacervation with hyaluronic acid. Biomacromolecules 2014, 15, 726–34
- Welsch et al. 2013 Welsch, N.; Lu, Y.; Dzubiella, J.; Ballauff, M. Adsorption of proteins to functional polymeric nanoparticles. Polymer 2013, 54, 2835–2849
- Boehringer et al. 2015 Boehringer, F.; Jankowski, V.; Gajjala, P. R. Release of Uremic Retention Solutes from Protein Binding by Hypertonic Predilution Hemodiafiltration. ASAIO Journal 2015, 61, 55–60
- Devine et al. 2014 Devine, E.; Krieter, D. H.; Rüth, M.; Jankowski, J.; Lemke, H. D. Binding affinity and capacity for the uremic toxin indoxyl sulfate. Toxins 2014, 6, 416–430
- Ball et al. 2002 Ball, V.; Winterhalter, M.; Schwinte, P.; Lavalle, P.; Voegel, J.; Schaaf, P. Complexation Mechanism of Bovine Serum Albumin and Poly ( allylamine hydrochloride ). J. Phys. Chem. B 2002, 106, 2357–2364
- Kayitmazer et al. 2013 Kayitmazer, A. B.; Seeman, D.; Minsky, B. B.; Dubin, P. L.; Xu, Y. Protein-polyelectrolyte interactions. Soft Matter 2013, 9, 2553–2583
- Nfor et al. 2008 Nfor, B. K.; Ahamed, T.; van Dedem, G. W. K.; van der Wielen, L. A. M.; van de Sandt, E. J. A. X.; Eppink, M. H. M.; Ottens, M. Design strategies for integrated protein purification processes: Challenges, progress and outlook. J Chem. Technol. Biotechnol. 2008, 83, 124–132
- Silva et al. 2010 Silva, R. a.; Urzúa, M. D.; Petri, D. F. S.; Dubin, P. L. Protein adsorption onto polyelectrolyte layers: effects of protein hydrophobicity and charge anisotropy. Langmuir 2010, 26, 14032–8
- Clementi et al. 2000 Clementi, C.; Nymeyer, H.; Onuchic, J. N. Topological and energetic factors: what determines the structural details of the transition state ensemble and "en-route" intermediates for protein folding? An investigation for small globular proteins. J. Mol. Biol. 2000, 298, 937–953
- Takada 2012 Takada, S. Coarse-grained molecular simulations of large biomolecules. Curr. Opin. Struct. Biol. 2012, 22, 130–7
- Ravikumar et al. 2012 Ravikumar, K. M.; Huang, W.; Yang, S. Coarse-grained simulations of protein-protein association: an energy landscape perspective. Biophys. J. 2012, 103, 837–45
- Indyk and Fisher 1998 Indyk, L.; Fisher, H. F. Theoretcial Aspects of Isothermal Titration Calorimetry. Methods Enzymol. 1998, 295, 350–364
- Ermak and McCammon 1978 Ermak, D. L.; McCammon, J. A. Brownian Dynamics with Hydrodynamic Interactions. J. Chem. Phys. 1978, 69, 1352–1360
- Hess et al. 2008 Hess, B.; Kutzner, C.; van der Spoel, D.; Lindahl, E. GROMACS 4:Algorithms for Highly Efficient, Load-Balanced, and Scalable Molecular Simulation. J. Chem. Theory Comput. 2008, 4, 435–447
- Essmann et al. 1995 Essmann, U.; Perera, L.; Berkowitz, M. L.; Darden, T.; Lee, H.; Pedersen, L. G. A smooth particle mesh Ewald method. J. Chem. Phys. 1995, 103, 8577–8593
- Wardell et al. 2002 Wardell, M.; Wang, Z.; Ho, J. X.; Robert, J.; Ruker, F.; Ruble, J.; Carter, D. C. The atomic structure of human methemalbumin at 1.9 A. Biochem. Biophys. Res. Commun. 2002, 291, 813–9
- Noel et al. 2010 Noel, J. K.; Whitford, P. C.; Sanbonmatsu, K. Y.; Onuchic, J. N. SMOGctbp: simplified deployment of structure-based models in GROMACS. Nucleic Acid Res. 2010, 38, W657–661
- Clementi et al. 2000 Clementi, C.; Nymeyer, H.; Onuchic, J. N. Topological and energetic factors: what determines the structural details of the transition state ensemble and “en-route“ intermediates for protein folding? an investigation for small globular proteins. J. Mol. Biol. 2000, 298, 937–953
- Isralewitz et al. 2001 Isralewitz, B.; Baudry, J.; Gullingsrud, J.; Kosztin, D.; Schulten, K. Steered molecular dynamics investigations of protein function. J. Mol. Graph. Model. 2001, 19, 13–25
- Neumann 1980 Neumann, R. M. Entropic approach to Brownian movement. Am. J. Phys. 1980, 48, 354–357
- Gilson and Zhou 2007 Gilson, M. K.; Zhou, H.-X. Calculation of protein-ligand binding affinities. Annu. Rev. Biophys. Biomol. Struct. 2007, 36, 21–42
- Kabiri and Unsworth 2014 Kabiri, M.; Unsworth, L. D. Application of Isothermal Titration Calorimetry for Characterizing Thermodynamic Parameters of Biomolecular Interactions : Peptide Self-Assembly and Protein Adsorption Case Studies. Biomacromolecules 2014, 15, 3463–3473
- Welsch et al. 2012 Welsch, N.; Becker, A. L.; Dzubiella, J.; Ballauff, M. Core-shell microgels as ’smart’ carriers for enzymes. Soft Matter 2012, 8, 1428
- Becker et al. 2011 Becker, A. L.; Welsch, N.; Schneider, C.; Ballauff, M. Adsorption of RNase A on cationic polyelectrolyte brushes: a study by isothermal titration calorimetry. Biomacromolecules 2011, 12, 3936–44
- Henzler et al. 2010 Henzler, K.; Lauterbach, K.; Wittemann, A.; Borisov, O.; Ballauff, M. Adsorption of -Lactoglobulin on Spherical Polyelectrolyte Brushes : Direct Proof of Counterion Release by Isothermal Titration Calorimetry. J. Am. Chem. Soc. 2010, 132, 3159–3163
- Record et al. 1973 Record, M. T.; Anderson, C. F.; Lohman, T. M. Thermodynamic analysis of ion effects on the binding and conformational equilibria of proteins and nucleic acids: the roles of ion association or release, screening, and ion effects on water activity. Q. Rev. Biophys. 1973, 11, 103
- Lammert et al. 2009 Lammert, H.; Schug, A.; Onuchic, J. N. Robustness and generalization of structure-based models for protein folding and function. Proteins: Structure, Function and Bioinformatics 2009, 77, 881–891
- Lund and Jungwirth 2008 Lund, M.; Jungwirth, P. Patchy proteins, anions and the Hofmeister series. J. Phys.: Condensed Matter 2008, 20, 494218