Checking Potassium origin of new emission line at 3.5 keV with K XIX line complex at 3.7 keV
Abstract
Whether the new line at 3.5 keV, recently detected in different samples of galaxy clusters, Andromeda galaxy and central part of our Galaxy, is due to Potassium emission lines, is now unclear. By using the latest astrophysical atomic emission line database AtomDB v. 3.0.2, we show that the most prospective method to directly check its Potassium origin will be the study of K XIX emission line complex at 3.7 keV with future X-ray imaging spectrometers such as Soft X-ray spectometer on-board Astro-H mission or microcalorimeter on-board Micro-X sounding rocket experiment. To further reduce the remaining (factor ) uncertainty of the 3.7/3.5 keV ratio one should perform more precise modeling including removal of significant spatial inhomogeneities, detailed treatment of background components, and further extension of the modeled energy range.
keywords:
X-rays: general – line: identification – techniques: imaging spectroscopy1 Introduction
In 2014, new emission line at 3.5 keV has been detected in X-ray spectra of various galaxy clusters and Andromeda galaxy (Bulbul et al., 2014b; Boyarsky et al., 2014c). Using publicly available emission line database AtomDB v.2.0.2 (Foster et al., 2012), Bulbul et al. (2014b) showed that intensities of individual atomic emission lines near 3.5 keV in spectra of different combinations of galaxy clusters are smaller by a factor than the detected flux of the extra line. Boyarsky et al. (2014c) showed that the radial profile of the new line in Perseus galaxy outskirts does not coincide with expected astrophysical line distribution. In addition, Boyarsky et al. (2014a) showed that the total expected flux from K XVIII lines at 3.5 keV is more than an order of magnitude smaller than the observed new line. So Bulbul et al. (2014b); Boyarsky et al. (2014c) argued against the astrophysical line origin of the detected line and suggested instead the radiative decay of dark matter particles. This new hypothesis was found consistent with subsequent detection of the 3.5 keV line in the Galactic Centre region (Boyarsky et al., 2014b; Lovell et al., 2014).
An alternative viewpoint has been presented in Riemer-Sorensen (2014); Jeltema & Profumo (2015, 2014); Carlson et al. (2015), see also Boyarsky et al. (2014a); Bulbul et al. (2014a); Iakubovskyi (2014) for discussion. In Riemer-Sorensen (2014), no extra line in XMM-Newton/EPIC spectrum of the Galactic Centre region is found after adding an extra line with an arbitrary normalization at 3.51 keV (the mean energy of K XVIII line emission at keV). Based on AtomDB v.2.0.2, Jeltema & Profumo (2015) compared intensities of bright emission lines from both the Galactic Centre region and the combined galaxy cluster sample of Bulbul et al. (2014b) and explained the observed 3.5 keV line with mild () K/Ca ratio with respect to Solar value. By styding Galactic Centre and Perseus cluster morphologies in different energy bands, Carlson et al. (2015) found positive correlation of 3.45-3.60 keV band with other bands with prominent Ar and Ca lines and no correlation with smooth dark matter profile. Based on these findings, Jeltema & Profumo (2015, 2014) argued that the line at 3.5 keV in Galactic Centre, the central part of the Perseus cluster and the combined galaxy cluster dataset of Bulbul et al. (2014b) is a mixture of K XVIII lines at 3.47 and 3.51 keV and therefore may have a purely astrophysical origin.
The goal of this paper is to further investigate possible Potassium origin of the 3.5 keV line. If the new line is due to Potassium emission lines in multi-temperature plasma as suggested by Jeltema & Profumo (2015, 2014); Carlson et al. (2015), several other Potassium lines should also be excited at keV energies and their intensities can be predicted using the method described in Sec. 2. In Sec. 3 we tabulated positions and expected intensities of these lines, and compared them with measured line properties in Perseus cluster and Galactic Centre. Our conclusions are summarized in Sec. 4.
2 Methods
The line flux for a multi-temperature apec (Smith et al., 2001) model with electron temperatures is
| (1) |
where is the line emissivity (in ), is the abundance of the line emitting element (with respect to Solar values adopted in Anders & Grevesse (1989)), is the apec model normalization (in cm-5), is the angular diameter distance to the source (in cm), is the source redshift, is the plasma emission measure (in cm-3) of -th thermal component. Using (1), one can determine the astrophysical flux of the new line from measured fluxes of bright astrophysical lines emitted by the other elements. Indeed, if one measures the flux of the bright “reference” line
| (2) |
one can rewrite the flux of the new line
| (3) |
through
| (4) |
Assuming abundances of all components to be the same (, ), one obtains more convenient expression used in Bulbul et al. (2014b); Jeltema & Profumo (2015); Bulbul et al. (2014a); Jeltema & Profumo (2014)
| (5) |
The predicted line flux linearly depends on the Potassium-to-metal abundance ratio which is not measured directly (due to absence of strong K lines) and has to be determined further, e.g. from chemical evolution models (Timmes et al., 1995; Romano et al., 2010) or optical (Shimansky et al., 2003; Andrievsky et al., 2010) or X-ray (Phillips et al., 2015) line studies. Possible difference of ratios among components in multi-temperature plasma (e.g. due to supernova ejecta) not discussed in Bulbul et al. (2014b); Jeltema & Profumo (2015); Bulbul et al. (2014a); Jeltema & Profumo (2014) will introduce further uncertainties to this method. As a result, it is very hard to robustly confirm or rule out the astrophysical origin of the new line.
Following Bulbul et al. (2014a); Jeltema & Profumo (2014), we avoid the above-mentioned uncertainty by studying emission lines of the same element so that and (4) simplifies:
| (6) |
To calculate line emissivities, we used the latest available version of astrophysical atomic emission line database AtomDB v.3.0.2. It contains much larger dataset of atomic emission lines of all elements from Hydrogen to Nickel (excluding Lithium and Beryllium) and updated information about line emissivities. Similar to AtomDB v2.0.2 used in previous papers (Bulbul et al., 2014b; Jeltema & Profumo, 2015; Boyarsky et al., 2014a; Bulbul et al., 2014a; Jeltema & Profumo, 2014), it is restricted to lines with emissivity .
To account the finite energy resolution of imaging spectrometers, we broadened each emission line with a Gaussian shape
where is the line position, is a energy dispersion (note that, for the Gaussian line full width at half-maximum (FWHM) of the line is defined as ). According to Fig. 5.24 of Iakubovskyi (2013), for the EPIC imaging spectrometers on-board XMM-Newton mission eV at keV. For comparison, we used future Astro-H/SXS spectrometer with FWHM eV (Mitsuda et al., 2014)111Similar energy resolution will be reached in Micro-X sounding rocket experiment (Figueroa-Feliciano et al., 2015) planning to observe the innermost part of our Galaxy.. Further Doppler broadening gives eV assuming gas bulk velocities for the Galactic Centre and the central part of Perseus cluster km/s (Tamura et al., 2014; Kitayama et al., 2014; Koyama et al., 2014).
3 Results
The main properties of Potassium emission lines above 1 keV and the adjacent emission lines of the other elements (S, Cl, Ar, Ca) are summarized in Table 1. In addition to K XVIII lines at 3.476, 3.496, 3.498, 3.500 and 3.515 keV, potentially responsible for the new 3.5 keV line, it also contains two rather bright K XIX lines at 3.700 and 3.706 keV surronded by rather strong Ar XVII lines at 3.683-3.685 keV, and two very weak ( times fainter than the K XVIII line complex at 3.51 keV) Potassium lines above 4 keV: K XVIII line at 4.125 keV and K XIX line at 4.389 keV. Below 1 keV, all Potassium lines fall into “line forest” region and are strongly subdominant.
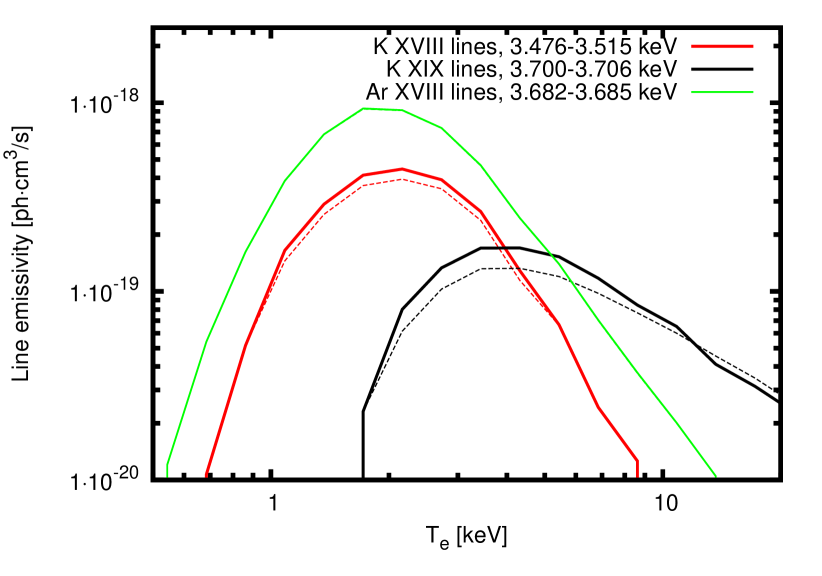
The emissivities of K XVIII (3.476-3.515 keV), K XIX (3.700-3.706 keV) and Ar XVII (3.683-3.685 keV) line complexes as fuctions of electron temperature are shown in Fig. 1, see also Fig. 8 of Urban et al. (2015) for AtomDB v. 2.0.2. For keV, 3.700-3.706 keV K XIX line signal becomes comparable or stonger than that of 3.476-3.515 keV K XVIII lines which should lead to significant detection of 3.7 keV line.
Fig. 1 shows that the 3.7/3.5 keV line ratio strongly depends on exact temperatures of individual components in thermal plasma. We illustrate this uncertainty with different models parameters of the Galactic Centre and Perseus cluster spectra. Jeltema & Profumo (2015) considered three models of Galactic Centre region: two-component with keV, keV and ; two-component with keV, keV and ; three-component with keV, keV, keV and . The corresponding 3.7/3.5 keV line ratios are 0.084, 0.189 and 0.276, respectively. Bulbul et al. (2014b) modeled MOS spectra of Perseus cluster and found keV, , keV, which gives 3.7/3.5 keV line ratio .
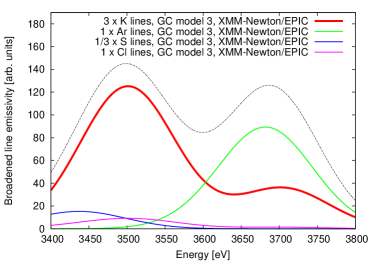
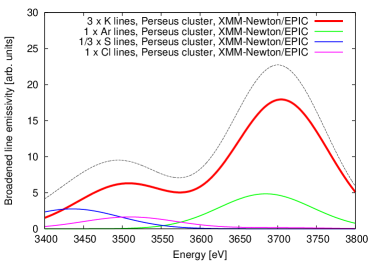
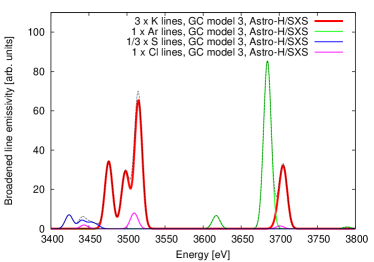
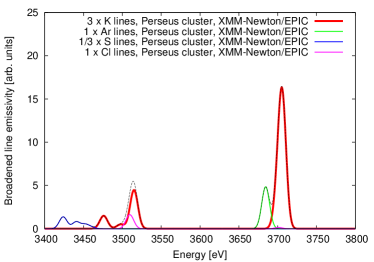
In addition to the factor 3-5 uncertainty in 3.7/3.5 keV line ratio for the Galactic Center and Perseus cluster, another uncertainty comes from strong contribution of Ar XVII lines at 3.683-3.685 keV located only 20 eV away from 3.700-3.706 keV K XIX line complex. We visualize the relative contributions of these lines by broadening line emissivities for Galactic Centre (three-component model of Jeltema & Profumo (2015)) and Perseus cluster (best-fit two-component model of Bulbul et al. (2014b) for combined MOS spectrum) with XMM-Newton/EPIC energy resolution, see Fig. 2 for details. In both sources, the S, Ar, Cl and K abundances ratio are set to 1/3 : 1 : 1 : 3, close to that obtained by Jeltema & Profumo (2015) for Galactic Centre region. This uncertainty can be avoided by using future instruments with higher energy resolution, see Fig. 3 for the planned Astro-H/SXS instrument and Micro-X sounding rocket experiment.
Existing stacked X-ray spectra of nearby galaxies and galaxy groups (Iakubovskyi, 2013; Anderson et al., 2014) did not allow to draw any conclusion about the astrophysical origin of the 3.5 keV line. Indeed, a simple (but abundance-dependent) estimate of Ar XVIII lines strength at 3.683-3.685 keV (dominating at low electron temperatures keV expected from Anderson et al. (2014) according to Fig. 1) can be made by using luminous S XV line complex at 2.45 keV, see e.g. Fig. 3 of Bulbul et al. (2014a) for AtomDB 2.0.2. An estimate with the newest AtomDB 3.0.2 gives the expected 2.45keV/3.68keV line flux ratio for keV. More precise (abundance-independent) estimate can be made using the brightest Ar XVII line complex at 3.10-3.14 keV which gives 3.14keV/3.68keV line flux ratio for keV.
| Position [eV] | Ion | Transition | Te range [keV] | Te,max [keV] | [] |
|---|---|---|---|---|---|
| 3423.78 | S XVI | 1.08–10.8 | 2.16 | 6.8/6.8/3.9 | |
| 3424.84 | S XVI | 1.08–21.6 | 2.16 | 13.8/13.8/9.4 | |
| 3440.48 | S XVI | 1.37–8.62 | 2.16 | 3.9/3.9/2.2 | |
| 3440.52 | S XVI | 1.08–13.7 | 2.16 | 8.7/8.7/6.0 | |
| 3443.61 | Cl XVI | 1.08–2.72 | 1.72 | 3.0/2.4/— | |
| 3451.92 | S XVI | 1.37–6.84 | 2.16 | 2.9/2.9/1.9 | |
| 3451.95 | S XVI | 1.37–10.8 | 2.16 | 5.1/5.1/3.4 | |
| 3460.11 | S XVI | 1.72–5.44 | 2.16 | 2.1/2.1/1.4 | |
| 3460.13 | S XVI | 1.37–6.84 | 2.16 | 3.0/3.0/2.0 | |
| 3475.94 | K XVIII | 0.862–5.44 | 2.16 | 11.8/11.8/3.5 | |
| 3496.43 | K XVIII | 1.08–3.43 | 2.16 | 3.4/3.4/— | |
| 3497.78 | K XVIII | 1.08–4.32 | 2.16 | 4.8/4.8/1.3 | |
| 3500.24 | K XVIII | 1.08–3.43 | 2.16 | 2.7/2.7/— | |
| 3508.66 | Cl XVII | 1.72–6.84 | 2.72 | 2.6/2.3/2.0 | |
| 3509.79 | Cl XVII | 1.37–13.7 | 2.72 | 5.8/5.0/3.9 | |
| 3514.99 | K XVIII | 0.684–8.62 | 2.16 | 21.9/21.9/8.1 | |
| 3521.93 | Cl XVI | 1.72–1.72 | 1.72 | 1.1/—/— | |
| 3616.91 | Ar XVI | 0.544–3.43 | 1.37 | 9.4/5.0/— | |
| 3617.65 | Ar XVI | 0.684–2.72 | 1.37 | 3.6/1.9/— | |
| 3682.78 | Ar XVII | 1.08–3.43 | 1.72 | 3.8/3.4/— | |
| 3684.52 | Ar XVII | 0.544–13.7 | 1.72 | 89.5/88.0/24.5 | |
| 3700.08 | K XIX | 2.16–10.8 | 3.43 | 3.8/1.9/3.7 | |
| 3701.19 | Cl XVII | 2.16–4.32 | 2.72 | 1.5/1.3/1.1 | |
| 3705.97 | K XIX | 1.72–34.3 | 4.32 | 13.3/6.2/13.3 | |
| 3787.74 | Ar XVI | 1.37–1.37 | 1.37 | 1.0/—/— | |
| 3788.9 | Ar XVI | 1.08–1.72 | 1.08 | 1.2/—/— | |
| 3789.25 | Ar XVI | 0.862–2.16 | 1.08 | 2.3/1.3/— | |
| 4100.12 | Ca XX | 1.37–68.4 | 4.32 | 109.7/28.9/109.7 | |
| 4105.44 | Ca XIX | 2.16–5.44 | 3.43 | 1.9/1.2/1.6 | |
| 4105.57 | Ca XIX | 2.16–5.44 | 3.43 | 2.4/1.5/2.0 | |
| 4105.84 | Ca XIX | 2.72–4.32 | 3.43 | 1.2/—/1.0 | |
| 4106.25 | Ca XIX | 3.43–3.43 | 3.43 | 1.1/—/— | |
| 4107.48 | Ca XX | 1.37–68.4 | 4.32 | 215.2/56.5/215.2 | |
| 4109.93 | Ca XIX | 2.16–4.32 | 3.43 | 1.7/1.0/1.4 | |
| 4110.88 | Ca XIX | 2.72–4.32 | 3.43 | 1.3/—/1.0 | |
| 4125.07 | K XVIII | 1.37–4.32 | 2.16 | 2.7/2.7/1.1 | |
| 4149.72 | Ar XVIII | 1.72–21.6 | 3.43 | 8.6/5.4/7.9 | |
| 4150.33 | Ar XVIII | 1.37–34.3 | 3.43 | 18.5/11.6/16.9 | |
| 4249.36 | Ar XVIII | 1.72–10.8 | 3.43 | 3.8/2.4/3.0 | |
| 4249.67 | Ar XVIII | 1.72–21.6 | 3.43 | 8.3/5.2/7.7 | |
| 4304.59 | Ar XVIII | 2.16–6.84 | 3.43 | 2.0/1.4/1.8 | |
| 4304.77 | Ar XVIII | 1.72–13.7 | 3.43 | 4.5/2.8/4.2 | |
| 4337.19 | Ar XVIII | 2.72–4.32 | 3.43 | 1.2/—/1.1 | |
| 4337.3 | Ar XVIII | 2.16–8.62 | 2.72 | 2.4/1.7/2.1 | |
| 4358.41 | Ar XVIII | 2.72–5.44 | 3.43 | 1.5/—/1.4 | |
| 4372.88 | Ar XVIII | 3.43–3.43 | 3.43 | 1.0/—/— | |
| 4388.76 | K XIX | 2.72–8.62 | 4.32 | 1.8/—/1.8 |
4 Conclusions
Determination of Potassium origin of the new line at 3.5 keV in thermal multi-component plasma suffers from several uncertainties, the most significant of them are the uncertainties of the plasma temperatures and of the relative element abundances among the thermal components. Future study of K XIX emission lines at 3.7 keV with high-resolution imaging spectometers such as SXS spectrometer on-board Astro-H mission (Mitsuda et al., 2014) or microcalorimeter on-board Micro-X sounding rocket experiment (Figueroa-Feliciano et al., 2015) can completely avoid the second uncertainty222If the new line position resolved by the future spectrometers falls off K XVIII lines that will be the clear signature of its non-Potassium origin..
To reduce the remaining uncertainty, one has to improve the thermal continuum modeling including removal of significant spatial inhomogeneities, detailed treatment of background components (such as instrumental background and residual soft proton flares for XMM-Newton/EPIC), and further extension of the modeled energy range (possibly including the data from other instruments).
Acknowledgements
The author thanks Michael E. Anderson for his comment about the detection of astrophysical lines in stacked galaxy spectra. This work was supported by part by the SCOPE grant IZ7370-152581 and the Program of Cosmic Research of the National Academy of Sciences of Ukraine.
References
- Anders & Grevesse (1989) Anders E., Grevesse N., 1989, Geochim. Cosmochim. Acta, 53, 197
- Anderson et al. (2014) Anderson M. E., Churazov E., Bregman J. N., 2014, preprint, (arXiv:1408.4115)
- Andrievsky et al. (2010) Andrievsky S. M., Spite M., Korotin S. A., Spite F., Bonifacio P., Cayrel R., François P., Hill V., 2010, A&A, 509, A88
- Boyarsky et al. (2014b) Boyarsky A., Franse J., Iakubovskyi D., Ruchayskiy O., 2014b, preprint, (arXiv:1408.2503)
- Boyarsky et al. (2014a) Boyarsky A., Franse J., Iakubovskyi D., Ruchayskiy O., 2014a, preprint, (arXiv:1408.4388)
- Boyarsky et al. (2014c) Boyarsky A., Ruchayskiy O., Iakubovskyi D., Franse J., 2014c, Physical Review Letters, 113, 251301
- Bulbul et al. (2014a) Bulbul E., Markevitch M., Foster A. R., Smith R. K., Loewenstein M., Randall S. W., 2014a, preprint, (arXiv:1409.4143)
- Bulbul et al. (2014b) Bulbul E., Markevitch M., Foster A., Smith R. K., Loewenstein M., Randall S. W., 2014b, ApJ , 789, 13
- Carlson et al. (2015) Carlson E., Jeltema T., Profumo S., 2015, JCAP, 2, 9
- Figueroa-Feliciano et al. (2015) Figueroa-Feliciano E., et al., 2015, preprint, (arXiv:1506.05519)
- Foster et al. (2012) Foster A. R., Ji L., Smith R. K., Brickhouse N. S., 2012, ApJ , 756, 128
- Iakubovskyi (2013) Iakubovskyi D., 2013, PhD thesis, Instituut-Lorentz for Theoretical Physics
- Iakubovskyi (2014) Iakubovskyi D. A., 2014, Advances in Astronomy and Space Physics, 4, 9
- Jeltema & Profumo (2014) Jeltema T., Profumo S., 2014, preprint, (arXiv:1411.1759)
- Jeltema & Profumo (2015) Jeltema T., Profumo S., 2015, MNRAS , 450, 2143
- Kitayama et al. (2014) Kitayama T., et al., 2014, preprint, (arXiv:1412.1176)
- Koyama et al. (2014) Koyama K., et al., 2014, preprint, (arXiv:1412.1170)
- Lovell et al. (2014) Lovell M. R., Bertone G., Boyarsky A., Jenkins A., Ruchayskiy O., 2014, preprint, (arXiv:1411.0311)
- Mitsuda et al. (2014) Mitsuda K., et al., 2014, in Society of Photo-Optical Instrumentation Engineers (SPIE) Conference Series. p. 2, doi:10.1117/12.2057199
- Phillips et al. (2015) Phillips K. J. H., Sylwester B., Sylwester J., 2015, preprint, (arXiv:1507.04619)
- Riemer-Sorensen (2014) Riemer-Sorensen S., 2014, preprint, (arXiv:1405.7943)
- Romano et al. (2010) Romano D., Karakas A. I., Tosi M., Matteucci F., 2010, A&A, 522, A32
- Shimansky et al. (2003) Shimansky V. V., Bikmaev I. F., Galeev A. I., Shimanskaya N. N., Ivanova D. V., Sakhibullin N. A., Musaev F. A., Galazutdinov G. A., 2003, Astronomy Reports, 47, 750
- Smith et al. (2001) Smith R. K., Brickhouse N. S., Liedahl D. A., Raymond J. C., 2001, ApJ , 556, L91
- Tamura et al. (2014) Tamura T., et al., 2014, ApJ , 782, 38
- Timmes et al. (1995) Timmes F. X., Woosley S. E., Weaver T. A., 1995, ApJS, 98, 617
- Urban et al. (2015) Urban O., Werner N., Allen S. W., Simionescu A., Kaastra J. S., Strigari L. E., 2015, MNRAS , 451, 2447