Superconducting High Pressure Phases Composed of Hydrogen and Iodine
Abstract
Evolutionary structure searches predict three new phases of iodine polyhydrides stable under pressure. Insulating -H5I, consisting of zigzag chains of (HI)δ+ and H molecules, is stable between 30-90 GPa. -H2I and -H4I are found on the 100, 150 and 200 GPa convex hulls. These two phases are good metals, even at 1 atm, because they consist of monoatomic lattices of iodine. At 100 GPa the of H2I and H4I are estimated to be 7.8 and 17.5 K, respectively. The increase in relative to elemental iodine results from a larger from the light mass of hydrogen, and an enhanced from modes containing H/I and H/H vibrations.
pacs:
74.70.-b, 74.62/Fj, 62.50.-p, 63.20.dk, 61.50.KsWe have only begun to uncover the affects of pressure on the stoichiometries, electronic structures and emergent behavior of condensed matter Grochala et al. (2007); Zurek and Grochala (2015). A number of phases with combinations that appear strange from a 1 atm perspective have been theoretically predicted and experimentally synthesized. These include hydrides with unique combinations such as LiH2 and LiH6 Zurek et al. (2009); Pépin et al. (2015), as well as HnS phases Strobel et al. (2011), some of which may have a superconducting transition temperature, K at 150 GPa Drozdov et al. ; Duan et al. (2014); Errea et al. (2015); Flores-Livas et al. , that surpasses those of the oxide-based high-temperature superconductors. Other predicted phases include sub- or polyhydrides containing an alkali or alkaline earth metal Baettig and Zurek (2011); Hooper and Zurek (2012a); Zurek et al. (2009); Hooper and Zurek (2012b, c); Shamp et al. (2012); Lonie et al. (2013); Hooper et al. (2013, 2014); Wang et al. (2012) and hydrides containing a Group 14 element Gao et al. (2008); Chen et al. (2008); Martinez-Canales et al. (2009, 2006); Pickard and Needs (2006); Yao and Klug (2010); Flores-Livas et al. (2012); Kim et al. (2008); Tse et al. (2007). Theory has suggested that some of these hydrides may be superconducting at high temperatures Wang et al. (2012), or contain unusual structural motifs such as the linear symmetric H anion – the simplest example of a three-center-four-electron bond Shamp et al. (2012).
Another example of unique stoichiometries that could potentially be synthesized under pressure are H2Cl and H5Cl Wang et al. (2015). They were predicted to become stable with respect to decomposition into H2 and HCl at 60 GPa, and remain so until at least 300 GPa. All of the HnCl phases contained zigzag [HCl]∞ chains reminiscent of those present within HCl. The three-center-two-electron (3c-2e) H motif, which approached the ideal equilateral triangle configuration by 300 GPa, was incorporated within H5Cl. How would decreasing the electronegativity of the dopant atom affect the stable crystal lattices and their electronic structures? To answer this question we theoretically studied the iodine polyhydrides, HnI. A further motivation for our work: it has been proposed that pressure can be used to synthesize alloys of metallic hydrogen with the general formula (H2)1-xHIx that are potentially superconducting Straaten and Silvera (1986). Moreover, HI undergoes a pressure induced insulator to metal transition below 50 GPa Straaten and Silvera (1986), and iodine becomes metallic at 16 GPa Riggleman and Drickamer (1963a) and superconducting below 1.2 K at 28 GPa Shimizu et al. (1994).
The isomorphic low temperature phases of HF, HCl and HBr contain planar zigzag chains of hydrogen-bonded molecules held together by weak van der Waals (vdW) forces. HI assumes a planar distorted hydrogen-bonded diamond lattice, but its detailed structure is not known Ikram et al. (1993). Density functional theory (DFT) calculations have been undertaken to study the structural evolution of the heavier hydrogen halides up to 200 GPa Zhang et al. (2010). But, because the phases of HI under pressure are unknown we proceeded to find the global minimum structures from 0-200 GPa in 50 GPa intervals using the evolutionary algorithm (EA) XtalOpt Lonie and Zurek (2011) coupled with PBE-DFT Perdew et al. (1996) calculations carried out with VASP Kresse and Hafner (1993). More information about the computational details is provided in the Supplemental Material, SI HnI . The most stable structures that emerged in our EA searches were comprised of 2D segregated layers of H2 and iodine, implying that HI is metastable with respect to these constituents. In addition, we optimized geometries where HI assumed the experimentally determined and theoretically predicted low-temperature structures of the lighter hydrogen halides Zhang et al. (2010). All of these were less stable than the H2/I segregated phases. These results suggest that the impurities and side-products observed upon compression of HI above 70 GPa Straaten and Silvera (1988) may have been due to decomposition of the halide. A previous theoretical study found that HBr was unstable with respect to decomposition into H2 and Br2 between 120-150 GPa Zhang et al. (2010). At these pressures bromine is monoatomic, as is iodine, and it should not be unexpected that HI behaves similarly but at lower pressures.

EA runs were carried out to find the most stable crystal lattices of HnI ( = 2-9) at 50, 100, 150 and 200 GPa. The structural motifs present in the hydrogen-rich iodine phases that emerged from our searches fall into one of two categories: Iδ+, Hδ+, and H molecules as found in H5I, or Iδ+ and H molecules as found in H2I and H4I. In Ref. Wang et al. (2015) it was shown that density functionals approximating the effects of vdW interactions, and zero-point-energy contributions to the enthalpies both altered the transition pressures between the most stable HnCl phases slightly, but they did not affect the identify of the phases nor their stability. For this reason we also expect them to have a negligible effect on our results.
Fig. 1 shows the of the predicted phases with respect to the elemental solids. The convex hull is defined as the set of line segments below which no other points lie, and the phases whose comprise the hull are thermodynamically stable with respect to decomposition into other polyhydrides and/or solid H2 and iodine. At 50 GPa H5I is the only species on the hull. This stoichiometry becomes stable with respect to decomposition into H2 and I at 30 GPa and it has the most negative of any of the structures examined until 90 GPa. At this pressure the H2I stoichiometry becomes the lowest point on the hull and remains so until at least 200 GPa. H4I also comprises the 100, 150 and 200 GPa hulls. At 200 GPa the of all of the phases continues to decrease. Even though some of the stoichiometries predicted to be stable in our calculations were also found in the hydrogen rich H/Cl phase diagram under pressure Wang et al. (2015), the structures adopted and their properties are distinct, highlighting the importance of the electronegativity (2.66 for I and 3.16 for Cl on the Pauling scale) and radius (1.98 Å for I and 1.75 Å for Cl) of the halogen atom on the emerging structures and their properties. Importantly, whereas the HnCl structures were not superconducting Wang et al. (2015), we predict that electricity may pass without resistance through H2I and H4I below 7.8 and 17.5 K at 100 GPa, respectively.
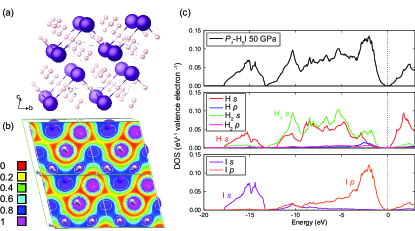
The most stable H5I phase possessed symmetry up to 90 GPa, and it assumed symmetry at higher pressures. Above 150 GPa another phase, containing only molecular hydrogen, became preferred, but it did not fall on the convex hull. Phonon calculations at 50 GPa verified the dynamic stability of -H5I. Just like the HnCl phases predicted in Ref. Wang et al. (2015), H5I contained zigzag [HX]∞ (X=Cl, I) chains that resembled those found in HCl, HBr, and HI at low temperatures Zhang et al. (2010). These chains lay parallel to the crystallographic -axis in -H5I, as illustrated in Fig. 2. At 50 GPa the H-I distances along the chains were nearly equivalent, 1.795 and 1.788 Å, indicative of pressure induced multi-center bonding, which has also been observed in HX (X=F, Cl, Br) Zhang et al. (2010) and H2Cl Wang et al. (2015). The H-I-H and I-H-I angles measured 85.7-85.8∘ and 179.4-179.8∘. The chains arranged to form sheets that were surrounded by layers of H2 units in which the H-H bond measured 0.747 Å, which is nearly identical to what we calculate for the isolated gas phase molecule at 1 atm, 0.750 Å. Actually, six H2 molecules surround half of the hydrogen atoms in the [HI]∞ chains in a “side-on” fashion. In our previous studies we found a number of structures where H2 encircled the electropositive metal in this same manner, for example in MgH12 and MgH16 Lonie et al. (2013). A Bader charge analysis revealed that the charge on the hydrogen and iodine atoms in the H-I chains are +0.03 and +0.12, respectively. This can be compared to -0.01 and +0.01 for the hydrogen and iodine atoms in a hypothetical HI phase at 50 GPa whose symmetry was chosen because HF, HCl and HBr assume this structure at ambient pressure. All of the hydrogen atoms in the H2 molecules were found to bear a slight negative charge such that the average is (H-0.04)2. The distance between the hydrogen atoms comprising H2 and the hydrogen atoms in the H-I chains ranged from 1.950-2.022 Å and the closest iodine atom was at least 2.273 Å away. This suggests that the H2 molecules do not interact strongly with any of the atoms comprising the [HI]∞ zigzag chains. Indeed, the H2 vibron frequency ranged from 4150-4250 cm-1, which compares well with the 4161 cm-1 observed for gaseous H2 at 1 atm Stoicheff (1957). To probe this further, we calculated the electron localization function (ELF) for -H5I at 50 GPa, see Fig. 2(b). The ELF reveals a high tendency of electron pairing within the H units and along the nearly symmetric [HI]∞ chains. In fact, the ELF along the chains is reminiscent of the one calculated for symmetric HBr at 30 GPa Zhang et al. (2010).
-H5Cl was found to be a stable structure in the hydrogen rich H/Cl phase diagram between 100-300 GPa Wang et al. (2015). By 300 GPa H, the simplest example of a 3c-2e bond, emerged in this phase. The bond lengths (0.89 Å) and angles (60∘) in the solid approached those in the gas phase species, and signatures of H vibrations were observed in the phonon DOS between 1800-3400 cm-1. We do not see any evidence for the formation of H within H5I up to at least 200 GPa.
At 50 GPa -H5I is insulating with a PBE band gap of 0.5 eV, see Fig. 2(b). The I -states overlap primarily with the Hδ+ -states, whereas I -character is found in a region containing both H and Hδ+ contributions. Metalization occurs as a result of pressure induced broadening of the valence band, primarily of iodine -character, and the conduction band, which exhibits mainly Hδ+ -character, by 65 GPa within PBE. But, because GGA functionals underestimate the pressure associated with band gap closure it is likely that this phase would metalize at a pressure outside the stability range of the H5I stoichiometry. For comparison, HCl and HBr were computed to be metallic by 130 and 80 GPa, and the bands at were primarily of halogen -character Zhang et al. (2010).
Between 90-200 GPa a H2I phase with symmetry had the most negative , and phonon calculations revealed that it was dynamically stable at 100 GPa. This structure was found to be the most stable H2I arrangement in evolutionary searches performed at 50-200 GPa. Two rows of H2 molecules arranged in a zigzag fashion run through channels formed by the iodine host within this structure, see Fig. 3(a). At 100 GPa the hydrogen molecules measured 0.796 Å and the distance between them 1.399 Å, as compared with 0.732 and 1.495 Å in solid H2 at this pressure. The I-I contacts measured between 2.896-2.904 Å, which is very close to the 2.899-2.920 Å we compute within iodine at 100 GPa. The shortest H-I contacts were 2.097 Å, suggesting little interaction between the constituents of the two lattices. -H2I bears no resemblance to the H2Cl phase that was predicted to be stable by 100 GPa Wang et al. (2015). High ELF values were calculated between the hydrogens comprising the H molecules. Similar to compressed solid iodine, a large ELF between the iodine atoms was not observed. A Bader analysis showed that charge is transferred from iodine to hydrogen, (H-0.07)2 I0.13, at 100 GPa. By 200 GPa the H2 bonds within -H2I stretch slightly to 0.817 Å and the distance between them shrinks to 1.198 Å. This suggests that if -H2I is stable at higher pressures, these chains may polymerize resulting in a 1-D hydrogenic motif, as has been predicted for -SrH6 by 250 GPa Hooper et al. (2014).
A symmetry H4I structure also comprised the 100 GPa convex hull, and it was found to be the most stable H4I phase between 90-200 GPa. Phonon calculations revealed dynamic stability at 100 and 150 GPa. This phase is composed of 1-D chains of iodine atoms with an I-I distance of 2.812 Å and H2 molecules measuring 0.799 Å, both lying parallel to the -axis as illustrated in Fig. 3(b). The intermolecular distances between the dihydrogen molecules (1.875-2.013 Å) and between H-I (2.13 Å) are too long for bonding interactions. Similar to H2I, the iodine donates electrons (the Bader charges are (H-0.05)4I0.21), and the ELF indicates high electron localization only within the dihydrogen molecules. At 200 GPa the H2 units are not yet close enough to polymerize.

The total and projected DOS plots for -H2I and -H4I at 100 GPa resemble each other, see Fig. 3, which is not surprising considering their structural similarities. Both phases are good metals with the DOS at being 0.061 and 0.049 eV-1 states/(valence electron), respectively. The DOS can be split up into 3 regions: -13 eV, -13 to -5 eV and above -5 eV it is primarily of I , H2 and I -character, respectively, but the H2 -states have a large degree of overlap with both iodine and . The metallicity is primarily due to the iodine -states, but for 100 GPa the hydrogenic states also provide a substantial contribution to the DOS at .
Pressure causes the intramolecular I-I bond in -I2 to stretch, and the intermolecular distances to decrease. At 16 GPa this phase undergoes an insulator to metal transition Riggleman and Drickamer (1963a), which is superseded by an incommensurate phase at 23 GPa and the formation of a monoatomic phase within which the I-I distances are “equalized” by 30 GPa Kenichi et al. (2003). Experiments yielded a bond length of 2.75 Å at ambient conditions, whereas the nearest neighbor bonds in the fully dissociated monoatomic crystal measured 2.89 Å Kenichi et al. (2003). In our calculations bond equalization occurs near 35 GPa with I-I distances of 2.98 Å. Interestingly, we find that -H2I and -H4I are already metallic at 1 atm, and the DOS at exhibits primarily iodine -character. The metallicity is a result of the monoatomic iodine present in these phases at ambient conditions, wherein the nearest-neighbor distances are found along 1-D chains measuring 2.93 Å.
Experimental measurements yield a of 1.2 K at 28 GPa for iodine Shimizu et al. (1994). Theory has shown that under hydrostatic conditions decreases with increasing pressure, falling to 1 K above 100 GPa Suzuki et al. (1996); Duan et al. (2009). Our calculations for the phase of iodine using the Allen-Dynes modified McMillan equation Allen and Dynes (1975) yield values that are in agreement with these studies, see Table 1. They further confirm that the logarithmic average frequency, , which is low due to the heavy mass of iodine, increases slightly with pressure Duan et al. (2009). But the decrease in the electron-phonon coupling, , with increasing pressure dominates, leading to a drop in at higher pressures.
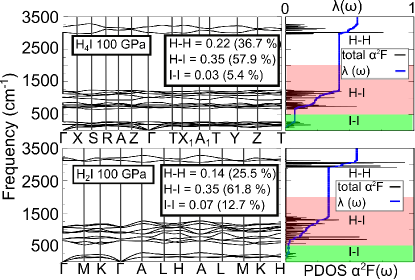
What effect would incorporation of H2 within lattices consisting of monoatomic iodine, in the geometries adopted by H2I and H4I, have on , and ? At 100 GPa we find that becomes larger as the H:I ratio increases, see Table 1, because of the light mass of hydrogen. In addition, the of H4I is slightly larger than that of H2I, and these are both significantly larger than that of pure iodine. The most significant contribution towards in both of the iodine polyhydrides stems from vibrational modes between 450-1300 cm-1 that involve both hydrogen and iodine motions, with the hydrogen vibron also contributing substantially towards , see Fig. 4. Vibrations that involve only the iodine atoms do not contribute much to the total electron phonon coupling. The computed of the iodine polyhydrides for , 7.8 and 17.5 K for H2I and H4I at 100 GPa, is significantly larger than that of monoatomic iodine because H2 increases both and .
We also examined the effect of pressure on the of H4I. At 150 GPa the was computed to increase to 20.4 K as a result of the larger , which is due to the larger frequency range of the iodine and mixed iodine-hydrogen vibrational modes. In contrast, the frequency associated with the H2 vibron decreased slightly with increasing pressure as a result of bond weakening within the hydrogen molecule, which measured 0.794 and 0.806 Å at 100 and 150 GPa, respectively. A Bader analysis revealed that the softening of the hydrogen vibron can be attributed at least in part to the increased electron donation from iodine to H at higher pressures, which lengthens this bond. The slight decrease in the electron-phonon coupling with increasing pressure stems primarily from the smaller values of associated with modes arising from motions involving iodine atoms. In contrast, the associated with the H2 stretch increased slightly under pressure.
| System | Pressure (GPa) | (K) | T (K) | T (K) | |
|---|---|---|---|---|---|
| H2I | 100 | 0.51 | 608.7 | 7.8 | 4.8 |
| H4I | 100 | 0.58 | 854.3 | 17.5 | 12.0 |
| H4I | 150 | 0.56 | 1097.4 | 20.4 | 13.7 |
| I | 100 | 0.31 | 251.6 | 0.16 | 0.03 |
| I | 150 | 0.25 | 304.5 | 0.02 | 0.00 |
In conclusion, evolutionary searches have identified three hitherto unknown iodine polyhydride phases with unique stoichiometries that become thermodynamically and dynamically stable above 30 GPa. -H5I, composed of zigzag [(HI) chains and H molecules, is found on the 50 GPa convex hull and has the lowest of any phase examined until 90 GPa. Metalization occurs as a result of pressure induced broadening of the iodine and hydrogen -states, at pressures likely outside of the stability range of this structure. The DOS at suggests that the of this phase is likely to be low. -H2I and -H4I both lie on the 100, 150 and 200 GPa convex hulls. They are comprised of monoatomic iodine lattices that render these phases metallic by 1 atm, and H2 molecules. A Bader analysis suggests a slight transfer of charge from iodine to H2. The metallicity persists as H2I and H4I become dynamically and thermodynamically stable phases. The DOS at is primarily due to the iodine -states, with an admixture of hydrogen . At 100 GPa the of H2I and H4I is estimated as being 7.8 and 17.5 K, respectively. The presence of H2 significantly enhances in comparison to pure iodine because the light atomic mass of hydrogen increases , and because vibrations involving H and I atoms, as well as the H2 vibron, contribute substantially to . As the quest for high-temperature superconductivity in hydrides gains momentum, we look forward to the eventual synthesis of these, and other intriguing phases.
We acknowledge the NSF (DMR-1505817) for financial, and the Center for Computational Research (CCR) at SUNY Buffalo for computational support. A.S. acknowledges financial support from the Department of Energy National Nuclear Security Administration under Award Number DE-NA0002006, and E.Z. thanks the Alfred P. Sloan Foundation for a research fellowship (2013-2015). We thank Duck Young Kim for fruitful discussions.
References
- Grochala et al. (2007) W. Grochala, R. Hoffmann, J. Feng, and N. W. Ashcroft, Angew. Chem. Int. Ed. 46, 3620 (2007).
- Zurek and Grochala (2015) E. Zurek and W. Grochala, Phys. Chem. Chem. Phys. 17, 2917 (2015).
- Zurek et al. (2009) E. Zurek, R. Hoffmann, N. W. Ashcroft, A. R. Oganov, and A. O. Lyakhov, Proc. Natl. Acad. Sci. 106, 17640 (2009).
- Pépin et al. (2015) C. Pépin, P. Loubeyre, F. Occelli, and P. Dumas, Proc. Natl. Acad. Sci. 112, 7673 (2015).
- Strobel et al. (2011) T. A. Strobel, P. Ganesh, M. Somayazulu, P. R. C. Kent, and R. J. Hemley, Phys. Rev. Lett. 107, 255503 (2011).
- (6) A. P. Drozdov, M. I. Eremets, and I. A. Troyan, Conventional superconductivity at 190 k at high pressures, arXiv:1412.0460.
- Duan et al. (2014) D. Duan, Y. Liu, F. Tian, D. Li, X. Huang, Z. Zhao, H. Yu, B. Liu, W. Tian, and T. Cui, Sci. Rep. 4, 6968 (2014).
- Errea et al. (2015) I. Errea, M. Calandra, C. J. Pickard, J. Nelson, R. J. Needs, Y. Li, H. Liu, Y. Zhang, Y. Ma, and F. Mauri, Phys. Rev. Lett. 114, 157004 (2015).
- (9) J. A. Flores-Livas, A. Sanna, and E. K. U. Gross, High temperature superconductivity in sulfur and selenium hydrides at high pressure, arXiv:1501.06336.
- Baettig and Zurek (2011) P. Baettig and E. Zurek, Phys. Rev. Lett. 106, 237002 (2011).
- Hooper and Zurek (2012a) J. Hooper and E. Zurek, ChemPlusChem 77, 969 (2012a).
- Hooper and Zurek (2012b) J. Hooper and E. Zurek, Chem–Eur. J. 18, 5013 (2012b).
- Hooper and Zurek (2012c) J. Hooper and E. Zurek, J. Phys. Chem. C 116, 13322 (2012c).
- Shamp et al. (2012) A. Shamp, J. Hooper, and E. Zurek, Inorg. Chem. 51, 9333 (2012).
- Lonie et al. (2013) D. Lonie, J. Hooper, B. Altintas, and E. Zurek, Phys. Rev. B 87, 054107 (2013).
- Hooper et al. (2013) J. Hooper, B. Altintas, A. Shamp, and E. Zurek, J. Phys. Chem. C 117, 2982 (2013).
- Hooper et al. (2014) J. Hooper, T. Terpstra, A. Shamp, and E. Zurek, J. Phys. Chem. C 118, 6433 (2014).
- Wang et al. (2012) H. Wang, J. S. Tse, K. Tanaka, T. Iitaka, and Y. Ma, Proc. Natl. Acad. Sci. USA 109, 6463 (2012).
- Gao et al. (2008) G. Gao, A. R. Oganov, A. Bergara, M. Martinez-Canales, T. Cui, T. Iitaka, Y. Ma, and G. Zou, Phys. Rev. Lett. 101, 107002 (2008).
- Chen et al. (2008) X. Chen, J. Wang, V. V. Struzhkin, H. Mao, R. J. Hemley, and H. Lin, Phys. Rev. Lett. 101, 077002 (2008).
- Martinez-Canales et al. (2009) M. Martinez-Canales, A. R. Oganov, Y. Ma, Y. Yan, A. O. Lyakhov, and A. Bergara, Phys. Rev. Lett. 102, 087005 (2009).
- Martinez-Canales et al. (2006) M. Martinez-Canales, A. Bergara, J. Feng, and W. Grochala, J. Phys. Chem. Solids 67, 2095 (2006).
- Pickard and Needs (2006) C. J. Pickard and R. J. Needs, Phys. Rev. Lett. 97, 045504 (2006).
- Yao and Klug (2010) Y. Yao and D. D. Klug, Proc. Natl. Acad. Sci. USA 107, 20893 (2010).
- Flores-Livas et al. (2012) J. A. Flores-Livas, M. Amsler, T. J. Lenosky, L. Lehtovaara, S. Botti, M. A. L. Marques, and S. Goedecker, Phys. Rev. Lett. 108, 117004 (2012).
- Kim et al. (2008) D. Y. Kim, R. H. Scheicher, S. Lebegue, J. Prasongkit, B. Arnaud, M. Alouani, and R. Ahuja, Proc. Natl. Acad. Sci. 105, 16454 (2008).
- Tse et al. (2007) J. S. Tse, Y. Yao, and K. Tanaka, Phys. Rev. Lett. 98, 117004 (2007).
- Wang et al. (2015) Z. Wang, H. Wang, J. S. Tse, T. Iitaka, and Y. Ma, Chem. Sci. 6, 522 (2015).
- Straaten and Silvera (1986) J. Straaten and I. F. Silvera, Phys. Rev. Lett 57, 766 (1986).
- Riggleman and Drickamer (1963a) B. M. Riggleman and H. G. Drickamer, J. Chem. Phys. 38, 2721 (1963a).
- Shimizu et al. (1994) K. Shimizu, T. Yamauchi, N. Tamitani, N. Takeshita, M. Ishizuka, K. Amaya, and S. Endo, J. Supercond. 7, 921 (1994).
- Ikram et al. (1993) A. Ikram, I. Torrie, and B. M. Powell, Mol. Phys. 79, 1037 (1993).
- Zhang et al. (2010) L. Zhang, Y. Wang, X. Zhang, and Y. Ma, Phys. Rev. B 82, 014108 (2010).
- Lonie and Zurek (2011) D. C. Lonie and E. Zurek, Comput. Phys. Commun. 182, 372 (2011).
- Perdew et al. (1996) J. P. Perdew, K. Burke, and M. Ernzerhof, Phys. Rev. Lett. 77, 3865 (1996).
- Kresse and Hafner (1993) G. Kresse and J. Hafner, Phys. Rev. B 47, 558 (1993).
- (37) See the Supplemental Material at http://link.aps.org/supplemental/xxx for further details of the computations, bands structures, structural parameters, and DOS plots.
- Straaten and Silvera (1988) J. Straaten and I. F. Silvera, J. Chem. Phys. 88, 478 (1988).
- Pickard and Needs (2007) C. J. Pickard and R. J. Needs, Nat. Phys. 3, 473 (2007).
- Shimomura et al. (1978) C. Shimomura, K. Takemura, Y. Fujii, S. Minomura, M. Mori, Y. Noda, and Y. Yamada, Phys. Rev. B 18, 715 (1978).
- Takemura et al. (1980) K. Takemura, S. Minomura, O. Shimomura, and Y. Fujii, Phys. Rev. Lett. 45, 1881 (1980).
- Fujii et al. (1986) Y. Fujii, K. Hase, Y. Ohishi, N. Hamaya, and A. Onodera, Solid State Commun. 59, 85 (1986).
- Fujii et al. (1987) Y. Fujii, K. Hase, N. Hamaya, Y. Ohishi, A. Onodera, O. Shimomura, and K. Takemura, Phys. Rev. Lett. 58, 796 (1987).
- Kenichi et al. (2003) T. Kenichi, S. Kyoko, F. Hiroshi, and O. Mitsuko, Nature 423, 971 (2003).
- Stoicheff (1957) B. P. Stoicheff, Can. J. Phys. 35, 730 (1957).
- Suzuki et al. (1996) N. Suzuki, H. Sakamoto, T. Oda, and M. Shirai, Physica B 219 & 220, 454 (1996).
- Duan et al. (2009) D. Duan, X. Jin, Y. Ma, T. Cui, B. Liu, and G. Zou, Phys. Rev. B 79, 064518 (2009).
- Allen and Dynes (1975) P. B. Allen and R. C. Dynes, Phys. Rev. B 12, 905 (1975).