Milky Way scattering properties and intrinsic sizes of active galactic nuclei cores probed by very long baseline interferometry surveys of compact extragalactic radio sources
Abstract
We have measured the angular sizes of radio cores of active galactic nuclei (AGN) and analyzed their sky distributions and frequency dependencies to study synchrotron opacity in AGN jets and the strength of angular broadening in the interstellar medium. We have used archival very long baseline interferometry (VLBI) data of more than 3000 compact extragalactic radio sources observed at frequencies, , from 2 to 43 GHz to measure the observed angular size of VLBI cores. We have found a significant increase in the angular sizes of the extragalactic sources seen through the Galactic plane () at 2, 5 and 8 GHz, about of which show significant scattering. These sources are mainly detected in directions to the Galactic bar, the Cygnus region, and a region with galactic longitudes (the Fitzgerald window). The strength of interstellar scattering of the AGNs is found to correlate with the Galactic H intensity, free-electron density, and Galactic rotation measure. The dependence of scattering strengths on source redshift is insignificant, suggesting that the dominant scattering screens are located in our Galaxy. The observed angular size of Sgr A∗ is found to be the largest among thousands of AGN observed over the sky; we discuss possible reasons of this strange result. Excluding extragalactic radio sources with significant scattering, we find that angular size of opaque cores in AGN scales typically as confirming predictions of a conical synchrotron jet model with equipartition.
keywords:
galaxies: active – galaxies: jets – scattering – Galaxy: center – individual: Sgr A∗1 Introduction
Radio waves emitted by a compact background radio source are influenced by propagation effects whenever passing through an ionized medium containing free-electron density fluctuations . Diffraction phenomena associated with scattering results in the angular broadening of a compact bright source, the scattered size of which scales as , where depending on the form of the spatial power spectrum of electron density turbulence (e.g., Goodman & Narayan, 1985; Cordes et al., 1986). If no scattering is present, the observed angular size of opaque cores (i.e., apparent jet base) in AGN is expected to scale approximately as (Blandford & Königl, 1979; Königl, 1981, see Sect. 4.2 for model assumptions). Departures from this dependence are also possible and can be caused by pressure and density gradients in the jet or by external absorption from the surrounding medium (Lobanov, 1998; Kovalev et al., 2008; Sokolovsky et al., 2011; Pushkarev et al., 2012, and references therein). This theoretical expectation has never been confirmed statistically by observations of large samples of AGN radio cores.
Based on theoretical models, intergalactic scattering is negligible and can be barely detected with either space VLBI or a low-frequency interferometer. In the most optimistic scenario, when a background radio source intersects a galaxy halo with overdensity 1000 relative to the mean baryon density of the Universe and the outer scale of turbulence 1 kpc, the scatter broadening contribution by the intergalactic medium would be about 0.1 mas at 2 GHz (Koay & Macquart, 2015). Therefore, the angular broadening is expected to be strongly dominated by interstellar scattering in the Galaxy.
After about two decades since the VLBA’s commissioning in 1994 (Napier et al., 1994), thousands of active galactic nuclei have been observed to date with VLBA and global VLBI arrays at many frequency bands (see for details Sect. 2), thereby making possible the investigation of the scattering properties within and outside of the Galactic plane. Particularly useful are massive dual-band truly simultaneous 2.3 and 8.4 GHz VLBI observations originally driven by astrometric and geophysical applications. We use these results to (i) investigate scattering properties of Milky Way, and (ii) measure scatter-free frequency dependence of core sizes in AGN jets and compare it with theoretical predictions.
2 Multi-frequency data and measurements of AGN core sizes
For the purposes of our analysis we made use of data from the Radio Fundamental Catalog (RFC111http://astrogeo.org/rfc) that comprises all sources observed with the VLBI under absolute astrometry and geodesy programs from 1980 through 2014 as well as other major VLBI surveys, described below. As the observed AGN are highly variable objects, we need data taken simultaneously at different frequencies to analyze the effect of angular broadening. Therefore, we used the truly simultaneous, the most complete and deep survey data at S and X-bands centered at 2.3 and 8.4 GHz, respectively. The frequencies are rounded to integer values later in the text for simplicity. These data were mostly obtained within the VLBA Calibrator Survey (VCS; Beasley et al., 2002; Fomalont et al., 2003; Petrov et al., 2005, 2006; Kovalev et al., 2007; Petrov et al., 2008) and Research & Development – VLBA (RDV; Petrov et al., 2009) observing sessions (e.g., Pushkarev & Kovalev, 2012; Piner et al., 2012). A total of 11607 epochs of observations were used to observe the 3778 sources with declinations above at 2 GHz, while a total of 12142 epochs were used to observe 4096 sources distributed over the entire sky at 8 GHz. Additionally, we made some use of data at 5 GHz mainly coming from the VLBI Imaging and Polarimetry Survey (VIPS; Helmboldt et al., 2007; Petrov & Taylor, 2011), and the VLBA Calibrator Survey (VCS-7, VCS-8; Petrov, in prep.); at 8 GHz from the VLBA+GBT observing program for Fermi-AGN associations (Kovalev & Petrov, 2011); at 15 GHz from the VLBA 2 cm Survey (Kellermann et al., 1998; Kellermann et al., 2004), the Monitoring Of Jets in Active galactic nuclei with VLBA Experiments (MOJAVE; Lister et al., 2009; Lister et al., 2013); at 24 GHz from the VLBI Exploration of Radio Astrometry (VERA) and VLBA K-band (Petrov et al., 2007; Petrov et al., 2012) and the ICRF at higher frequencies (Charlot et al., 2010); at 43 GHz from the QCAL-1 43 GHz Calibrator Survey (Petrov et al., 2012) and the VLBA-BU Blazar Monitoring Program222http://www.bu.edu/blazars/VLBAproject.html.
Parsec-scale morphology of AGN probed by VLBI observations is typically represented by a one-sided core-jet structure, with a compact core that dominates the total flux density, and a weaker outflow that quickly dims downstream. Therefore, a model of two circular Gaussian components has been fitted to the self-calibrated visibility data for all sources, with the most compact component assigned as the VLBI core following the approach by Kovalev et al. (2005).
| , GHz | |||
|---|---|---|---|
| (1) | (2) | (3) | (4) |
| 2.3 | 2888 | ||
| 5.0 | 2108 | ||
| 8.4 | 3019 | ||
| 15.4 | 513 | 0.61 | |
| 24.4 | 402 | 0.43 | |
| 43.1 | 119 | 0.31 |
Note: is the number of sources, is the probability that the correlation occurred by chance.
| Name | (deg) | (deg) | (mas) | (mas) | (mas) | (mas) | (mas) | (mas) | |
| (1) | (2) | (3) | (4) | (5) | (6) | (7) | (8) | (9) | (10) |
| J00003221 | 77.752 | 357.466 | 1.275 | 0.98 | … | 0.45 | … | … | … |
| J00004054 | 20.968 | 112.163 | … | 3.65 | … | 2.90 | … | … | … |
| J00011456 | 46.228 | 104.539 | 0.399 | … | 1.16 | … | … | … | … |
| J00011914 | 42.054 | 105.998 | 3.100 | 0.94 | … | 0.19 | … | … | … |
| J00014440 | 17.292 | 113.181 | … | … | 0.46 | … | … | … | … |
| J00016051 | 1.419 | 116.869 | … | 4.30 | … | 1.02 | … | … | … |
| J00022153 | 77.642 | 52.802 | … | … | … | 0.24 | … | … | … |
| J00031547 | 74.105 | 75.364 | 0.508 | … | … | 0.54 | … | … | … |
| J00031927 | 76.560 | 63.669 | 2.000 | 1.52 | … | 0.94 | … | … | … |
| J00032129 | 40.002 | 107.437 | 0.450 | … | … | 0.34 | 0.17 | … | … |
Columns are as follows: (1) source name in J2000.0 notation; (2) Galactic latitude; (3) Galactic longitude; (4) redshift from the continuously updated OCARS database at http://www.gao.spb.ru/english/as/ac_vlbi/ocars.txt. Reference to original redshift data can be found in this compilatory database, description of which is given in Malkin & Titov (2008); (5)–(10) FWHM of the fitted circular Gaussian at 2, 5, 8, 15, 24, and 43 GHz, respectively. If a source was observed over multiple epochs, the median of the observed angular size is given. This table is available in its entirety in a machine-readable form online. A portion is shown here for guidance regarding its form and content.
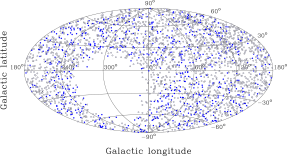
The structure modeling has been performed with the procedure modelfit in the Difmap package (Shepherd, 1997) using an automated approach. Cores were found to be unresolved in a fraction of epochs for a fraction of sources, i.e. their fitted angular sizes were smaller than a corresponding resolution limit calculated following Kovalev et al. (2005). In rare cases the core components had a low () signal-to-noise ratio. We excluded data for such epochs to get rid of a bias they may introduce. In cases where multi-epoch data can be used for the core size estimates, a single median value was used per source in the analysis. The resulting samples contain 2888 and 3019 sources at 2 and 8 GHz (Table 1), respectively, with measured sizes of the cores, of which 2327 sources have simultaneous observations at 2 and 8 GHz (Fig. 1).
3 Apparent core size inside and outside the Galactic plane
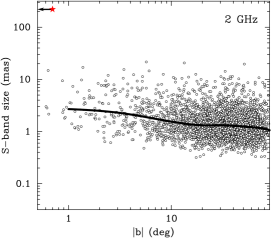
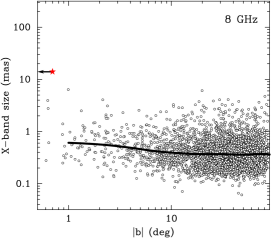
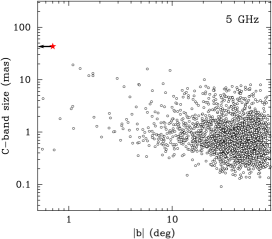
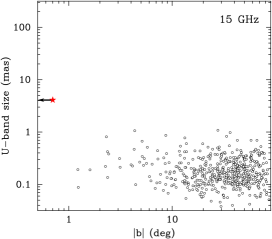
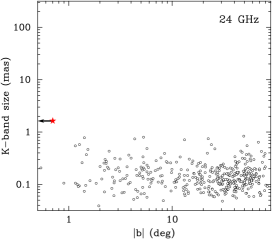
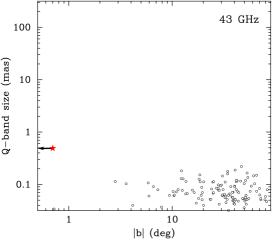
In Fig. 2 we plot the angular size of the cores as a function of the absolute value of galactic latitude , as scattering effects are most essential for compact components. The general behavior shows that sources in the Galactic plane (), comprising about 14% of the samples at 2 and 8 GHz, have on average larger apparent angular sizes relative to sources at higher galactic latitudes. In particular, at 8 GHz the spline values gradually decrease by a factor of 1.7 between and and then remain nearly constant at larger latitudes. At lower frequency, the 2 GHz spline shows similar behavior but with the size decrease present along the entire range of . At both frequencies the non-parametric Kendall’s -test confirms a highly significant (, ) negative correlation between and within the Galactic plane. At 5 GHz the correlation is also highly significant, while at higher frequencies, 15, 24, and 43 GHz scattering is much weaker with no significant correlation observed. The all-sky correlation statistics for the measured observed size of the VLBI core at different frequencies against the absolute value of the galactic latitude is summarized in Table 1, where we list observing frequency in column (1), ranked correlation coefficient in column (2), number of sources in column (3), and probability of correlation by chance in column (4). We estimated the uncertainties of the non-parametric Kendall’s correlation coefficients listed in Tables 1 and 4 at a significance level of 95%, using a randomization technique based on (i) randomly selecting 80% of a sample, (ii) calculating the , (iii) repeating steps (i) and (ii) 2000 times and then constructing the confidence intervals. The VLBI core sizes measured at different frequencies in a range from 2 to 43 GHz for 4963 sources used in our analysis and presented in Fig. 2 are listed in Table 2. We note that for sources with rich parsec-scale morphology the estimated core sizes might depend strongly on the model chosen to represent the structure.
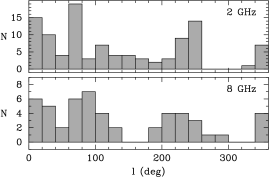
The sources with large angular sizes ( mas at 8 GHz and mas at 2 GHz) within the Galactic plane are non-uniformly distributed with the galactic longitude (Fig. 3). The distribution peaks in the regions representing the direction to the Galactic center (GC) and bar, towards the Cygnus region, and towards star-forming regions in the Perseus and Local (Orion) arms (Vázquez et al., 2008), and the Vela supernova remnant. Screens with significant scattering strength are expected in these regions. The patchy distributions of scatter-broadened compact extragalactic sources will be analyzed and presented by us elsewhere. We also note the lack of the broadened sources along the direction to the Galactic anticenter (), where less interstellar scattering is expected within the Galactic plane. The gap of sources around is due to the absence of the southernmost AGN in available VLBI surveys, especially at 2 GHz, as can be seen from the sky distribution in Fig. 1.
Since the Sun is about pc away from the Galactic plane as inferred from classical Cepheids (Majaess et al., 2009), we tested for possible asymmetry in the angular size distributions for the sources with negative and positive galactic latitude within the Galactic plane. The latter population shows an 8% excess in quantity (Fig. 1) but no significant difference in the angular size at 2 and 8 GHz is found by a K-S test. Mean values also agree within the errors, with mas () and () at 2 GHz and mas () and () at 8 GHz. Additionally, no significant difference between -index distributions for these groups of sources is found by a K-S test (see more details in Sect. 4).
4 Separating intrinsic and external effects: frequency dependence of AGN core size
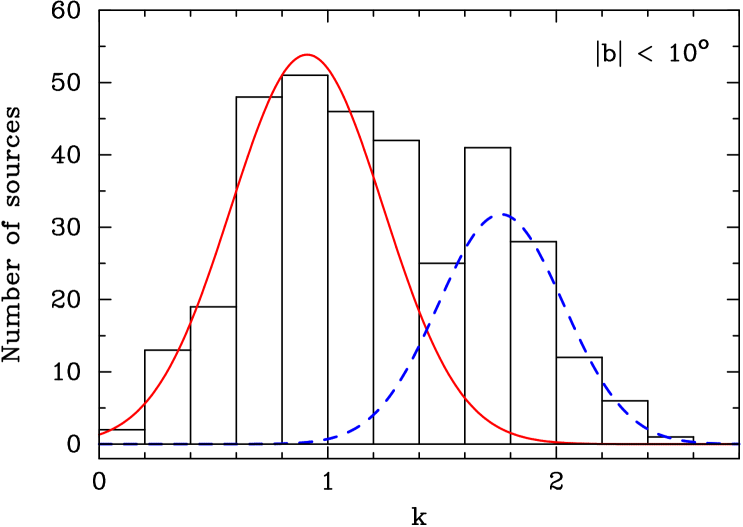
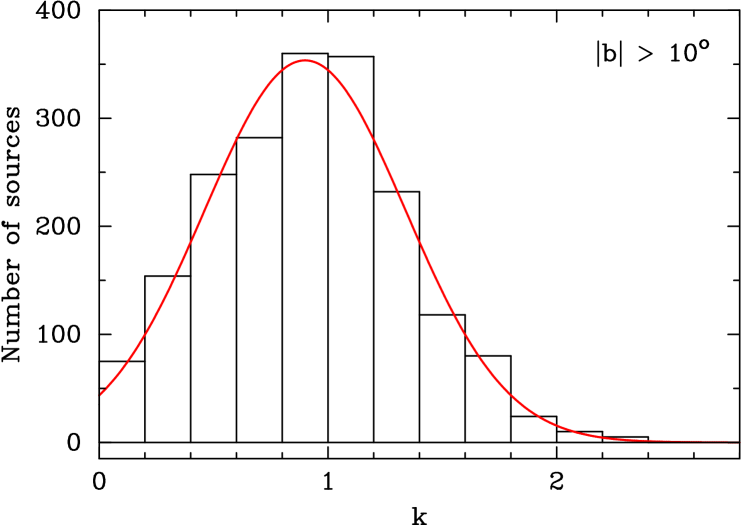
We compiled a sample of 2327 sources that have been observed at 2 and 8 GHz simultaneously and for which the -index was successfully estimated for the size-frequency dependence for each object using the corresponding measured VLBI core sizes. If a source had more than one epoch of observations, the median value of was derived. We show the resulting distribution of the -index with two histograms: for 335 sources within the Galactic plane (Fig. 4, left, ) and 1992 sources at (Fig. 4, right). The -index distribution for the sources at low galactic latitudes was fitted with two Gaussians the best-fit peaks of which are 0.91 and 1.76. The lower and higher peaked Gaussians represent two groups of sources, non-scattered and scattered by intervening screens, respectively. The -index distribution for the sources out of the Galactic plane (Fig. 4, right) shows that most of them are not affected significantly by angular broadening. The distribution is fitted by a single Gaussian with the best-fit peak at 0.90, which is consistent with the left Gaussian for the Galactic plane AGN. Since the first peak is observed for both distributions (Table 3) while the second peak is visible for the Galactic plane only, this confirms that the latter has an origin that is extrinsic to the AGN.
| (1) | (2) | (3) | (4) |
|---|---|---|---|
| 0.67 | 0.91 | 0.33 | |
| 0.33 | 1.76 | 0.28 | |
| 1.00 | 0.90 | 0.44 |
Note: the presented parameters are found from the following Gaussian fit: .
We note that only about of the sources within shows angular scatter-broadening external to the source. As the typical value of for the scattered sources is less than the expected , this may indicate that the angular size of some turbulent eddies are comparable to that of the VLBI cores, and refractive effects may also play a role in scattering (e.g., Cordes et al., 1986; Pushkarev et al., 2013). Alternatively, it can be partly caused by variability of scattering properties of intervening screen on the line of sight to a source (e.g., Koay et al., 2011; Pushkarev et al., 2013; de Bruyn & Macquart, 2015). If a scatter-broadened source has more than one epoch of observations and a scattering screen either changes its characteristics or moves away, the median would decrease. In total, about 30% of the analyzed sources with had two or more epochs of observations, making scattering variability potentially responsible for the lower . To test this scenario, we repeated the analysis constructing a -index distribution using (i) the first epoch only for each source, (ii) the last epoch only. In all three cases, the obtained distributions and fitted Gaussians are similar indicating that the slightly lower value of cannot be explained by a net movement of screens away from the line-of-sight. To confirm that significant variability of scattering is a rare phenomenon on a time scale of few years, we analyzed distribution of for each of the 108 sources within the Galactic plane that had more than one epoch, where is the value of in the last epoch and is the value of in the first epoch. Indeed, we obtained a narrow distribution peaking at 0, with a median value 0.01 and a standard deviation 0.55.
Another possible reason we observe the lower values of in scatter broadened sources is that the scattering effects do not dominate. Since the observed angular size , where is the intrinsic source size, and is the scatter broadening, the observed angular size will scale with only if and completely dominates. If is only slightly larger than , then .
| Correlation | ||||||||||||
|---|---|---|---|---|---|---|---|---|---|---|---|---|
| (1) | (2) | (3) | (4) | (5) | (6) | (7) | (8) | (9) | (10) | |||
| vs | 335 | 1992 | 2327 | |||||||||
| vs | 335 | 1992 | 2327 | |||||||||
| vs H | 335 | 1992 | 2327 | |||||||||
Note: is the number of sources, is the probability that the correlation occurred by chance.
In order to test that the different resolution of 2 and 8 GHz VLBI data does not affect the robustness of the derived value (Table 3) and make sure that this result is not due to degradation of angular resolution towards lower frequencies, we performed the same analysis for the Galactic plane sources using matching resolution at both frequencies. The maximum radius at 8 GHz was limited to that derived from the corresponding 2 GHz data sets. The resulting typical value of in the data was about 65 M. We took steps to avoid blending effects that lead to the innermost portions of the jet component being fitted as part of the core component in the 8 GHz data, thereby falsely increasing the fitted sizes of the VLBI core component. To implement this, we fit the core component at both frequency bands as an elliptical Gaussian, the major axis of which typically aligns with the innermost jet direction (Kovalev et al., 2005), while a minor axis sets the transverse width of the outflow in the radio core. The values of -index were derived using the VLBI core widths transverse to the jet direction. The obtained distribution for was fitted with two Gaussians with the best-fit peaks at 0.98 and 1.70, very close to the peaks derived from the full resolution data sets (Table 3).
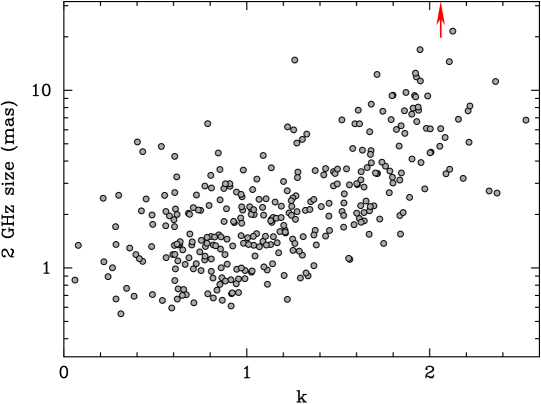
In Fig. 5 we present the expected dependence between the core size at 2 GHz and -index. It confirms that large observed sizes are indeed found from strongly scattered sources with high instead of being intrinsic to the jets. The distribution of galactic longitude for sources with was confirmed to be similar to that in Fig. 3 (top).
Of the 2327 analyzed sources, 1594 (68%) have measured redshifts distributed in the range of . We tested a relationship between the -index and redshift and found no significant dependence, confirming that the screens which dominate in scattering are located in our Galaxy. This is consistent with other studies that did not find significant redshift dependence of scatter broadening using VLBI but for a much smaller sample of 58 sources (Lazio et al., 2008), and using interstellar scintillation of 128 sources (Koay et al., 2012).
| Frequency | () | N | () | N | (Sgr A∗) | |
|---|---|---|---|---|---|---|
| (GHz) | (mas) | (mas) | (mas) | (mas) | ||
| (1) | (2) | (3) | (4) | (5) | (6) | (7) |
| 2.3 | 2502 | 386 | 21.55 | 220 | ||
| 5.0 | 1988 | 120 | 19.16 | 43 | ||
| 8.4 | 2606 | 413 | 6.37 | 14 | ||
| 15.4 | 464 | 48 | 1.04 | 4 | ||
| 24.4 | 289 | 113 | 0.81 | 1.6 | ||
| 43.1 | 109 | 10 | 0.22 | 0.5 |
Note: the following is presented in the columns: (1) – central observing frequency, (2) – median angular size for AGN cores outside the Galactic plane and its error at 95% level of significance, (3) – number of sources used to estimate (2), (4) – median angular size for AGN cores inside the Galactic plane and its error at 95% level of significance, (5) – number of sources used to estimate (4), (6) – all-sky maximum of measured core angular size, (7) – angular size of Sgr A∗ for comparison.
4.1 Testing connection with rotation measure, free-electron density, and Galactic distributions
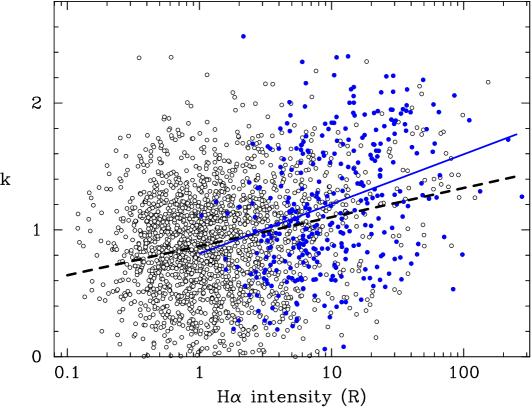
Positions of the scatter-broadened sources are expected to match with the sky regions where an excess of electron density is measured. To test this idea we searched for correlations between -index values with (i) angular broadening at 1 GHz, , derived from the NE2001 Galactic free electron density model, which in turn is based on pulsar observations and also includes scattering properties of extragalactic and other Galactic radio sources (Cordes & Lazio, 2002), (ii) absolute value of rotation measures (Taylor, Stil & Sunstrum, 2009), and (iii) H emission used as a tracer of ionized gas (Finkbeiner, 2003). In all cases, highly significant correlation was established using the non-parametric Kendall’s -test (Table 4). The strongest correlation shown in Fig. 6 is detected between the -index derived from our analysis and H intensity. This is most probably due to the highest resolution of H data among the three data sets used. It has the angular resolution reaching 25-square-pixels at from the full-sky composite H map (Finkbeiner, 2003). The observed correlations confirm the extrinsic origin of the frequency dependence of the AGN core sizes in the Galactic plane.
4.2 Intrinsic AGN core size: theory predictions and experimental results
Theoretically, the dependence, where is the distance of the apparent jet base (radio core) at a given frequency from the true jet origin, was predicted by Blandford & Königl (1979) in their idealized model of a steady radio jet assuming that (i) the jet is conical with a small half-opening angle , (ii) the jet is supersonic and free, i.e. , where is the Mach number, (iii) the jet has constant velocity, (iv) a power-law energy distribution along the jet, (v) there is an approximate equipartition between jet particle and magnetic field energy densities. The assumption of a conical geometry (see observational evidence by Asada & Nakamura, 2012; Pushkarev et al., 2014) leads to dependence.
This is consistent with what we have derived for the majority of the non-scattered sources (Fig. 4, Table 3), and also with the opacity-driven core shift effect results (e.g., Lobanov, 1998; Kovalev et al., 2008; O’Sullivan & Gabuzda, 2009; Sokolovsky et al., 2011; Kutkin et al., 2014). Despite the fact that the -index distribution is centered close to 1, its wide distribution indicates that departures from the model assumptions are possible in many cases. This can be caused by, e.g,, pressure and density gradients in the outflow (Lobanov, 1998) or non-conical jet geometry. Errors of the derived -index values additionally widen the distribution. We have analyzed a sub-sample of 344 sources out of the Galactic plane which have rich multi-frequency data of the angular size measurements covering 4, 5 or 6 frequencies. From this multi-frequency data, we found that in 25% of the 344 sources, the k-index values do significantly deviate from the value of 1. Nevertheless, based on the large number statistics, it is likely that the k-index distribution does indeed peak at a value close to 1.
5 Scattering properties of Sgr A∗
In Fig. 2 (star symbol), we also show Sgr A∗, a compact radio source in the center of the Galaxy. The angular size of the object was calculated using a size-wavelength fit derived by Zensus et al. (2007), giving about 14 mas at 8 GHz and 220 mas at 2 GHz that are larger by a factor of about 2 and 10, respectively, than the maximum apparent size of an AGN core in our sample. Angular size statistics is given in Table 5, where the errors of the median sizes were estimated using the randomization technique described in Sect. 3. The size of Sgr A∗at 8 and 15 GHz calculated from the fit derived by Zensus et al. (2007) is consistent with later measurements from other studies (e.g., Bower et al., 2014).
Why is the angular size of Sgr A∗ so unusual? We discuss below two possibilities. First, the peculiarity of Sgr A∗ might be an observing bias if we miss sources with comparably large angular sizes as a result of lack of data for imaging technique that requires at least four stations to closure amplitudes. Indeed, the correlated flux density of a heavily resolved source quickly drops with increasing baseline projection (e.g., Fig. 2 in Gwinn et al., 2014) and attains the typical VCS detection limit of about 50 mJy (Kovalev et al., 2007). To test this scenario, we estimated the minimum total flux density level , below which we can potentially miss large-sized sources. Considering a circular Gaussian source model with a size of Sgr A∗ at 8 GHz, 14.4 mas, we found that the shortest VLBA baseline projections formed by four inner stations reach the VCS detection limit of mJy if 100-150 mJy, depending on -plane coverage. Remember that Jy for Sgr A∗ at 8 GHz. Note that in the RDV sessions, in addition to the VLBA stations, a number of other antennas participated (normally 6–8 additional radio telescopes) forming an array with shorter baseline projections. This implies that the level of in the RDV data sets is even lower than that derived from the VCS data. We conclude that it is unlikely that our sample, which is flux density complete down to about 200 mJy at 8.6 GHz above declination (Kovalev et al., 2007), misses sources with large observed angular sizes similar to that of Sgr A∗ at the corresponding observing frequency.
We miss sources that are either a few times larger in size than Sgr A∗ like the extragalactic radio source NGC 6334B — the most strongly scattered object known, with an angular size of 3″ at 20 cm wavelength (Trotter et al., 1998; Moran et al., 1990), or considerably weaker sources. In principle, an obvious reason for the seeming uniqueness of Sgr A∗ could be an insufficient source density of sky coverage (see the GC region in Fig. 7) and deepness of the all-sky sample being analyzed.
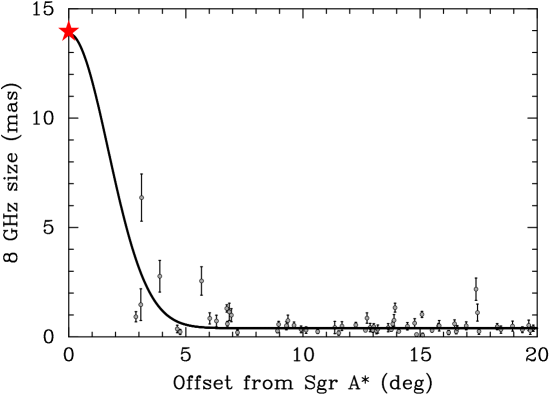
The second possibility is that the scattering strength of the screen towards Sgr A∗ could be extremely strong making it the most heavily scatter-broadened source at centimeter wavelengths. This suggests that a turbulent scattering screen with substantially enhanced free-electron density is located in the immediate vicinity of Sgr A∗. Scattering strength peaking at the GC decreases with the angular distance from it, and is fitted by a Gaussian with FWHM of about 4°(Fig. 7), providing an estimate of a size for the intermediate-strength scattering region. Observing radio sources in the GC region, Roy (2013) found that scattering sizes decrease linearly with increasing angular distance from the GC up to about 1°. The sources in our sample are not very close to the GC. One of the nearest object, J17443116, observed at 8 GHz is 3°away from Sgr A∗ and has a scatter-broadened source size that is smaller by a factor of 2. The only source in the GC region with an angular size comparable to Sgr A∗ measured at 8.7 and 15.4 GHz by Bower et al. (2014), is the recently discovered magnetar gravitationally bound to Sgr A∗ about away, or at linear separation of pc (Rea et al., 2013). Assuming a single thin-screen model, Bower et al. (2014) used the combination of temporal smearing (Spitler et al., 2014) and angular broadening of the magnetar emission as a powerful tool for assessing the distance and concluded that the screen is located roughly 6 kpc from Sgr A∗towards the Sun. On the other hand, it seems very unlikely that the line of sight to the cloud of the ionized medium with the extremely strong scattering strength in the Galaxy passes by chance exactly through the GC.
We can place some constraints on the scattering screen media using relations of a thin-screen model. First, as it is shown by Vandenberg (1976); Lazio et al. (2008), the scattered size , where is the distance from a source to the scattering screen. Therefore, a close (0.1–1 pc from Sgr A∗) screen must be a factor of more dense than the one located roughly halfway (Bower et al., 2014) to broaden a source to the same angular size. Secondly, (Lyne & Graham-Smith, 2012), where is the fluctuation in electron density on a linear scale . Therefore, an alternative scenario for the close screen is that it is more turbulent, with a smaller inner length-scale of turbulence (Armstrong, Rickett & Spangler, 1995) estimated to be about 300 km in size (Gwinn et al., 2014). It is also possible that both the increased density and smaller inner scale work jointly resulting in the very strong scattering. However, it should be noted that a close (to Sgr A∗) screen scenario is strongly inconsistent with the reported detailed properties of the magnetar (e.g., Bower et al., 2014; Spitler et al., 2014).
6 Summary
We have found a highly significant negative correlation between the angular size of about 3000 compact extragalactic radio sources observed with VLBI at 2, 5, and 8 GHz and the absolute value of galactic latitude. At higher frequency, 15 GHz, the correlation is significant only for sources within the Galactic plane. At both 24 and 43 GHz, where scattering becomes considerably weaker, no significant correlation is present.
The k-index (with larger values, 2, being associated with scattering) is found to correlate with rotation measure, free electron density, and H emission distributions over the Galaxy. The strongest correlation is established between the index and H intensity that directly traces ionized gas with high resolution. No significant connection is established between the -index and redshift, strongly suggesting that the screens which dominate in scattering are situated in the Galaxy.
Only about one third of AGN viewed through the Galactic plane () by VLBI show significant angular broadening caused by interstellar scattering. The positional distribution of these objects forms three major regions on the sky where scattering is essential, marking the Galactic center, the Cygnus region, and active star-forming regions in the Perseus and Local arms at galactic longitudes known as the Fitzgerald window (Vázquez et al., 2008). At higher galactic latitudes () we have found no positional clustering of scattered sources. The fraction of sources with decreases to 4% for sources at . This suggests that significant angular broadening should not be expected outside of the Galactic plane within the RadioAstron (Kardashev et al., 2013) space VLBI survey of AGN. However, the extreme angular resolution of RadioAstron at 18, 6 and 1.3 cm could allow observers to detect lower magnitudes of scatter broadening.
The angular size for the majority of non-scattered AGN cores scales approximately as following the model prediction of a conical jet with synchrotron self-absorption and equipartition between the particles and magnetic field energy density (Blandford & Königl, 1979; Königl, 1981). We note that the distribution around is wide which hints at many cases with departures from this typical picture.
The angular size of Sgr A∗ is the largest compared to that of thousands of AGN all over the sky observed from 2 to 43 GHz, more than a factor of 10 larger than the maximum AGN core size found at 2 GHz. This suggests that Sgr A∗ is scattered by a compact hyper-turbulent screen encompassing the source itself. However, this conclusion is in tension with convincing results of Bower et al. (2014); Spitler et al. (2014); Wucknitz (2014) for the magnetar near Sgr A∗. This points to the scattering properties towards the Galactic center being more complex than that described in current models.
Acknowledgments
We thank C. Gwinn, M. Johnson, G. Bower, A. Deller, D. Jauncey, O. Wucknitz, I. Pashchenko, E. Kravchenko, L. Petrov, M. Popov, K. Sokolovsky for discussions and comments. We thank the anonymous referee for useful comments which helped to improve the manuscript. We deeply thank the teams referred to in Sect. 2 for making their fully calibrated VLBI FITS data publicly available and Leonid Petrov for maintaining at the Astrogeo Center333http://astrogeo.org/vlbi_images/ the database of brightness distributions, correlated flux densities and images of compact radio sources produced with VLBI. This research has made use of data from the MOJAVE database that is maintained by the MOJAVE team (Lister et al., 2009). This study makes use of 43 GHz VLBA data from the VLBA-BU Blazar Monitoring Program, funded by NASA through the Fermi Guest Investigator Program. The National Radio Astronomy Observatory is a facility of the National Science Foundation operated by Associated Universities, Inc. This study was supported in part by the Russian Foundation for Basic Research grant 13-02-12103. This research has made use of NASA’s Astrophysics Data System.
References
- Armstrong et al. (1995) Armstrong J. W., Rickett B. J., Spangler S. R., 1995, ApJ, 443, 209
- Asada & Nakamura (2012) Asada K., Nakamura M., 2012, ApJ, 745, L28
- Beasley et al. (2002) Beasley A. J., Gordon D., Peck A. B., Petrov L., MacMillan D. S., Fomalont E. B., Ma C., 2002, ApJS, 141, 13
- Blandford & Königl (1979) Blandford R. D., Königl A., 1979, ApJ, 232, 34
- Bower et al. (2014) Bower G. C. et al., 2014, ApJ, 780, L2
- Charlot et al. (2010) Charlot P., et al. 2010, AJ, 139, 1713
- Cordes & Lazio (2002) Cordes J. M., Lazio T. J. W., 2002, astro-ph:0207156
- Cordes et al. (1986) Cordes J. M., Pidwerbetsky A., Lovelace R. V. E., 1986, ApJ, 310, 737
- de Bruyn & Macquart (2015) de Bruyn A. G., Macquart J.-P., 2015, A&A, 574, A125
- Finkbeiner (2003) Finkbeiner D. P., 2003, ApJS, 146, 407
- Fomalont et al. (2003) Fomalont E. B., Petrov L., MacMillan D. S., Gordon D., Ma C., 2003, AJ, 126, 2562
- Goodman & Narayan (1985) Goodman J., Narayan R., 1985, MNRAS, 214, 519
- Gwinn et al. (2014) Gwinn C. R., Kovalev Y. Y., Johnson M. D., Soglasnov V. A., 2014, ApJ, 794, L14
- Helmboldt et al. (2007) Helmboldt J. F., et al. 2007, ApJ, 658, 203
- Johnson & Gwinn (2015) Johnson M. D., Gwinn C. R., 2015, ApJ, 805, 180
- Kardashev et al. (2013) Kardashev N. S., Khartov V. V., Abramov V. V., Avdeev V. Y., Alakoz A. V., et al. 2013, Astronomy Reports, 57, 153
- Kellermann et al. (2004) Kellermann K. I., Lister M. L., Homan D. C., Vermeulen R. C., Cohen M. H., Ros E., Kadler M., Zensus J. A., Kovalev Y. Y., 2004, ApJ, 609, 539
- Kellermann et al. (1998) Kellermann K. I., Vermeulen R. C., Zensus J. A., Cohen M. H., 1998, AJ, 115, 1295
- Koay et al. (2011) Koay J. Y., Bignall H. E., Macquart J.-P., Jauncey D. L., Rickett B. J., Lovell J. E. J., 2011, A&A, 534, L1
- Koay et al. (2012) Koay J. Y., et al. 2012, ApJ, 756, 29
- Koay & Macquart (2015) Koay J. Y., Macquart J.-P., 2015, MNRAS, 446, 2370
- Königl (1981) Königl A., 1981, ApJ, 243, 700
- Kovalev et al. (2005) Kovalev Y. Y., et al. 2005, AJ, 130, 2473
- Kovalev et al. (2008) Kovalev Y. Y., Lobanov A. P., Pushkarev A. B., 2008, Mem. SAI, 79, 1153
- Kovalev et al. (2008) Kovalev Y. Y., Lobanov A. P., Pushkarev A. B., Zensus J. A., 2008, A&A, 483, 759
- Kovalev & Petrov (2011) Kovalev Y. Y., Petrov L., 2011, in 2011 Fermi Symposium Abstracts 1FGL active galactic nuclei at parsec scales, #S1.N46. p. 60
- Kovalev et al. (2007) Kovalev Y. Y., Petrov L., Fomalont E. B., Gordon D., 2007, AJ, 133, 1236
- Kutkin et al. (2014) Kutkin A. M., et al. 2014, MNRAS, 437, 3396
- Lazio et al. (2008) Lazio T. J. W., Ojha R., Fey A. L., Kedziora-Chudczer L., Cordes J. M., Jauncey D. L., Lovell J. E. J., 2008, ApJ, 672, 115
- Lister et al. (2013) Lister M. L. et al., 2013, AJ, 146, 120
- Lister et al. (2009) Lister M. L., et al. 2009, AJ, 137, 3718
- Lobanov (1998) Lobanov A. P., 1998, A&A, 330, 79
- Lyne & Graham-Smith (2012) Lyne A., Graham-Smith F., 2012, Pulsar Astronomy. Cambridge, UK
- Majaess et al. (2009) Majaess D. J., Turner D. G., Lane D. J., 2009, MNRAS, 398, 263
- Malkin & Titov (2008) Malkin Z., Titov O., 2008, in Finkelstein A., Behrend D., eds, Measuring the Future, Proceedings of the Fifth IVS, Optical Characteristics of Astrometric Radio Sources. p. 183
- Moran et al. (1990) Moran J. M., Rodriguez L. F., Greene B., Backer D. C., 1990, ApJ, 348, 147
- Napier et al. (1994) Napier P. J., Bagri D. S., Clark B. G., Rogers A. E. E., Romney J. D., Thompson A. R., Walker R. C., 1994, IEEE Proceedings, 82, 658
- O’Sullivan & Gabuzda (2009) O’Sullivan S. P., Gabuzda D. C., 2009, MNRAS, 400, 26
- Petrov et al. (2012) Petrov L., et al. 2012, AJ, 144, 150
- Petrov et al. (2009) Petrov L., Gordon D., Gipson J., MacMillan D., Ma C., Fomalont E., Walker R. C., Carabajal C., 2009, Journal of Geodesy, p. 8
- Petrov et al. (2007) Petrov L., Hirota T., Honma M., Shibata K. M., Jike T., Kobayashi H., 2007, AJ, 133, 2487
- Petrov et al. (2012) Petrov L., Honma M., Shibata S. M., 2012, AJ, 143, 35
- Petrov et al. (2005) Petrov L., Kovalev Y. Y., Fomalont E. B., Gordon D., 2005, AJ, 129, 1163
- Petrov et al. (2006) Petrov L., Kovalev Y. Y., Fomalont E. B., Gordon D., 2006, AJ, 131, 1872
- Petrov et al. (2008) Petrov L., Kovalev Y. Y., Fomalont E. B., Gordon D., 2008, AJ, 136, 580
- Petrov & Taylor (2011) Petrov L., Taylor G. B., 2011, AJ, 142, 89
- Piner et al. (2012) Piner B. G., Pushkarev A. B., Kovalev Y. Y., Marvin C. J., Arenson J. G., Charlot P., Fey A. L., Collioud A., Voitsik P. A., 2012, ApJ, 758, 84
- Popov et al. (2015) Popov M. V., et al. 2015, ApJ, submitted; ArXiv:1501.04449
- Pushkarev et al. (2014) Pushkarev A., Lister M., Kovalev Y., Savolainen T., 2014, in Proceedings of the 12th European VLBI Network Symposium and Users Meeting (EVN 2014), PoS, Opening angles and shapes of parsec-scale AGN jets. p. 104
- Pushkarev et al. (2013) Pushkarev A. B., et al. 2013, A&A, 555, A80
- Pushkarev et al. (2012) Pushkarev A. B., Hovatta T., Kovalev Y. Y., Lister M. L., Lobanov A. P., Savolainen T., Zensus J. A., 2012, A&A, 545, A113
- Pushkarev & Kovalev (2012) Pushkarev A. B., Kovalev Y. Y., 2012, A&A, 544, A34
- Rea et al. (2013) Rea N., Esposito P., Pons J. A., Turolla R., Torres D. F., et al. 2013, ApJ, 775, L34
- Roy (2013) Roy S., 2013, ApJ, 773, 67
- Shepherd (1997) Shepherd M. C., 1997, in Hunt G., Payne H. E., eds, Astronomical Data Analysis Software and Systems VI Vol. 125 of Astronomical Society of the Pacific Conference Series, Difmap: an Interactive Program for Synthesis Imaging. San Francisco: ASP, p. 77
- Sokolovsky et al. (2011) Sokolovsky K. V., Kovalev Y. Y., Pushkarev A. B., Lobanov A. P., 2011, A&A, 532, A38
- Spitler et al. (2014) Spitler L. G., et al. 2014, ApJ, 780, L3
- Taylor et al. (2009) Taylor A. R., Stil J. M., Sunstrum C., 2009, ApJ, 702, 1230
- Trotter et al. (1998) Trotter A. S., Moran J. M., Rodríguez L. F., 1998, ApJ, 493, 666
- Vandenberg (1976) Vandenberg N. R., 1976, ApJ, 209, 578
- Vázquez et al. (2008) Vázquez R. A., May J., Carraro G., Bronfman L., Moitinho A., Baume G., 2008, ApJ, 672, 930
- Wucknitz (2014) Wucknitz O., 2014, in Proceedings of the 12th European VLBI Network Symposium and Users Meeting (EVN 2014), PoS, Probing interstellar scattering towards the Galactic centre with pulsar VLBI. p. 66
- Zensus et al. (2007) Zensus J. A., Krichbaum T. P., Britzen S., 2007, in Guirado J., Martí-Vidal I., Marcaide J., eds, Proc. of the 1st Meeting of Spanish Radio Astronomy Highest-Resolution Radio Astronomy: The Quest for the Black Hole. Universitat de València, pp 187–196; astro–ph:0610712