Ab-initio perspective on the Mollwo–Ivey relation for F-centers in alkali halides
Abstract
We revisit the well-known Mollwo–Ivey relation that describes the “universal” dependence of the absorption energies of F-type color centers on the lattice constant of the alkali-halide crystals, We perform both state-of-the-art ab-initio Quantum Chemistry and post-DFT calculations of F-center absorption spectra. By “tuning” independently the lattice constant and the atomic species we show that the scaling of the lattice constant alone (keeping the elements fixed) would yield in agreement with the “particle-in-the-box” model. Keeping the lattice constant fixed and changing the atomic species enables us to quantify the ion-size effects which are shown to be responsible for the exponent .
pacs:
71.55.-i, 71.23.An, 71.15.-mI Introduction
Exploration of the physics of the color centers has a long history dating back to the late 1920s. Still, color centers constitute an important topic of current research as they offer optically addressable quasi-atomic localized excitations in the condensed phase only weakly coupled to a decohering environment. Prominent examples include nitrogen-vacancy color centers as candidates for the realization of quantum bitsNemoto et al. (2014). Color centers play a crucial role in various optical devices such as tunable solid-state lasersTer-Mikirtychev and Tsuboi (1996) (see also ref. Chiamenti et al., 2014 and references therein). Furthermore, the coupling of the electronic and nuclear degrees of freedom in optical absorption and emission processes of color centers is of interest for resonance spectroscopiesKoyama and Suemoto (2011) and coherent state manipulation. Meanwhile a considerable number of ab-initio studies of the electronic structure of color centers have become availableCarrasco et al. (2006); Ma and Rohlfing (2008); Rinke et al. (2012); Karsai et al. (2014).
The prototypical color center, first investigated in the late 1920s, is the F center in alkali-halide crystals with rock-salt structure. It consists of a single electron captured in an anion vacancy. The ground state of the electron residing near the defect is localized in the vacancy with a nearly spherical, or s-type, wave function. Upon absorption of light the defect electron is excited in a dipole transition into a p-type state. In a recent workKarsai et al. (2014) we have analyzed in detail this quasi-atomic transition for lithium fluoride (LiF) employing complementary state-of-the-art ab-initio methods from quantum chemistry and solid-state theory.
In the present work we extend this analysis to other alkali halides and address the physics underlying the well-known Mollwo–Ivey relation. Mollwo Mollwo (1931) pioneered the observation that the absorption energy of F centers in alkali halides scales like , where is the lattice constant (i.e., twice the anion-cation distance). Later, Ivey Ivey (1947) found, based on a larger data set for different alkali halides, that of many defects follow
| (1) |
where is a proportionality constant and is the so-called Mollwo–Ivey exponent. Fitting this expression to experimental data of F-center absorption energies in crystals with rock-salt structure Dawson and Pooley (1969); Malghani and Smith (1992) yields with a universal prefactor eV (when is given in Ångström). These findings stimulated a large number of theoretical investigations over the yearsFröhlich (1933); Stöckmann (1951, 1952a, 1952b); Wood (1965); Fowler (1968) resulting in a wide variety of qualitative and semi-quantitative models aimed at explaining this remarkably simple scaling relation. While in detail substantially different, the common idea underlying these models is the notion of the “particle in the box”: an electron is trapped at the site of a missing anion in order to render the crystal neutral. This electron cannot move through the crystal due to the large band gap of alkali halides. In the 1960s, more experimental data, in particular the observed pressure dependence in heavier alkali halidesBuchenauer and Fitchen (1968), appeared to deviate from Eq. 1 and refinements were proposed to account for so-called ion-size effectsBuchenauer and Fitchen (1968); Bartram et al. (1968); Malghani and Smith (1992); Smith and Malghani (1998) that are not expected to follow any simple -scaling.
A systematic investigation of Eq. 1 based on state-of-the-art ab-initio simulations appears to be still missing. We therefore present calculations of the defect wave functions and absorption energies of F centers for several alkali-halide crystals. Our calculations shed light on the exact nature of the electron confinement which is mainly due to the exchange interaction and the requirement of orthogonality of the defect wave function and the ion core levels. By independently varying the lattice constant and the ionic species, we can disentangle the effects of the scaling with lattice size from that of the influence of effective ionic radii.
The paper is structured as follows. In sec. II we briefly review the computational methods employed in the present study. In section III we give a brief overview over previously proposed models for explaining the Mollow–Ivey relation and scrutinize them in the light of the current results. In Sec. IV we introduce the scaled alkali halide model which allows to disentangle lattice-size from ion-size effects. Ion-size effects are studied in section V and their influence on the absorption energies and the Mollwo–Ivey exponent are presented in section VI. Conclusions and an outlook are given in section VII.
II Computational Methods
The numerical results presented in the following are based on two complementary state-of-the-art ab-initio approaches. On the one hand, we employ quantum-chemistry methods for localized molecule-like systems. On the other-hand, we use post-density functional theory (post-DFT) methods for extended condensed matter systems (for details see Ref. Karsai et al., 2014).
Briefly, quantum-chemistry techniques are employed within the framework of the so-called embedded cluster approachde Graaf et al. (1998) (ECA). Due to the strong localization of the F-centers the defect and its environment can be represented by a finite-size active cluster. Unless otherwise stated we use an active cluster containing 18 anions and 38 cations and the defect, i.e. a missing anion in the very center. For this cluster size, calculations of the F-center absorption energies in alkali halides with large elements such as potassium chloride are still feasible, defect wave functions are well converged, and absorption energies are converged up to eV. The active cluster is embedded into several layers of ab initio model potentials Huzinaga et al. (1986); Seijo and Barandiarán (1999) (AIMPs) and a large matrix of point charges of cubic shape arranged as proposed by EvjenEvjen (1932) with fractional charges of +/- 0.5, 0.25, and 0.125 at faces, edges, and corners, respectively. All active atoms/ions, AIMPs, and point charges are placed at lattice positions of the pristine alkali-halide crystals, i.e., for the study of the universal -scaling for alkali halides (Eq. 1, Sec. IV) we deliberately omit an element-specific geometry optimization. We consider relaxation effects when we discuss detailed comparison with experimental data (sec. VI). We use Dunning’s correlation-consistent polarized valence-only basis setDunning (1988) of triple zeta quality (cc-pVTZ) for the active clusters. Since no such basis set is available for potassium, we use for alkali halides involving K the small Atomic Natural Orbital (s-ano) basis setPierloot et al. (1995), which is of comparable size. For those crystals for which both basis sets are available we find hardly any difference in the absorption energy for the s-ano and the cc-pVTZ basis set. One- and two-electron integrals are computed using the Cholesky decompositionAquilante et al. (2010) as implemented in the Molcas program package.
F-center absorption energies are determined as differences between total energies of the ground and first optically allowed excited N-electron state of the active cluster. The total energies are calculated using the complete active space second-order perturbation theory (CASPT2) based on restricted open-shell Hartree–Fock (ROHF) wave functions. This method has been shown to account for correlation effects to a large degree Karsai et al. (2014) as dynamical correlations strongly dominate over static correlations for wide-band gap insulatorsGrüneis et al. (2010). All occupied HF orbitals are doubly occupied and localized at the active anions, i.e. halides, and cations, i.e. alkali metals, except for the defect orbital which is well localized in the vacancy region and hosts the unpaired F-center electron. This orbital has s and p-type characterKarsai et al. (2014) in the ground and excited state, respectively, and its size and shape are well converged for the cluster and basis set size used. Its representation by one-electron orbitals has been shown to be remarkably accurate by comparison with the natural-orbital representation of the reduced density matrix of the full N-electron wave functionKarsai et al. (2014).
The solid-state approach starts with DFT calculations for periodic super cells using the WIEN2k code Blaha et al. (2001), which is based on the full-potential (linearized) augmented plane-wave ((L)APW) + local orbitals (lo) method. In contrast to the quantum chemistry calculations we use a basis set consisting of a combination of plane waves and atomic-like basis sets localized in spheres around the ionic cores. We use in all calculations unit cells containing 31 atoms, a -mesh size of and a RKMAX=7.0, where RKMAX is the product of the smallest atomic sphere radius (1.57, 2.04, 2.5 bohr for Li, Na, K and 2.02, 2.5, 2.6 for F, Cl, Br, respectively) times the plane wave basis set cutoff KMAX. The required unit cell sizes and the Brillouin zone sampling ( mesh) are tested for convergence.
All calculations are carried out spin-polarized. The structure relaxations are performed using the PBE exchange-correlation functional Perdew et al. (1996). Since PBE strongly underestimates the band gap in most materials Wang and Klein (1981a, b); Heyd et al. (2005) (also known as the ”band-gap problem”), we calculate the electronic structure with the TB-mBJ potential Tran and Blaha (2009), which is parameterized to give accurate band gaps in semiconductors and insulators Koller et al. (2011, 2012). The TB-mBJ potential method can be viewed as an alternative to the very time-consuming approach Hedin (1965) giving almost identical results for the -center in LiF. Due to the strong localization of the -center electron, excitonic binding energies of several eV are expected. In contrast to the quantum chemistry calculations these electron-hole correlation effects are not included in standard band-structure calculations. To account for them we solve the Bethe-Salpeter equation Rohlfing and Louie (2000); Albrecht et al. (1998); Onida et al. (2002) (BSE) on top of the TB-mBJ calculations when calculating the absorption spectra.
III Models for F centers and the confining potential
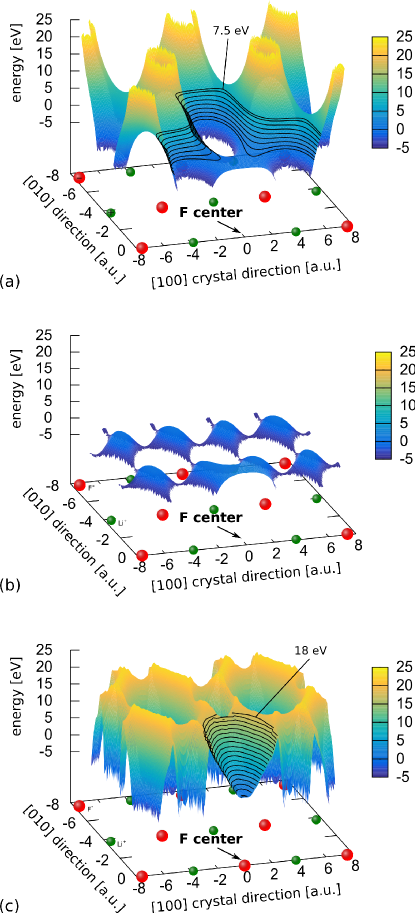
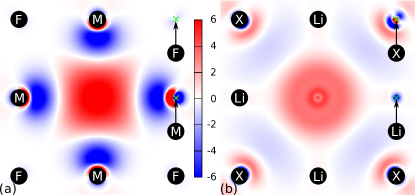
Shortly after the discovery of the Mollwo () and the Mollwo–Ivey () scaling for the F center absorption energies, two complementary simple models were proposed: FröhlichFröhlich (1933) deduced the scaling from the energy spacing between bands in the model of a delocalized nearly free electron in a potential of period , , where is the effective mass. Stöckmann, instead, proposed a hard-wall box potentialStöckmann (1951, 1952a, 1952b) for a completely localized defect electron that also gives rise to an scaling. The hard wall potential was viewed as a simplification for the local potential originating from the electrostatic Madelung potential: due to the missing anion, there is a plateau-like almost constant potential in the space between the 6 neighboring cations and the repulsive potential of the surrounding anions forms the wall of the potential box that has an approximate diameter of the lattice constant . A two-dimensional cut through the Madelung potential is shown in Fig. 2 (a) where the black contour lines show the effective wall of about 8 eV around the four in-plane Li ions adjacent to the vacancy. This observation gives rise to the picture of the F-center defect electron as a particle in the box model frequently exploited and refined in subsequent worksFowler (1968). The two seemingly contradictory models of Fröhlich and Stöckmann yield the same exponent since both models treat, effectively, the kinetic energy of the electron, either confined to a periodic structure or to a hard-walled box. In turn, the systematic deviation to smaller values below 2, , extracted by Ivey from a large data set was attributed first by WoodWood (1965) within his “point-ion model” to the competition between the quantum-confined kinetic energy and the Madelung potential energy, , where is the crystal specific Madelung constant, which scales . The Mollwo–Ivey relation was introduced as an effective single-exponent fit with to a power series expansion with the leading termsWood (1965)
| (2) |
Small element-specific corrections to the point-ion model due to the influence of nearest neighbors such as orthogonalization effects, referred to as ion-size effects, were, in turn, considered to scale with higher inverse powers in [Wood, 1965].
An elegant alternative approach to Eq. 1 was given by Malghani and SmithMalghani and Smith (1992); Smith and Malghani (1998) relating the absorption energy to the size of the defect wave function employing the Vinti sum ruleVinti (1932). The latter connects the moments of the frequency dependent absorption coefficient with the spatial extent of the wave function of the defect electron. The absorption energy can be related to the mean-squared radius of the s-like ground state as
| (3) |
where is the mass of the electron. Eq. 3 becomes exact in the limit of the one-electron (independent particle) description and when the radiation field resonantly couples only two discrete states. To the extent that the radius of the wave function, , can be directly related to the lattice constant, Eq. 3 yields the Mollwo–Ivey relation. We will scrutinize the latter relationship in more detail below. Deviations from the exponent have been again attributed to the Madelung potential (see Eq. 2). In turn, ion-size effects are invoked to account for small deviations from the Mollwo–Ivey exponent .
A critical analysis of these intuitive models proposed for the Mollwo–Ivey relation in the light of the ab-initio treatment of the problem leads to a revision of the particle-in-the-box picture. We have previously shownKarsai et al. (2014) for LiF that the F-center wave-function is localized within the vacancy site and has little weight at the neighboring ions. From the Madelung potential of Fig. 2 (a) alone, one would expect a significant “spill-out” of the defect wave function to the nearest-neighbor cations. The strong confinement of the F-center electron is due to exchange interaction and the orthogonality of the wave function with respect to the ion-cores. In other words: the effective box size is smaller than suggested by the Madelung potential. These effects, sometimes called “ion-size effects”, have been taken into account in the pre-ab-initio era through model potentials and trial wave-functions (see, e.g., Ref. [Wood, 1965]).
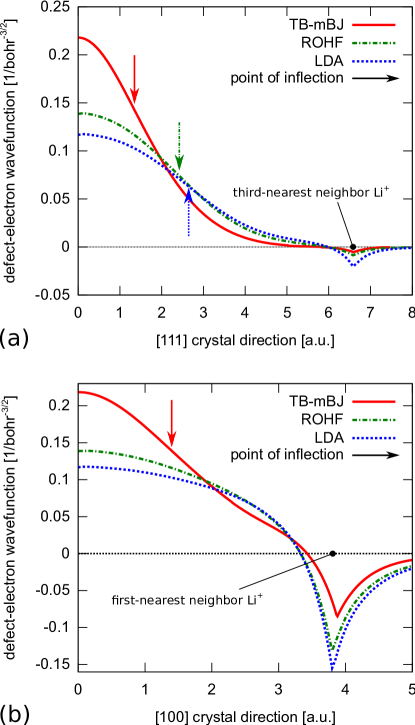
The Kohn–Sham potential (KS) in the local-density approximation (Fig.2 (b)), obtained from a periodic DFT calculation, appears to lack any confining potential. This is because the KS potential is the common potential for all electrons. After accounting for core and the valence electrons, the defect electron, due to orthogonality constraints, is localized within the vacancy region. A cut through the ground-state wave-function of the F-center (see Fig. 1) shows clearly a point of inflection which indicates the presence of an effective potential barrier and penetration into a “classically forbidden” region. Parenthetically we note that the PBE exchange-correlation functionalPerdew et al. (1996) yields almost identical results for the total KS potential and the defect-electron wave function on the scale of Figs. 1 and 2 (b).
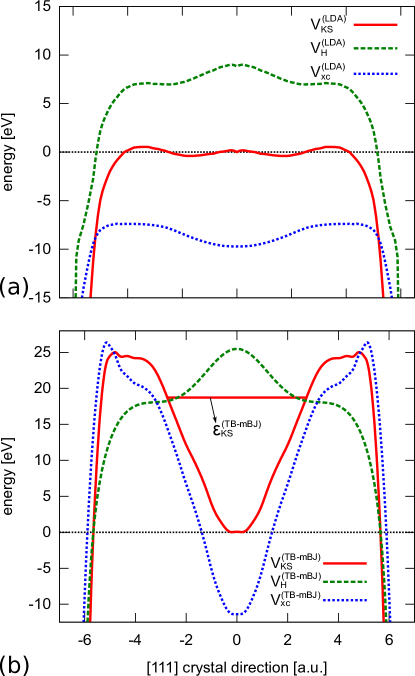
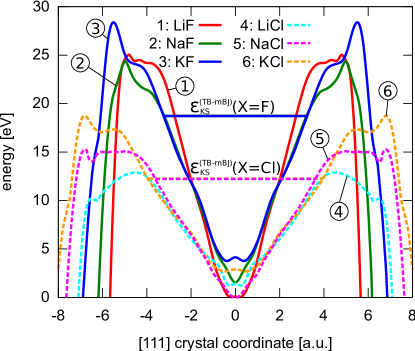
The potential barrier becomes visible (Fig. 2 (c)) in the Kohn–Sham potential , calculated with the TB-mBJ approximation to the exchange-correlation potential. In this case, a pronounced potential well is present. Its depth varies between 17 and 25 eV depending on the crystallographic direction. A cut through the potential surface along the [111] direction (fig. 3) clearly shows that the Hartree potential, consisting of the electrostatic contributions of the point nuclei and the self-consistent electron density, gives rise to a local maximum in the potential near the location of the color center. Within the TB-mBJ approximation, it is the exchange-correlation potential that is responsible for the formation of an attractive potential well in the total effective Kohn–Sham potential and the confinement of the s-like defect-electron orbital with Kohn–Sham energy (Fig. 3 (b)). The large differences between and are not surprising as the TB-mBJ exchange-correlation potential is designed to reproduce the experimental band gap of, e.g., LiF, which is severly underestimated by the LDA, by raising the effective potential in the interstitial regions. In view of these differences, however, an interpretation in terms of a realistic landscape should be taken with caution as the confinement of the wavefunction stems largely from the orthogonality requirement built into the non-local potential. We will use in the following rather as a useful approximation to the effective potential that an isolated defect electron would feel in an otherwise fixed charge distribution.
Despite the pronounced differences between the potentials and (Fig. 3 (a) and (b), respectively), as well as the non-local Hartree–Fock potential the resulting wave-functions for the defect electron are very similar (Fig. 1) featuring a point of inflection indicative for an effective confining potential well. Our current observations shed new light on Eq. 2: what was earlier considered to be a small “ion-size” correction to the leading exponent , is in fact the dominant contribution to the formation of the (effective) well and, thus, to the Mollwo–Ivey exponent itself. It should be noted, however, that the effective size of the potential well in terms of the classically allowed region of the wave function, as marked by the point of inflection, cannot be determined for all spatial directions. Along, e.g., [100] no point of inflection can be found in LDA and ROHF wavefunctions (Fig. 1 (b)). lies above the barrier top in this direction, still the TB-mBJ wavefunction displays a point of inflection due to orthogonalization. We introduce in the following as effective measure for the size of the F-center function the position of the (first) zero of the s state along the [100] direction which accounts for the required orthogonality to the nearest-neighbor ionic states. Another measure of the size of the F-center is the mean-square radius of the wave-function (Eq. (3)).
The spill-out of the defect wave function into the region of neighboring ions (Fig. 1) is experimentally accessible through the Fermi contact term in the hyperfine interaction between the defect-electron and the ion cores surrounding it. This quantity has been measured experimentally through electron-nuclear double resonance (ENDOR), developed by FeherFeher (1957) and it is proportional to the spin density at the nuclear sites of the host crystalBucher (2000)
| (4) |
with the Bohr magneton , the nuclear magneton , the electron and nuclear factors, and the total density difference of spin up and spin down electrons . Holton and BlumHolton and Blum (1962) performed systematic ENDOR studies and measured the Fermi contact term at the first, second, and third nearest neighbor ions of the F-center electron in various alkali halides. Mallia et al. [Mallia et al., 2001] as well as Leitão et al. [Leitão et al., 2002] performed unrestricted Hartree–Fock (UHF) and spin-polarized LDA ab-initio calculations of which agree well with our data. UHF gives a Fermi contact term for the nearest-neighbor Li+ ion in LiF to within one percent of the experimental value ( bohr-3) while confines the defect electron too weakly resulting in an overestimation by %. TB-mBJ, on the other hand, localizes the defect orbital too strongly leading to an underestimation of by %. Independent of the method, the errors become larger for crystals with cations largerLeitão et al. (2002) than Li+ as well as for second and third nearest neighbor sitesMallia et al. (2001) of the F center.
Leitão et al. found that an unrestricted or spin polarized calculation is a prerequisite for accurately determining the Fermi contact. In the ROHF approximation the spin density reduces to the density of the F-center electron and, therefore, it neglects spin-dependent polarization of core electrons. This polarization accounts for % of the spin density at the nearest neighbor Li+ site in LiF and up to % in crystalsLeitão et al. (2002) with larger ions. Despite this substantial difference between ROHF and UHF we find essentially identical single-particle defect wave functions for the F-center electron and identical Fermi contact terms if, in both approaches, only the defect orbital is considered. This indicates that is strongly influenced by local properties of the ions surrounding the defect and, therefore, is not a reliable measure for the confining potential. In the following we focus on ROHF defect wave functions as they are the starting point for the CASPT2(ROHF) calculations of the F-center absorption energies.
IV Scaling with lattice constant
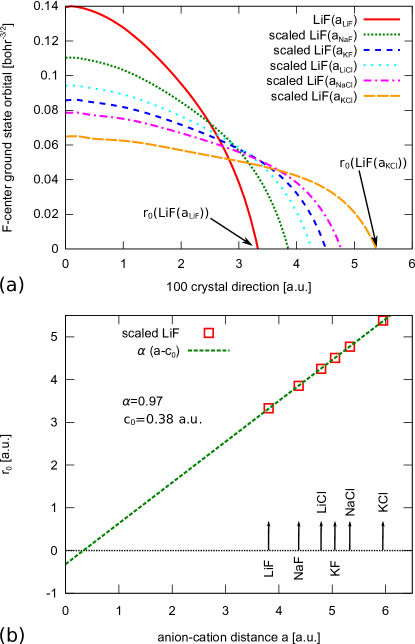
To explore the physics underlying the Mollwo-Ivey relation, we introduce in the following the scaled alkali-halide model for which we determine its F-center absorption spectrum and wave functions fully ab-initio. In this model also referred to in the following as scaled LiF we treat the lattice parameter as continuous variable covering the lattice constants of all alkali halides while retaining the ionic constituents Li+ and F- thereby disentangling the dependence on lattice constant from those on the ionic cores (i.e. “ion-size effects”). We choose Li+ and F- as the constituents as they represent the alkali halide with the smallest ionic radii coming closest to the ion-point model. Obviously, for the study of the scaling with presented in the following we omit any lattice relaxation or corrections due to electron-phonon coupling that result in corrections for real materials (see below). For scaled LiF, the F-center absorption energy (Fig. 4) decreases monotonically with resulting in an effective Mollwo–Ivey exponent remarkably close to (the CASPT2 calculation yields , while the DFT+BSE approach yields ) almost perfectly matching the prediction for the particle in the box model. As measure for the extent of the defect wave function we use the position of the first radial node of along the [100] crystal direction. As noted above, along the [100] direction the single-particle energy of typically lies above the potential barrier which renders other measures such as, e.g., the point of inflection unreliable. For all lattice constants considered (Fig. 4) we find that % of the defect electron probability density is localized within a sphere with a radius of centered at the vacancy. Cuts through the ROHF wave function along the [100] direction (Fig. 5) evaluated at anion-cation distances corresponding to those of various alkali halides (shown for clarity only for ) display a linear increase of (see Fig. 5 (b)). The effective radius for the scaled system can be fitted to with and bohr representing the effective range of the exchange potential of the next-nearest cation. It is interesting to note that by applying the Vinti sum rule (Eq. 3) to the experimental absorption spectra of real materials Malghani and Smith found a similar linear increase of the rms radius . From this observation they concluded that ion-size effects have only a negligible influence on the spatial extent of . This would suggest that also for real alkali halides would closely follow of the scaled systems. We show in the following that this is not the case.
V Ion-size effects
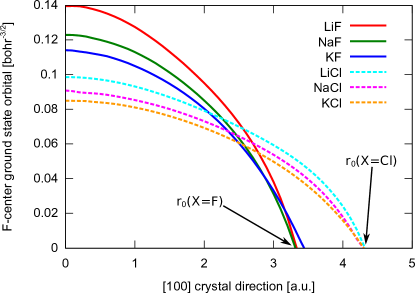
We turn now to the real alkali halides. The effective Kohn–Sham potential wells (Fig. 6, shifted in energy for clarity) form distinct groups depending on the anionic species. Within the group of fluoride and chloride crystals, respectively, all potential wells, independent of the lattice parameter, have a similar depth and similar slope of the the walls. We find the same trend for the spatial extent of the F-center ground state ROHF orbitals for the different, unrelaxed alkali halides (Fig. 7). Typically, 75 to 90% of the electron are localized within a sphere around the defect with a radius . The defect orbitals clearly split into two groups according to the anion species. Remarkably, the radial nodes for a given anion species almost coincide. We find for fluorides a radial node at bohr and for chlorides bohr. We have previously shownKarsai et al. (2014) that for LiF the displacement of the Li cations due to relaxation is bohr. We, therefore, expect that ordering into groups with almost identical depending on the anion, , persists when material-specific relaxation is included. Likewise, the close correspondence between the HF defect orbitals and the natural orbital of the N-electron wave function evaluated at the CASPT2 level, demonstrated for LiF [Karsai et al., 2014], indicates that correlation effects will not lift this degeneracy of with respect to the cationic constituent M.
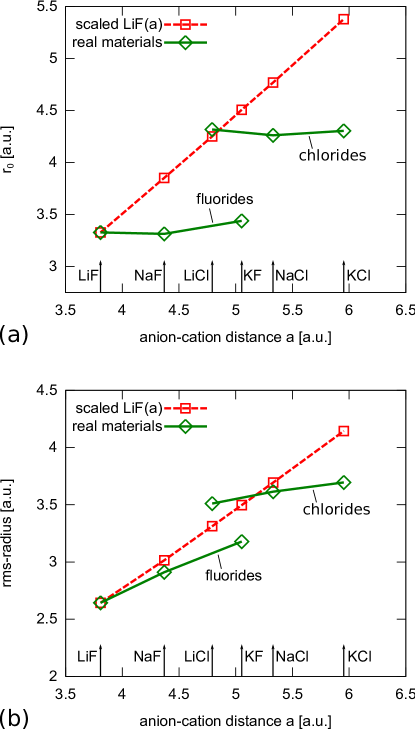
The dramatic difference between the linear increase in for the scaled LiF model, , and the discontinuous jumps in real alkali halides is demonstrated in Fig. 8 (a). This clustering is not specific to . A similar, yet less pronounced, clustering and deviation from linear scaling is found for the rms radius (Fig. 8 (b)). Both and rms display strong ion-size effects suggesting that larger ions tend to compress the ground-state wave function in line with results found by Gourary and AdrianGourary and Adrian (1957) who added effects of exchange to their point-ion model. This differs from the linear scaling and negligible influence of ion-size effects previously suggestedMalghani and Smith (1992); Smith and Malghani (1998).
The element-specific effects of the ionic core on the defect state can be studied on the ab-initio level by considering an alkali-halide model system with fixed lattice constant while varying the cation and anion species. We choose as fixed anion-cation distance bohr. In the following denotes the alkali metal, the halide and denotes the F-center electron density in the crystal MX. We study the density variation within the fixed F-center volume. The effect of exchanging the metal, , and the halide, , are twofold (Fig. 9). First, in the vicinity of the missing anion and show an accumulation (or compression) of the defect-electron density within the vacancy which displays strong directionality. Replacing the Li cation by an Na cation (Fig. 9 (a)) strongly compresses the defect electron in the vacancy along the [100] and the [010] crystal direction. The direction of the compression is along the [110] and [1-10] crystal axis, the two diagonals in Fig. 9 (b), when the F anion is replaced by a Cl anion and is weaker than for the exchange of cations. Second, at the position of the ionic neighbor to be exchanged we also observe an increase in density when smaller ionic cores are replaced by larger ones. The ROHF Fermi contact term at the corresponding metal or halide site increases by a factor upon replacing Li+ by Na+ or F- by Cl-. This increase of density reflects the increasingly stringent orthogonality requirement on the defect wave function imposed by large ionic cores. Thus, the density increases both at the vacancy site and at the neighboring ionic site. While the former is the consequence of the compression of the defect wave function, the latter is a subtle local effect on the tails of the wave function due orthogonalization and should not be taken as a measure for the effective size of the confining “box” potential. The compression observed in the present study is in contradiction to the results of Smith and InokutiSmith and Inokuti (2001) who concluded that the rms of the F-center wave function increases with the ionic size of the cation. For the model alkali halide system with fixed lattice constant we find a decrease of the rms value from 4.14 to 4.04 bohr when replacing LiF by NaF and from 4.18 to 4.04 bohr when replacing LiCl by NaCl. We note that the rms radii are almost independent of the anionic constituent.
The approximate independence of (or rms) on the anionic species in real alkali halides (Figs. 8) can be explained in terms of the well-known model of effective ionic radii in pristine crystalsShannon (1976). From measurements of the lattice constants in different alkali-halide crystals radii for anions and cations are extracted which are expected to be independent of the crystal composition. Adding up the effective radii and of the cation M and the anion X gives, to a good degree of approximation, the anion-cation distance of the crystal MX. Following this reasoning, the F-center electron should have the same spatial extent within a given halide which is in qualitative agreement with the values of the F-center in real materials (Fig. 8). Using this effective ionic radii model, we find even quantitative agreement when we estimate the value of the real material from these of the scaled LiF value after correcting for the ionic radius of the cation M. The second column in table 1 lists the value evaluated within the scaled LiF model at the lattice constant . The value of the real alkali halide MX, , follows then as
| (5) |
by correcting for the difference between the ionic radii for the metal under consideration (third column) and for Li chosen as the metallic constituent of the scaled alkali halide. The resulting values (Eq. 5, fourth column) provide a near-perfect match with the numerical values found in our ab-initio simulation (Fig. 8). This accurate prediction of the effective-radii model for suggests the following conclusions: along the [100] direction the extent of the ground state defect wave function in real materials is constant for a given anionic species because the increase of the vacancy wave function due to growing lattice constant when changing M, e.g., from LiF to NaF is completely compensated for by the increased size of the cation, i.e. the nearest neighbor size. When exchanging the anion for given cation, going from, e.g., LiF to LiCl, the defect-wave function increases along the [100] direction exactly by the difference in anion radii, . This estimate for perfectly matches the difference in anion-cation distance of bohr between crystals with the same cation but different anions F- and Cl-.
| Crystal MX | |||
|---|---|---|---|
| LiF | |||
| NaF | |||
| KF | |||
| LiCl | |||
| NaCl | |||
| KCl |
VI Absorption Energies
Turning now to the absorption energies of F centers in real alkali halides, their values will be determined by two competing tendencies, the lattice spacing and ion size. Since the absorption energies are universally proportional to the mean-square radius of the F-center ground-state wave function (Eq. 3) we expect for of the alkali halide MX an exponent systematically below two, , as the increased ion-size effects offset the increased lattice constant. Therefore, the reduction from to the fitted value itself is the signature of ion-size effects and not the subtle deviations from this exponent as previously thought. The Madelung potential, previously involved in the explanation of the deviation of the exponent from 2 (Eq. 2), is of no relevance for the deviation of the Mollwo-Ivey exponent from 2. In the absence of ion-size effects but in the presence of the Madelung potential, the exponent would be as the ab-initio results for the scaled LiF model unambiguously show.
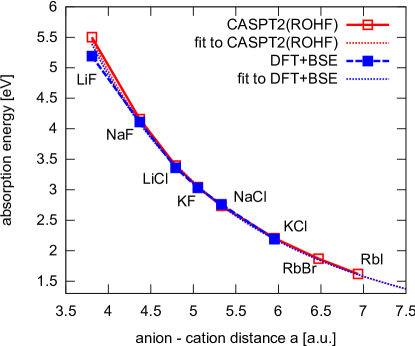
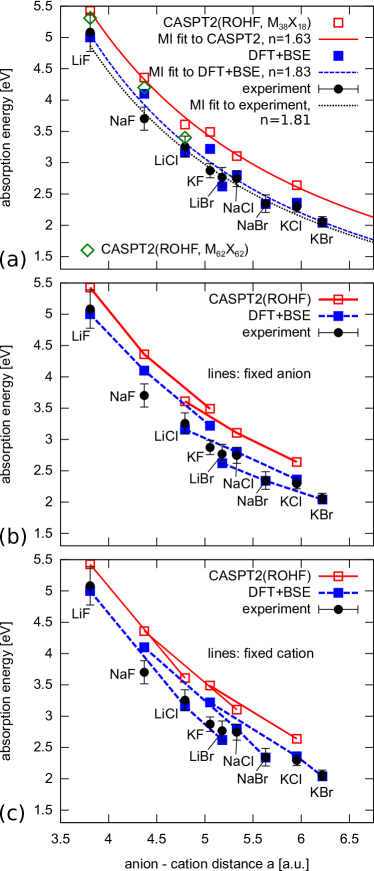
Fig. 10 (a) shows the experimental absorption energiesDawson and Pooley (1969) of the F-center in several materials together with the energies obtained from embedded quantum-chemistry cluster calculations and from DFT+BSE calculations. The error bars on the experimental data points indicate the large full-width at half maximum of the F-center absorption peak. Lines through the data points are Mollwo–Ivey-type fits with Mollwo–Ivey exponents of and . These values lie well below 2 as expected from the analysis above and is quite close to experiment, . All theoretical data points (CASPT2 and DFT+BSE) are calculated for a relaxed geometry which is determined by a periodic boundary DFT calculation using the PBE exchange-correlation potential. Corrections due to electron-phonon interaction are not included as downward shifts of the absorption energies of below 0.1 eV, close to those in LiF Karsai et al., 2014], are too small to alter the scaling behavior of the absorption energies. The CASPT2 absorption energies, denoted by the open-red squares (Fig. 10), are determined within an M38X18 cluster and are extrapolated to the converged basis set limit (see [Karsai et al., 2014]). For LiF, NaF, and LiF calculations with an active M62X62 cluster are computationally feasible leading to downward shifts of between 0.12 eV (LiF) and 0.21 eV (LiCl). M62X62 absorption energies are denoted by open-green diamonds (Fig. 10 (a)).
In order to illustrate that the effective Mollwo–Ivey line represents a “smoothed” average over discrete ion-size effects we present in Fig. 10 (b) and (c) the same data, however connected by lines according to the same anionic (Fig. 10 (b)) and cationic (Fig. 10 (c)) constituent. Ion-specific offsets and variations of the slope resembling the and rms values (Fig. 8) are clearly observable even though more pronounced in the simulations than in the experiment. Fitting the data separately for every anion with a Mollwo–Ivey type relation leads to exponents smaller than the one obtained by a fit of all absorption energies. When the cation species is kept constant a steeper decrease is found because the size of the narrowest constriction of the vacancy due to the nearest-neighbor cations continuously increases with . We note that in an earlier work by SmakulaSmakula et al. (1963) (see also [Wood, 1965]) separate fits to the Mollwo–Ivey relation for alkali halides with the cation fixed were presented. However, because of the weak dependence of the experimental data final conclusions were difficult to draw.
VII Conclusions
We present in this work an ab-initio study of the Mollwo–Ivey relation of F-centers in alkali-halide crystals based on post-DFT and post-HF methods. In contrast to earlier interpretations which stress the importance of the Madelung potential, we find ion-size effects to be the predominant mechanism forming the effective potential well within which the defect electron is mostly localized. The sizes of the neighbor ions determine the shape of the defect-electron wave function and are, therefore, responsible for the fractional Mollwo–Ivey exponent of 1.81. If it were not for ion-size effects a Mollwo–Ivey exponent of would emerge. We have introduced the model system of scaled LiF in which we increase the anion-cation distance while keeping ion sizes constant. The F-center absorption energies in scaled LiF obey a Mollwo–Ivey relation with an exponent of 2 equal to the three-dimensional particle-in-a-box model by Stöckmann. The reduced Mollwo–Ivey exponent for “real” materials suggests neighboring ions compressing the defect electron wave function within the vacancy region. This leads to a reduced growth of the wave function’s extent with increasing lattice parameter which, via the Vinti sum rule, is directly connected to the absorption energy. A qualitative picture of this compression is gained by studying ab-initio differences of defect-electron densities in different alkali-halides at a fixed anion-cation distance. A semi-quantitative picture is obtained by examining radial nodes of Hartree–Fock defect electron wave functions the positions of which perfectly agree with predictions from the effective ion-radii model.
We have found ion-dependent offsets in the F-center absorption energies in our simulations also visible in experiment, however less pronounced. Future work should focus on effects responsible for the “smoothing out” of these offsets such as lattice relaxations, ion-dependent electron-phonon coupling corrections and other possible effects. Further, we hope the analysis presented above can be applied to color-centers in more complex materials and to defects hosting more than a single electron. Mollwo–Ivey like relations exist for such defects (see, e.g., [Williams et al., 1977; Li et al., 2013]), however, with exponents far from . The same is true for fluorescence from F centers where the Mollwo–Ivey like relations differ stronglyBaldacchini (1992); Da Silva (2005) from the absorption case due to the large Stokes shifts.
VIII Acknowledgments
We thank H. Jiang and F. Aquilante for discussions and technical support. Further, thanks are due to L. Seijo for providing AIMPs for LiCl. This work was supported by the Austrian Fonds zur Förderung der wissenschaftlichen Forschung (Projects SFB F41 “ViCoM” and the doctoral college W1243 “Solids4Fun”). F.K. and P.B. acknowledge the support by the TU Vienna doctoral college COMPMAT. L.W. acknowledges support by the National Research Fund, Luxembourg (Project C12/MS/3987081/TSDSN). Calculations were performed on the Vienna Scientific Cluster (VSC), on the SGI Altix UltraViolet 1000 of the Austrian Center for Scientific Computing (ACSC) installed at the Johannes Kepler University Linz and at the IDRIS supercomputing center, Orsay (Proj. No. 091827).
References
- Nemoto et al. (2014) K. Nemoto, M. Trupke, S. J. Devitt, A. M. Stephens, B. Scharfenberger, K. Buczak, T. Nöbauer, M. S. Everitt, J. Schmiedmayer, and W. J. Munro, Phys. Rev. X 4, 031022 (2014).
- Ter-Mikirtychev and Tsuboi (1996) V. V. Ter-Mikirtychev and T. Tsuboi, Prog. Quant. Electr. 20, 219 (1996).
- Chiamenti et al. (2014) I. Chiamenti, F. Bonfigli, A. S. L. Gomes, F. Michelotti, R. M. Montereali, and H. J. Kalinowski, J. Appl. Phys. 115, 023108 (2014).
- Koyama and Suemoto (2011) T. Koyama and T. Suemoto, Rep. Prog. Phys. 74, 076502 (2011).
- Carrasco et al. (2006) J. Carrasco, C. Sousa, F. Illas, P. V. Sushko, and A. L. Shluger, J. Chem. Phys. 125, 074710 (2006).
- Ma and Rohlfing (2008) Y. Ma and M. Rohlfing, Phys. Rev. B 77, 115118 (2008).
- Rinke et al. (2012) P. Rinke, A. Schleife, E. Kioupakis, A. Janotti, C. Rödl, F. Bechstedt, M. Scheffler, and C. G. V. de Walle, Phys. Rev. Lett. 108, 126404 (2012).
- Karsai et al. (2014) F. Karsai, P. Tiwald, R. Laskowski, F. Tran, D. Koller, S. Gräfe, J. Burgdörfer, L. Wirtz, and P. Blaha, Phys. Rev. B 89, 125429 (2014).
- Mollwo (1931) E. Mollwo, Nachr. Ges. Wiss. Göttingen , 97 (1931).
- Ivey (1947) H. F. Ivey, Phys. Rev. 72, 341 (1947).
- Dawson and Pooley (1969) R. K. Dawson and D. Pooley, Phys. Status Solidi B 35, 95 (1969).
- Malghani and Smith (1992) M. Malghani and D. Smith, Phys. Rev. Lett. 69, 184 (1992).
- Fröhlich (1933) H. Fröhlich, Z. Phys. 80, 819 (1933).
- Stöckmann (1951) F. Stöckmann, Z. Phys. Chem. 198, 215 (1951).
- Stöckmann (1952a) F. Stöckmann, Naturwissenschaften 39, 226 (1952a).
- Stöckmann (1952b) F. Stöckmann, Naturwissenschaften 39, 246 (1952b).
- Wood (1965) R. F. Wood, J. Phys. Chem. Solids 26, 615 (1965).
- Fowler (1968) W. B. Fowler, The Physics of Colour Centers (Academic, New York, 1968).
- Buchenauer and Fitchen (1968) C. J. Buchenauer and D. B. Fitchen, Phys. Rev. 167, 846 (1968).
- Bartram et al. (1968) R. H. Bartram, A. M. Stoneham, and P. Gash, Phys. Rev. 176, 1014 (1968).
- Smith and Malghani (1998) D. Y. Smith and M. S. Malghani, Nucl. Instrum. Meth. B 141, 42 (1998).
- de Graaf et al. (1998) C. de Graaf, C. Sousa, and R. Broer, J. Mol. Struct. (THEOCHEM) 458, 53 (1998).
- Huzinaga et al. (1986) S. Huzinaga, L. Seijo, Z. Barandiarán, and M. Klobukowski, J. Chem. Phys. 86, 2132 (1986).
- Seijo and Barandiarán (1999) L. Seijo and Z. Barandiarán, “The Ab Initio model potential method: A common strategy for effective core potential and embedded cluster calculations,” in Computational Chemistry: Reviews Of Current Trends (World Scientific, Singapur, 1999) Chap. 2, pp. 55–152.
- Evjen (1932) H. M. Evjen, Phys. Rev. 39, 675 (1932).
- Dunning (1988) T. H. Dunning, J. Chem. Phys. 90, 1007 (1988).
- Pierloot et al. (1995) K. Pierloot, B. Dumez, P.-O. Widmark, and B. Roos, Theor. Chim. Acta 90, 87 (1995).
- Aquilante et al. (2010) F. Aquilante, L. De Vico, N. Ferré, G. Ghigo, P.- . Malmqvist, P. Neogrády, T. B. Pedersen, M. Pitoňák, M. Reiher, B. O. Roos, L. Serrano-Andrés, M. Urban, V. Veryazov, and R. Lindh, J. Comput. Chem. 31, 224 (2010).
- Grüneis et al. (2010) A. Grüneis, M. Marsman, and G. Kresse, J. Chem. Phys. 133, 074107 (2010).
- Blaha et al. (2001) P. Blaha, K. Schwarz, G. K. H. Madsen, D. Kvasnicka, and J. Luitz, wien2k: An Augmented Plane Wave plus Local Orbitals Program for Calculating Crystal Properties (Vienna University of Technology, Austria, 2001).
- Perdew et al. (1996) J. P. Perdew, K. Burke, and M. Ernzerhof, Phys. Rev. Lett. 77, 3865 (1996).
- Wang and Klein (1981a) C. S. Wang and B. M. Klein, Phys. Rev. B 24, 3393 (1981a).
- Wang and Klein (1981b) C. S. Wang and B. M. Klein, Phys. Rev. B 24, 3417 (1981b).
- Heyd et al. (2005) J. Heyd, J. E. Peralta, G. E. Scuseria, and R. L. Martin, J. Chem. Phys. 123, 174101 (2005).
- Tran and Blaha (2009) F. Tran and P. Blaha, Phys. Rev. Lett. 102, 226401 (2009).
- Koller et al. (2011) D. Koller, F. Tran, and P. Blaha, Phys. Rev. B 83, 195134 (2011).
- Koller et al. (2012) D. Koller, F. Tran, and P. Blaha, Phys. Rev. B 85, 155109 (2012).
- Hedin (1965) L. Hedin, Phys. Rev. 139, A796 (1965).
- Rohlfing and Louie (2000) M. Rohlfing and S. G. Louie, Phys. Rev. B 62, 4927 (2000).
- Albrecht et al. (1998) S. Albrecht, L. Reining, R. D. Sole, and G. Onida, Phys. Rev. Lett. 80, 4510 (1998).
- Onida et al. (2002) G. Onida, L. Reining, and A. Rubio, Rev. Mod. Phys. 74, 601 (2002).
- Vinti (1932) J. Vinti, Phys. Rev. 41, 432 (1932).
- Feher (1957) G. Feher, Phys. Rev. 105, 1122 (1957).
- Bucher (2000) M. Bucher, Eur. J. Phys. 21, 19 (2000).
- Holton and Blum (1962) W. C. Holton and H. Blum, Phys. Rev. 125, 89 (1962).
- Mallia et al. (2001) G. Mallia, R. Orlando, C. Roetti, P. Ugliengo, and R. Dovesi, Phys. Rev. B 63, 235102 (2001).
- Leitão et al. (2002) A. Leitão, R. Capaz, N. Vugman, and C. Bielschowsky, J. Mol. Struct (THEOCHEM) 580, 65 (2002).
- Gourary and Adrian (1957) B. S. Gourary and F. J. Adrian, Phys. Rev. 105, 1180 (1957).
- Smith and Inokuti (2001) D. Y. Smith and M. Inokuti, Radiat. Eff. Def. S. 155, 43 (2001).
- Shannon (1976) R. D. Shannon, Acta Crystallogr. Sect. A 32, 751 (1976).
- Smakula et al. (1963) A. Smakula, N. C. Maynard, and A. Repucci, Phys. Rev. 130, 113 (1963).
- Williams et al. (1977) R. T. Williams, C. L. Marquardt, J. W. Williams, and M. N. Kabler, Phys. Rev. B 15, 5003 (1977).
- Li et al. (2013) Q. Li, R. T. Williams, and D. Åberg, Phys. Status Solidi B 250, 233 (2013).
- Baldacchini (1992) G. Baldacchini, in Optical Properties of Excited States in Solids, NATO ASI Series, Vol. 301, edited by B. Bartolo and C. Beckwith (Springer US, 1992) pp. 255–303.
- Da Silva (2005) L. F. Da Silva, Radiat. Eff. Def. S. 160, 117 (2005).