email: rdscholz@aip.de 22institutetext: Astronomisches Rechen-Institut, Zentrum für Astronomie der Universität Heidelberg, Mönchhofstraße 12-14, D–69120 Heidelberg, Germany 33institutetext: Main Astronomical Observatory, 27 Academica Zabolotnogo Str., 03680 Kiev, Ukraine 44institutetext: Institute of Astronomy of the Russian Acad. Sci., 48 Pyatnitskaya Str., 109017 Moscow, Russia 55institutetext: Max-Planck-Institut für Astronomie, Königstuhl 17, D–69117 Heidelberg, Germany
Global survey of star clusters in the Milky Way
Abstract
Context. The global Milky Way Star Clusters (MWSC) survey carried out by Kharchenko et al. provided new cluster membership lists and mean cluster parameters for nearly 80% of all previously known Galactic clusters. The MWSC data reduction pipeline involved the catalogue of positions and proper motions (PPMXL) on the International Celestial Reference System (ICRS) and near-infrared photometry from the Two Micron All Sky Survey (2MASS).
Aims. In their first extension to the MWSC, Schmeja et al. applied photometric filters to the 2MASS to find new cluster candidates that were subsequently confirmed or rejected by the MWSC pipeline. To further extend the MWSC census, particularly of nearby clusters, we aimed at discovering new clusters by conducting an almost global search in proper motion catalogues as a starting point.
Methods. We first selected high-quality samples from the PPMXL and the Fourth US Naval Observatory CCD Astrograph Catalog (UCAC4) for comparison and verification of the proper motions. For 441 circular proper motion bins (radius 15 mas/yr) within 50 mas/yr, the sky outside a thin Galactic plane zone (5∘) was binned in small areas (’sky pixels’) of 0.250.25 deg2. Sky pixels with enhanced numbers of stars with a certain common proper motion in both catalogues were considered as cluster candidates. After visual inspection of the sky images, we built an automated procedure that combined these representations of the sky for neighbouring proper motion subsamples after a background correction. The 692 compact cluster candidates detected above a threshold that was equivalent to a minimum of 12 to 130 cluster stars in dependence on the Galactic latitude were then cross-checked with known star clusters and clusters of galaxies. New candidates served as input for the MWSC pipeline.
Results. About half of our candidates overlapped with known clusters (46 globular and 68 open clusters in the Galaxy, about 150 known clusters of galaxies) or the Magellanic Clouds. About 10% of our candidates turned out to be 63 new open clusters confirmed by the MWSC pipeline. They occupy predominantly the two inner Galactic quadrants and have apparent sizes and numbers of high-probable members slightly larger than those of the typically small MWSC clusters, whereas their other parameters (ages, distances, tidal radii) fall in the typical ranges. As our search aimed at finding compact clusters, we did not find new very nearby (extended) clusters, and the mean total proper motion of the new 63 clusters is with 6.3 mas/yr similar to the MWSC average (5.5 mas/yr). Only four new clusters have mean proper motions between 10 mas/yr and our observed maximum of about 13 mas/yr.
Key Words.:
Catalogs – Surveys – Proper motions – globular clusters: general – open clusters and associations: general – Galaxy: stellar content1 Motivation
Star clusters are considered as building blocks of the Galaxy. Their study is important for our understanding of star formation and the history of the Milky Way. They are possibly the birth places of all stars (Lada et al. lada93 (1993)). Our sun was probably born in a star cluster that dissolved long time ago; and searches are ongoing to find the lost solar siblings (see e.g. Portegies Zwart portegies09 (2009); Mishurov & Acharova mishurov11 (2011); Bobylev & Bajkova bobylev14 (2014); Batista et al. batista14 (2014)). A complete (volume-limited) census of the current population of Galactic star clusters is difficult to obtain because of gas and dust clouds disturbing our view towards the Galactic plane. But at least in the solar neighbourhood, we should aim at completeness for investigating all the different aspects related to Galactic star clusters. Systematic searches for missing nearby star clusters are necessary to fill the open cluster census; and new large star catalogues can be used for this purpose.
Over the last decade, we have directed our efforts to improve the membership and parameters of Galactic star clusters with a global approach and making use of uniform all-sky data. As a result, we first presented combined photometric/proper motion membership probabilities (Kharchenko et al. kharchenko04 (2004)) as well as cluster sizes, distances, colour-excesses, mean proper motions, and ages (Kharchenko et al. 2005a ) for 520 open clusters. This first cluster survey was based on the all-sky compiled catalogue of 2.5 million stars (ASCC-2.5; Kharchenko kharchenko01 (2001)) providing optical () photometry and proper motions. The ASCC-2.5 with its relatively bright stars served also as input for membership analysis and the determination of the same set of cluster parameters as provided for the first 520 clusters of another 130, including 109 newly discovered, open clusters (Kharchenko et al. 2005b ). The resulting Catalogue of Open Cluster Data (COCD) included 650 clusters.
Additional cluster parameters were later provided: radial velocities for a subsample of the 650 COCD clusters studied with the ASCC-2.5 and for additional fainter clusters (Kharchenko et al. kharchenko07 (2007), Conrad et al. conrad14 (2014)), tidal radii and masses of all 650 open clusters in the COCD (Piskunov et al. piskunov08 (2008)), cluster shape parameters (Kharchenko et al. 2009a ), and integrated magnitudes and colours in optical () and near-infrared () passbands together with luminosity functions of all 650 clusters (Kharchenko et al. 2009b ).
The COCD data have been extensively used by our group and by many other authors in numerous follow-up studies. Among the topics of these investigations are: the Galactic open cluster population including spatial/kinematical substructures and cluster complexes (Piskunov et al. piskunov06 (2006); Zhu zhu09 (2009); Wu et al. wu09 (2009); Elias et al. elias09 (2009); Vande Putte et al. vandeputte10 (2010); Gozha et al. gozha12 (2012); Morales et al. morales13 (2013)), the disruption of star clusters (Lammers et al. lammers05 (2005); Gieles & Bastian gieles08 (2008)), massive field stars and neutron stars (Posselt et al. posselt07 (2007); Schilbach & Röser schilbach08 (2008); Gvaramadze & Bomans gvaramadze08 (2008); Hubrig et al. hubrig11 (2011); Tetzlaff et al. tetzlaff14 (2014)), Cepheids (Anderson et al. anderson13 (2013); Chen et al. chen15 (2015)), and binaries in open clusters (de Grijs et al. degrijs08 (2008); Guerrero et al. guerrero14 (2014)).
A much more complete cluster survey based on about 470 million objects with near-infrared () photometry from the Two Micron All Sky Survey (2MASS; Skrutskie et al. skrutskie06 (2006)) supplemented by proper motions from the PPMXL catalogue (Röser, Demleitner & Schilbach roeser10 (2010)) was started by Kharchenko et al. (kharchenko12 (2012)) (hereafter paper I.) This Milky Way Star Clusters (MWSC) survey of all previously known clusters was completed by Kharchenko et al. (kharchenko13 (2013)) (paper II). For 3006 out of 3784 clusters mentioned in the literature, photometric/proper motion membership probabilities and cluster parameters (cluster centre, apparent size, distance, mean proper motion, colour excess, and age) were determined with the new dedicated data-reduction pipeline described in paper I. Tidal radii were also derived for most of these clusters, whereas radial velocities were estimated for about 30%. While this MWSC sample may be considered as almost complete within a distance of 1.8 kpc from the Sun, we found evidence for possibly missing relatively old () and nearby (within about 1 kpc) clusters (paper II).
Of course, the new largely extended stellar database raised high hopes for new cluster discoveries, too. However, to search for new clusters in the 2MASS/PPMXL data using the pipeline described in paper I, we first need some candidates or ”seeds”. In our first cluster search, the COCD extension based on the ASCC-2.5, a few hundred bright stars with available spectral classification, previously not known as cluster members, could be selected as cluster ”seeds” (Kharchenko et al. 2005b ). With the now available much larger stellar database, an obvious choice of ”seeds” would be stellar density enhancements in small sky areas. The 2MASS alone was already used to look for such density enhancements in the Galactic plane (20∘) by Froebrich et al. (froebrich07 (2007)), and their cluster candidates were included in the above mentioned input list of 3784 known clusters. A logical next step was to check the 2MASS data at higher Galactic latitudes. This was recently performed by Schmeja et al. (schmeja13 (2013)) (paper III) as a first extension of the MWSC survey. They discovered 139 new, mainly old, open clusters within about 3 kpc by applying filters in the 2MASS near-infrared colour-magnitude space and applying the data reduction pipeline described in paper I in the sky regions of their candidates.
Members of a star cluster are expected not only to concentrate in a small sky area but also to share a common proper motion. Therefore, the combination of both effects seemed to be another promising cluster search method. It should be in particular sensitive for nearby objects, as the mean cluster proper motions typically increase with smaller distances. Here, we present the results of a first nearly all-sky search, excluding only the immediate Galactic plane within 5∘, for new star clusters primarily based on the proper motions and positions of stars and involving the same large catalogues (PPMXL/2MASS) as used in papers I, II, and III. This is the second extension of the MWSC survey.
2 Quality check of global proper motion catalogues
To be consistent with the MWSC survey (papers I, II, and III), our cluster search, membership and parameter determination were based on proper motions from the PPMXL catalogue and its improved subset 2MAst (2MASS with astrometry) described in paper I. In addition, we used the proper motions from the Fourth US Naval Observatory CCD Astrograph Catalog (UCAC4; Zacharias et al. zacharias13 (2013)), but only for the verification of our cluster candidates. Both 2MAst and UCAC4 are accompanied by accurate near-infrared photometry and quality flags from 2MASS. Below we outline our selection criteria for the best data extracted from these two catalogues, a comparison of these data sets and an investigation of their systematic differences that may affect a cluster search by proper motion.
2.1 Selection of PPMXL (2MAst) objects
The PPMXL catalogue of Röser, Demleitner & Schilbach (roeser10 (2010)) gives positions and proper motions in the International Celestial Reference System (ICRS) for about 900 million objects. As it was based on the United States Naval Observatory (USNO) B1.0 catalogue (Monet et al. monet03 (2003)), the main source for determining the proper motions were measurements of photographic Schmidt plates. In certain sky regions, where these Schmidt plates overlap, the PPMXL contains multiple entries for the same objects, which would be confusing for a cluster search. However, the merger of 2MASS and PPMXL, the 2MAst catalogue (see paper I), lists the averaged proper motions for these objects and is therefore more appropriate for this task. It contains proper motions and accurate 2MASS photometry for about 399 million objects. As shown in Fig. 9 of Röser, Demleitner & Schilbach (roeser10 (2010)), the excluded PPMXL objects with lacking 2MASS measurement constitute the low-quality tail of the error distribution of the PPMXL proper motions starting at about 5 mas/yr and reaching up to 30 mas/yr.
To select a high-quality (HQ) subsample from the 2MAst catalogue, we applied the following selection criteria:
-
1.
2MASS photometric quality ’AAA’
- 2.
-
3.
More than three observations used for the proper motion
-
4.
Proper motion differences (if available) between PPMX (Röser et al. roeser08 (2008)) and PPMXL 6 mas/yr
-
5.
Proper motion errors 8 mas/yr at declinations 30∘ and 12 mas/yr at declinations 30∘
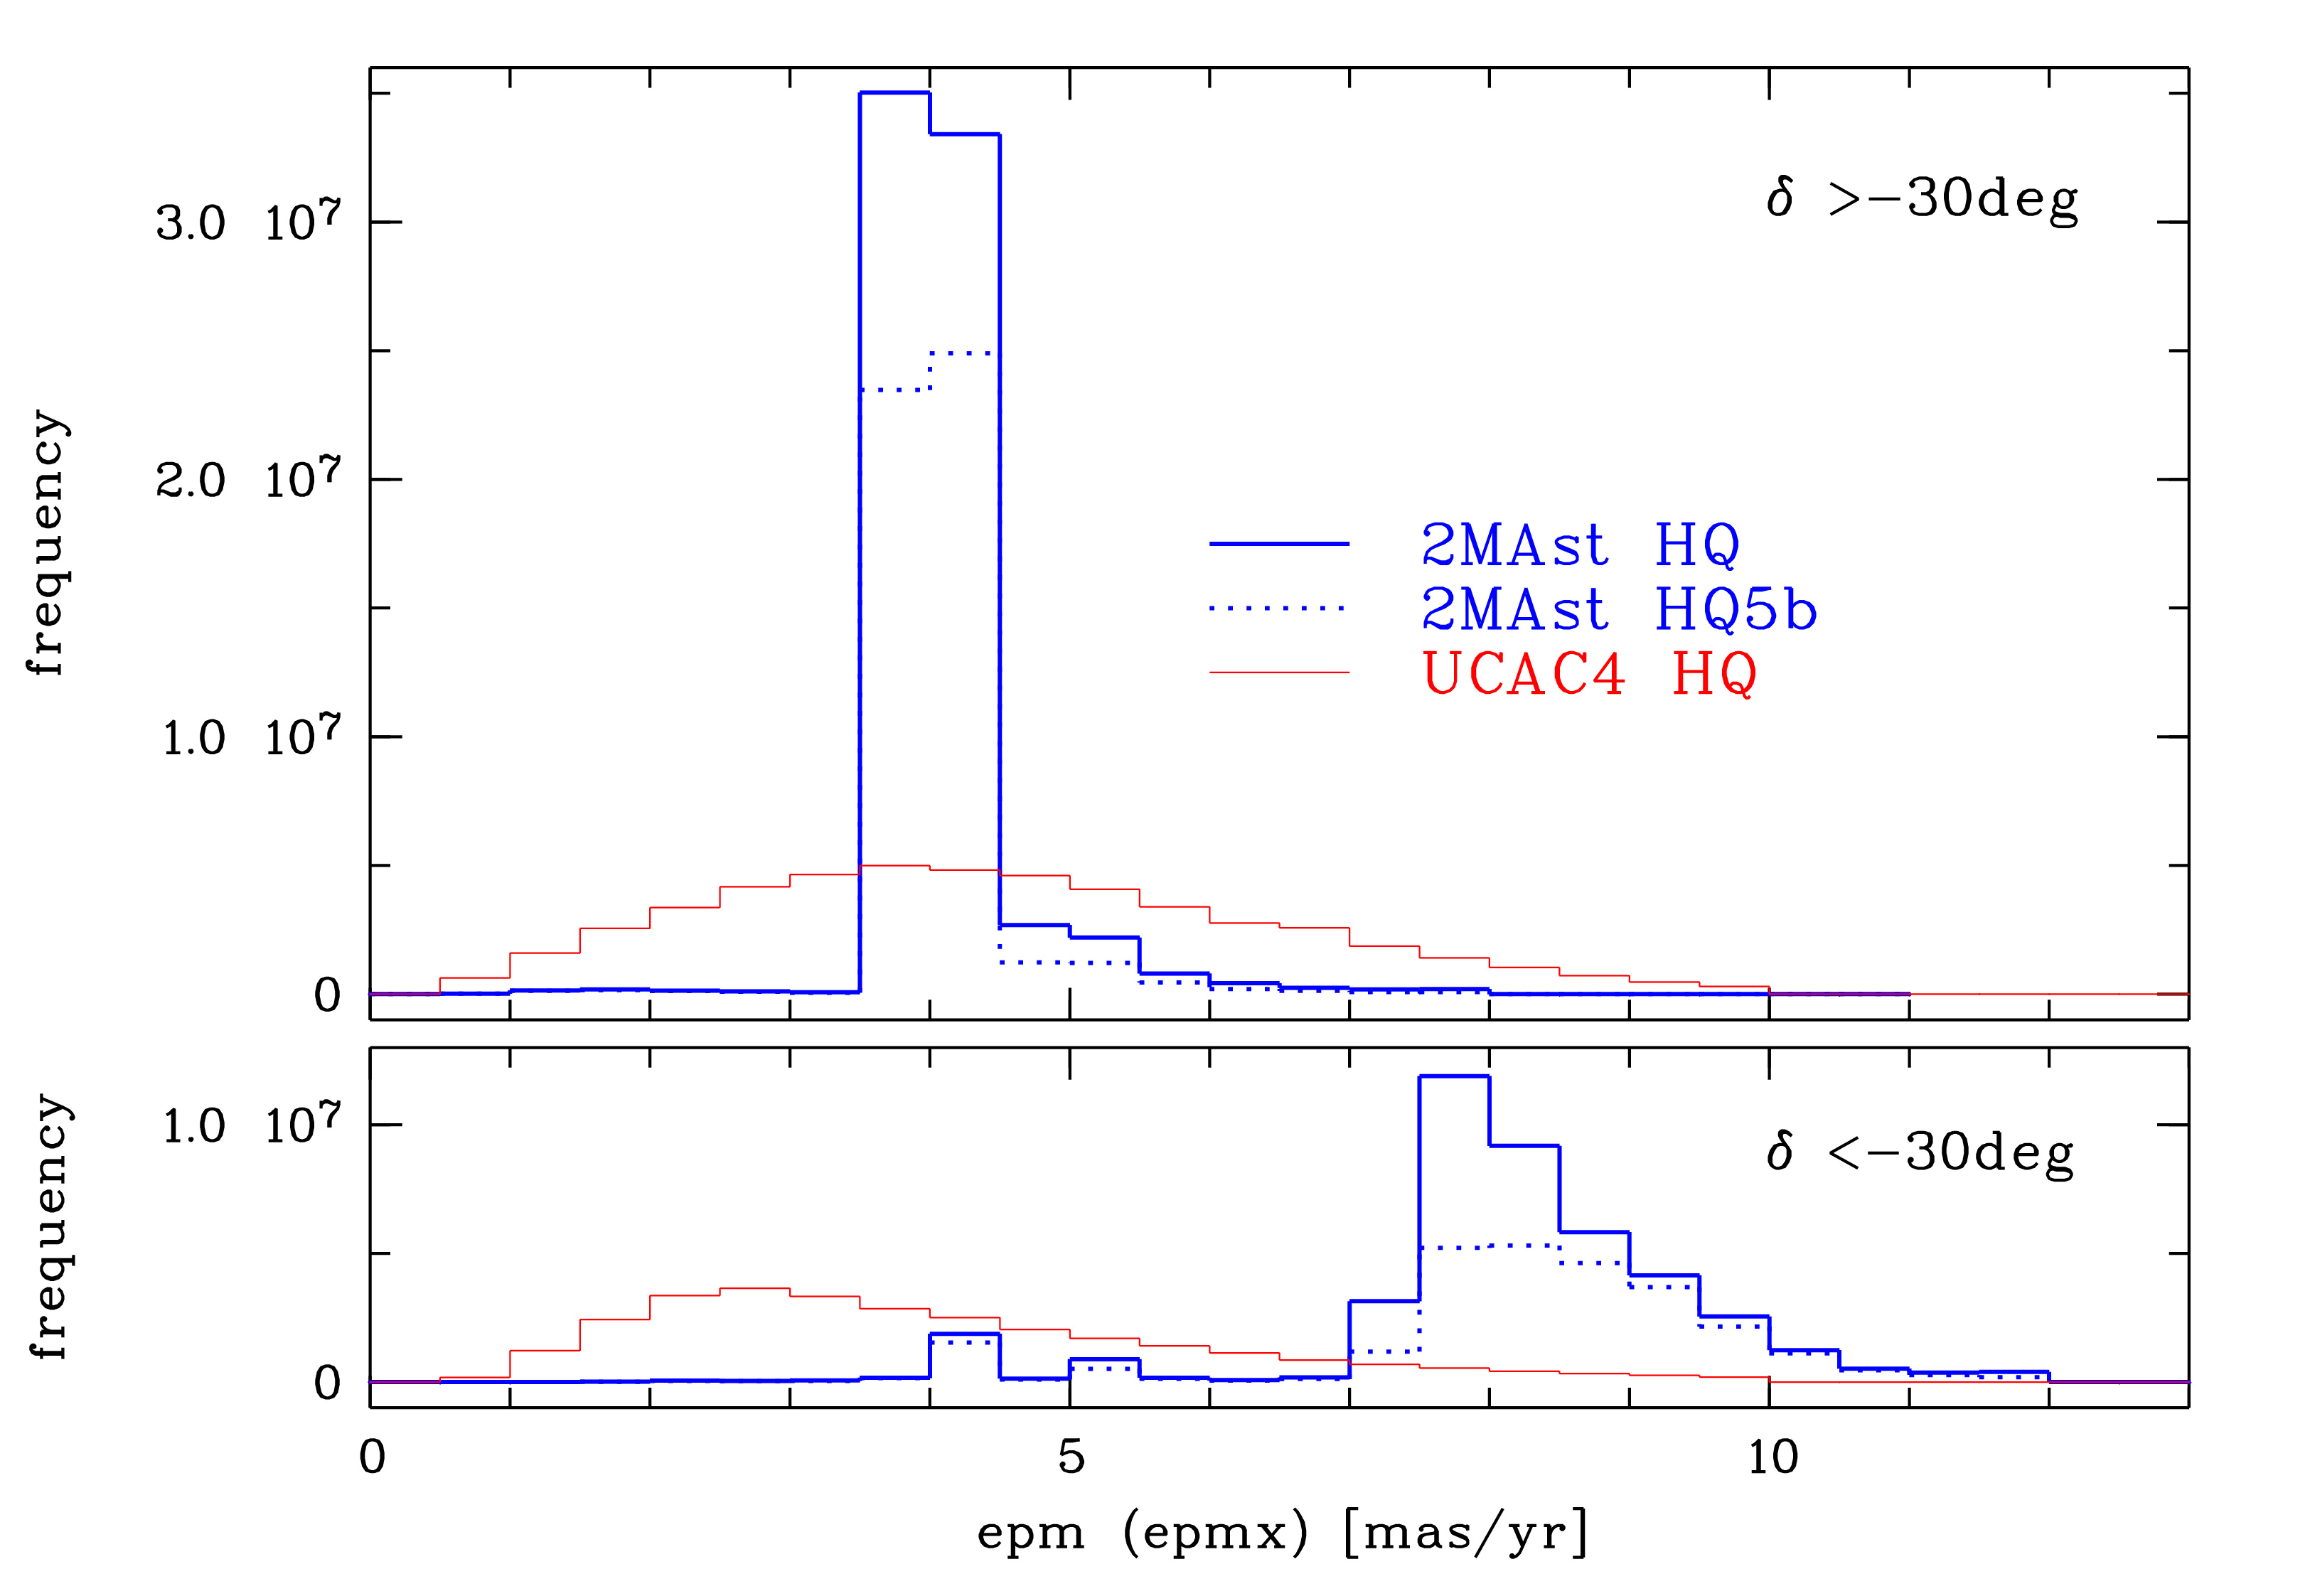
The first two conditions aimed at minimising the influence of extended (non-stellar) and overlapping images. These may be resolved to a different degree on the first- and second-epoch Schmidt plates used in various versions of the USNO catalogues and lead to false proper motions in the PPMXL. With the last three conditions we excluded uncertain proper motion measurements, where the different PPMXL proper motion quality north and south of 30∘ (see Fig. 9 of Röser, Demleitner & Schilbach roeser10 (2010)) was taken into account. We only allowed for relatively small proper motion differences between PPMX and PPMXL, as the PPMX was used in the construction of the PPMXL and also based in part on Schmidt plates and 2MASS data. With the above conditions we selected about 119 million objects for this 2MAst HQ sample (about 30% of the whole 2MAst). Their proper motion error distribution is shown in Fig. 1.
Because of the stronger image crowding on the Schmidt plates covering the Galactic plane, the PPMXL proper motions of both cluster and field stars become more unreliable with low Galactic latitudes. Therefore, we further excluded the Galactic latitude zone within 5∘ and arrived at about 79.2 million objects.
2.2 Selection of UCAC4 objects
The UCAC4 (Zacharias et al.zacharias13 (2013)) provides proper motions on the ICRS for about 105 million objects and also includes 2MASS photometry. UCAC4, unlike the previous version UCAC3, does not involve any Schmidt plate data in the determined proper motions. Therefore, for the majority of fainter objects, the UCAC4 proper motions are practically independent from those given in the PPMXL. Our HQ selection criteria applied to the UCAC4 were:
-
1.
Combined 2MASS contamination and photometric flags 5 (no artefacts/contamination and quality ’AAA’)
-
2.
Combined UCAC4 double star flag 0
-
3.
UCAC4 object flag 2
-
4.
Proper motion errors 10 mas/yr
The first two conditions are equivalent to the first two 2MAst conditions. However, because of the higher spatial resolution of the observations used for determining UCAC4 proper motions compared to the Schmidt plates used in 2MAst, the second condition is an even stronger constraint. Concerning the UCAC4 object flag (third condition), we initially tried to use only zero values (’good, clean star, no known problem’), but noticed large areas of sky in a declination zone between 10∘ and 20∘, where for some unknown reason this flag was always set to 1 (’near overexposed star’). Therefore, we finally allowed it to be equal to zero or 1 all over the sky. Finally, by the last condition of proper motion errors smaller than 10 mas/yr, we decided for a value in between the two chosen limits in the 2MAst. As can be seen in Fig. 24 of Zacharias et al. (zacharias13 (2013)), the tail of the error distribution of UCAC4 proper motions (10-35 mas/yr) contains less than 5% of all objects. The final number of objects in our chosen UCAC4 HQ sample was about 79.0 million (about 75% of all UCAC4 objects with proper motions). We show the proper motion error distribution of the UCAC4 HQ sample in Fig. 1.
2.3 Comparison of 2MAst HQ and UCAC4 HQ
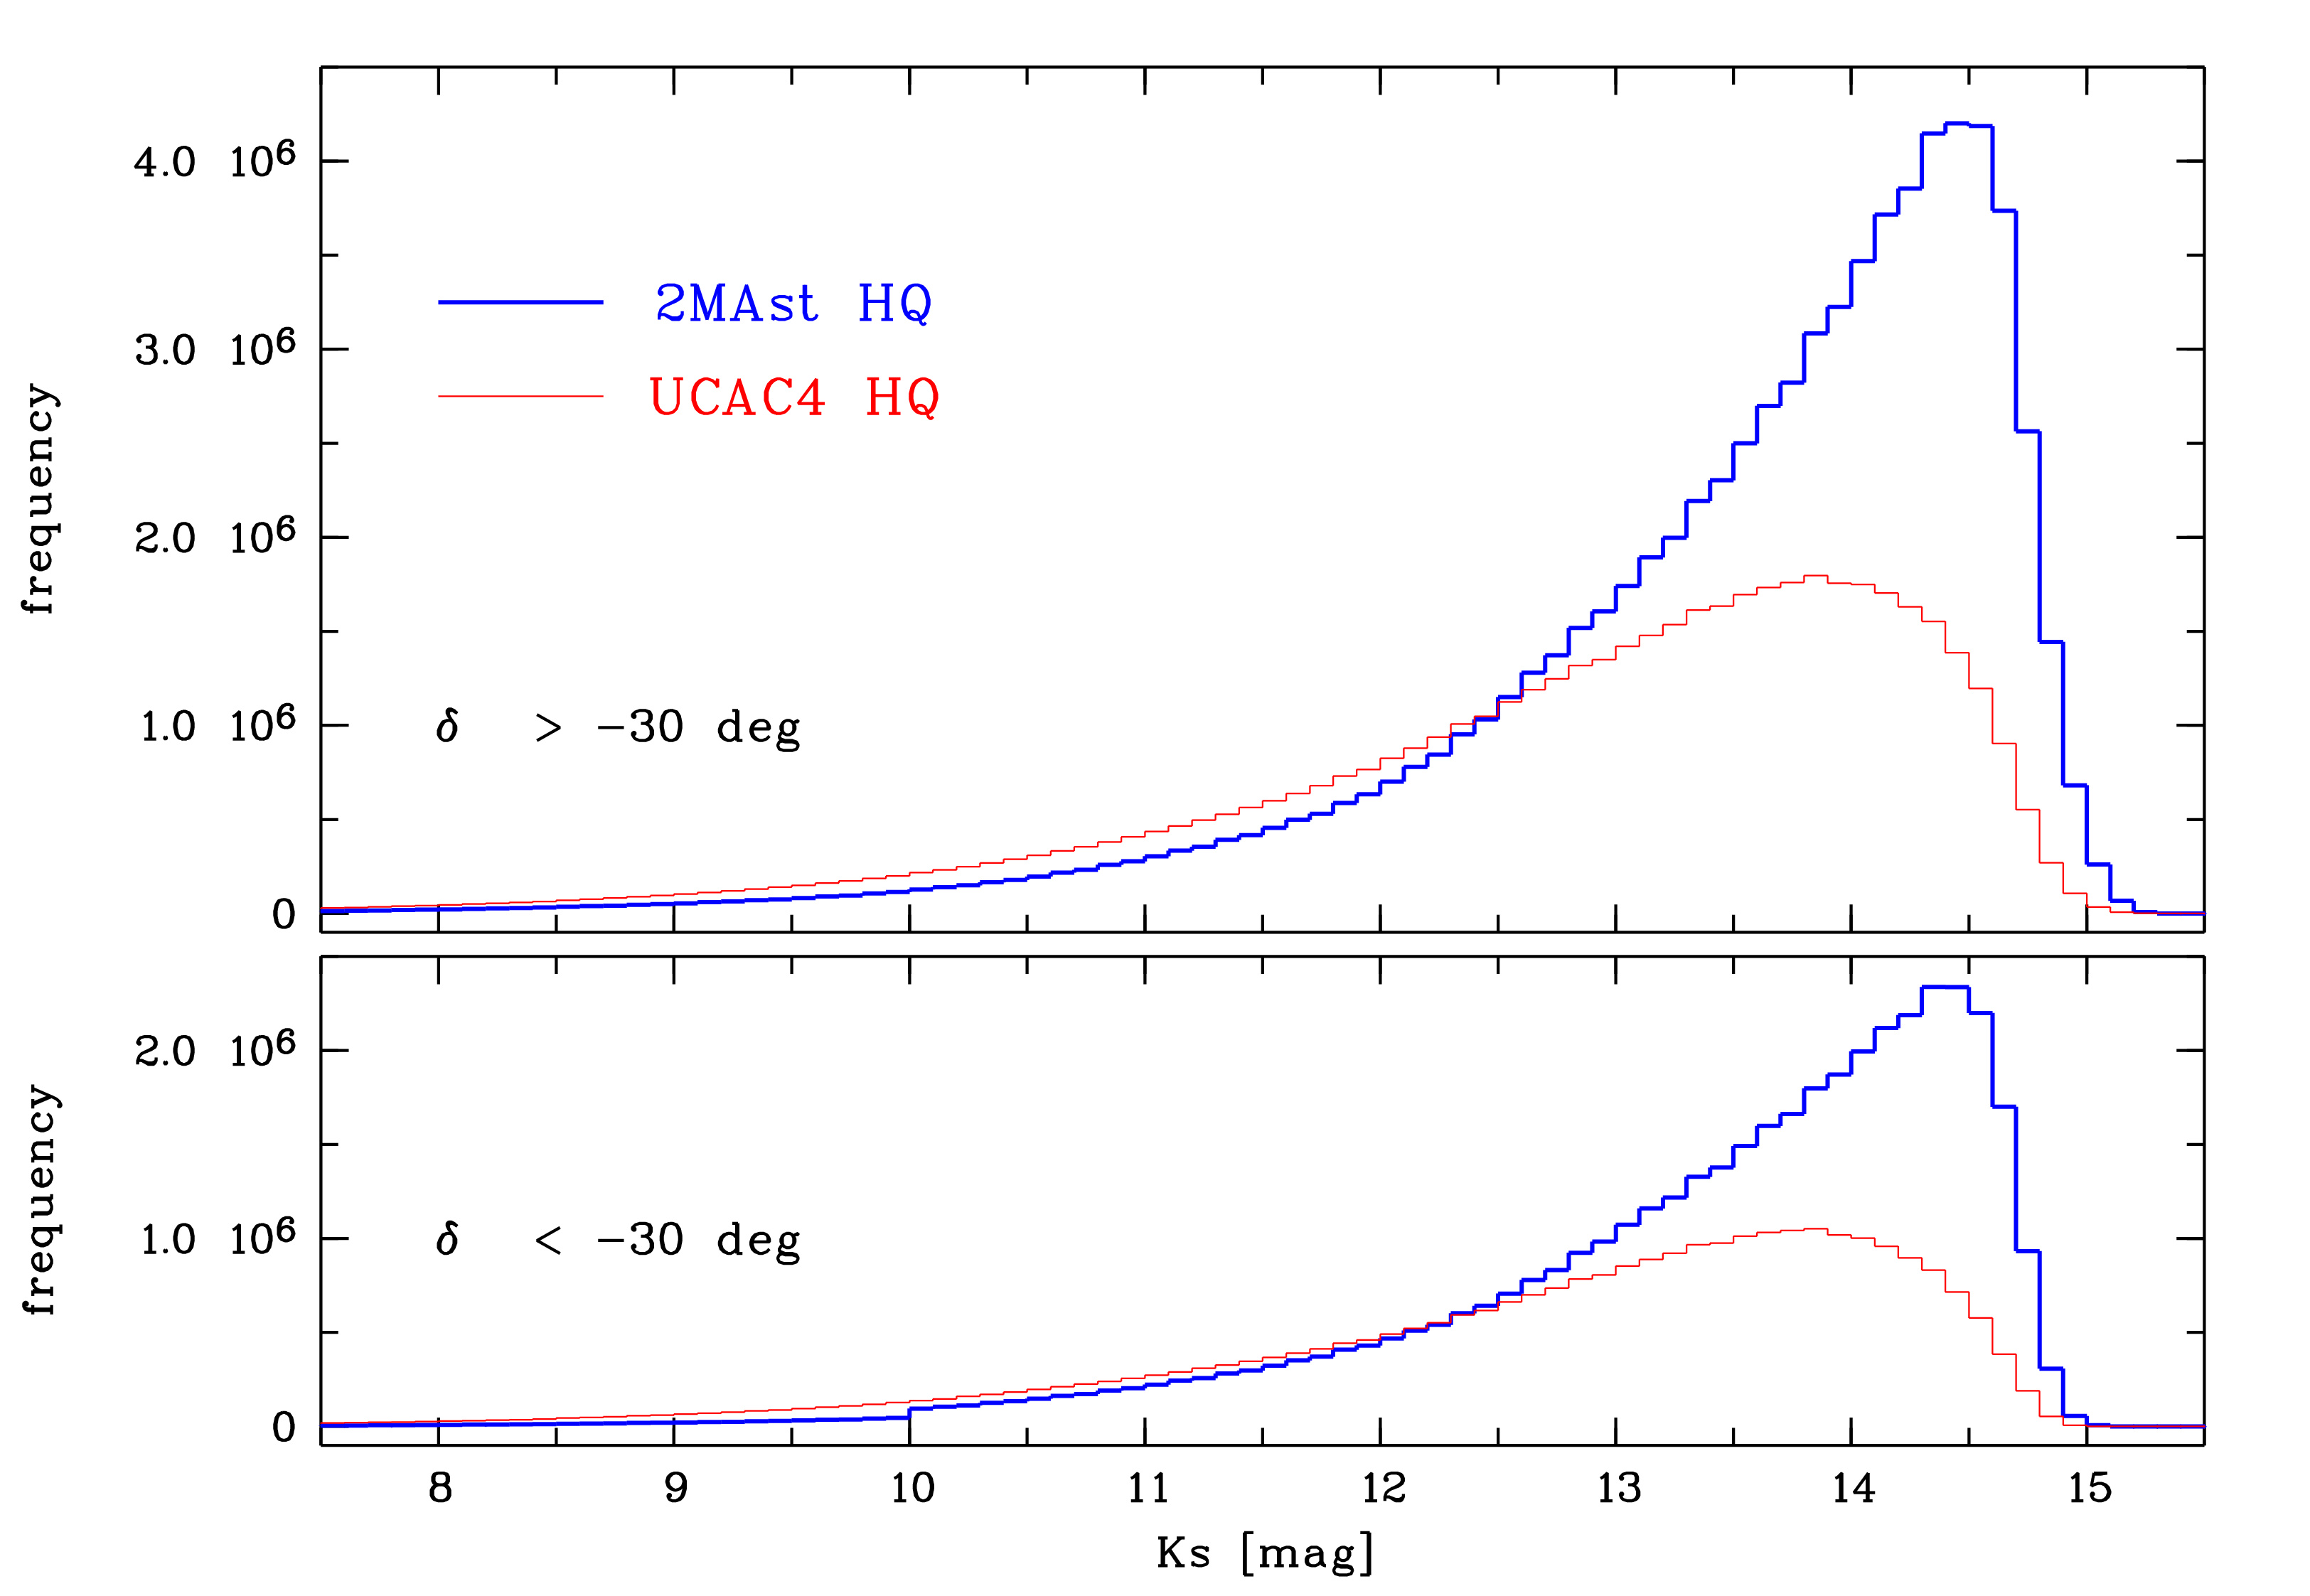
As the PPMXL has a much fainter optical magnitude limit than the UCAC4, our chosen 2MAst HQ and UCAC4 HQ samples containing only the best-measured objects with 2MASS counterparts are expected to reach different limiting magnitudes in the near-infrared, too. This is confirmed by Fig. 2, where we see that both samples include objects up to 14th magnitude, but the 2MAst HQ distribution peaks at 14.5, more than half a magnitude fainter than in case of UCAC4 HQ. The number of faint objects (12.5) in 2MAst HQ is nearly two times larger than in UCAC4 HQ. On the other hand, there are sightly more bright stars (12.5) in UCAC4 HQ compared to 2MAst HQ.
The distributions of proper motion errors in our chosen 2MAst HQ and UCAC4 HQ samples look very different (Fig. 1). Both samples have their peak at about 4 mas/yr, if the sky north of 30∘ is considered. However, the UCAC4 HQ errors occupy the whole range between about 1 mas/yr and our chosen limit of 10 mas/yr, whereas the 2MAst HQ distribution is very sharp and contains about 90% of all objects in the two central bins (3.5-4.5 mas/yr). This follows from the observational history as stated in Röser, Demleitner & Schilbach (roeser10 (2010)). In particular, this is seen in their Fig. 9. As the typical epoch differences of the Schmidt plates in the southern sky are much smaller, the 2MAst HQ histogram changes dramatically south of 30∘, where the majority of objects exhibits errors between 7 and 10 mas/yr, whereas the UCAC4 HQ peak shifts to an even lower value at about 3 mas/yr.
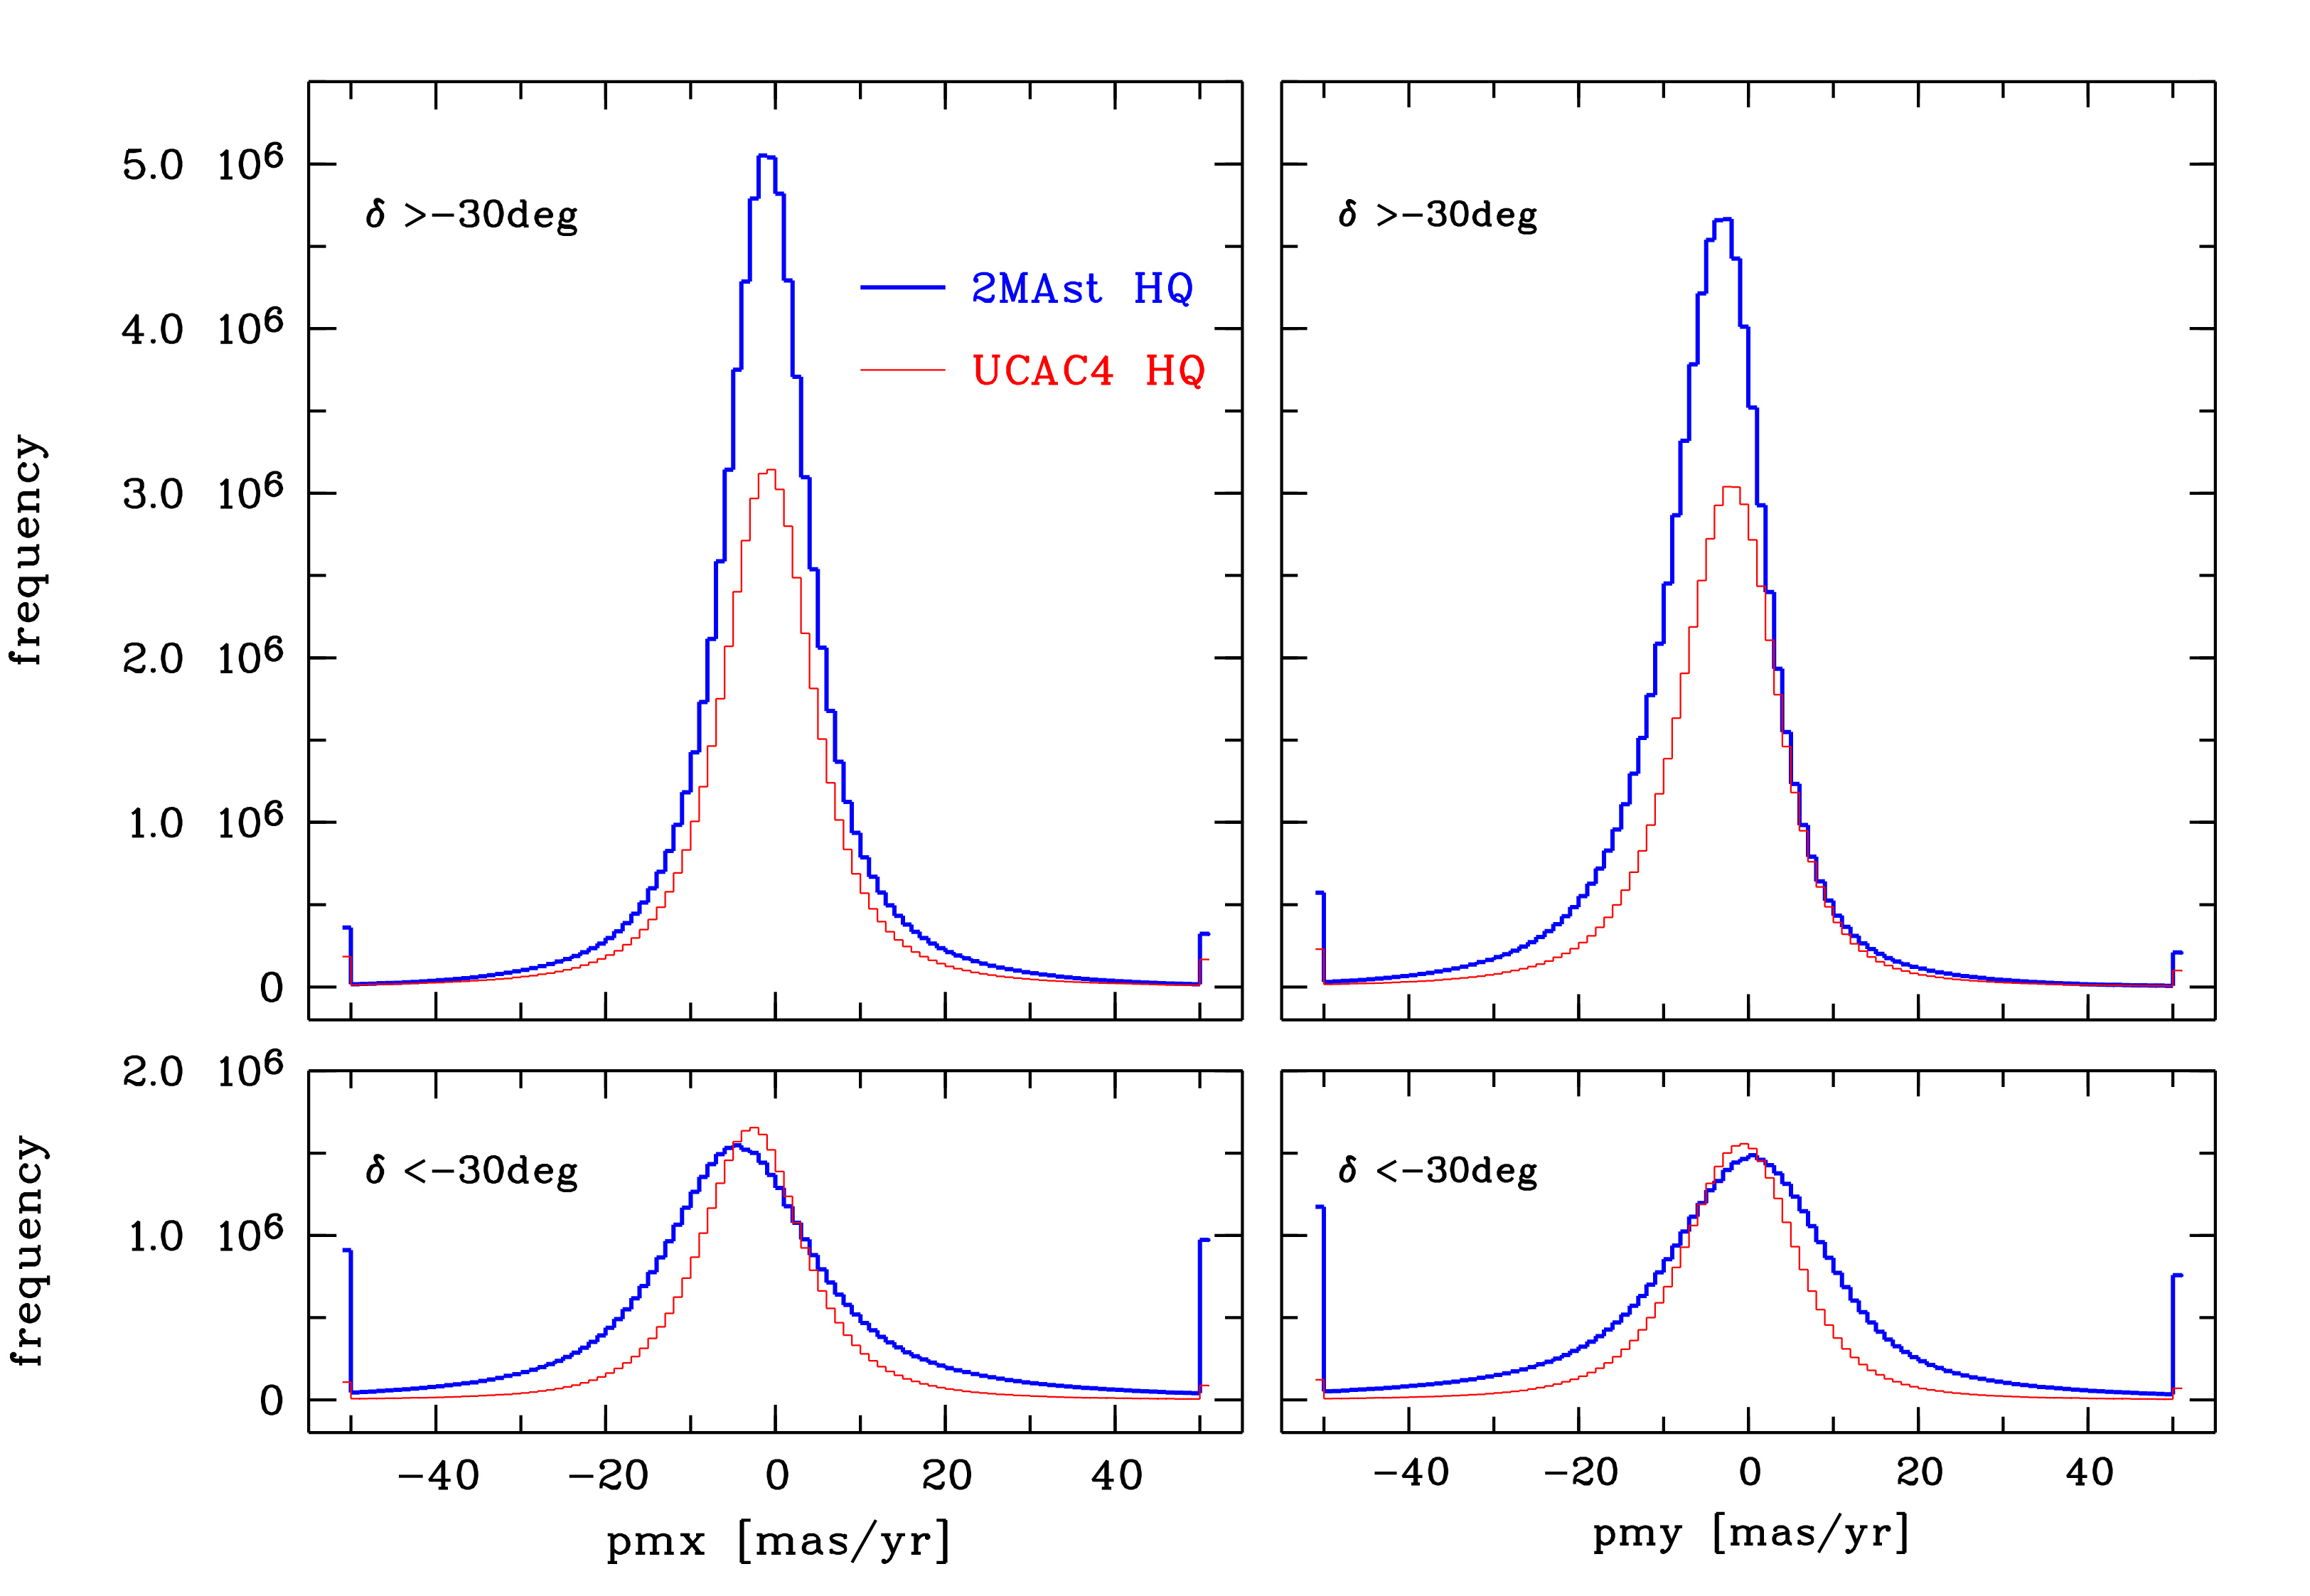
We also checked the overall proper motion distributions of our chosen HQ samples (Fig. 3). While we did not expect normal distributions for the proper motions of all stars over large parts of the sky, we considered the different widths of the distributions, and especially the numbers of outliers (high proper motion stars) as possible indicators of the reliability of the proper motions. By our HQ selection criteria we successfully excluded the vast majority of wrong high proper motion stars in the PPMXL catalogue that stem from the B1.0 catalogue. Röser, Demleitner & Schilbach (roeser10 (2010)) mentioned e.g. about 24.5 million PPMXL objects with apparent proper motions larger than 150 mas/yr in the northern hemisphere. The 2MAst HQ histogram edges in the top and bottom panels of Fig. 3 show only about 0.8 and 1.9 million objects with proper motions larger than 50 mas/yr, respectively. However, compared to the UCAC4 HQ histogram edges, these numbers are more than two times larger at 30∘ and even about ten times larger at 30∘. The location of the peak and the width of the pmx (we use pmx and pmy equivalent to and ) distributions of 2MAst HQ and UCAC4 HQ (with formally measured standard deviations of about 13 mas/yr and 11 mas/yr, respectively) are in good agreement only at 30∘. The peak locations in the other three panels of Fig. 3 differ by a few mas/yr, which may be a first indication of systematic proper motion differences between the two catalogues, although we should keep in mind the different sizes and magnitude distributions (Fig. 2) of the 2MAst HQ and UCAC4 HQ samples. The much lower proper motion quality of the 2MAst HQ at 30∘ (Fig. 3) leads to about two times broader proper motion (both pmx and pmy) distributions (standard deviations of about 24 mas/yr) compared to the UCAC4 HQ (about 11 mas/yr).
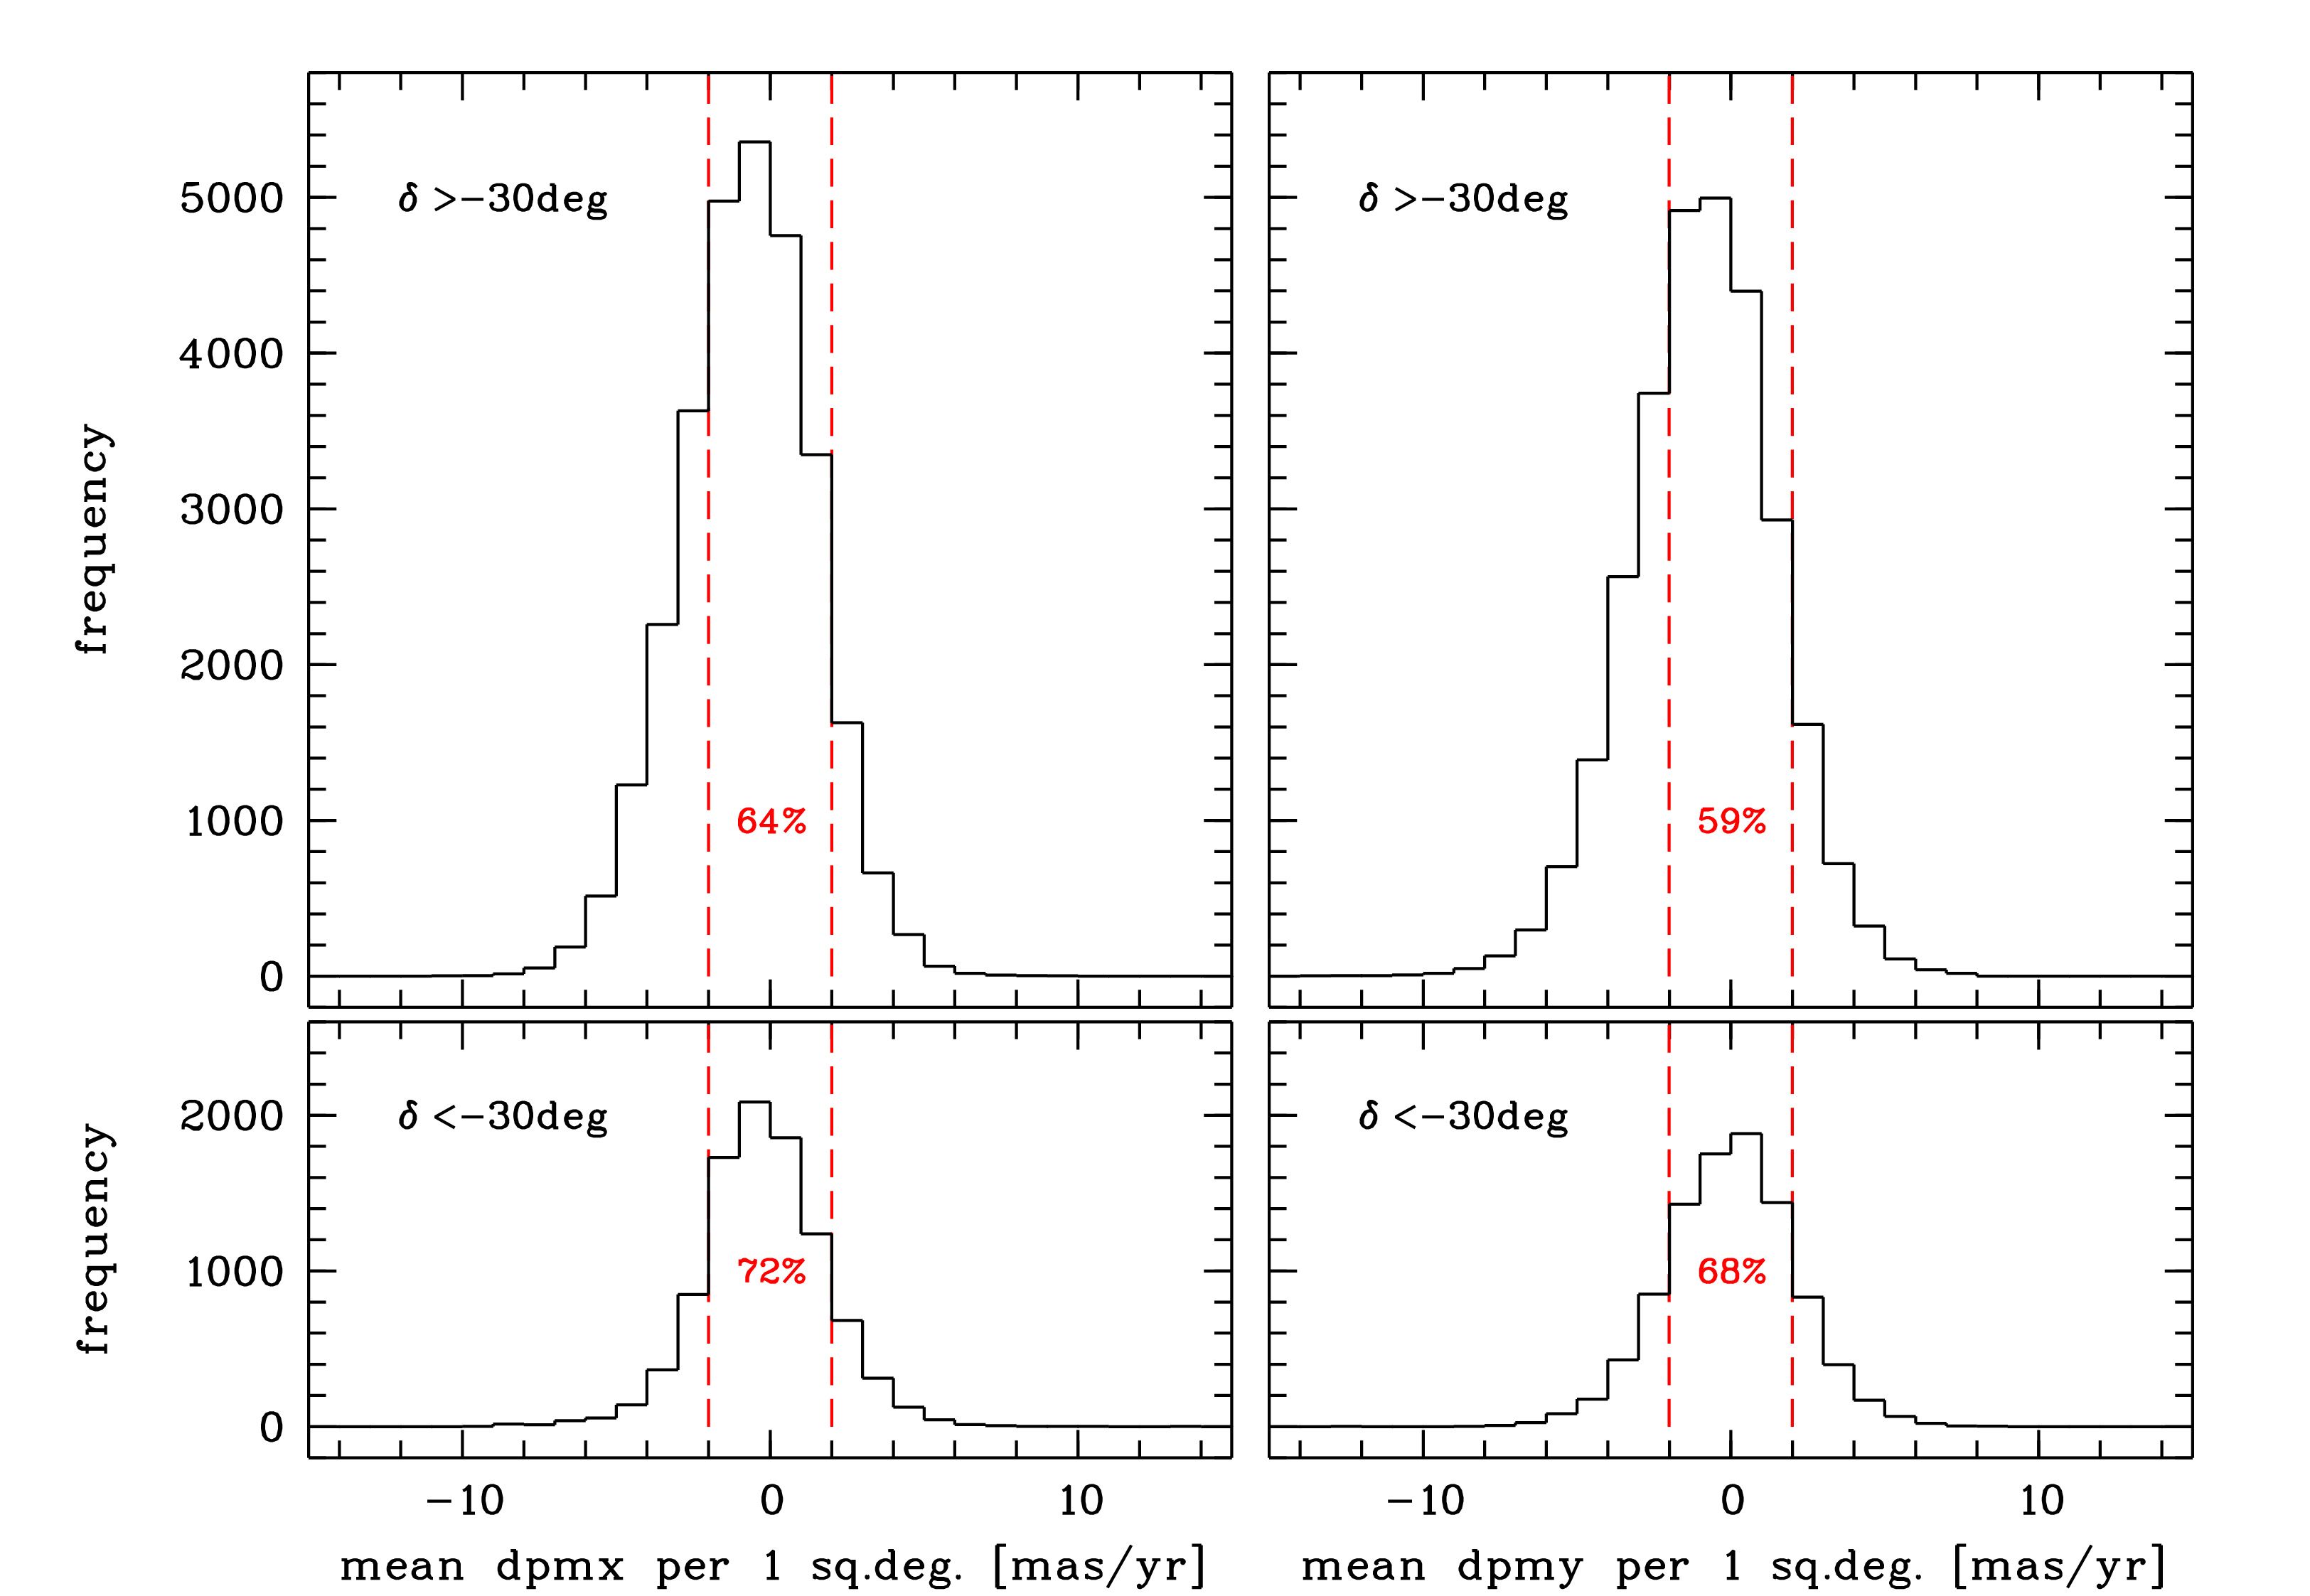
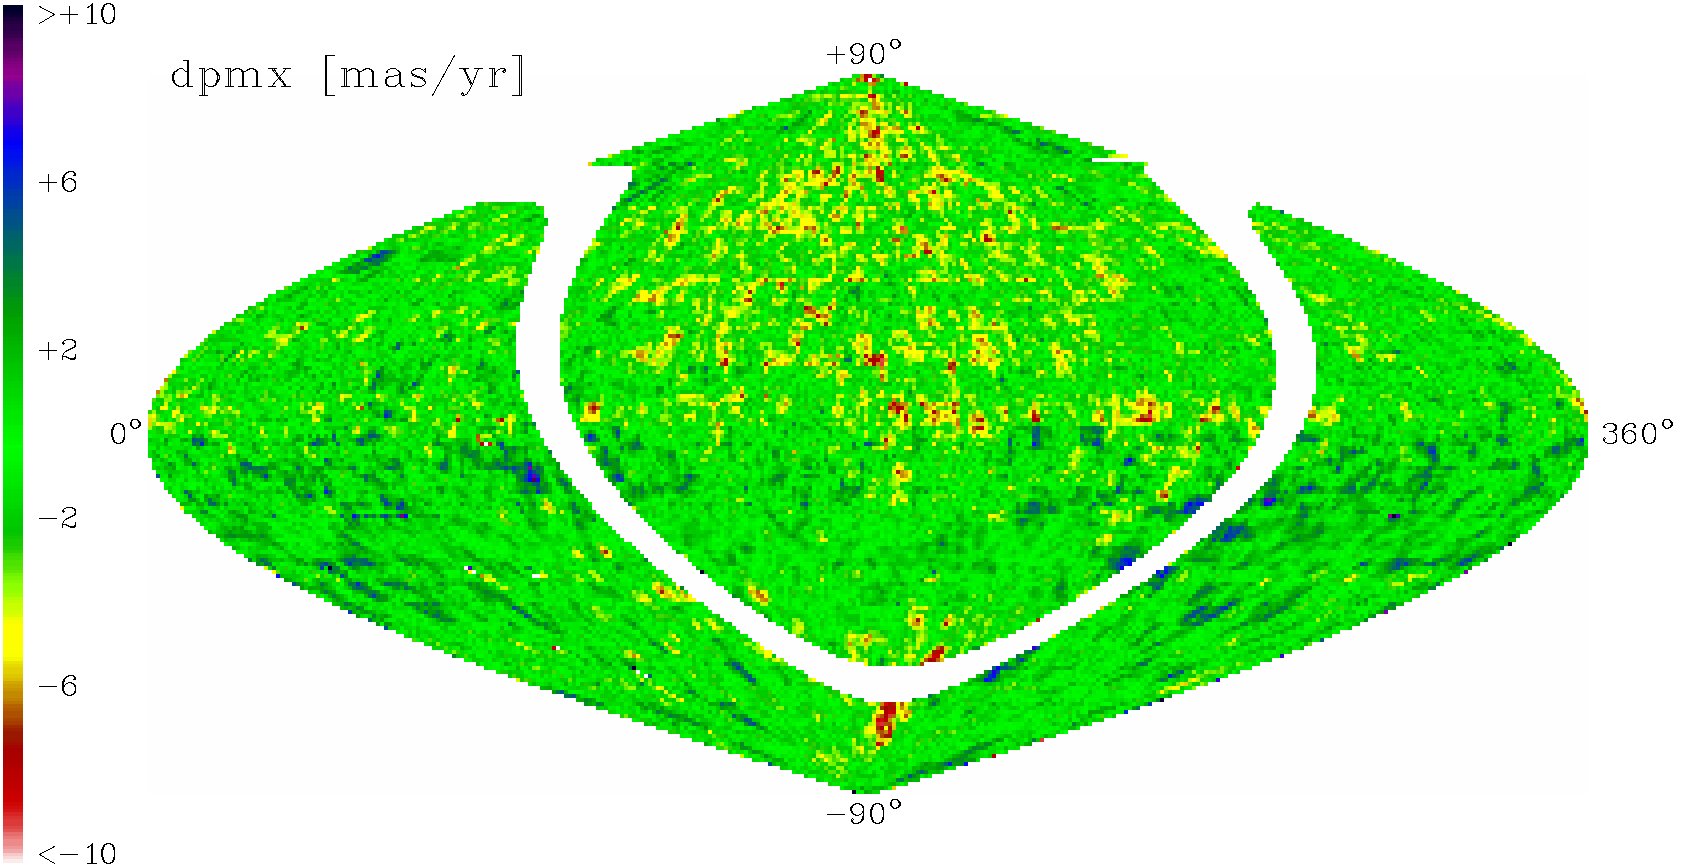
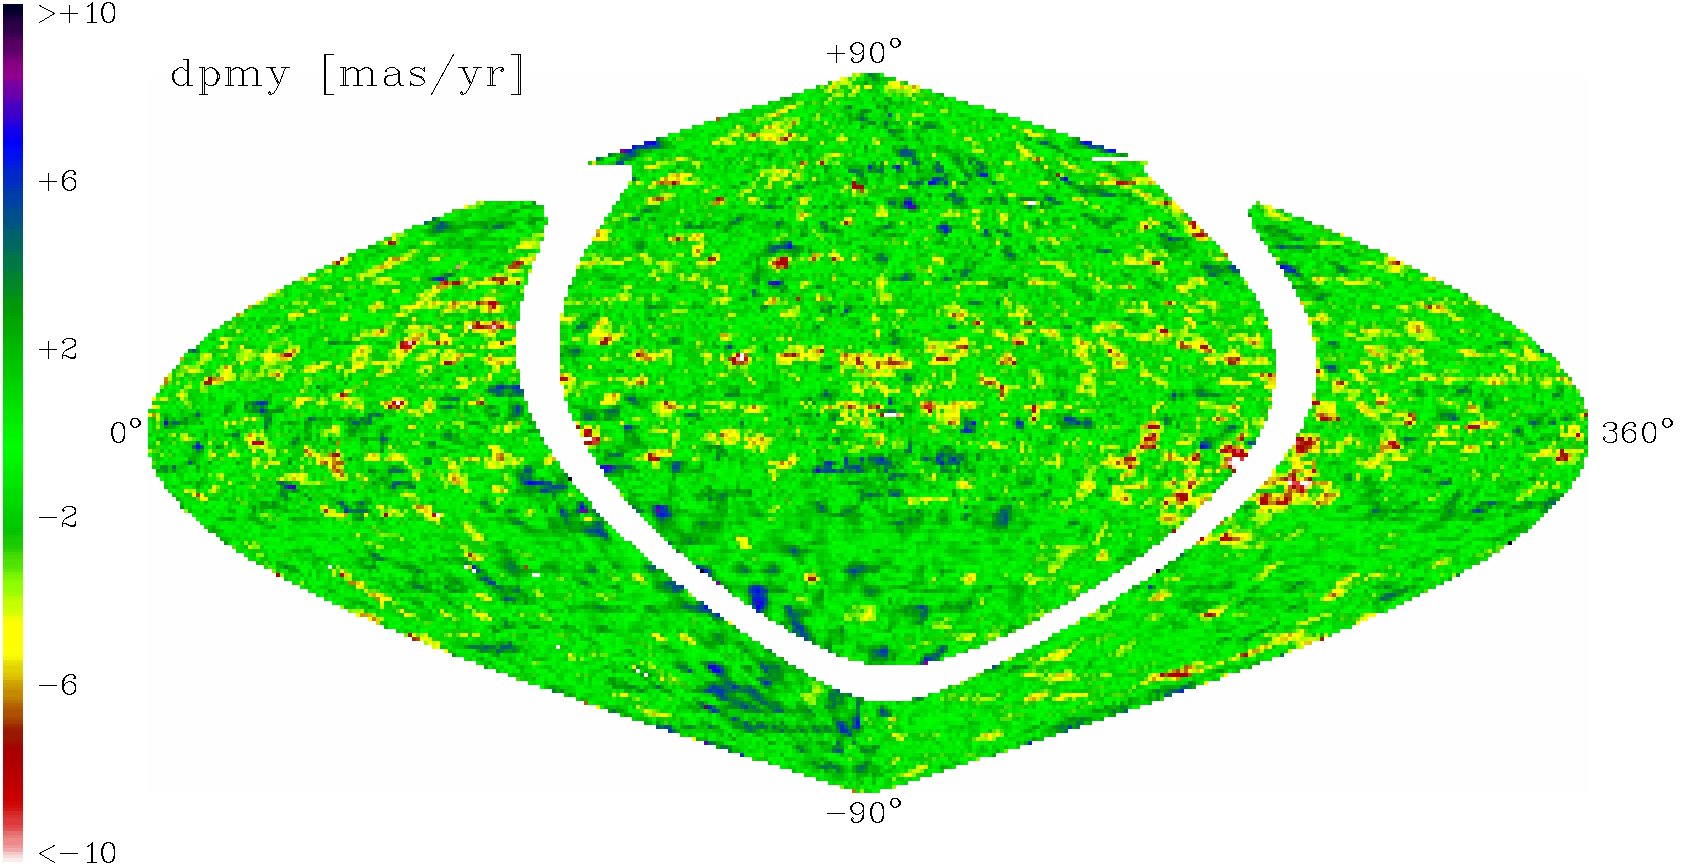
To exclude the effect of different sample sizes and magnitude distributions of 2MAst HQ and UCAC4 HQ, and to investigate systematic proper motion differences as a function of the position in the sky, we identified a common 2MAst/UCAC4 HQb5 sample. Over the full sky except for the Galactic plane zone with 5∘, that is in an area of 37700 deg2, we found about 44.0 million objects, which met our quality constraints, by using a matching radius of 1 arcsec. Röser, Demleitner & Schilbach (roeser10 (2010)) estimated the systematic proper motion errors in small sky areas on a 1∘ scale to be at least 1-2 mas/yr for the PPMXL, but also for the UCAC series. We binned our common 2MAst/UCAC4 HQb5 sample in 1 deg2 areas of the sky using a simple projection and determined the mean proper motion differences after applying a 3- clipping in each bin. The results are shown in Figs. 4 and 5.
As seen in Fig. 4, the majority of the mean proper motion differences (for both dpmx and dpmy) do not exceed 2 mas/yr. Interestingly, at 30∘, the fraction of areas with relatively small mean proper motion differences is larger in both components. Hence, the systematic differences between the proper motions in the 2MAst and UCAC4 HQb5 samples are typically smaller in the most southern part of the sky, where on the other hand the random errors of 2MAst HQb5 are rather large (see Fig. 1). In this part of the sky we mention almost symmetric distributions (with mean values of 0.20 and 0.03 mas/yr for all mean dpmx and dpmy, respectively), whereas the upper panels of Fig. 4 show clear asymmetries with more negative mean proper motion differences (mean values of 0.75 and 0.91 mas/yr). This is also seen in Fig. 5, where the yellow/red areas are mostly located in the north or in some (adjacent) areas close to the Galactic plane. Both yellow/red (mean differences between about 5 and 10 mas/yr) and blue/violet (between about 5 and 10 mas/yr) areas are distributed over many small sky patches comparable to the size of the photographic plates used for determining the proper motions (6∘ in case of PPMXL, 5∘ in case of UCAC4). However, the total sky area where the mean differences (dpmx or dpmy) exceed 5 mas/yr, is relatively small (only about 7% of the common 2MAst and UCAC4 HQb5 area).
Extremely large mean differences (exceeding 10 mas/yr mainly in dpmy) were found in only thirty 1 deg2 areas. One third of them are due to small numbers of comparison stars (less than 20 per 1 deg2 area), and these are all located in the southern sky. South of 30∘ all extremely large differences are due to small numbers of comparison stars. The other two thirds of areas with extremely large differences (all with more than 100 and up to several thousands of comparison stars per area) are located close to the edge of the excluded Galactic plane in the 2MAst HQ5b and along zonal effects and plate edges such as seen in Fig. 8.
3 Cluster candidate selection
According to paper II (see Fig. 1 therein), the typical size (the total apparent radius, ) of the known clusters in the MWSC lies between 0.06∘ and 0.3∘, with a peak at 0.13∘. Only a few per cent of the 3006 clusters with parameters determined in the MWSC have larger sizes. Among the new clusters found in the first MWSC extension (paper III) at relatively high Galactic latitudes (20∘), there are no clusters with sizes 0.26∘. For our cluster candidate selection we binned the sky in 0.250.25 deg2 areas (again using a projection of ), and investigated the numbers of stars with certain proper motions in the corresponding sky ”images”. The idea was to identify star clusters as ”hot pixels” in such images, as a typical small cluster would show up as a concentration of stars of a certain proper motion in a 0.250.25 deg2 ”pixel” of this sky image, whereas the surrounding pixels would represent the background number density of field stars.
3.1 Sky distributions of proper motion subsamples
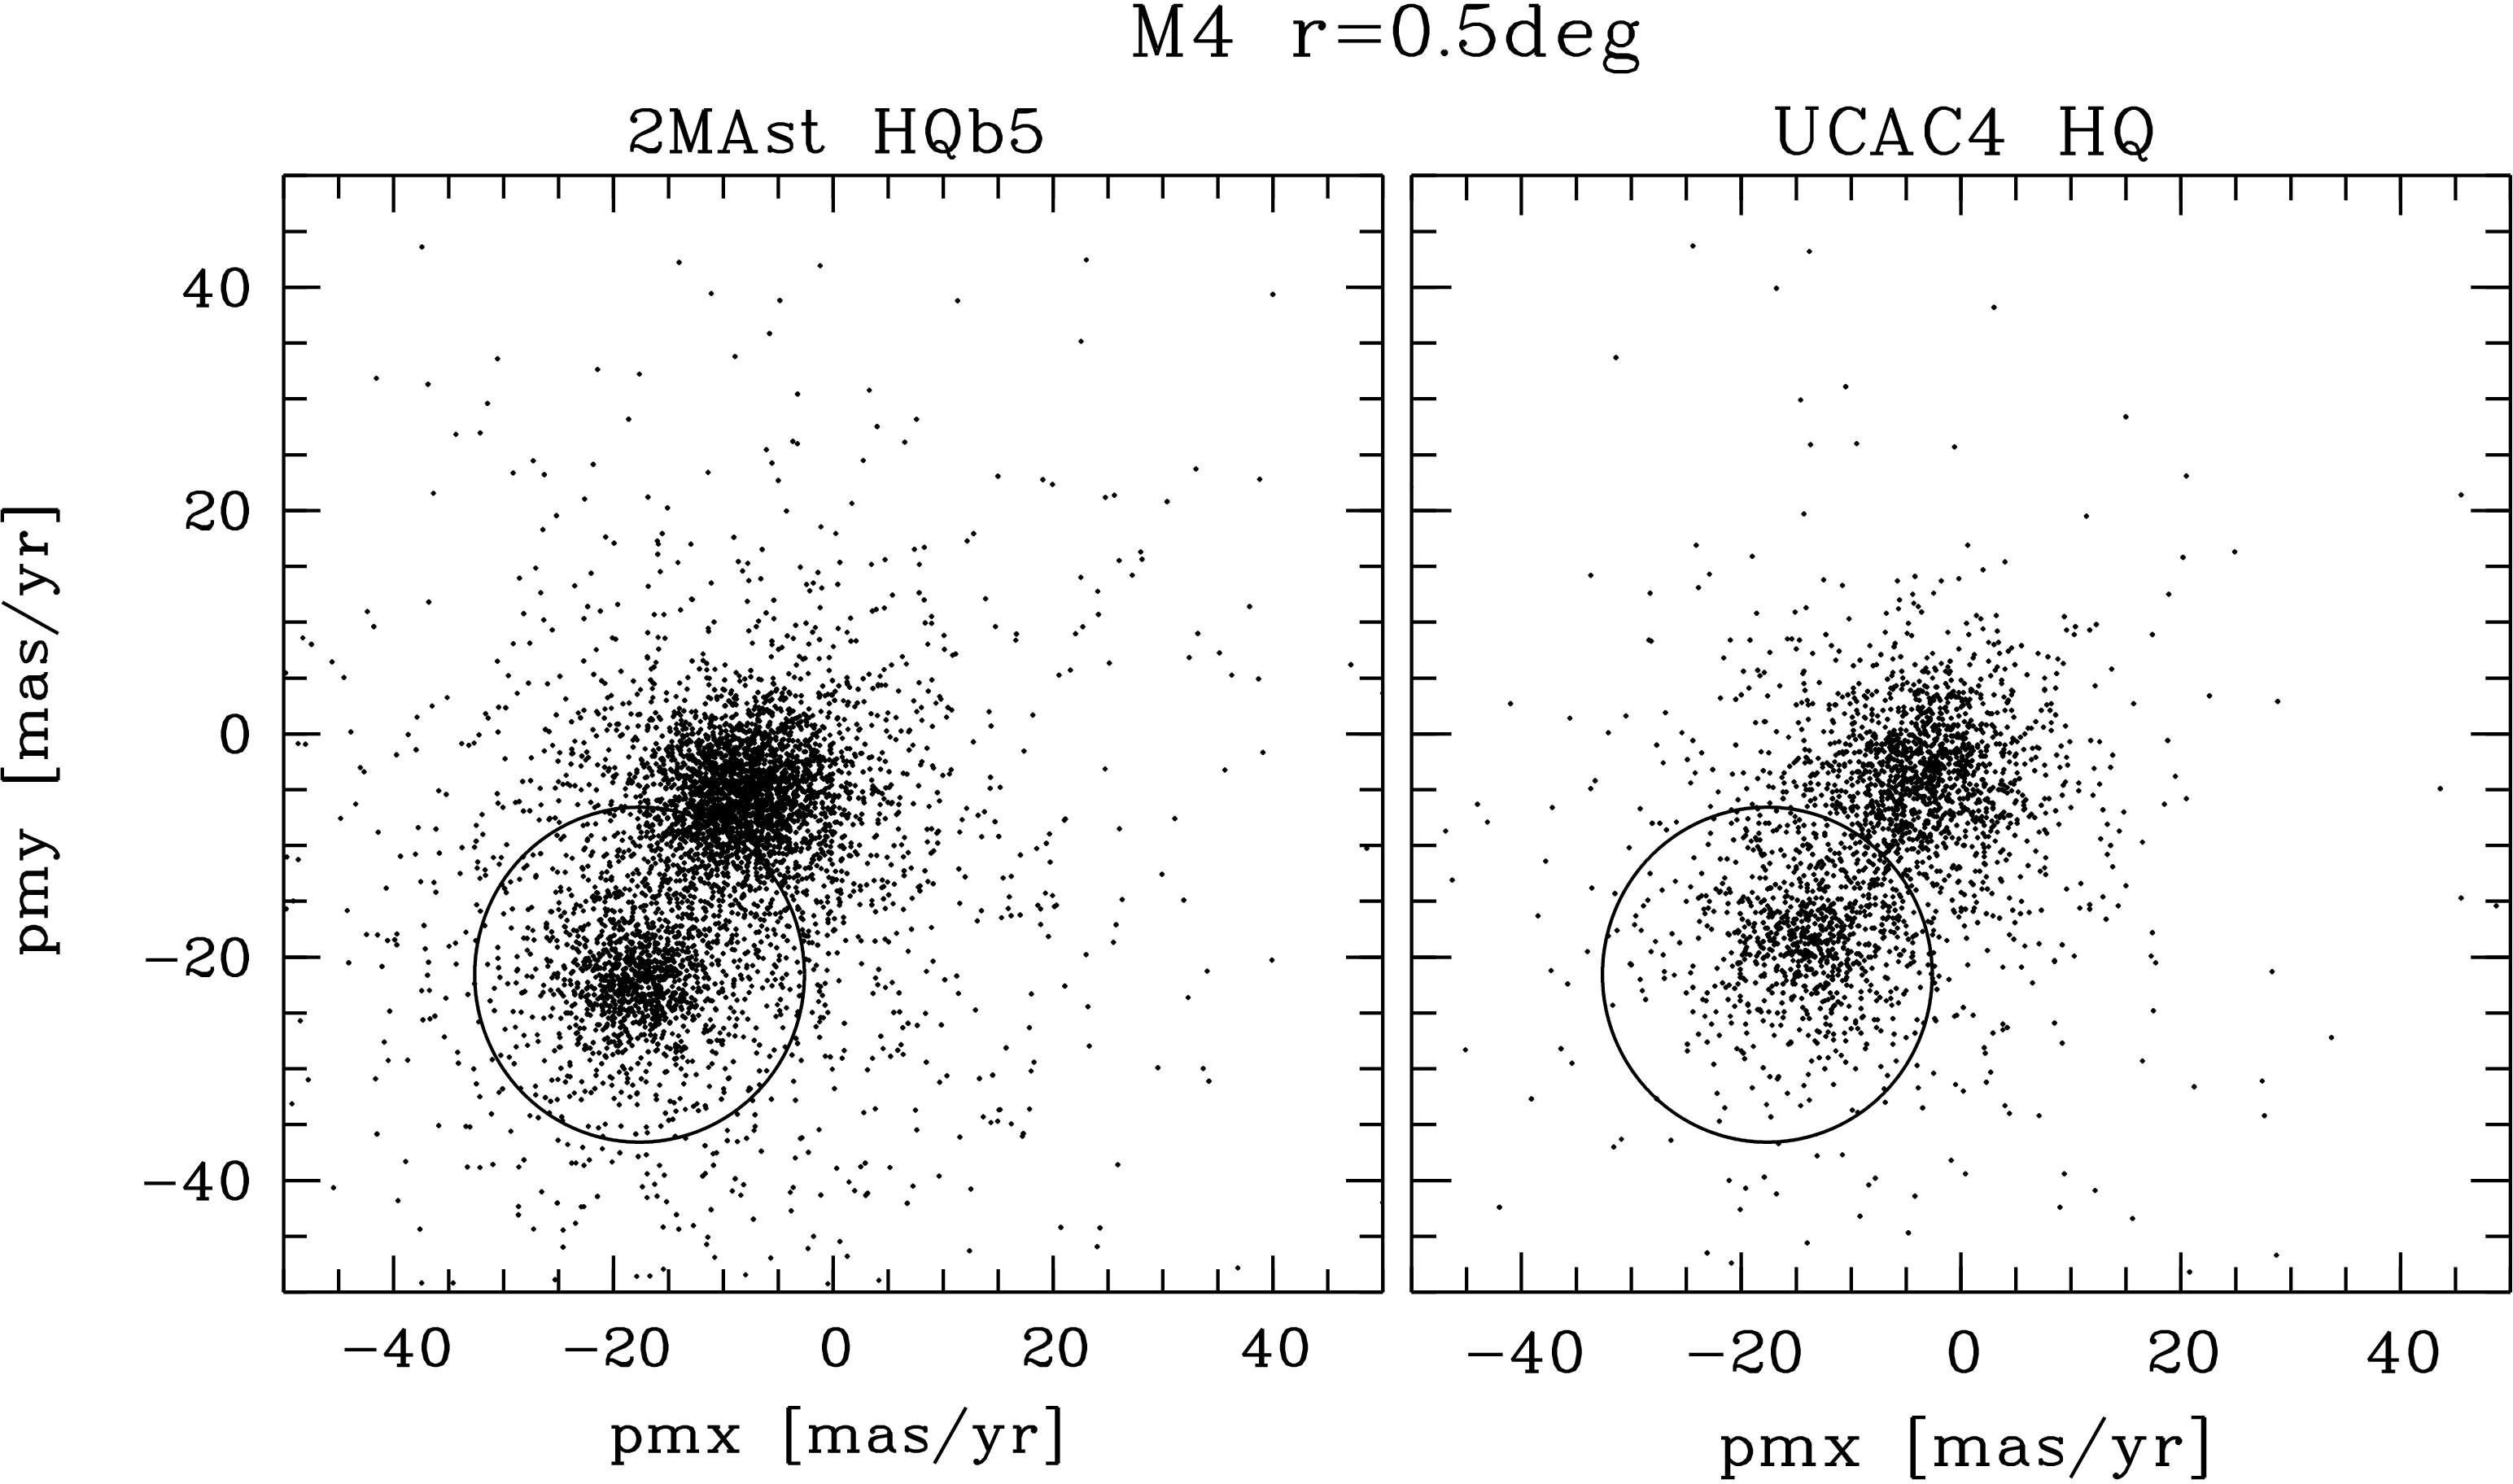
As we expected no new clusters with very large proper motions (among 2983 compact MWSC clusters from paper II with total apparent radii of less than 1∘ only six have proper motions exceeding 20 mas/yr and reaching a maximum of about 40 mas/yr), we studied only 2MAst HQb5 stars with proper motions not exceeding about 50 mas/yr. We selected 2121 proper motion subsamples from 2MAst HQb5 by shifting the central proper motion in steps of 5 mas/yr from 50 to 50 mas/yr in each component and using a circular area in proper motion space with a radius of 15 mas/yr. Therefore, each of these 441 proper motion subsamples was strongly overlapping with neighbouring ones. We also selected the corresponding 441 proper motion subsamples from UCAC4 HQ. We had 441441 representations of the sky, one for each proper motion grid point, based on the 2MAst HQb5 and UCAC4 HQ data, respectively. The relatively large radius of 15 mas/yr around the given central proper motion of each subsample was chosen to take into account the individual proper motion errors in 2MAst HQb5 (up to 8 or 12 mas/yr in the northern and southern parts, respectively) and UCAC4 HQ (up to 10 mas/yr) as well as the typically small systematic differences of a few mas/yr between the two catalogues (see Sect. 2.3). In Fig. 6, we show as an example the proper motion distributions of all 2MAst HQb5 and UCAC4 HQ stars in a small circular region around the globular cluster NGC 6121 (M 4). The proper motion of this cluster is clearly distinct from the proper motion of the field stars. The circle, with a radius of 15 mas/yr corresponding to the size of our chosen circular proper motion bins, marks the cluster proper motion as provided in paper II in both panels of Fig. 6. The two distributions of cluster and field stars are clearly seen. The spread of the cluster stars and the systematic shift (in this case of the order of 5 mas/yr) of the UCAC4 HQ proper motions (of both cluster and field stars) justify our choice of 15 mas/yr for the radius of the circular proper motion bins. The Fig. 6 illustrates the regional systematic proper motion differences between the catalogues.
By comparing the distribution of corresponding subsamples from both 2MAst HQb5 and UCAC4 HQ over the sky, and by searching for small sky areas (pixels) with enhanced numbers of stars of a given proper motion in both catalogues, we aimed at distinguishing real clusters from artefacts. We expected such artefacts to occur in each catalogue because of possible larger systematic proper motion errors (exceeding 5 mas/yr) over small sky areas (cf. Fig. 5) representing residual distorsions of the photographic plates used for determining the proper motions in that catalogue. With the completely different sets of photographic plates used for PPMXL and UCAC4, the probability of finding such artefacts in both catalogues in the same sky pixel and with the same proper motion is extremely low.
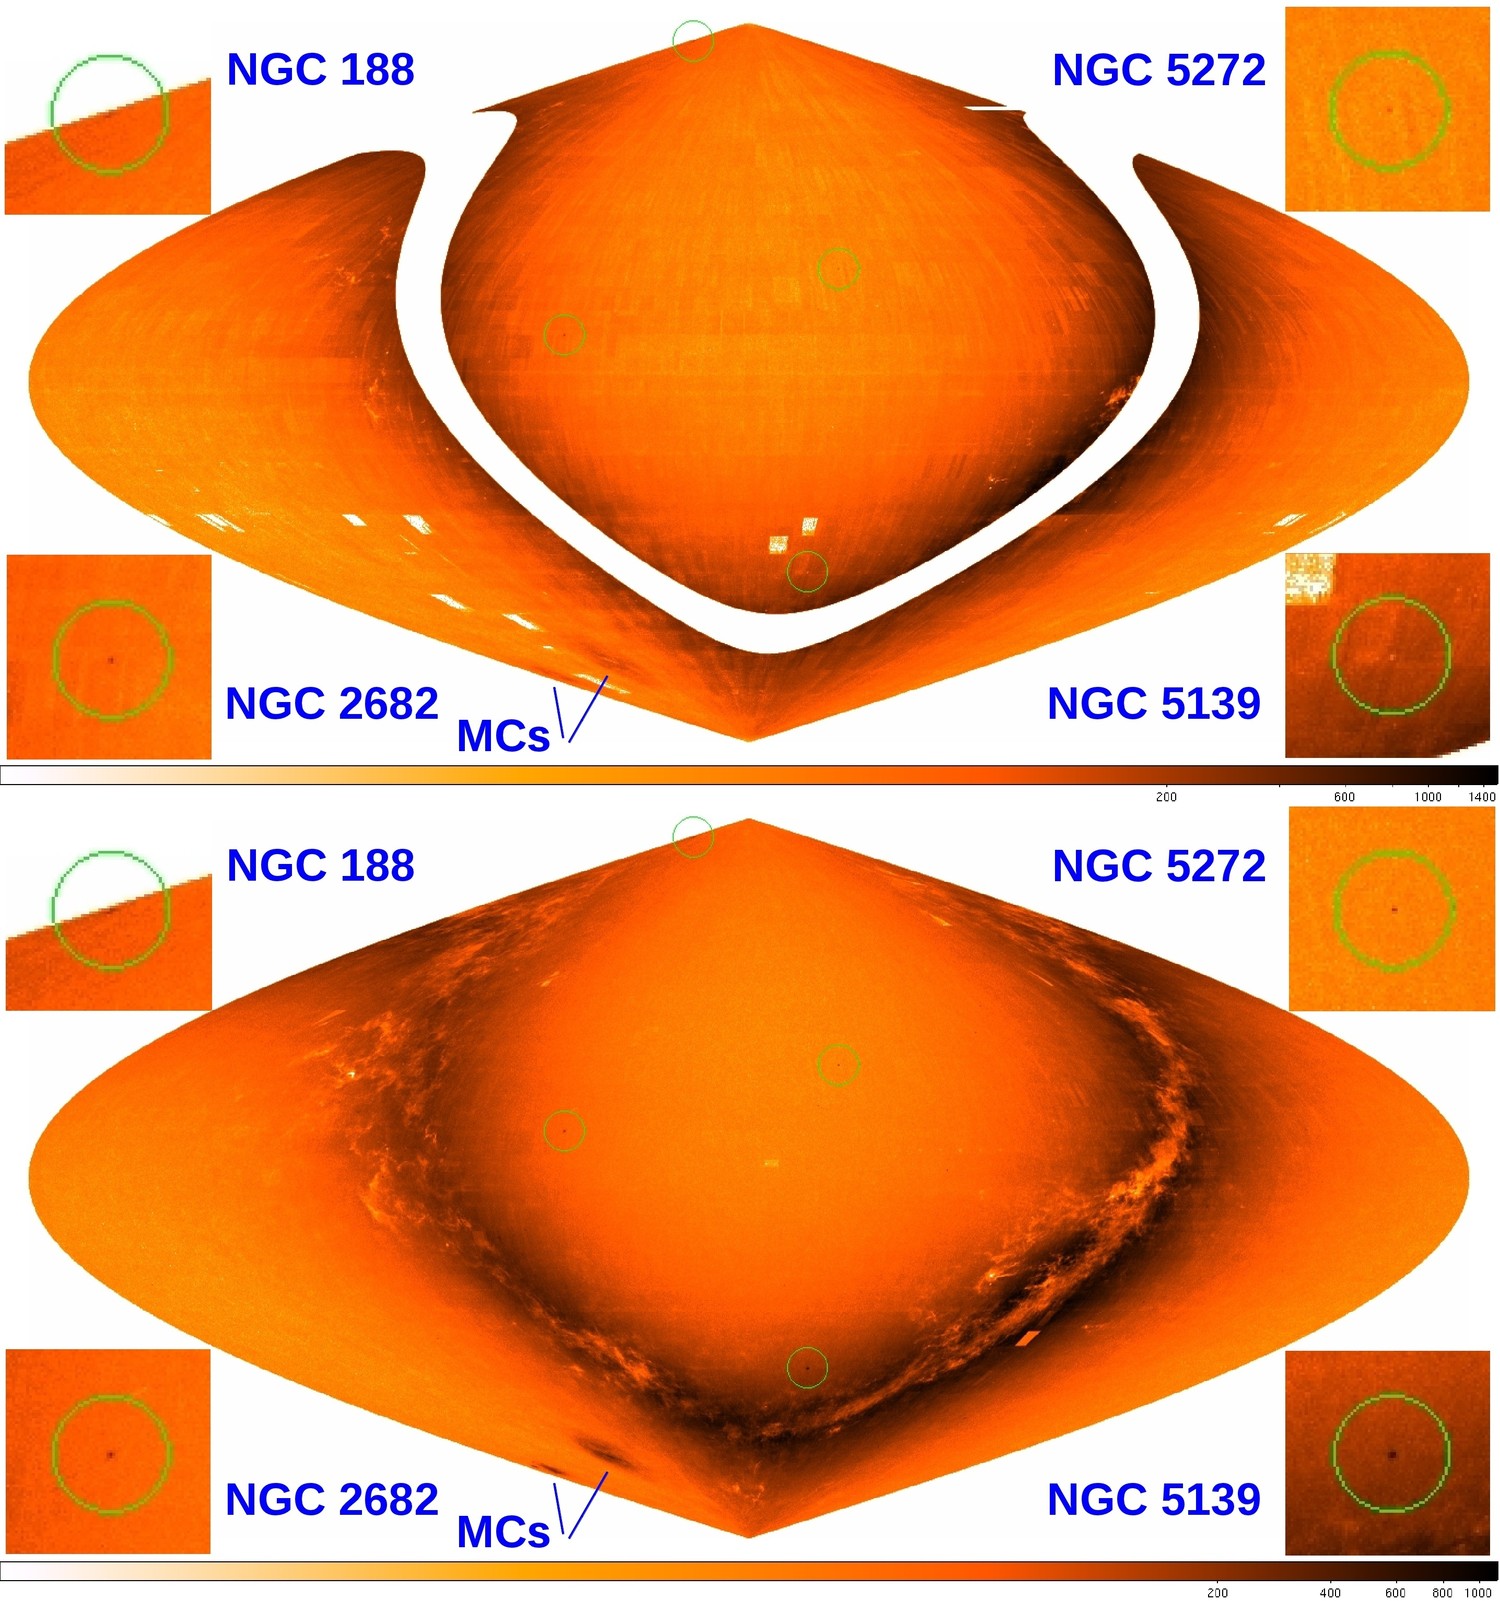
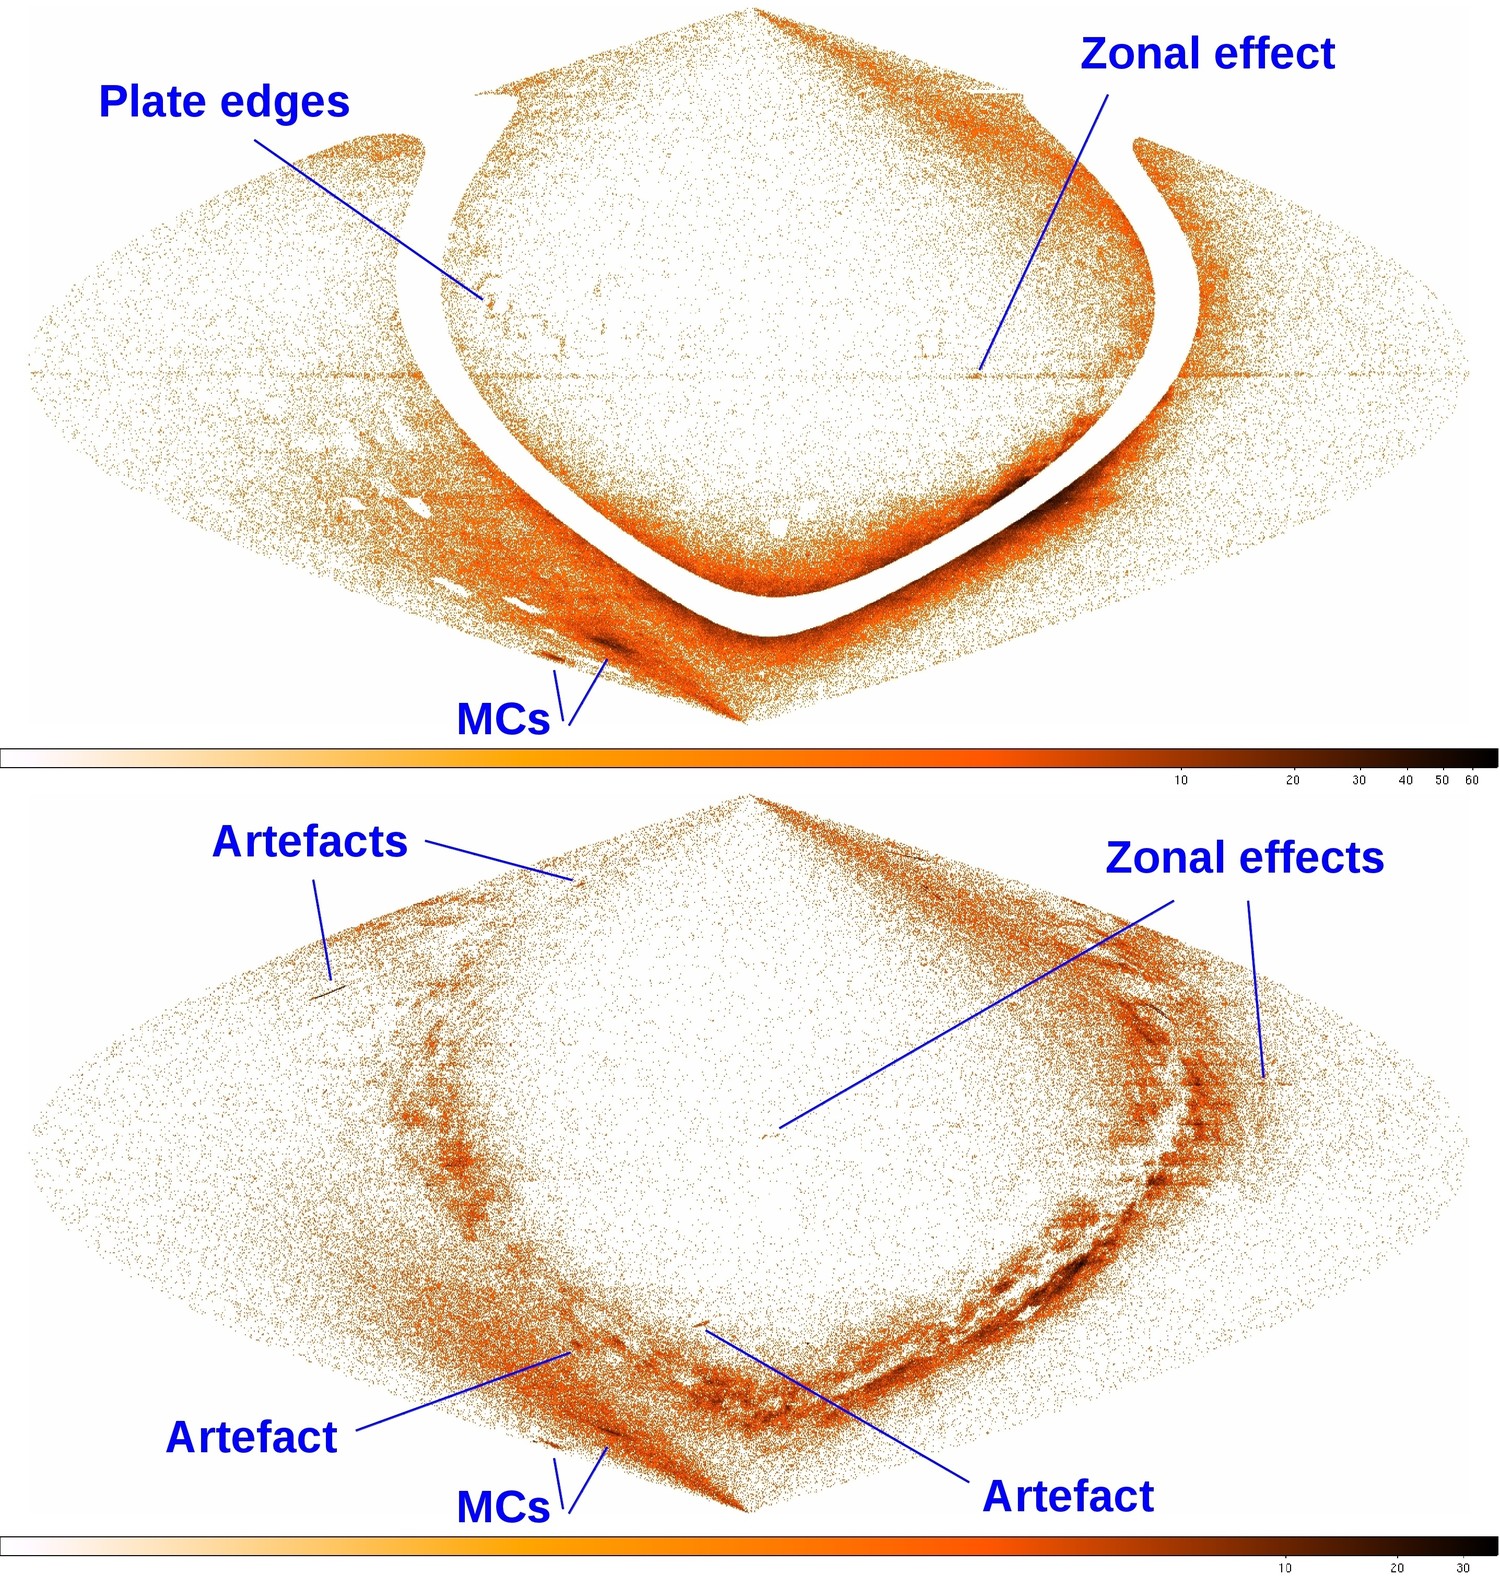
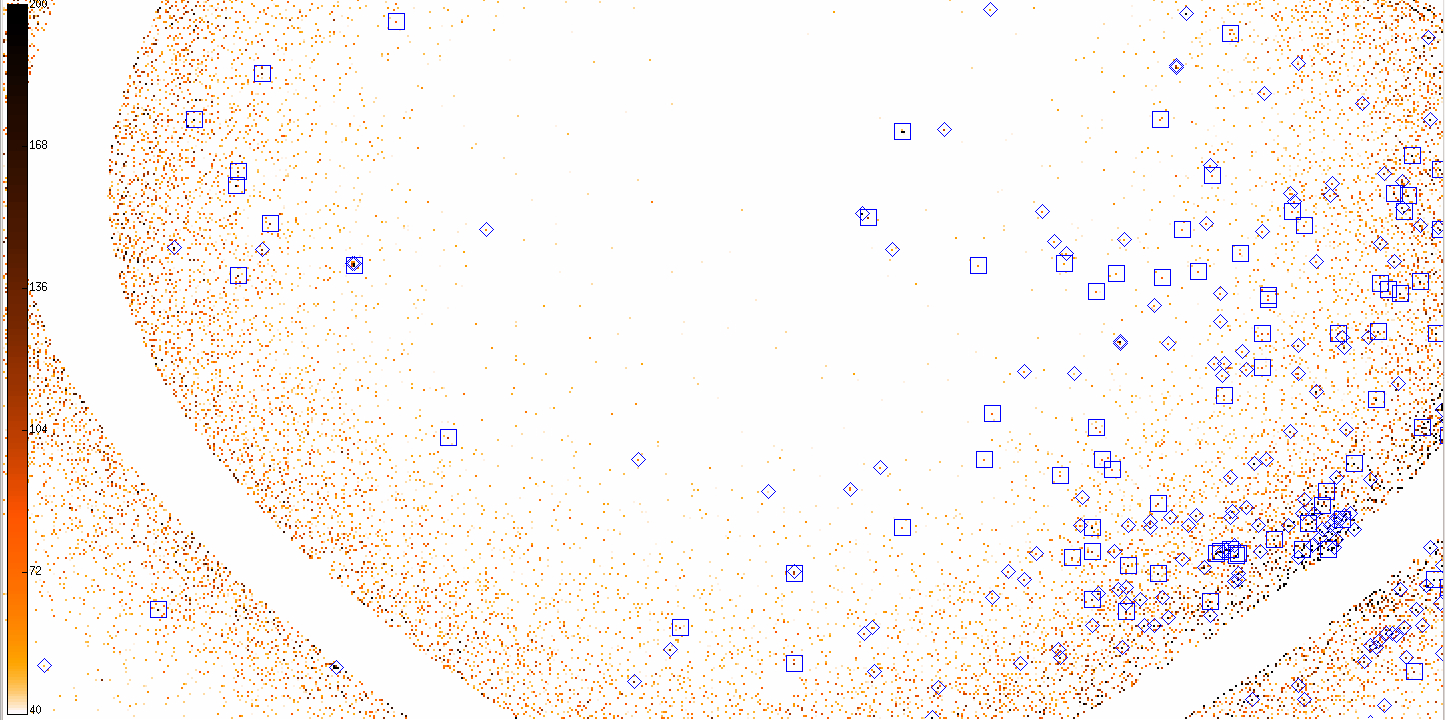
For all 441441 proper motion subsamples from 2MAst HQb5 and UCAC4 HQ we created the corresponding sky images with 0.250.25 deg2 pixel sizes, where the number of objects falling into a sky pixel was transformed to its intensity. These 882 images were created by using the European Southern Observatory (ESO) Munich Image Data Analysis System (MIDAS) tool convert/tab. The output in the format of the Flexible Image Transport System (FITS) formed the basis for our cluster candidate search. In Fig. 7 we show as an example two sky images for subsamples with the same relatively small proper motions, as they appear based on 2MAst HQb5 and UCAC4 HQ data, respectively. For comparison, Figs. 8 and 9 show the corresponding images for two subsamples with relatively large proper motions. The Figs. 7, 8, and 9 are discussed in more detail in the next section.
3.2 Visual detection of clusters
For the visual inspection of the large numbers of FITS images created (see Sect. 3.1), we used the SAOImage DS9 (Joye & Mandel joye03 (2003)) tool. We found this in particular very useful, as it not only allowed us to blink the corresponding 2MAst HQb5 and UCAC4 HQ sky images with different colour maps, zoom factors, etc., but also to effectively watch short movies of a series of images with similar (overlapping) proper motions. Sky pixels popped up with more or less constant high intensity in such movies, when they contained known clusters and new cluster candidates. The inverted colour map ”heat” with a logarithmic scale chosen for Figs. 7, 8 and 9 shows the full dynamic range of these images, which is very different for the large numbers of objects with small proper motions compared to much less objects with large proper motions, where many sky pixels are empty.
Window-like patterns of the photographic plates used for determining the proper motions can be seen in the sky images of both catalogues. The different observational history (various epoch differences) over the sky resulted in different levels of proper motion errors. Therefore, we found even stronger plate patterns in sky images representing objects with small proper motions like in Fig. 7, when we tried to use more stringent criteria for the proper motion errors, e.g. UCAC4 errors of less than 7 mas/yr instead of our chosen limit of 10 mas/yr. The choice of the two different error limits (Sect. 2.1) for 2MAst HQb5 objects north and south of 30∘ led to a smooth transition in the number density of objects accross that border. Declination zones and plate borders with density enhancements of stars with large proper motions can also be seen in both catalogues (Figs. 8 and 9). These patterns are not a consequence of our error cuts but hint at systematically wrong proper motions because of improper treatment of some of the photographic plates involved in each of the catalogues. In cases, where whole photographic plates, their edges, or corners are affected, the resulting apparently large proper motions mimic large clusters or streams as the artefacts marked in Figs. 8 and 9.
While we excluded the Galactic plane in the 2MAst HQb5 sample, we did not exclude the very crowded fields of the Magellanic Clouds. Interestingly, they appear with a much weaker signal in the upper part of Fig. 7 than in the lower part. We also see in the zoomed subimages centred on the largest globular cluster in the sky, NGC 5139 ( Cen), that there is a minimum in the 2MAst HQb5 number density, whereas the UCAC4 HQ image shows a clear peak. This means that the Schmidt plates used for the PPMXL (and 2MAst) did not allow to determine reliable proper motions (which are small for the Magellanic Clouds and for NGC 5139) for the majority of objects in very crowded regions. On the other hand, we see the Magellanic Clouds as clear density enhancements in the sky images representing objects with large proper motions (Figs. 8 and 9) from both catalogues (although they are stronger in case of 2MAst HQb5). We also noticed a (weaker) peak at the position of NGC 5139 in other UCAC4 HQ sky images (not shown here) over a relatively wide range of proper motions. This effect may be because of crowding problems in dense regions leading to concentrations of objects with any kind of proper motions. These problems affect the 2MAst HQb5 proper motion subsamples to a higher degree than those from the UCAC4 HQ.
The chosen mean proper motion of the subsamples shown in Fig. 7 is according to the results of paper II very similar to the known mean proper motions of three of the marked clusters NGC 5139 (6.0,5.0 mas/yr), NGC 2682 (7.3,5.9 mas/yr), NGC 5272 (5.6,6.1 mas/yr), but also close to that of the fourth, NGC 188 (0.2,1.4 mas/yr). Besides of the already mentioned strong crowding problems in the 2MAst HQb5 data for NGC 5139, the peaks for the other three clusters are clearly weaker in 2MAst HQb5 than in UCAC4 HQ, although the dynamic range of the UCAC4 HQ image is lower. This is a representative example, as we usually observed a stronger signal for well-known rich clusters in the UCAC4 HQ data compared to the 2MAst HQb5 data. Therefore, in our comparative search for clusters by proper motion and concentration in small sky areas, the higher number of objects in the 2MAst HQb5 sample was apparently compensated by the reduced crowding problems in the UCAC4 HQ data.
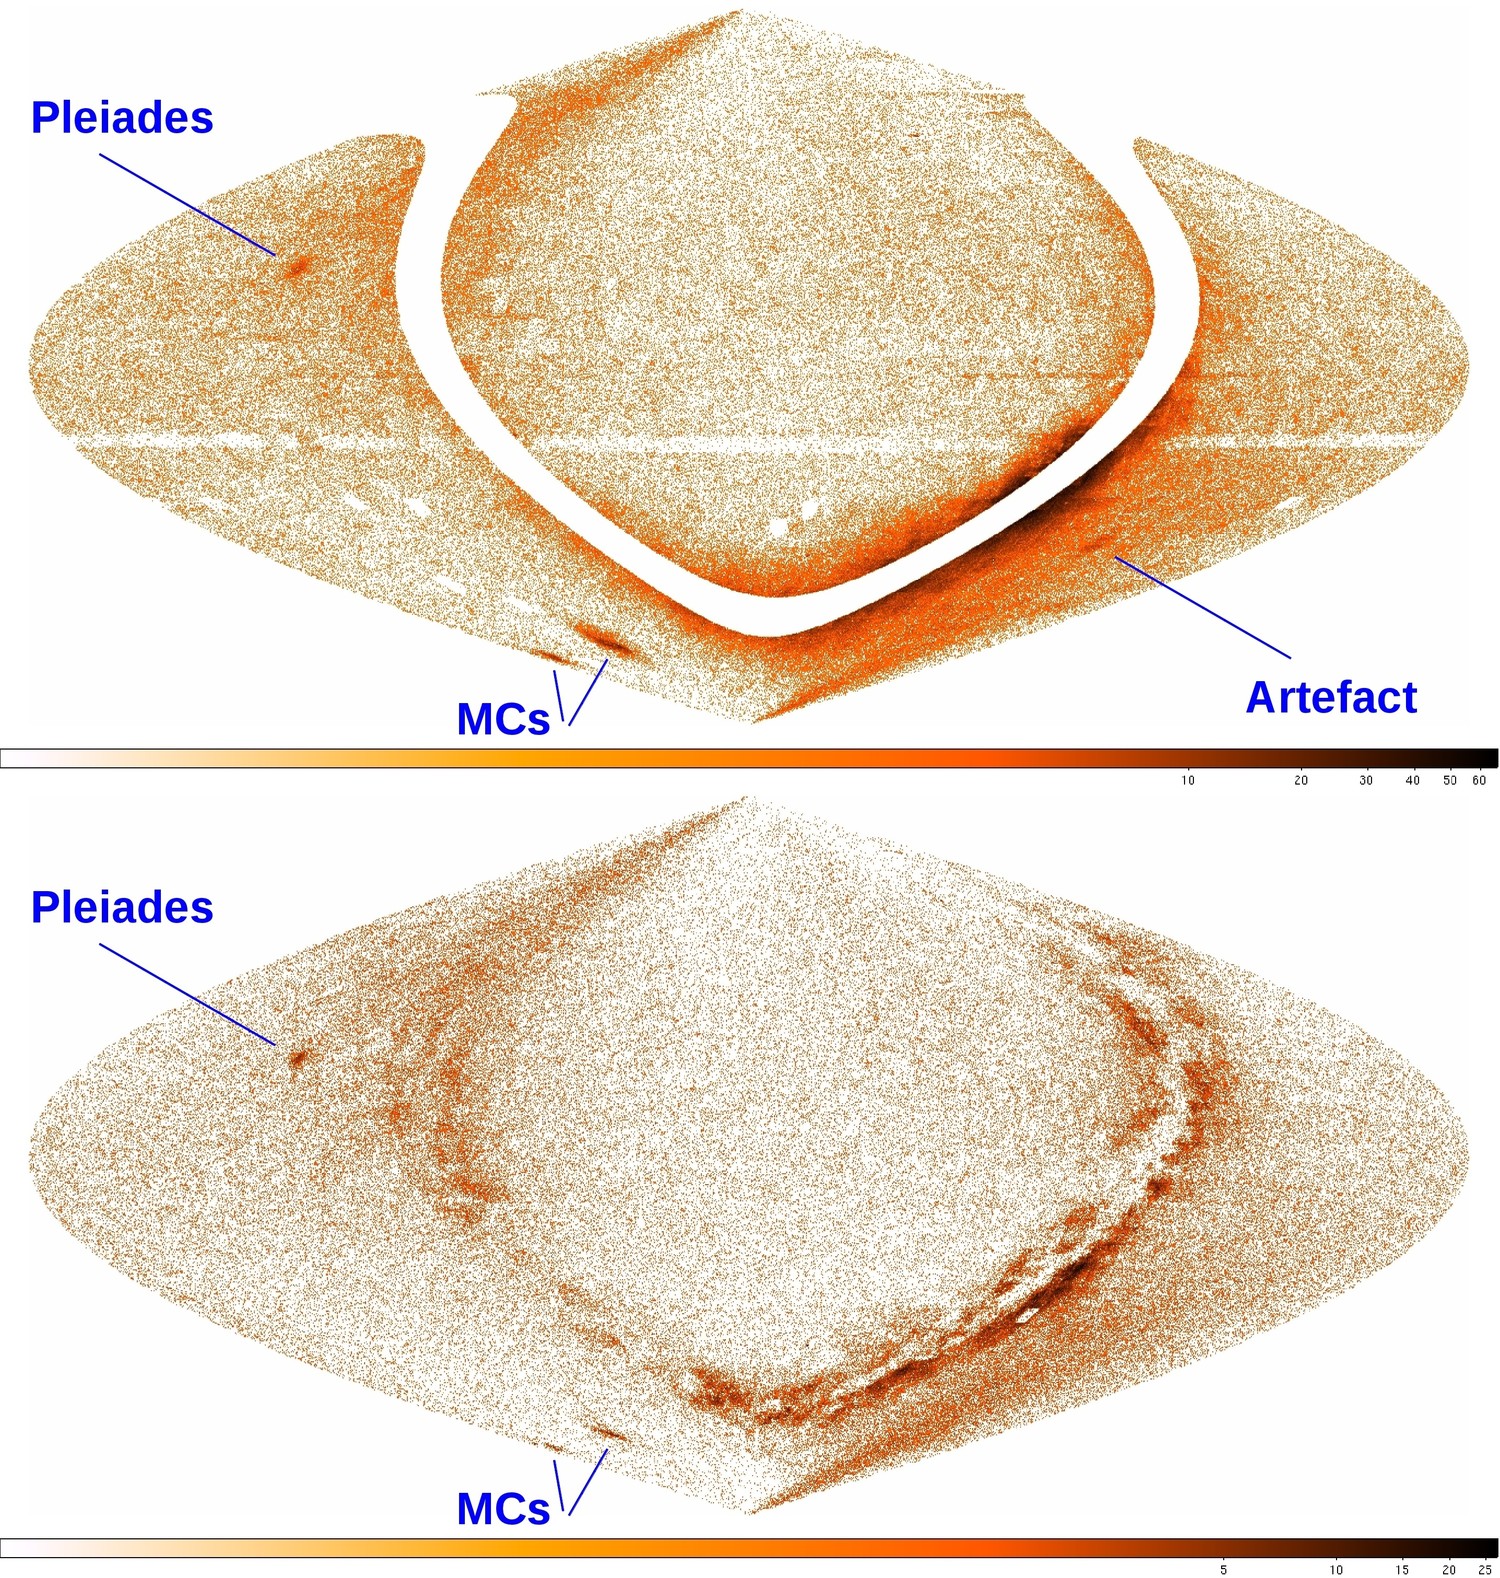
The mean proper motion of the subsamples shown in Fig. 9 is approximately equal to that of the Pleiades (Melotte 22), which show up clearly in both 2MAst HQb5 and UCAC4 HQ data. This is an example for the few known extended clusters (with total apparent radii, , clearly exceeding 1∘ in paper II) easily visible in those of our 882 sky images, where the proper motion of the cluster overlaps with our chosen circular proper motion bins. Other easily visible extended clusters (not shown) were Praesepe (NGC 2632) and the Per cluster (Melotte 20). On the other hand, extended clusters like Blanco 1 or Ruprecht 147 (also discussed as problematic in paper III) were difficult to detect visually (in case of Ruprecht 147 we visually detected the core of the cluster in one sky pixel) and fell below our thresholds with our final automated detection (Sect. 3.3). However, we did not intend to discover new extended clusters in this work, so our automated detection aimed at finding compact clusters.
By visual inspection, we found about 120 compact (concentrated in one or a few neighbouring pixels) cluster candidates, half of which turned out to be known open and globular clusters. These visually identified known clusters and cluster candidates served as comparison objects in the process of developing the automated procedure for the compact cluster detection described in the next section.
3.3 Automated detection of clusters
During visual inspection, known clusters and candidates showed up as bright sky pixels in several overlapping proper motion subsamples of both the 2MAst HQb5 and UCAC4 HQ image sets. Because of the large dynamic range of the sky images, in particular those representing small proper motions, and changing background (density of field stars) over the sky, the visual detection profited from the use of different colour maps and scalings (in SAOImage DS9). Our automated procedure aimed at detecting compact cluster candidates as ’hot’ sky pixels in proper motion-selected representations of the sky. Therefore, it appeared logical to combine the original sky images, apply filters for background subtraction and set thresholds corresponding to a minimum of possible cluster stars in a sky pixel. Summing up the sky images corresponding to strongly overlapping proper motion subsamples had the clear advantage of enhancing the signal and reducing the noise in our cluster search with still high enough resolution in the proper motion space. We performed the following steps in this automated detection process:
-
1.
Using MIDAS tools for operations on images, we created three sets of images: one from the original 441 2MAst HQb5 images (set A), a second from 441 UCAC4 HQ images (set B), and a third from combining the 441441 images (set AB). For each image of sets A and B, we combined four of the original sky images corresponding to proper motion subsamples overlapping in both directions. For each image of set AB, we combined eight of them. The new central proper motion grid points were separated by 10 mas/yr. The pixel intensities in the sky images of sets A and B were computed as the sum of four background-corrected original intensities, where the background around each pixel was determined as the median intensity of the eight surrounding pixels. Negative sums were set to zero. To avoid artefacts appearing in only one of the catalogues, the more important set of combined images (image set AB) was created with intensities computed as the square root of the product of these two sums from 2MAst HQb5 and UCAC4 HQ, respectively.
-
2.
Subsequently, using the MIDAS tool find/pixel, we created three tables (tables A, B, and AB) containing all intensities for all sky pixel locations and for all images (corresponding to the new proper motion grid points) of the three image sets, respectively. We considered table AB as our main source for the cluster search by proper motions, as it contained the combined proper motion information from both catalogues. High intensities in only one of the proper motion catalogues (artefacts) that were not above the background in the other led to zero intensities in table AB. Note that the maximum intensity for a given sky pixel in table AB was the result of a large number of stars in the same proper motion bin for both 2MAst HQb5 and UCAC4 HQ. On the other hand, if a given sky pixel intensity was at maximum in both tables A and B, this did not necessarily mean that these maxima corresponded to the same proper motion bin. Although, these proper motion bins were typically overlapping.
-
3.
As the values in the intensity tables equal sums of four original representations of the sky corrected for the background, we applied a threshold of 49 for table AB, corresponding to more than 12 possible cluster stars of a given proper motion. For the independent tables A and B, we used a slightly lower threshold of 40, corresponding to a minimum of 10 possible cluster stars above the local background numbers in the original images. By doing so, we allowed for small variations taking into account the different magnitude-dependent object numbers in our proper motion samples (Fig. 2) as well as the different performance of the two proper motion catalogues in crowded regions mentioned in Sect. 3.2. Only sky pixels with intensities above the corresponding thresholds in all three tables were further considered as potential locations of star clusters.
-
4.
Despite the correction for the background performed in step 1, the number of candidates was strongly increasing towards low Galactic latitudes. Therefore we applied an additional latitude-dependent threshold of 45 to the intensities in table AB, preserving the equivalent minimum object number of about 12 only at high Galactic latitudes (60∘). Our requested minimum object numbers per sky pixel increased to e.g. about 18 at 40∘, 33 at 20∘, and raised to about 65 at 10∘, and the maximum of about 130 at 5∘. The final number of cluster candidates was 692. All thresholds were adjusted so that the success rate of recovering the visually found clusters and candidates was at maximum.
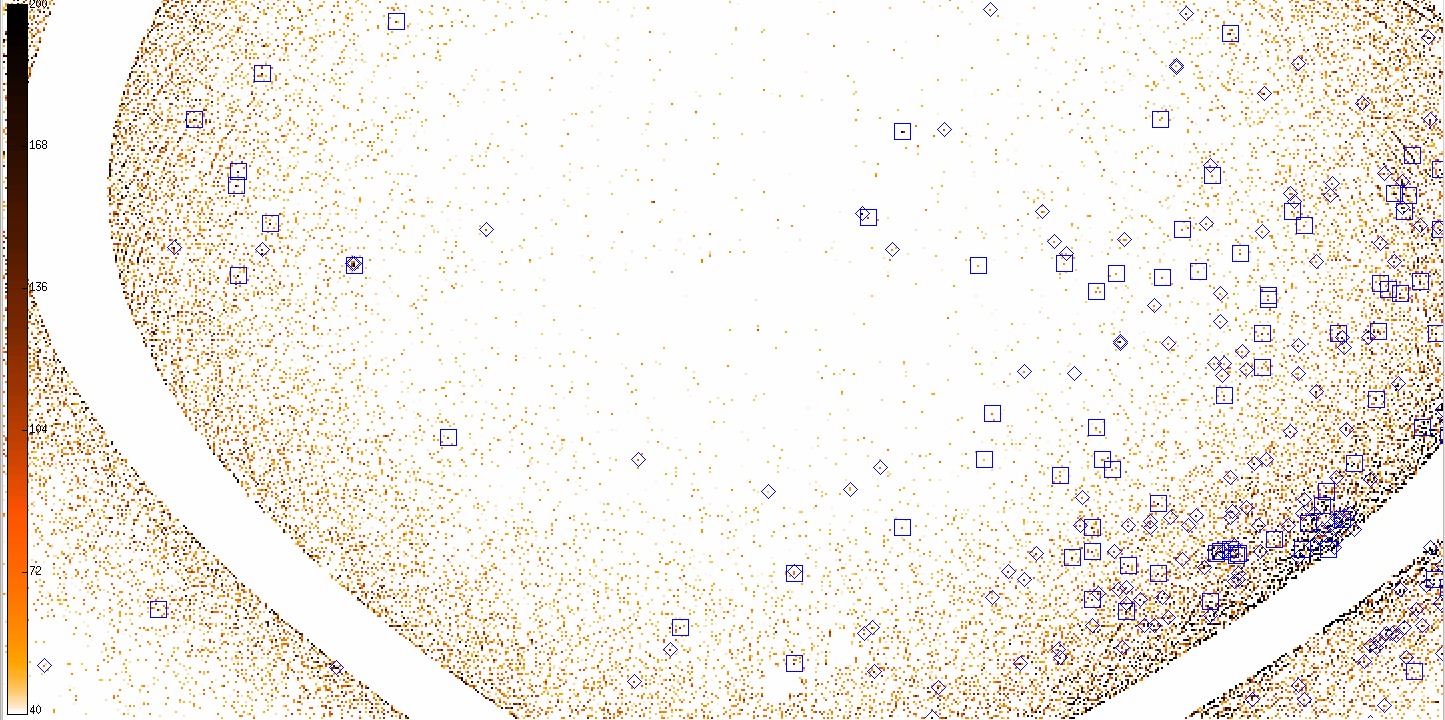
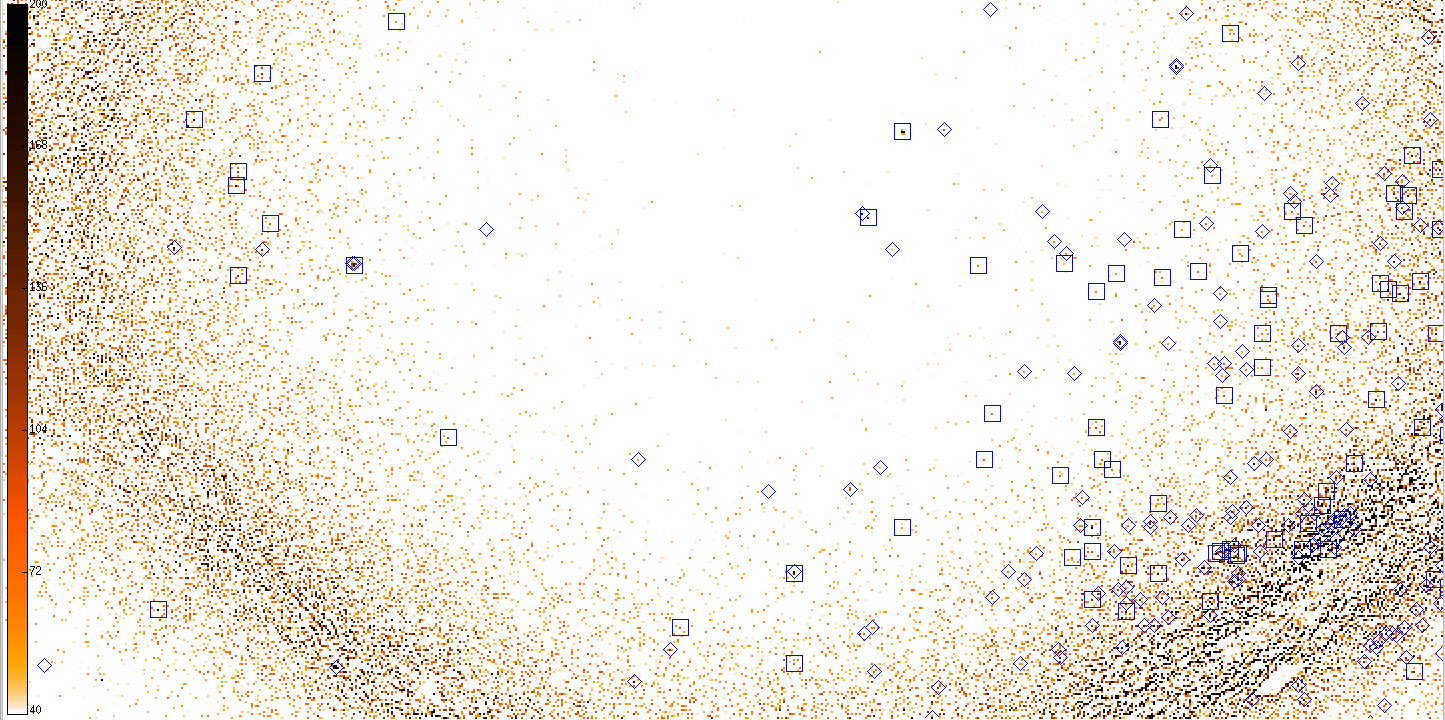
In Fig. 10 we show examples of filtered images of sets A, B, and AB (after step 1) with a 2 zoom on the central part of the sky projection used in Figs. 7, 8, and 9. The same intensity cuts were applied to all three images, as the intensities represent the background-corrected sums of four original images. The intensity of bright sky pixels can be considered as the fourfold number of member stars of a cluster candidate. There are many bright sky pixels appearing only in one of the upper two images, representing the 2MAst HQb5 and UCAC4 HQ data independently. The lower image shows the result of combining both data sets. It is still possible that a very large number in only one of the catalogues multiplied by a small number above zero in the other leads to a cluster candidate in the combined data set AB. However, applying all three thresholds to sets A, B, and AB, as described in step 3, we effectively excluded such cases. In addition to the marked candidates in Fig. 10 with proper motions equal or similar to the given proper motion bin, one can see even more relatively bright sky pixels, especially near the Galactic plane, at the same location in all three images. With our last Galactic latitude-dependent criterion in step 4, we excluded such cases, possibly resulting from noise in dense regions of the sky.
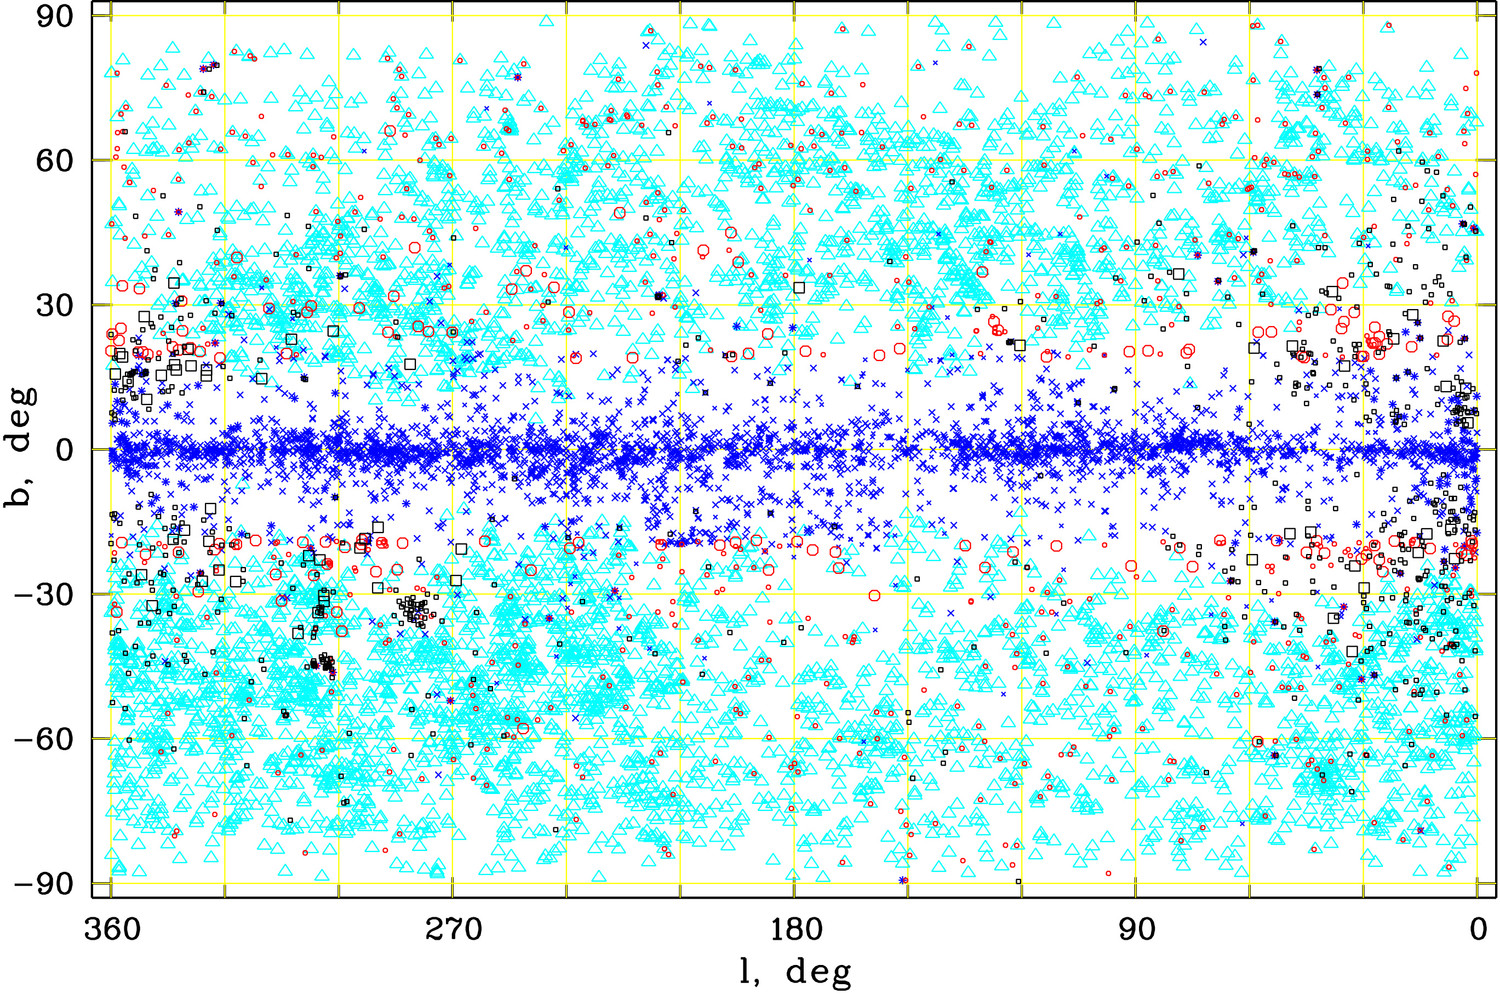
The proper motions of the 692 candidates were mostly small. Only for about 45% of the cluster candidates, one of the proper motion components was 12.5 or larger, reaching a maximum of 22.5 mas/yr in very few cases. These proper motions were considered only as rough initial estimates, which had still to be improved by the pipeline (Sect. 5). The initial size of all our cluster candidates corresponded to the pixel size (0.25 arcsec), but there were also adjacent hot pixels in the sky images, representing larger known clusters and cluster candidates. The largest known cluster detected with the automated procedure was NGC 2682 with a total apparent radius of 1.03∘ (according to paper II). The pixel coordinates provided only a relatively uncertain initial position of the candidates for their further analysis (Sect. 5). The distribution of all 692 candidates, including the later confirmed 63 new clusters (Sect. 5), can be seen in Fig. 11. Most of our candidates were concentrated in a wide region around the Galactic centre, although our final threshold was dependent only on Galactic latitude, not longitude.
| Number | identified | Number |
| of | with | of |
| candidates | object type | objects |
| 155 | known clusters of galaxies | 150 |
| 67 | known globular clusters | 46 |
| 56 | known open clusters (paper II) | 47 |
| 21 | known open clusters (paper III) | 21 |
| 6 | unconfirmed candidates (paper III) | 6 |
| 67 | new open clusters (this paper) | 63 |
| 33a𝑎aa𝑎aThese cluster candidates overlap with the very crowded regions of the Magellanic Clouds, where the 2MAst HQ proper motions are unreliable. | Large Magellanic Cloud | 1 |
| 17a𝑎aa𝑎aThese cluster candidates overlap with the very crowded regions of the Magellanic Clouds, where the 2MAst HQ proper motions are unreliable. | Small Magellanic Cloud | 1 |
| 270 | not confirmed | 270 |
4 Known clusters among the candidates
The efficiency of our automated cluster candidate selection was proved by the fact that 355 (51%) of the 692 cluster candidates turned out to overlap with previously known Galactic star clusters (or candidates), the Magellanic Clouds, or known clusters of galaxies (Table 1). Several candidates overlapped with the same known clusters that occupy relatively large areas on the sky. Interestingly, 21 of our candidates were also found and confirmed as open clusters in paper III, whereas another six common candidates of both studies were not confirmed by the MWSC pipeline. We discovered 63 new open clusters (Sect. 5), corresponding to 67 of our candidates, partly overlapping with each other. Among our 692 cluster candidates, there were 270 (39%) that could neither be identified with known objects nor confirmed by the MWSC pipeline.
There are higher numbers of known globular and especially open clusters among our 692 candidates compared to the numbers of known Milky Way clusters among the 782 candidates of paper III. This is probably caused by extending our search to lower Galactic latitudes. The smaller contamination of our survey by clusters of galaxies is probably achieved because of the same reason (clusters of galaxies become important at Galactic latitudes exceeding 15∘). The reduced contamination may also be related to our search by proper motions, although most of our candidates were found within the smallest proper motion bins. If we compare the numbers of all known globular (109) and open clusters (863) in our search area (5∘) with the corresponding numbers of detected objects in Table 1, we find that our search was much more sensitive to globular clusters than to open clusters. The 46 detected globulars correspond to a success rate of 42%. After excluding all open clusters more extended than our largest detected open cluster, NGC 2682, and all associations, moving groups, embedded clusters and cluster remnants, there are still 575 objects in the MWSC catalogue of paper II and 128 objects from paper III. Our success rate for open clusters is then only about 10%. The success rates for globular and open clusters are smaller than in paper III, probably because of the low quality of the currently available proper motions.
5 New clusters confirmed by the pipeline
The reduction pipeline combining the stellar positions and proper motions from the PPMXL catalogue with photometry from the 2MASS catalogue for cluster membership and parameter determination was described in paper I. We have not used the proper motions from UCAC4 in the pipeline, to be consistent with our MWSC survey. The main parameters (equatorial coordinates RA and Dec, Galactic coordinates and , the total apparent cluster radii and the numbers of 1- members (highly probable cluster members) within , the proper motion components pmx and pmy, the distances , and the ages ) of the 63 new clusters are listed in Table 2. The full tables with all determined cluster parameters in the same format as provided in paper I, II, and III are again available in electronic form only at the CDS. There one can also find the atlas pages with the standard MWSC diagrams and the membership lists for each of the new MWSC clusters. To distinguish the clusters and candidates of our proper motion search from previous MWSC entries, we assigned our objects with MWSC numbers in the range 4000…4999.
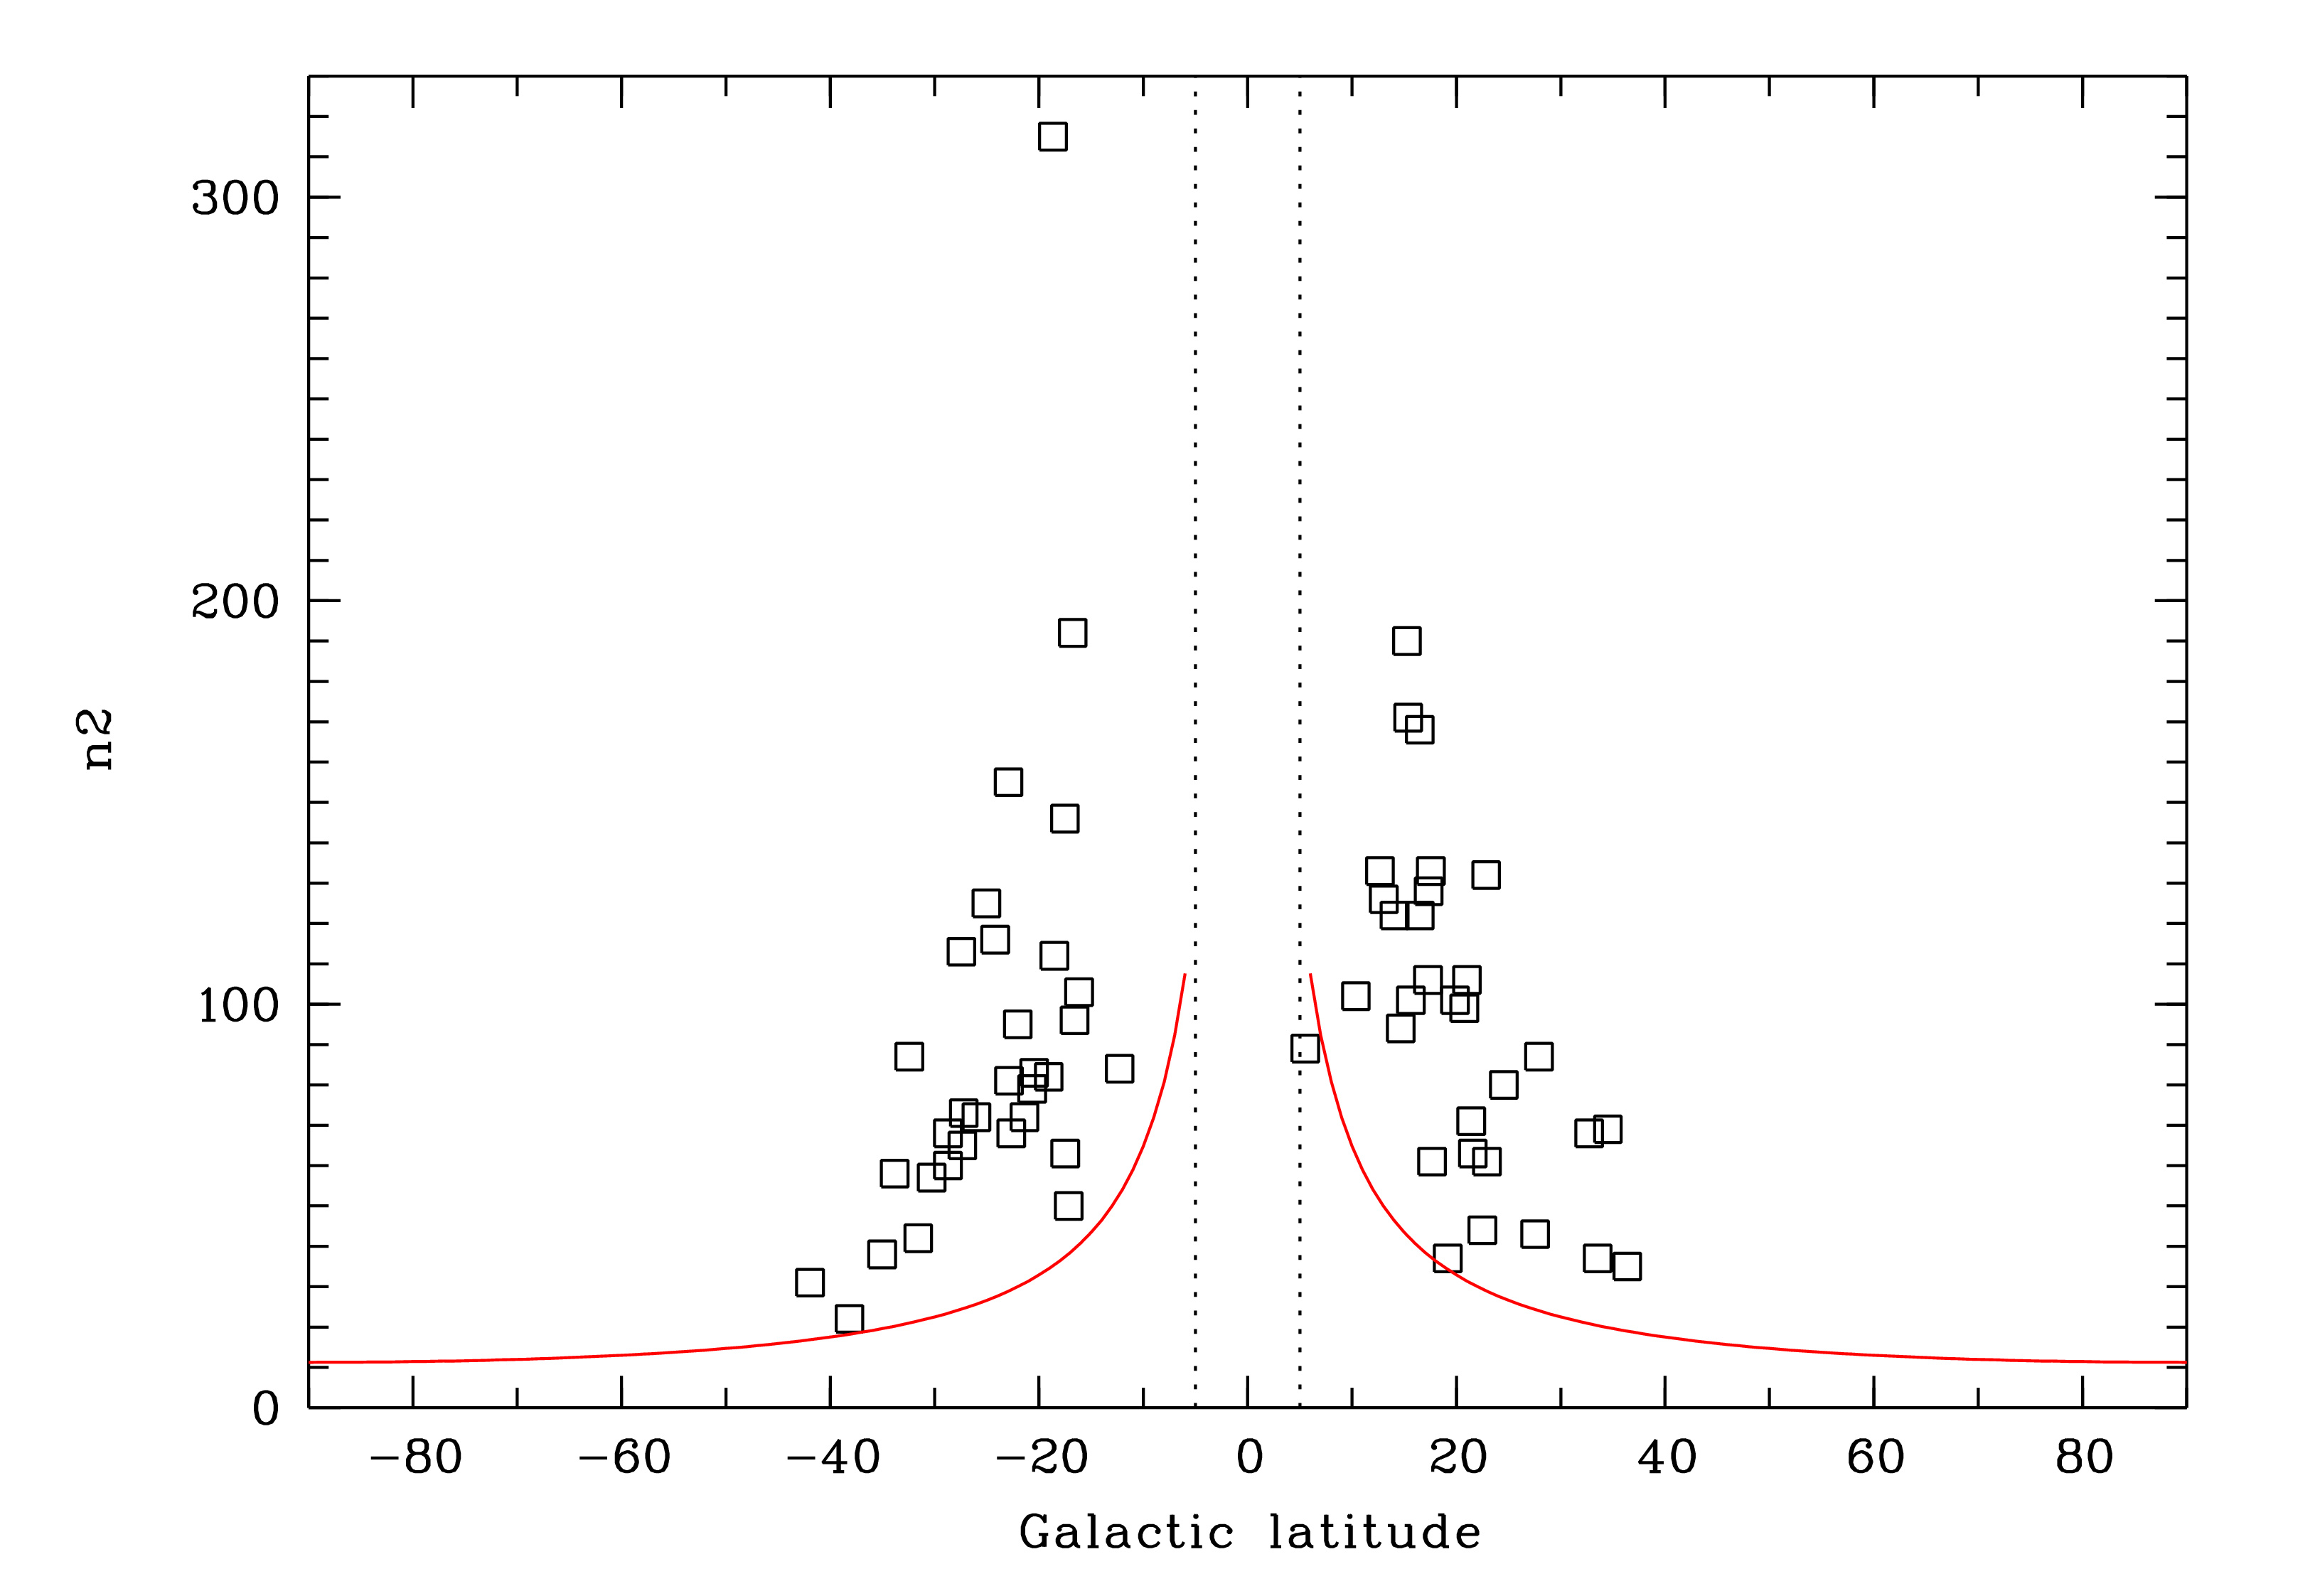
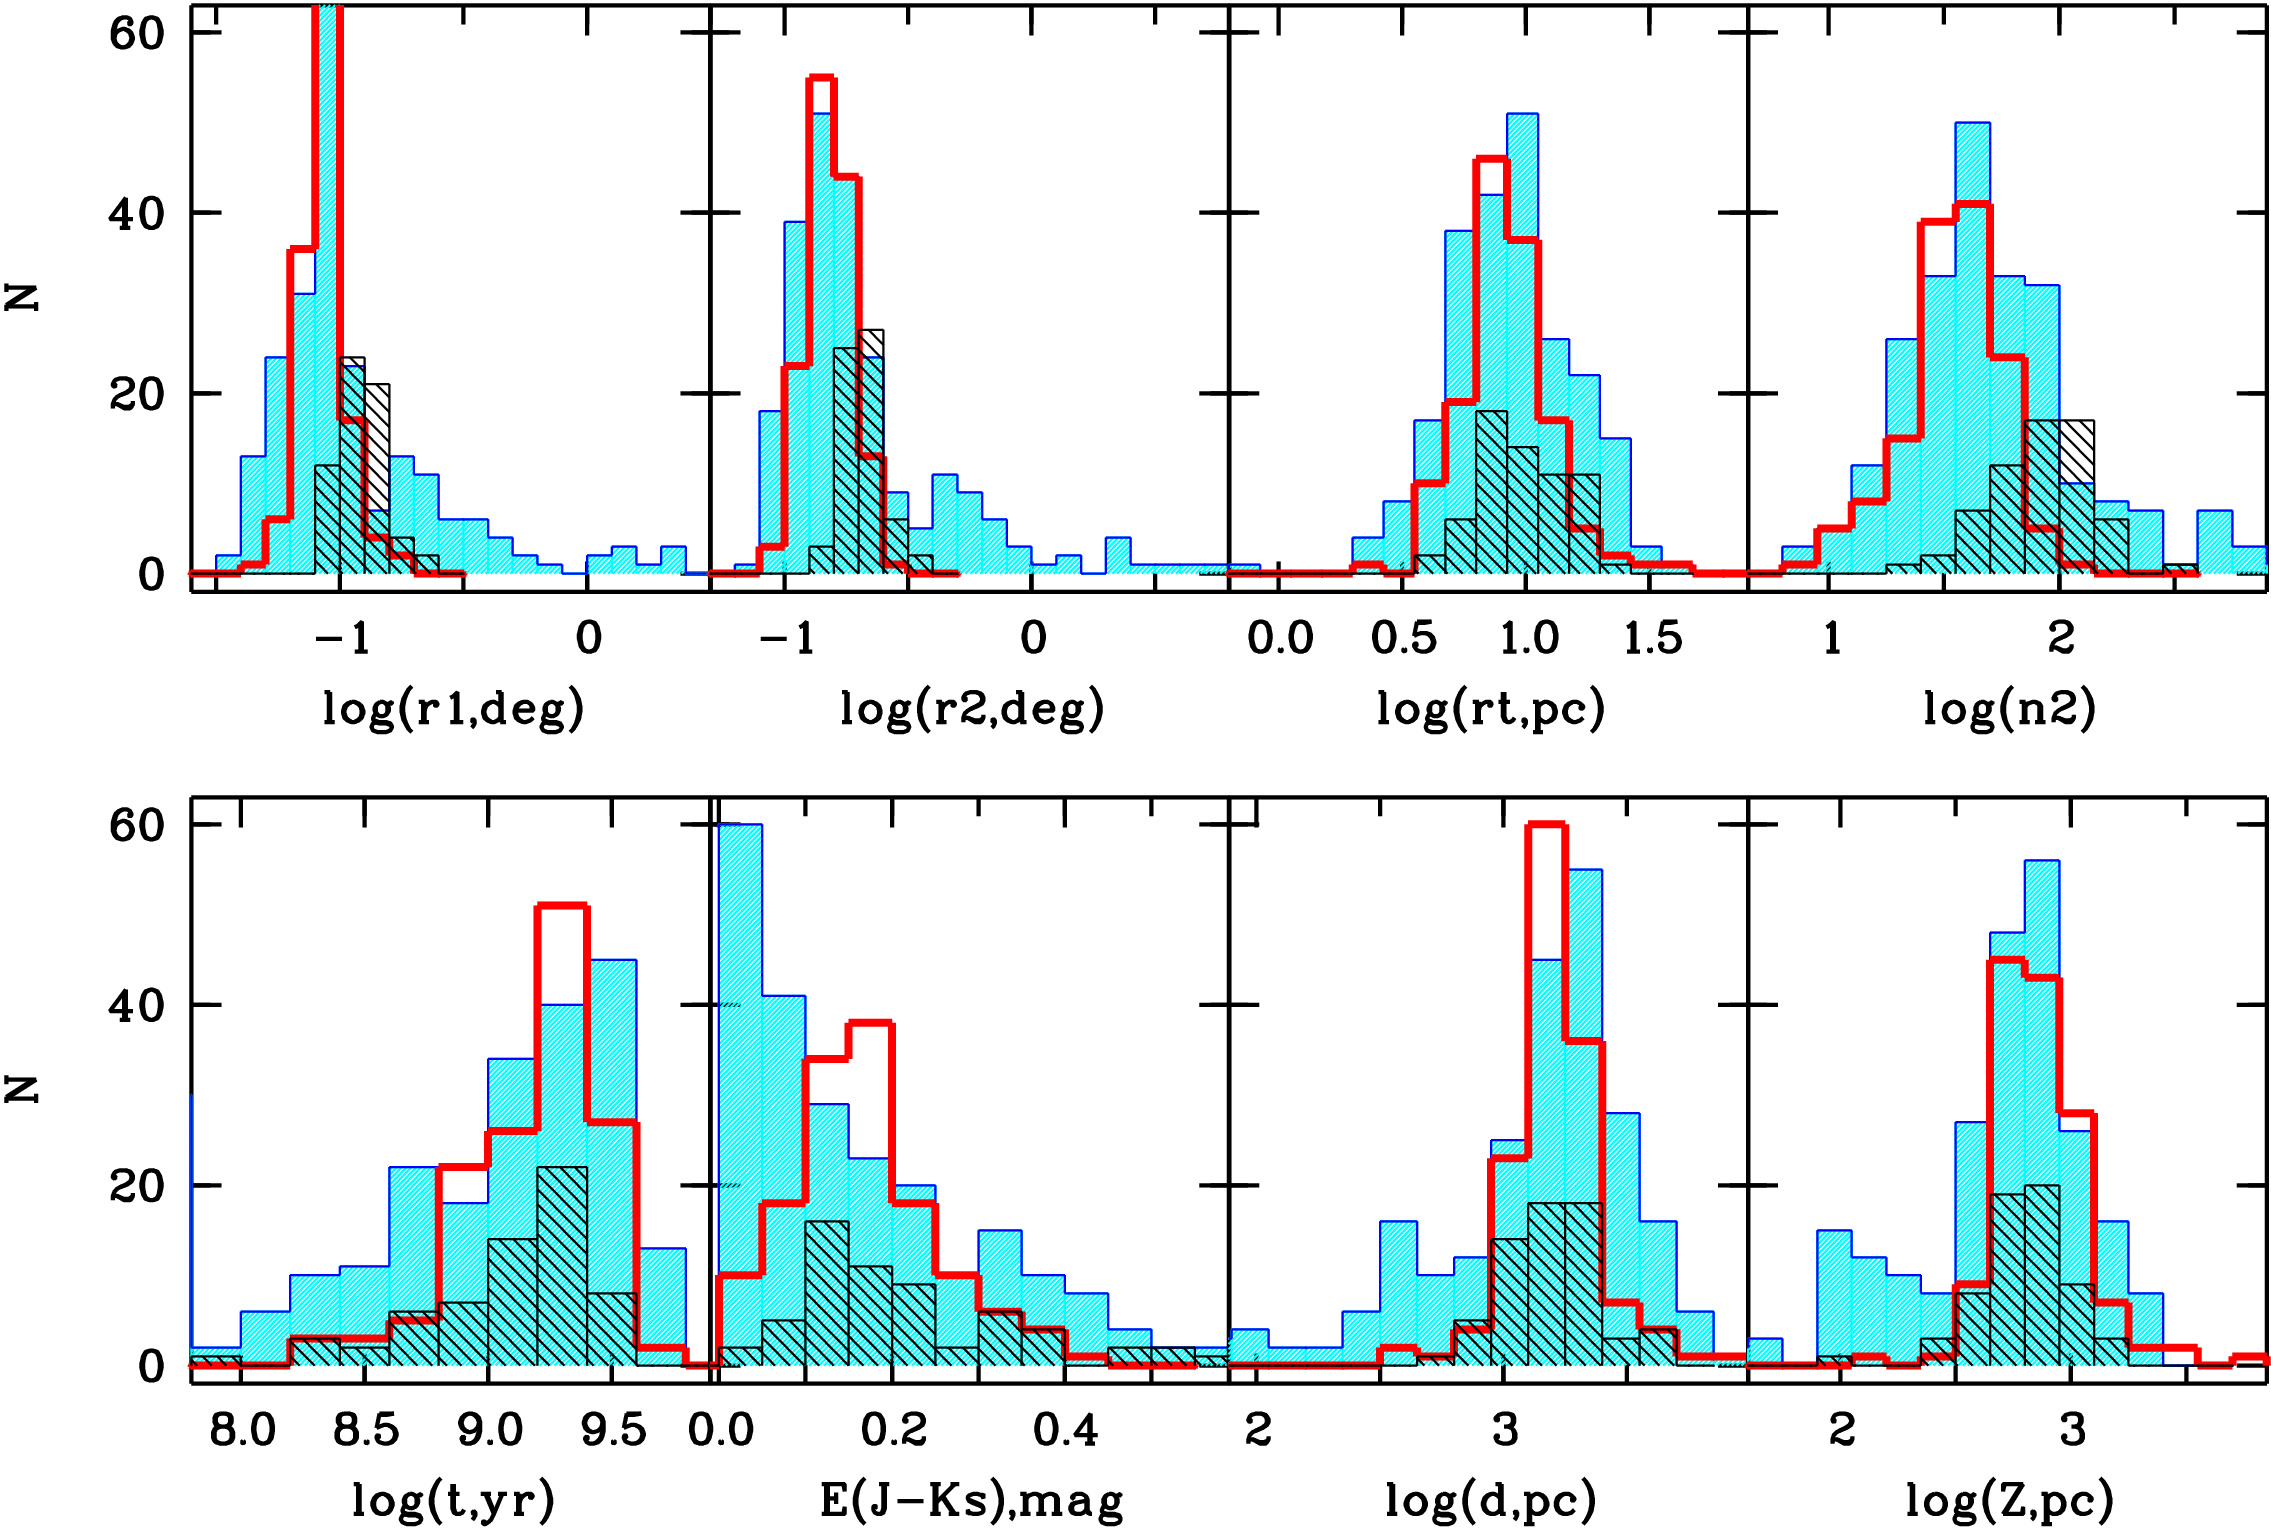
Table 2 and Fig. 12 show that only one of the 63 new open clusters lies at and the maximum of is at about 42∘. Only 26 (17 globulars and 9 open clusters) of all 3006 MWSC clusters (paper II) are located at . We added one new open cluster in that part of the sky, whereas paper III provided seven discoveries, respectively. As can be seen in Fig. 13, the distributions of several parameters of our new 63 clusters, namely the tidal radii, ages, distances, and heights above the Galactic plane, fit well within the corresponding main bodies of the MWSC distributions for clusters at moderately high Galactic latitudes (15∘). The distribution for the determined reddening parameters shows the same shift with respect to the MWSC distribution as the corresponding distribution of the new higher-latitude (20∘) clusters from paper III. This can be in part explained by the higher average interstellar extinction towards the Galactic centre, where we have found the bulk of our candidates. On the other hand, this effect may be just due to the fact that most of the less-reddened clusters were already discovered in the past.
We classified about 20% of the new clusters as sparse clusters or clusters with poor radial density profiles (RDP) (Table 2). We typed one of these clusters (MWSC_4131) as a cluster remnant and considered it as a cluster candidate. For comparison, 584 of the 3006 MWSC clusters (19%) of paper II were noted to be sparse or very sparse clusters, and 208 of the 3006 MWSC clusters (7%) as having a poor RDP (some have both notes). 168 of the 3006 MWSC clusters (6%) were typed as remnant clusters and cluster candidates. Thus our rate of ”problematic” clusters is comparable or slightly smaller than that of paper II.
Although our automated detection of cluster candidates aimed at finding relatively compact clusters, we see a trend in Fig. 13 to higher values for our determined radii and , as well as for the numbers of 1- members within the total apparent cluster radius, compared to the corresponding typical values of the clusters outside the immediate Galactic plane regions in papers II and III. The numbers of 1- members found by the MWSC pipeline are similar to the numbers of stars estimated for the corresponding candidates. As can be seen in Fig. 12, these numbers lie, with only one exception, clearly above the threshold that was dependent on Galactic latitude (see Sect. 3.3, step 4). The mean cluster proper motions determined by the pipeline for the 63 new clusters (see Table 2) also confirm our initial rough estimates for the corresponding candidates. The formal errors of the mean cluster proper motions are smaller than about 1 mas/yr because of the relatively large numbers of members per cluster. The resulting total proper motions are relatively small. They lie in the range between 1 mas/yr and 13 mas/yr with a mean value of 6.3 mas/yr. This is slightly larger than the average for 139 clusters from paper III (5.8 mas/yr) and the average for all 3006 clusters from paper II (5.5 mas/yr), but slightly smaller than the mean value (7.0 mas/yr) for 231 MWSC open clusters with 15∘ from paper II.
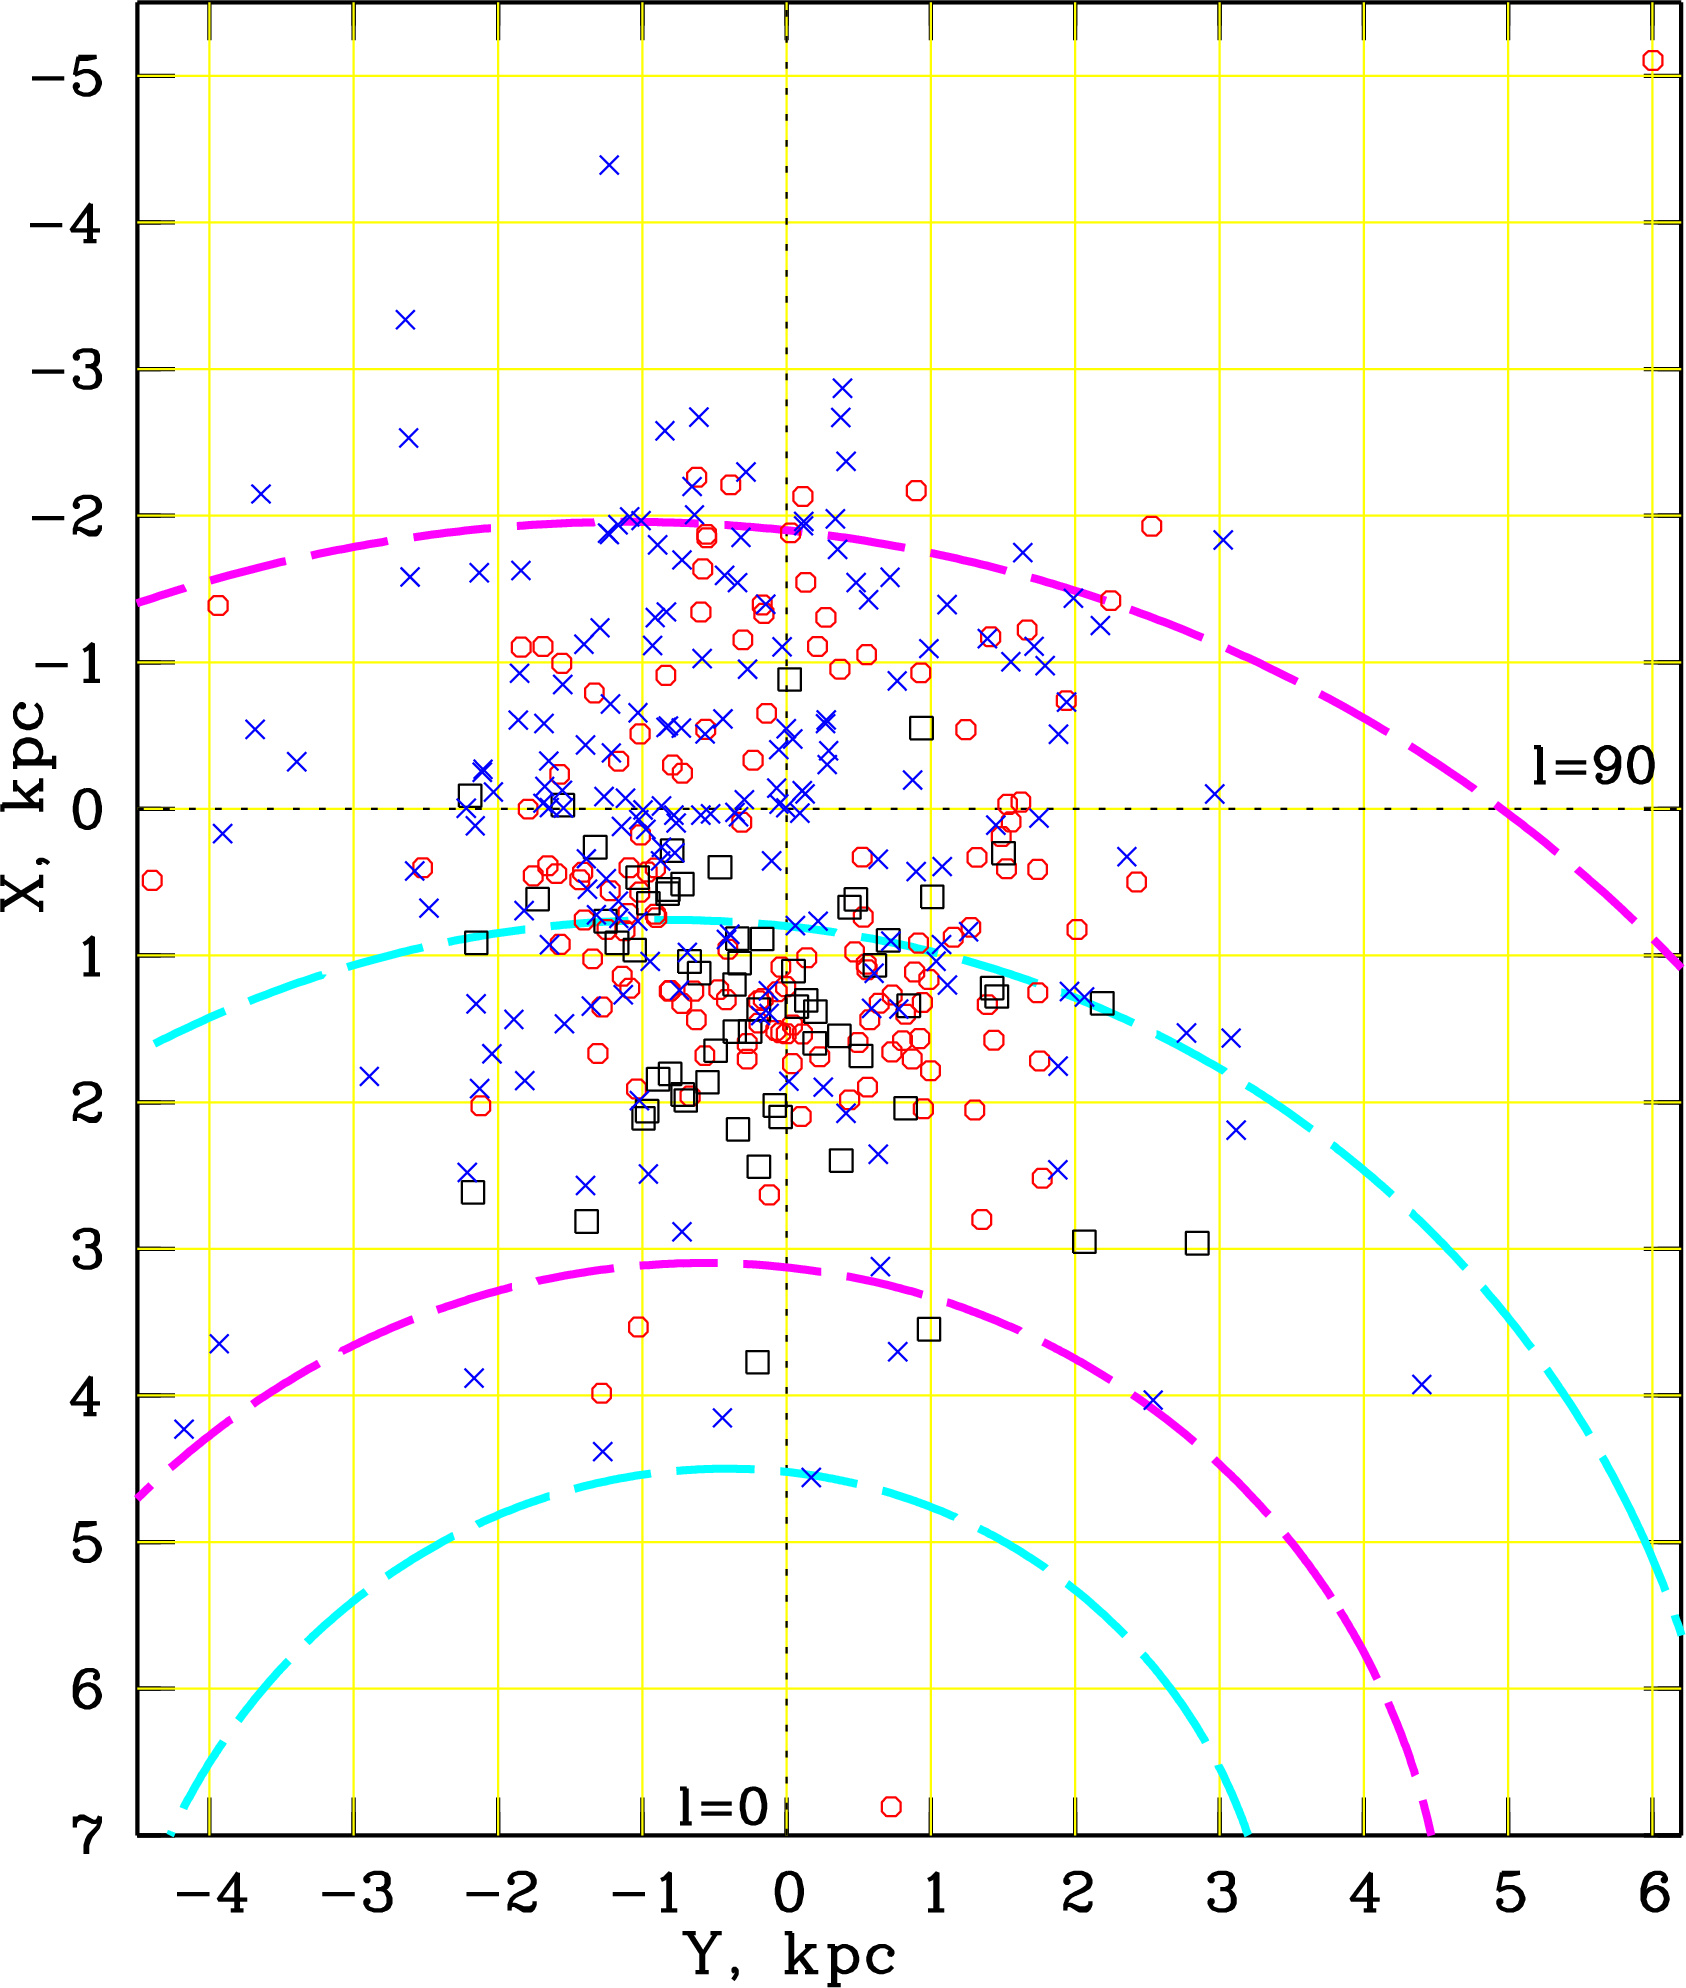
An asymmetry between the numbers of newly found clusters in the outer and inner Galactic quadrants has already been observed for the discoveries of paper III. This asymmetry is much stronger for our new 63 clusters (see Fig. 14), from which only four lie in the outer Galactic quadrants.
| Name | RA (J2000) | Dec (J2000) | pmx | pmy | ||||||
|---|---|---|---|---|---|---|---|---|---|---|
| [h] | [deg] | [deg] | [deg] | [deg] | [mas/yr] | [mas/yr] | [pc] | [yr] | ||
| MWSC_4005 | 0.1910 | 85.480 | 303.850 | 31.573 | 0.165 | 42 | 9.3 | 1.5 | 1159 | 9.375 |
| MWSC_4114 | 6.1310 | 78.220 | 289.714 | 28.731 | 0.240 | 60 | 0.2 | 5.9 | 962 | 9.400 |
| MWSC_4116 | 6.3200 | 59.970 | 269.071 | 27.208 | 0.225 | 73 | 0.9 | 8.6 | 1743 | 9.125 |
| MWSC_4119 | 7.1010 | 57.230 | 267.671 | 20.653 | 0.205 | 79 | 2.8 | 9.8 | 2347 | 8.985 |
| MWSC_4131a,c𝑎𝑐a,ca,c𝑎𝑐a,cfootnotemark: | 8.3215 | 42.035 | 178.664 | 33.536 | 0.220 | 37 | 1.0 | 7.7 | 1058 | 9.400 |
| MWSC_4137 | 9.4365 | 79.740 | 294.396 | 20.461 | 0.180 | 83 | 4.1 | 8.8 | 1209 | 9.210 |
| MWSC_4138 | 9.4520 | 73.500 | 289.628 | 16.163 | 0.185 | 103 | 3.3 | 6.5 | 1908 | 9.280 |
| MWSC_4140 | 9.6100 | 77.480 | 293.037 | 18.529 | 0.225 | 112 | 3.2 | 3.3 | 2465 | 9.280 |
| MWSC_4146b𝑏bb𝑏bCluster with poor radial density profile | 11.0125 | 40.490 | 281.169 | 17.660 | 0.160 | 61 | 9.4 | 4.1 | 1419 | 9.100 |
| MWSC_4158b𝑏bb𝑏bCluster with poor radial density profile | 12.7410 | 38.310 | 301.420 | 24.544 | 0.195 | 80 | 6.6 | 3.6 | 1616 | 9.020 |
| MWSC_4170 | 13.6135 | 39.185 | 312.447 | 22.850 | 0.220 | 132 | 3.9 | 0.5 | 1548 | 9.380 |
| MWSC_4176 | 14.4550 | 85.420 | 304.948 | 22.925 | 0.280 | 155 | 9.4 | 0.1 | 1093 | 9.315 |
| MWSC_4178 | 14.4605 | 44.945 | 320.272 | 14.667 | 0.180 | 94 | 4.0 | 3.6 | 3515 | 9.300 |
| MWSC_4194 | 15.1315 | 17.425 | 343.417 | 34.512 | 0.320 | 69 | 0.7 | 1.0 | 2089 | 9.200 |
| MWSC_4210 | 15.4640 | 36.520 | 334.835 | 16.487 | 0.205 | 168 | 4.6 | 4.3 | 2432 | 9.080 |
| MWSC_4211 | 15.5265 | 37.490 | 334.869 | 15.262 | 0.240 | 190 | 8.3 | 4.0 | 2361 | 8.820 |
| MWSC_4212 | 15.5530 | 30.335 | 339.699 | 20.760 | 0.225 | 99 | 4.3 | 5.0 | 2221 | 9.025 |
| MWSC_4218 | 15.6740 | 33.475 | 338.909 | 17.343 | 0.250 | 128 | 6.0 | 7.1 | 993 | 9.100 |
| MWSC_4219 | 15.7040 | 83.195 | 307.903 | 22.037 | 0.200 | 95 | 9.3 | 3.1 | 1606 | 9.100 |
| MWSC_4225 | 15.8050 | 18.305 | 351.231 | 27.547 | 0.160 | 43 | 3.6 | 5.8 | 2495 | 8.700 |
| MWSC_4228 | 15.9090 | 30.660 | 343.205 | 17.550 | 0.260 | 133 | 4.7 | 5.0 | 1312 | 8.740 |
| MWSC_4229 | 15.9415 | 31.720 | 342.787 | 16.484 | 0.255 | 122 | 4.8 | 7.0 | 1148 | 9.015 |
| MWSC_4248 | 16.2125 | 29.905 | 346.715 | 15.383 | 0.250 | 171 | 1.1 | 1.4 | 1618 | 8.900 |
| MWSC_4265 | 16.4845 | 19.155 | 357.685 | 19.864 | 0.285 | 101 | 0.2 | 1.5 | 2153 | 8.600 |
| MWSC_4267 | 16.4905 | 20.140 | 356.940 | 19.168 | 0.165 | 37 | 3.2 | 0.8 | 4001 | 8.250 |
| MWSC_4286 | 16.6925 | 30.535 | 350.548 | 10.370 | 0.160 | 102 | 0.1 | 3.4 | 1564 | 8.910 |
| MWSC_4287 | 16.7100 | 24.460 | 355.485 | 14.070 | 0.230 | 122 | 4.5 | 5.7 | 2524 | 7.920 |
| MWSC_4288a𝑎aa𝑎aSparse cluster | 16.7365 | 0.135 | 17.003 | 27.915 | 0.350 | 87 | 0.1 | 7.8 | 1994 | 9.015 |
| MWSC_4289 | 16.7680 | 20.940 | 358.852 | 15.632 | 0.195 | 101 | 0.8 | 0.9 | 2183 | 9.325 |
| MWSC_4290 | 16.7770 | 9.195 | 8.956 | 22.483 | 0.165 | 44 | 3.1 | 5.3 | 2628 | 8.380 |
| MWSC_4301 | 16.9890 | 18.360 | 38.180 | 32.723 | 0.295 | 68 | 1.5 | 7.0 | 1355 | 9.415 |
| MWSC_4312 | 17.1085 | 19.445 | 3.030 | 12.665 | 0.220 | 133 | 2.3 | 3.9 | 1384 | 8.200 |
| MWSC_4316 | 17.1745 | 51.570 | 78.642 | 36.379 | 0.225 | 35 | 4.7 | 1.6 | 1905 | 9.230 |
| MWSC_4317a𝑎aa𝑎aSparse cluster | 17.1745 | 1.265 | 21.991 | 22.930 | 0.190 | 61 | 2.1 | 0.2 | 2391 | 9.425 |
| MWSC_4330 | 17.2840 | 15.080 | 8.182 | 13.033 | 0.175 | 126 | 2.9 | 4.4 | 1434 | 8.550 |
| MWSC_4349 | 17.4505 | 57.525 | 333.768 | 12.271 | 0.150 | 84 | 3.5 | 7.7 | 3210 | 8.805 |
| MWSC_4355 | 17.5100 | 23.935 | 2.437 | 5.516 | 0.180 | 89 | 1.4 | 3.7 | 1113 | 8.680 |
| MWSC_4375 | 17.8825 | 9.515 | 34.944 | 17.280 | 0.200 | 106 | 3.5 | 2.8 | 3772 | 9.375 |
| MWSC_4383 | 17.9790 | 23.050 | 48.688 | 21.423 | 0.210 | 71 | 3.0 | 6.9 | 2082 | 9.095 |
| MWSC_4408 | 18.2585 | 60.215 | 334.203 | 19.064 | 0.165 | 82 | 1.6 | 8.0 | 2167 | 8.495 |
| MWSC_4409a𝑎aa𝑎aSparse cluster | 18.2560 | 31.725 | 58.789 | 21.009 | 0.220 | 106 | 0.3 | 4.7 | 2740 | 8.850 |
| MWSC_4410 | 18.2840 | 53.690 | 340.628 | 16.771 | 0.195 | 192 | 4.6 | 6.6 | 2202 | 8.900 |
| MWSC_4429 | 18.5930 | 51.745 | 343.617 | 18.655 | 0.290 | 315 | 0.5 | 5.1 | 2051 | 9.045 |
| MWSC_4463a𝑎aa𝑎aSparse cluster | 18.9820 | 64.265 | 331.551 | 25.042 | 0.210 | 125 | 0.9 | 5.4 | 1406 | 9.150 |
| MWSC_4475 | 19.1360 | 30.230 | 6.977 | 16.590 | 0.165 | 96 | 1.5 | 3.3 | 1681 | 8.785 |
| MWSC_4483 | 19.2855 | 68.525 | 327.128 | 27.432 | 0.235 | 113 | 0.5 | 5.8 | 1397 | 9.310 |
| MWSC_4484 | 19.3720 | 25.010 | 13.271 | 17.519 | 0.210 | 146 | 0.5 | 5.2 | 1667 | 9.045 |
| MWSC_4486 | 19.4000 | 60.725 | 335.952 | 27.341 | 0.180 | 65 | 5.2 | 7.7 | 2228 | 9.300 |
| MWSC_4498a𝑎aa𝑎aSparse cluster | 19.5335 | 46.435 | 351.937 | 25.997 | 0.155 | 72 | 1.5 | 6.7 | 1537 | 9.360 |
| MWSC_4500a𝑎aa𝑎aSparse cluster | 19.5560 | 33.235 | 5.964 | 22.657 | 0.150 | 68 | 6.1 | 1.2 | 1423 | 9.200 |
| MWSC_4511 | 19.6940 | 24.455 | 15.539 | 21.390 | 0.170 | 72 | 1.7 | 4.2 | 3957 | 9.500 |
| MWSC_4545a𝑎aa𝑎aSparse cluster | 20.1305 | 49.860 | 349.127 | 32.426 | 0.225 | 87 | 1.9 | 3.7 | 1070 | 9.310 |
| MWSC_4547 | 20.2035 | 1.525 | 43.847 | 17.151 | 0.165 | 50 | 0.6 | 2.0 | 4298 | 9.200 |
| MWSC_4555a𝑎aa𝑎aSparse cluster | 20.2925 | 11.350 | 32.229 | 24.195 | 0.250 | 116 | 7.1 | 10.4 | 1740 | 9.505 |
| MWSC_4561 | 20.3980 | 5.900 | 49.340 | 17.490 | 0.185 | 63 | 3.1 | 11.7 | 1968 | 9.400 |
| MWSC_4572a𝑎aa𝑎aSparse cluster | 20.5165 | 15.175 | 29.803 | 28.735 | 0.190 | 68 | 3.6 | 3.4 | 1402 | 9.340 |
| MWSC_4602 | 21.0460 | 10.765 | 59.287 | 22.880 | 0.230 | 81 | 3.1 | 3.6 | 1274 | 8.785 |
| MWSC_4606 | 21.1020 | 11.470 | 37.884 | 35.042 | 0.245 | 38 | 2.5 | 4.6 | 956 | 9.385 |
| MWSC_4622 | 21.4340 | 17.750 | 32.917 | 41.939 | 0.240 | 31 | 2.3 | 8.5 | 1075 | 9.300 |
| MWSC_4668a𝑎aa𝑎aSparse cluster | 22.9490 | 77.170 | 310.708 | 38.172 | 0.180 | 22 | 8.2 | 5.0 | 775 | 9.100 |
| MWSC_4674 | 23.3690 | 84.010 | 120.487 | 21.563 | 0.210 | 63 | 2.2 | 0.1 | 1166 | 9.550 |
| MWSC_4682 | 23.7230 | 82.960 | 305.405 | 33.835 | 0.190 | 58 | 5.9 | 0.3 | 1065 | 9.280 |
| MWSC_4688 | 23.8650 | 86.720 | 303.906 | 30.291 | 0.185 | 57 | 3.2 | 5.0 | 1336 | 9.390 |
6 Limitations of our cluster search and outlook
The random and systematic errors of the stellar proper motions in the available global catalogues (PPMXL and UCAC4) are larger than or comparable in size to most of the mean cluster proper motions. Even after applying our HQ constraints, the quality assessment and comparison of our chosen 2MAst HQb5 and UCAC4 HQ samples forced us to use a rather large radius of 15 mas/yr for our circular proper motion bins. Compared to the accurate 2MASS photometry used as input in the search of paper III, the currently available best proper motions did not allow us to reach a comparable success rate in our proper motion-based cluster search.
There were much larger numbers of objects represented in our sky images with small proper motions compared to the sparsely populated sky images with higher proper motions. It may be worth concentrating on the latter, where the contamination with clusters of galaxies should be much reduced, even if one considers the influence of the still relatively large proper motion errors in the 2MAst HQb5 and UCAC4 HQ samples. We also plan to develop a revised method for detecting extended cluster candidates. Both aspects are closely related to the question of missing nearby clusters. These investigations will be presented in a separate paper of the MWSC series.
The new clusters confirmed by the MWSC pipeline, which uses near-infrared photometry, and the cluster parameters should be verified by independent optical photometry. This is e.g. provided by the American Association of Variable Star Observers (AAVSO) Photometric all-sky survey (APASS)333http://www.aavso.org/download-apass-data for a large part of the UCAC4 stars. Alves et al. (alves12 (2012)) found some significant disagreements between cluster parameters obtained from near-infrared and optical data. Other reduction pipelines for cluster investigations like ASteCA (Automated Stellar Cluster Analysis) by Perren et al. (perren15 (2015)) or the program of Popova (popova13 (2013)) can be applied for the verification of our 63 new clusters. The use of the UCAC4 proper motions (as e.g. by Dias et al. dias14 (2014)) may also lead to some changes in the cluster membership and mean cluster proper motions. The latter may differ by a few mas/yr according to our comparison of 2MAst HQb5 and UCAC4 HQ proper motions over the sky.
An enormous quality jump in the input data for a search for Galactic clusters can be expected from the Gaia mission. This concerns especially the distance measurements, which will be first provided for the same about 2.5 million bright stars (Michalik et al. michalik15 (2015)), which we used in our first cluster search, the COCD extension (Kharchenko et al.2005b ). While at that time only the small Hipparcos subsample was equipped with parallaxes, we expect the first Gaia data release to provide about 10-20 times higher accuracy for the parallaxes and proper motions of all these 2.5 million stars, respectively. The second Gaia data release will then deliver proper motions and parallaxes for a number of objects with single-star behaviour that is probably at least as large as the number of objects in our 2MAst HQ and UCAC4 HQ samples, where the parallaxes will be available for the first time, whereas the proper motions are expected to be 10-100 times more accurate. Therefore, a proper motion-based search for new clusters in the Gaia data will be possible with very small circular proper motion bins (with radii of the order of 1 mas/yr). In addition, all these stars will have optical photometry, and a brighter subset will have radial velocity measurements. Sky distributions of Gaia subsamples selected not only by proper motions but also by distances and radial velocties can be investigated in much more detail (on a fine grid of these parameters) to first investigate possible small systematic errors over the sky and then to search for Galactic clusters. In addition to the much higher accuracies of the measured stellar parameters, the high spatial resolution of Gaia is an advantage for detecting star clusters in crowded fields.
Acknowledgements.
This study was supported by DFG grant RO 528/10-1, and by Sonderforschungsbereich SFB 881 ”The Milky Way System” (subproject B5) of the German Research Foundation (DFG). This research has made use of SAOImage DS9, developed by Smithsonian Astrophysical Observatory, and of data products from the 2MASS, a joint project of the University of Massachusetts and the Infrared Processing and Analysis Center/California Institute of Technology, funded by the National Aeronautics and Space Administration and the National Science Foundation. We thank the anonymous referee for her/his helpful comments.References
- (1) Abell, G. O., Corwin, H. G., Jr., & Olowin, R. P. 1989, ApJS, 70, 1
- (2) Alves, V. M., Pavani, D. B., Kerber, L. O., & Bica, E. 2012, New Astronomy, 17, 488
- (3) Anderson, R. I., Eyer, L., & Mowlavi, N. 2013, MNRAS, 434, 2238
- (4) Batista, S. F. A., Adibekyan, V. Z., Sousa, S. G., et al. 2014, A&A, 564, AA43
- (5) Bobylev, V. V., & Bajkova, A. T. 2014, Astronomy Letters, 40, 353
- (6) Chen, X., de Grijs, R., & Deng, L. 2015, MNRAS, 446, 1268
- (7) Conrad, C., Scholz, R.-D., Kharchenko, N. V., et al. 2014, A&A, 562, A54
- (8) Dias, W. S., Monteiro, H., Caetano, T. C., et al. 2014, A&A, 564, AA79
- (9) Elias, F., Alfaro, E. J., & Cabrera-Caño, J. 2009, MNRAS, 397, 2
- (10) Froebrich, D., Scholz, A., & Raftery, C. L. 2007, MNRAS, 374, 399
- (11) Gieles, M., & Bastian, N. 2008, A&A, 482, 165
- (12) Gozha, M. L., Borkova, T. V., & Marsakov, V. A. 2012, Astronomy Letters, 38, 506
- (13) de Grijs, R., Goodwin, S. P., Kouwenhoven, M. B. N., & Kroupa, P. 2008, A&A, 492, 685
- (14) Guerrero, C. A., Orlov, V. G., Monroy-Rodríguez, M. A., & Voitsekhovich, V. V. 2014, AJ, 147, 28
- (15) Gvaramadze, V. V., & Bomans, D. J. 2008, A&A, 490, 1071
- (16) Høg, E., Fabricius, C., Makarov, V. V., et al. 2000, A&A, 355, L27
- (17) Hubrig, S., Schöller, M., Kharchenko, N. V., et al. 2011, A&A, 528, AA151
- (18) Joye, W. A., & Mandel, E. 2003, Astronomical Data Analysis Software and Systems XII, 295, 489
- (19) Kharchenko, N. V. 2001, Kinematika i Fizika Nebesnykh Tel, 17, 409
- (20) Kharchenko, N. V., Piskunov, A. E., Röser, S., Schilbach, E., & Scholz, R.-D. 2004, Astronomische Nachrichten, 325, 740
- (21) Kharchenko, N. V., Piskunov, A. E., Röser, S., Schilbach, E., & Scholz, R.-D. 2005a, A&A, 438, 1163
- (22) Kharchenko, N. V., Piskunov, A. E., Röser, S., Schilbach, E., & Scholz, R.-D. 2005b, A&A, 440, 403
- (23) Kharchenko, N. V., Scholz, R.-D., Piskunov, A. E., Röser, S., & Schilbach, E. 2007, AN, 328, 889
- (24) Kharchenko, N. V., Berczik, P., Petrov, M. I., et al. 2009a, A&A, 495, 807
- (25) Kharchenko, N. V., Piskunov, A. E., Röser, S., et al. 2009b, A&A, 504, 681
- (26) Kharchenko, N. V., Piskunov, A. E., Schilbach, E., Röser, S., & Scholz, R.-D. 2012, A&A, 543, A156 (paper I)
- (27) Kharchenko, N. V., Piskunov, A. E., Schilbach, E., Röser, S., & Scholz, R.-D. 2013, A&A, 558, A53 (paper II)
- (28) Michalik, D., Lindegren, L., & Hobbs, D. 2015, A&A, 574, AA115
- (29) Morales, E. F. E., Wyrowski, F., Schuller, F., & Menten, K. M. 2013, A&A, 560, AA76
- (30) Lada, E. A., Strom, K. M., & Myers, P. C. 1993, Protostars and Planets III, 245
- (31) Lamers, H. J. G. L. M., Gieles, M., Bastian, N., et al. 2005, A&A, 441, 117
- (32) Mishurov, Y. N., & Acharova, I. A. 2011, MNRAS, 412, 1771
- (33) Monet, D., Bird, A., Canzian, B., et al. 1998, The USNO-A2.0 Catalogue, U.S. Naval Observatory Flagstaff Station (USNOFS) and Universities Space Research Association (USRA) stationed at USNOFS
- (34) Monet, D. G., Levine, S. E., Canzian, B., et al. 2003, AJ, 125, 984
- (35) Perren, G. I., Vázquez, R. A., & Piatti, A. E. 2015, A&A, 576, A6
- (36) Piskunov, A. E., Kharchenko, N. V., Röser, S., Schilbach, E., & Scholz, R.-D. 2006, A&A, 445, 545
- (37) Piskunov, A. E., Schilbach, E., Kharchenko, N. V., Röser, S., & Scholz, R.-D. 2008, A&A, 477, 165
- (38) Popova, M. E. 2013, Astronomische Nachrichten, 334, 847
- (39) Portegies Zwart, S. F. 2009, ApJ, 696, L13
- (40) Posselt, B., Popov, S. B., Haberl, F., et al. 2007, Ap&SS, 308, 171
- (41) Röser, S., Schilbach, E., Schwan, H., et al. 2008, A&A, 488, 401
- (42) Röser, S., Demleitner, M., Schilbach, E. 2010, AJ, 139, 2440
- (43) Schilbach, E., Röser, S. 2008, A&A, 489, 105
- (44) Schmeja, S., Kharchenko, N. V., Piskunov, A. E., et al. 2014, A&A, 568, AA51 (paper III)
- (45) Skrutskie, M. F., Cutri, R. M., Stiening, R., et al. 2006, AJ, 131, 1163
- (46) Tetzlaff, N., Dinçel, B., Neuhäuser, R., & Kovtyukh, V. V. 2014, MNRAS, 438, 3587
- (47) Vande Putte, D., Garnier, T. P., Ferreras, I., Mignani, R. P., & Cropper, M. 2010, MNRAS, 407, 2109
- (48) Wu, Z.-Y., Zhou, X., Ma, J., & Du, C.-H. 2009, MNRAS, 399, 2146
- (49) Zacharias, N., Finch, C. T., Girard, T. M., et al. 2013, AJ, 145, 44
- (50) Zhu, Z. 2009, Research in Astronomy and Astrophysics, 9, 1285