Influence of interstitial Mn on local structure and magnetism in Mn1+δSb
Abstract
We report x-ray total scattering and pair distribution function (PDF) studies of the structural relaxation around interstitial manganese (Mni) in ferromagnetic Mn1+δSb () alloys, guided by density functional theory (DFT). Refinements to the experimental PDF using a crystallographically constrained structural model indicate an expansion in the equatorial plane of the MniSb5 trigonal bipyramidal site, which introduces significant positional disorder in addition to the nominally-random occupation of interstitial voids. Observation of a weak diffuse signal near the symmetry-forbidden (001) reflection position is indicative of correlated disorder from the clustering of Mni. Density functional relaxation of supercells approximating the , and compositions provides improved models that accurately describe the short-range structural distortions captured in the PDFs. Such structural relaxation increases the DFT calculated moment on Mni, which aligns antiparallel to the primary Mn moments, but leads to insubstantial changes in the average Mn and Sb moments and moments of Mn and Sb proximal to interstitials, thus providing a more accurate description of the observed bulk magnetic properties.
pacs:
75.50.Cc, 61.72.jj, 61.05.cf, 71.15.MbI Introduction
Manganese pnictides of the hexagonal NiAs structure type (e.g. MnAs, Mn1+δSb, MnBi; Figure 1) display a wealth of functional magnetic properties. The class of materials includes potential candidates for rare earth-free permanent magnets,Heikes (1955); Zarkevich et al. (2014) magneto-optical data storage,Williams et al. (1957); Chen et al. (1968); Unger et al. (1972); Bai and Rama Rao (1984) and magnetic refrigeration.Wada and Tanabe (2001); Sun et al. (2008) Manganese antimonide is known to only exist as a manganese-rich phase, Mn1+δSb.Teramoto and Vanrun (1968); Vanyarkho et al. (1988) The wide compositional region shown on the equilibrium phase diagram extends from ,Okamoto (2006) with excess Mn occupying the interstitial site (Figure 1b) in trigonal bipyramidal coordination by Sb. Increasing amounts of interstitial Mn (Mni) lengthen the and shorten the lattice parameters, which accompanies reductions of the saturation magnetization, spin-reorientation temperature (),Reimers et al. (1982); Markandeyulu and Rama Rao (1987); Taylor et al. (2015) and the Curie temperature ().Teramoto and Vanrun (1968); Okita and Makino (1968) Magnetic ordering of the primary Mn sites occurs parallel to at high temperature, but it changes to the plane below .Takei et al. (1963)
Although the bulk magnetic properties are well known, the microscopic nature of the magnetism associated with Mni has been equivocal. A straightforward explanation of the reduced magnetization in more Mn-rich samples is that Mni is aligned antiparallel to the ferromagnetic MnMn atoms, that is, Mn1+δSb is ferrimagnetic. (Here we use Kröger–Vink notation to differentiate interstitial Mni and nominal MnMn atoms.) Nonpolarized neutron diffraction studies are consistent with this expectation.Takei et al. (1963); Okita and Makino (1968); Taylor et al. (2015) However, polarized neutron scattering analyses have suggested that Mni has no moment. Yamaguchi et al. (1976); Yamaguchi and Watanabe (1980); Watanabe and Yamaguchi (1980); Reimers et al. (1983) The reduction of magnetization is then explained on the basis of greater orbital overlap between Mn atoms upon reduction of the lattice constant, and to a local perturbation of the Mn moment when in proximity to Mni.Yamaguchi et al. (1976); Watanabe and Yamaguchi (1980); Yamaguchi and Watanabe (1980); Reimers et al. (1980, 1983)
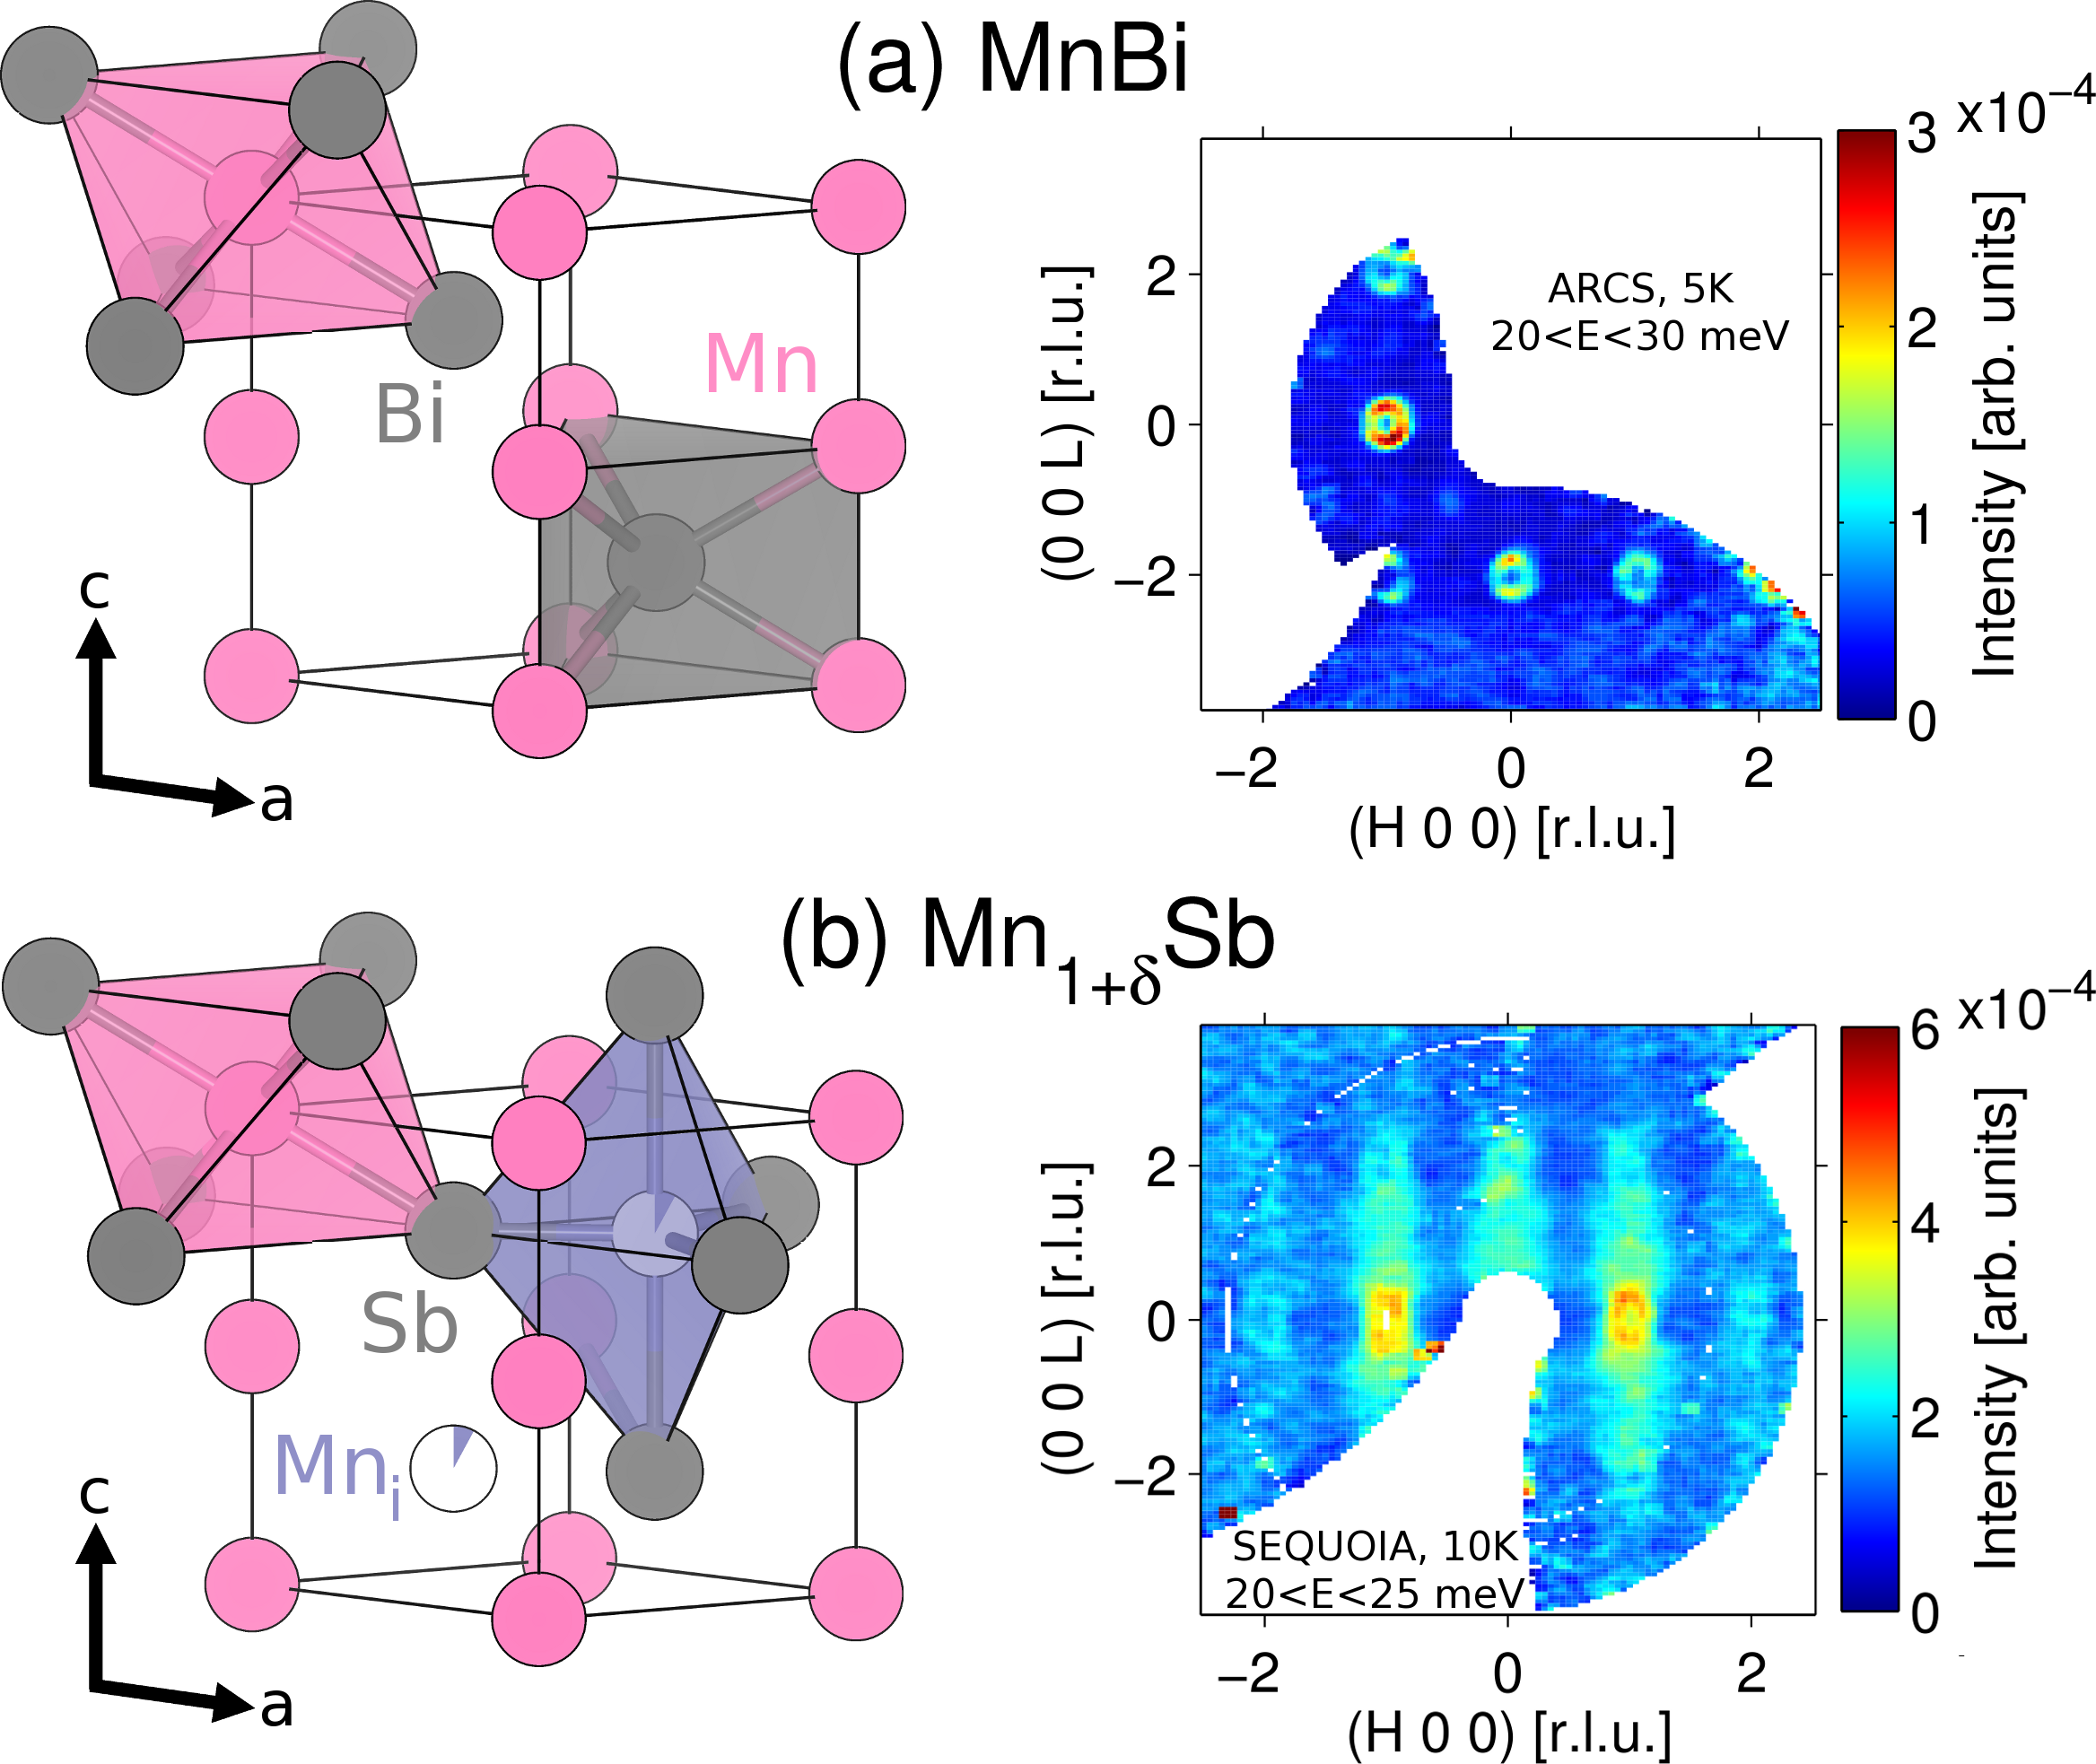
The question of whether Mni carries a moment was recently re-addressed by Taylor et al. via a combination of nonpolarized elastic and inelastic neutron scattering on an Mn1.13Sb single crystal.Taylor et al. (2015) A critical feature of the modeling strategies adopted in previous polarized neutron studies was the use of a highly aspherical magnetic form factor for Mn.Watanabe and Yamaguchi (1980); Reimers et al. (1983) In the recent work of Taylor and co-workers it was shown that such a model provides an inferior description of the magnetic reflections – particularly at low where magnetic scattering is strongest – relative to a model employing a spherical magnetic form factor and antiferromagnetic coupling between Mni and MnMn.Taylor et al. (2015) Density functional calculations enlisting small supercells further supported Mn1+δSb as a ferrimagnet. Additionally, a pronounced and gapless diffuse magnetic component was observed across all temperature regimes in the inelastic spectrum (Figure 1b), centered at (001). Similar or related features have also been noted by other groups.Takei et al. (1963); Radhakrishna and Cable (1996) The location of the diffuse component is intriguing because the (001) reflection should be systematically absent from the structure factor; there is no diffuse scattering observed for stoichiometric (interstitial-free) MnBi (Figure 1a). Two plausible explanations were suggested: the diffuse scattering could arise from () correlated structural or magnetic disorder, or () modification of the neighboring MnMn moments by Mni.Taylor et al. (2015)
An essential feature of the Mn1+δSb system that has been largely unaccounted for, both experimentally and computationally, is the local structure around Mni. It has long been recognized that the equatorial Mni–Sb contacts of the crystallographic Mni site in the Mn1+δSb unit cell are quite short.Yamaguchi and Watanabe (1980); Coehoorn et al. (1985) However, few studies have attempted to model the presumed structural relaxation.Yamaguchi and Watanabe (1980); Taylor et al. (2015) Yamaguchi and Watanabe approximated that Mni would be accommodated by distortions of only the Sb positions, the magnitude of the local displacements being derived from the concentration dependence of the lattice parameters.Yamaguchi and Watanabe (1980) This assumption was used in their analysis of polarized neutron diffuse scattering data. Models with no Mni moment, but containing reduced moments on the first or second nearest-neighbor Mn atoms in proximity to Mni, were compared against calculated scattering for a model with Mni aligned antiparallel. Although the best agreement was obtained for a reduction of the six nearest-neighbor Mn moments, an aspherical Mn magnetic form factor appears to have contributed to the result.Watanabe and Yamaguchi (1980); Yamaguchi and Watanabe (1980)
The utility of density functional modeling in describing local structural effects and defect physics is well demonstrated. A variety of approaches can be used to simulate defects (substitutional, interstitial, antisite, vacancy) and random alloying, the validity of which is reflected in agreement with a variety of experimental probes of local bonding arrangements, including nuclear magnetic resonance (NMR),Blanc et al. (2011); Buannic et al. (2012); Dervisoglu et al. (2014) extended x-ray absorption fine structure (EXAFS),Grinberg et al. (2002); Grinberg and Rappe (2004); Grinberg et al. (2004); Levin et al. (2011) and pair distribution function (PDF) data obtained from total scattering. Li et al. (2007); Page et al. (2007); White et al. (2010a, b); Kalland et al. (2013) When the concentration of defects is low, an effective strategy is to model a defect in a sufficiently large supercell such that the defect is approximately isolated (i.e., limiting the interaction between defects when periodic boundary conditions are applied).Van de Walle and Neugebauer (2004) At higher levels of substitution, the creation of models on the basis of chemically reasonable, ordered supercells can be an elegant strategy to assess plausible bonding motifs.Li et al. (2007); Page et al. (2007) Random alloys are inherently challenging systems to model in the framework of density functional theory (DFT), since even large supercells will necessarily contain elements of periodicity that are absent in a truly random structure, but strategies such as stochastic mixing and the special quasirandom structures approach often provide adequate approximations.Zunger et al. (1990); Wei et al. (1990); Levin et al. (2011); Voas et al. (2014) Mn1+δSb can be regarded as a type of random alloy, with a distribution of interstitials and vacancies over the crystallographic Mni site.
In the present contribution, we examine local structural relaxation in Mn1+δSb using synchrotron x-ray total scattering and PDF analysis coupled with density functional modeling. The use of x rays rather than neutrons allows us to base our analysis on the local nuclear structure without interference from magnetic scattering. Particular attention is devoted to the Mni environment and its calculated magnetic moment, as well as the compositional and structural influence on the moment of ferromagnetically aligned MnMn. Structural relaxation has a pronounced effect on the Mni environment and enhances electronic localization by a lengthening of equatorial Sb contacts, but it does not appear to influence the moments on MnMn or Sb. A weak diffuse signal is observed near the symmetry-forbidden (001) Bragg position, suggestive of correlated disorder associated with clustering of Mni. These results are discussed in light of the recent work of Taylor et al.Taylor et al. (2015)
II Materials and Methods
II.1 Preparation of Mn1+δSb
The series of polycrystalline Mn1+δSb ( 0.23) samples were prepared in alumina crucibles from the elements (Mn flake, NOAH Technologies Corporation, 99.99 %; Sb shot, Alfa Aesar, 99 %). Antimony was recrystallized before use, and surface oxide was removed from Mn by heating overnight in an evacuated fused silica tube at 980 ∘C. Appropriate stoichiometric mixtures sealed in evacuated silica tubes were melted at 930 ∘C for 16 h and then quenched in water. The obtained ingots were finely powdered in an agate mortar and pressed into pellets, then annealed under vacuum at 700 ∘C for 48 h and water-quenched.
II.2 Characterization
Magnetization measurements were performed with a vibrating sample magnetometer on a Quantum Design, Inc. Dynacool PPMS. Room-temperature x-ray powder diffraction and x-ray total scattering measurements were conducted at the Advanced Photon Source of Argonne National Laboratory.
High-resolution synchrotron x-ray powder diffraction patterns were collected at the 11-BM-B beamline using an x-ray energy of about 30 keV ( Å).Lee et al. (2008); Wang et al. (2008); Toby et al. (2009) Samples were diluted with amorphous SiO2 to reduce the effects of absorption. Rietveld analyses were performed within the gsas/expgui suite.Larson and Von Dreele (2000); Toby (2001)
X-ray total scattering measurements were performed at the 11-ID-B beamline. Data were collected with an amorphous silicon area detectorChupas et al. (2007) using two x-ray energies, keV ( Å) and keV ( Å), at sample-to-detector distances of approximately 17 cm and 19 cm, respectively. Calibrations were performed by measurement of a CeO2 standard at each condition. The electron density pair distribution function, , was obtained from background-subtracted scattering data by the ad-hoc approach applied in PDFgetX3.Juhas et al. (2013) The reduced scattering structure function, , was transformed to using a maximum momentum transfer of Å-1 for data collected at 58 keV, and Å-1 for data collected at 86 keV. A powdered nickel standard was used to determine the resolution truncation parameters and used in PDFgui refinements.Farrow et al. (2007) Reverse Monte Carlo (RMC) simulations were conducted using the RMCprofile software,Tucker et al. (2007) with models constrained to fit and to capture both long- and short-range order. A “closest approach” constraint of 2.2 Å was applied to all atomic species to prevent the fitting of termination ripples in the low region of the PDF. Simulated diffraction patterns were computed using the DIFFaX software;Treacy et al. (1991) input files are provided in the supplemental material.
II.3 Computational Details
Density functional theory (DFT) calculations were performed using the Vienna ab-initio simulation package (VASP),Kresse and Hafner (1994) with interactions between the cores (Mn:[Ar], Sb:[Kr]4d10) and valence electrons described using the projector augmented wave (PAW) method.Kresse and Joubert (1999) Calculations were performed within the generalized gradient approximation (GGA) using the functional of Perdew, Burke, and Ernzerhof (PBE)Perdew et al. (1996) to account for the effects of exchange and correlation. An energy cutoff of 350 eV and a -centered -point sampling were employed for all calculations. Since PDF analysis is a measurement of the ensemble average of all pairwise correlations in a sample, a series of 10 distinct initial supercell configurations were constructed for each of three compositions, Mn48(Mni)4Sb48, Mn48(Mni)7Sb48, and Mn48(Mni)11Sb48 (where Mni denotes interstitial manganese), which respectively provide compositions close to Mn1.08Sb, Mn1.15Sb, and Mn1.23Sb. Parent Mn48Sb48 supercells were built from orthonormal -centered orthorhombic supercells of the conventional crystallographic lattice, with dimensions reflecting the lattice constants obtained by Rietveld refinement. Interstitial Mn positions were selected stochastically with the aid of RMCprofileTucker et al. (2007) by filling all of the interstitial positions with Mn or vacancy (dummy) atoms and distributing Mni by performing short simulations in which Mni atoms were “swapped” with vacancy atoms; simulations lasting 6 seconds typically produced 50,000 atom swap moves, leading to a robust ensemble of starting structural configurations. Relaxations of the supercells were performed at fixed cell dimensions, allowing only the atomic positions to change, and they were deemed to have converged when the forces on all ions were less than 0.01 eV Å-1. All calculations were performed with spin polarization, using starting spin configurations in which Mni was aligned antiparallel to Mn. For select configurations, test calculations were performed with an on-site Coulomb repulsion term on Mn (GGA+), or with spin–orbit coupling; neither the inclusion of a Hubbard nor the effects of the spin–orbit interaction produced any qualitative changes to the results discussed below.
III Results and discussion
III.1 Crystallographic analyses and bulk magnetic properties
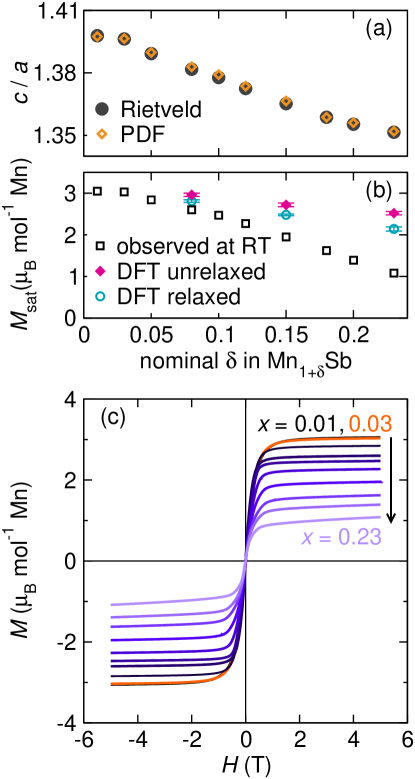
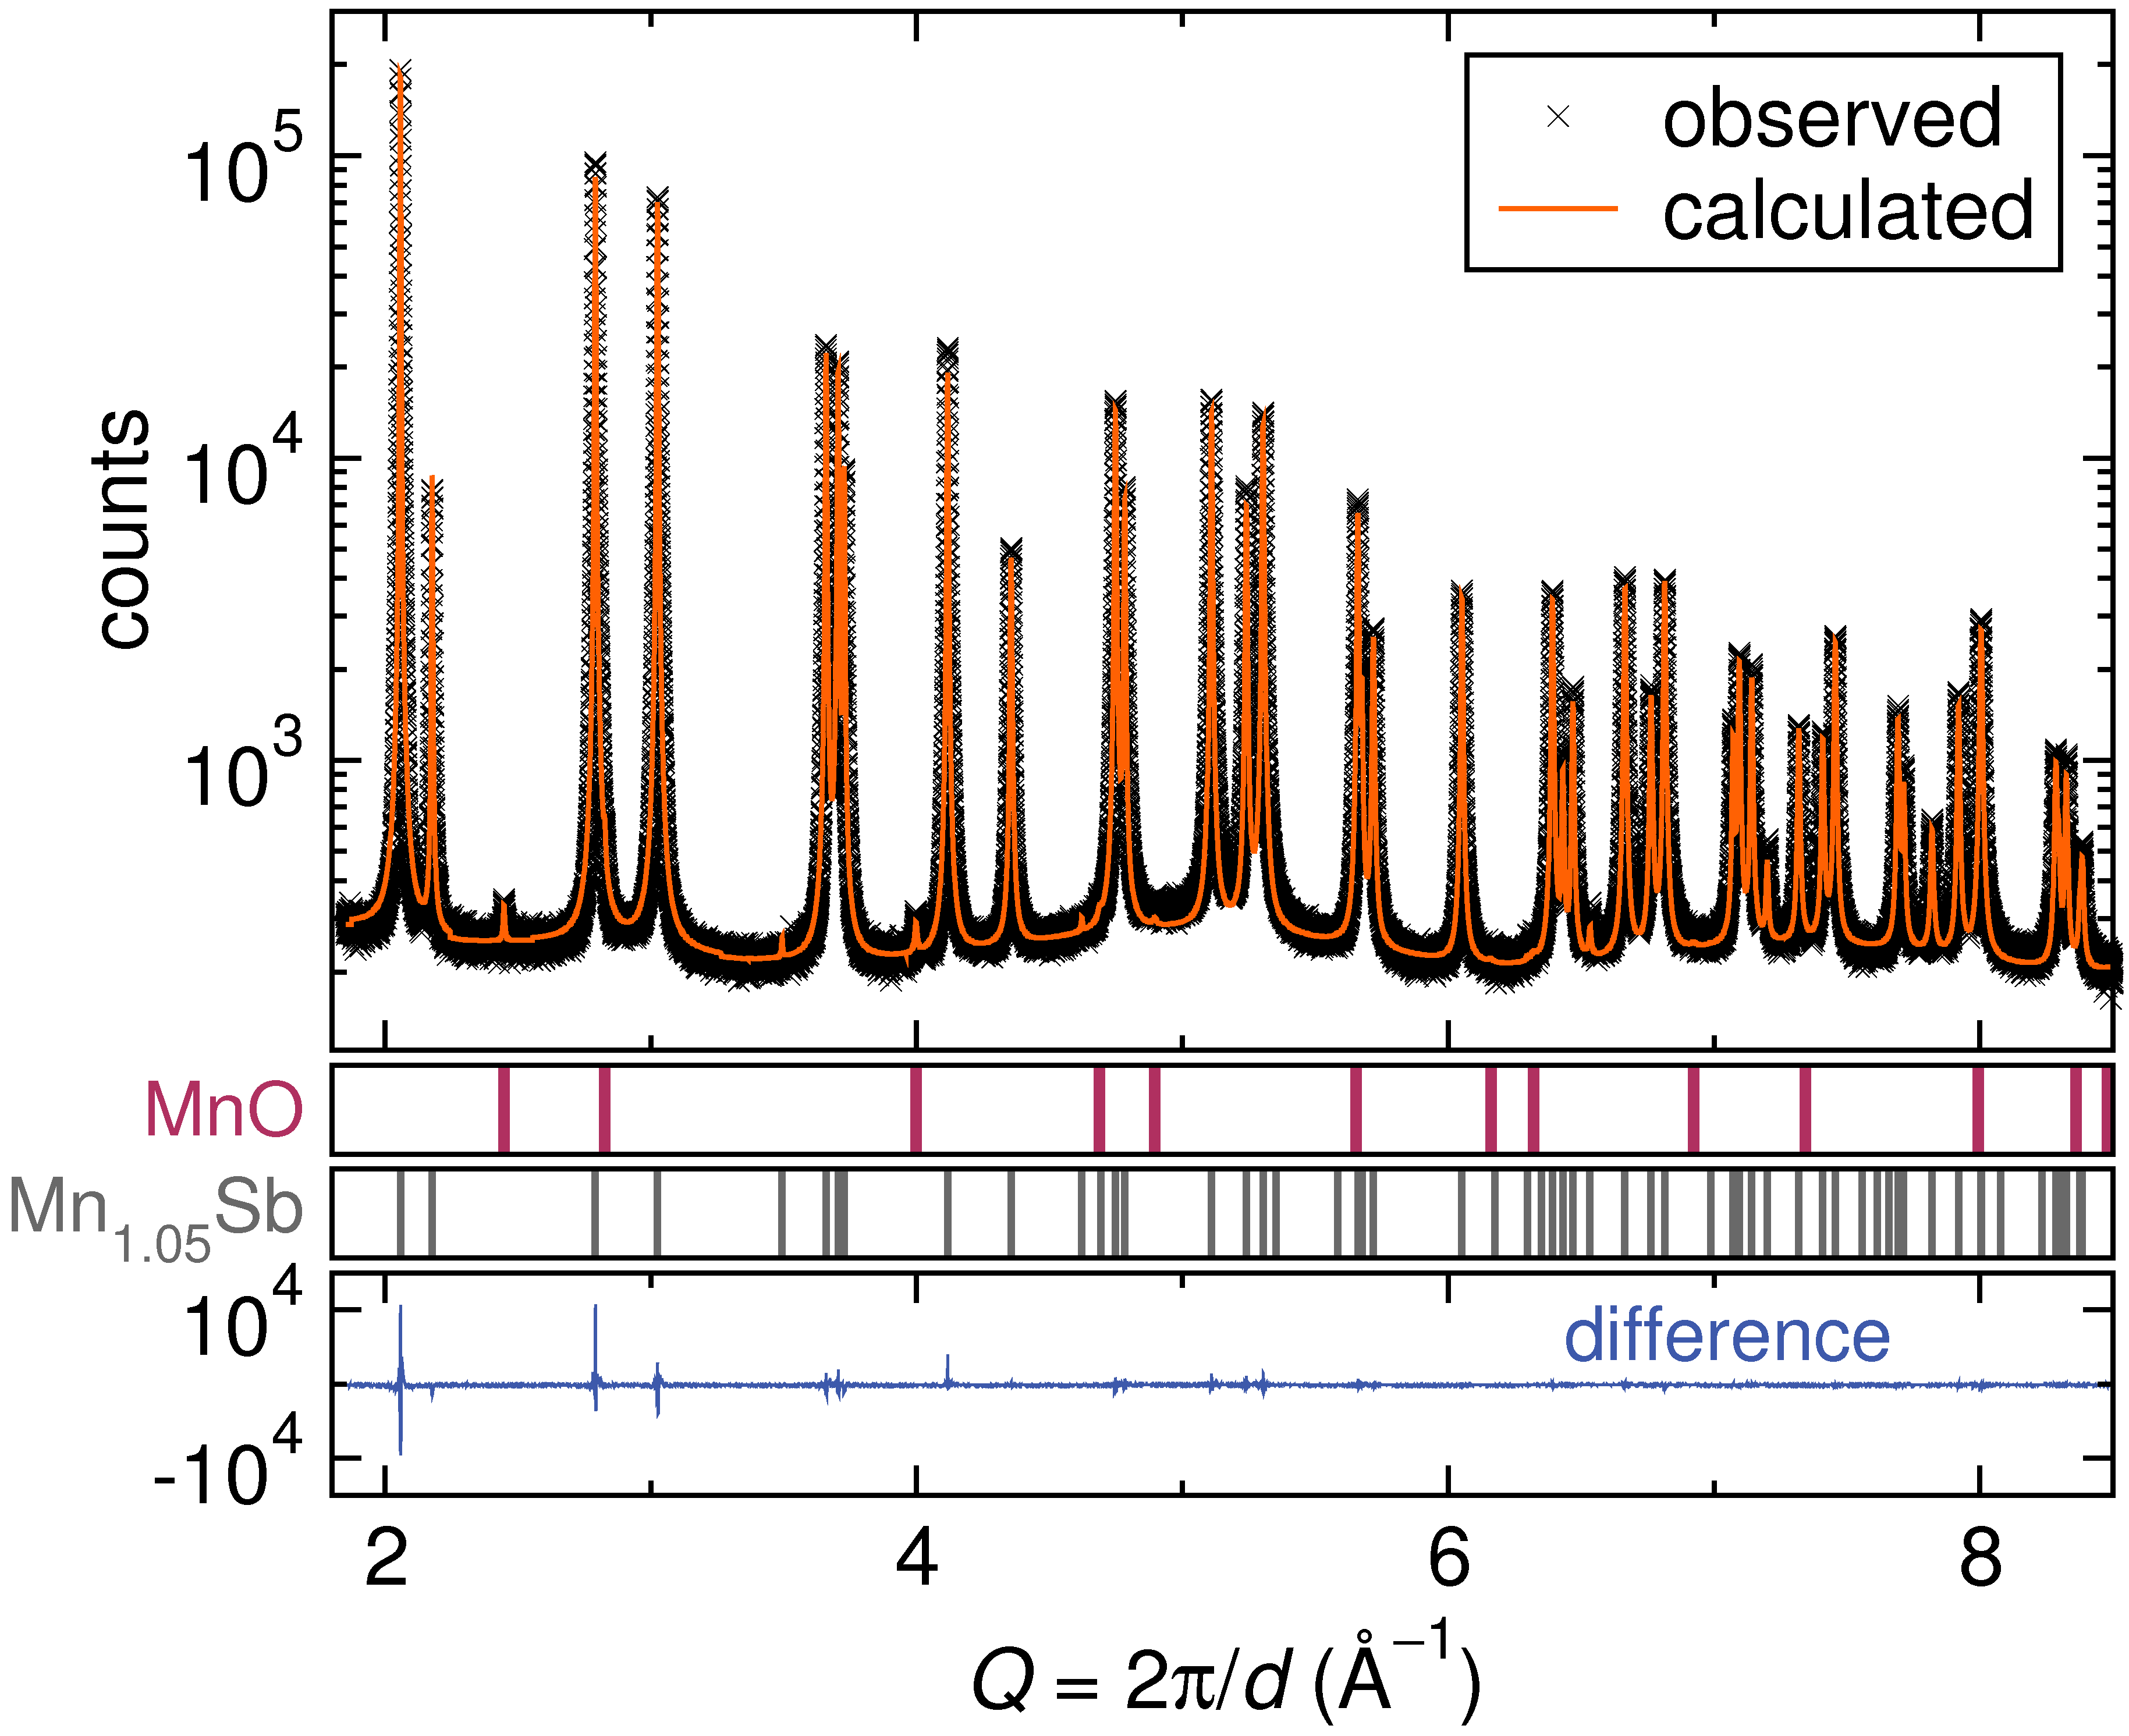
The series of Mn1+δSb samples () span approximately the entire compositional range and display Végard law behavior of the lattice parameters between , as shown by the linear trend in ratio as a function of , Figure 2a. Small deviations from linearity are noted for the nominally and compositions, indicating proximity to the phase boundary extrema. The sample contains a small amount of antimony metal ( wt. %), and all of the samples contain small impurities of MnO, estimated by quantitative phase analysis to be wt. %. There is no evidence of an Mn2Sb impurity in the Mn1.23Sb sample, suggesting the solubility limit had not been reached. Axial ratios obtained from Rietveld refinements of high-resolution synchrotron x-ray diffraction data (11-BM) agree very closely with the ratios obtained from real-space refinements of PDF data. A representative Rietveld refinement is presented in Figure 3 for the sample, and a complete list of refined values for both Rietveld and PDF refinements is given in Table SM-1. The Mni occupancies estimated by Rietveld refinement agree well with the nominal stoichiometries across the range, with estimated errors in the site occupancy of 0.01. Fractionally occupied Mni has a site multiplicity of 2 (Wyckoff position 2) in the crystallographic model, but this does not imply that interstitial atoms necessarily occur in pairs in a given unit cell of the “real” material. Consider that for there is only one Mni for every 10 unit cells [i.e. Mn20(Mni)1Sb20]: although the crystallographic cell indicates that Mni populates both sites of the 2 position on average, it is quite conceivable that interstitial atoms are present locally in just one of the two interstitial voids.
Room-temperature saturation magnetizations (Figure 2b), taken from the room-temperature hysteresis curves shown in Figure 2c, decrease linearly as the quantity of interstitial Mn increases. Magnetization curves of the and samples are nearly overlaid, which is consistent with their comparable ratios and values obtained by Rietveld refinement.
In general, PDFs of the Mn1+δSb series are well described by the conventional crystallographic cell (constrained by space-group symmetry), particularly at low concentrations of Mni where there is limited sensitivity to its pair correlations. Real-space refinements (PDFgui) over the 2–30 Å range for Mn1.03Sb, Mn1.12Sb, and Mn1.23Sb are shown in Figure 4a, and they are representative of fit quality across the complete series of samples (Figure SM-1). These fits worsen as a function of increasing in the low region of the PDFs, but beyond about 5 Å the crystallographic structures provide very satisfactory fits to the data. In fact, for samples containing up to 10 % Mni, better statistical agreement is consistently obtained in refinements over the 6 to 30 Å range with a Mn1.00Sb model (i.e., without Mni) than for Mn1+δSb models containing partially occupied Mni.
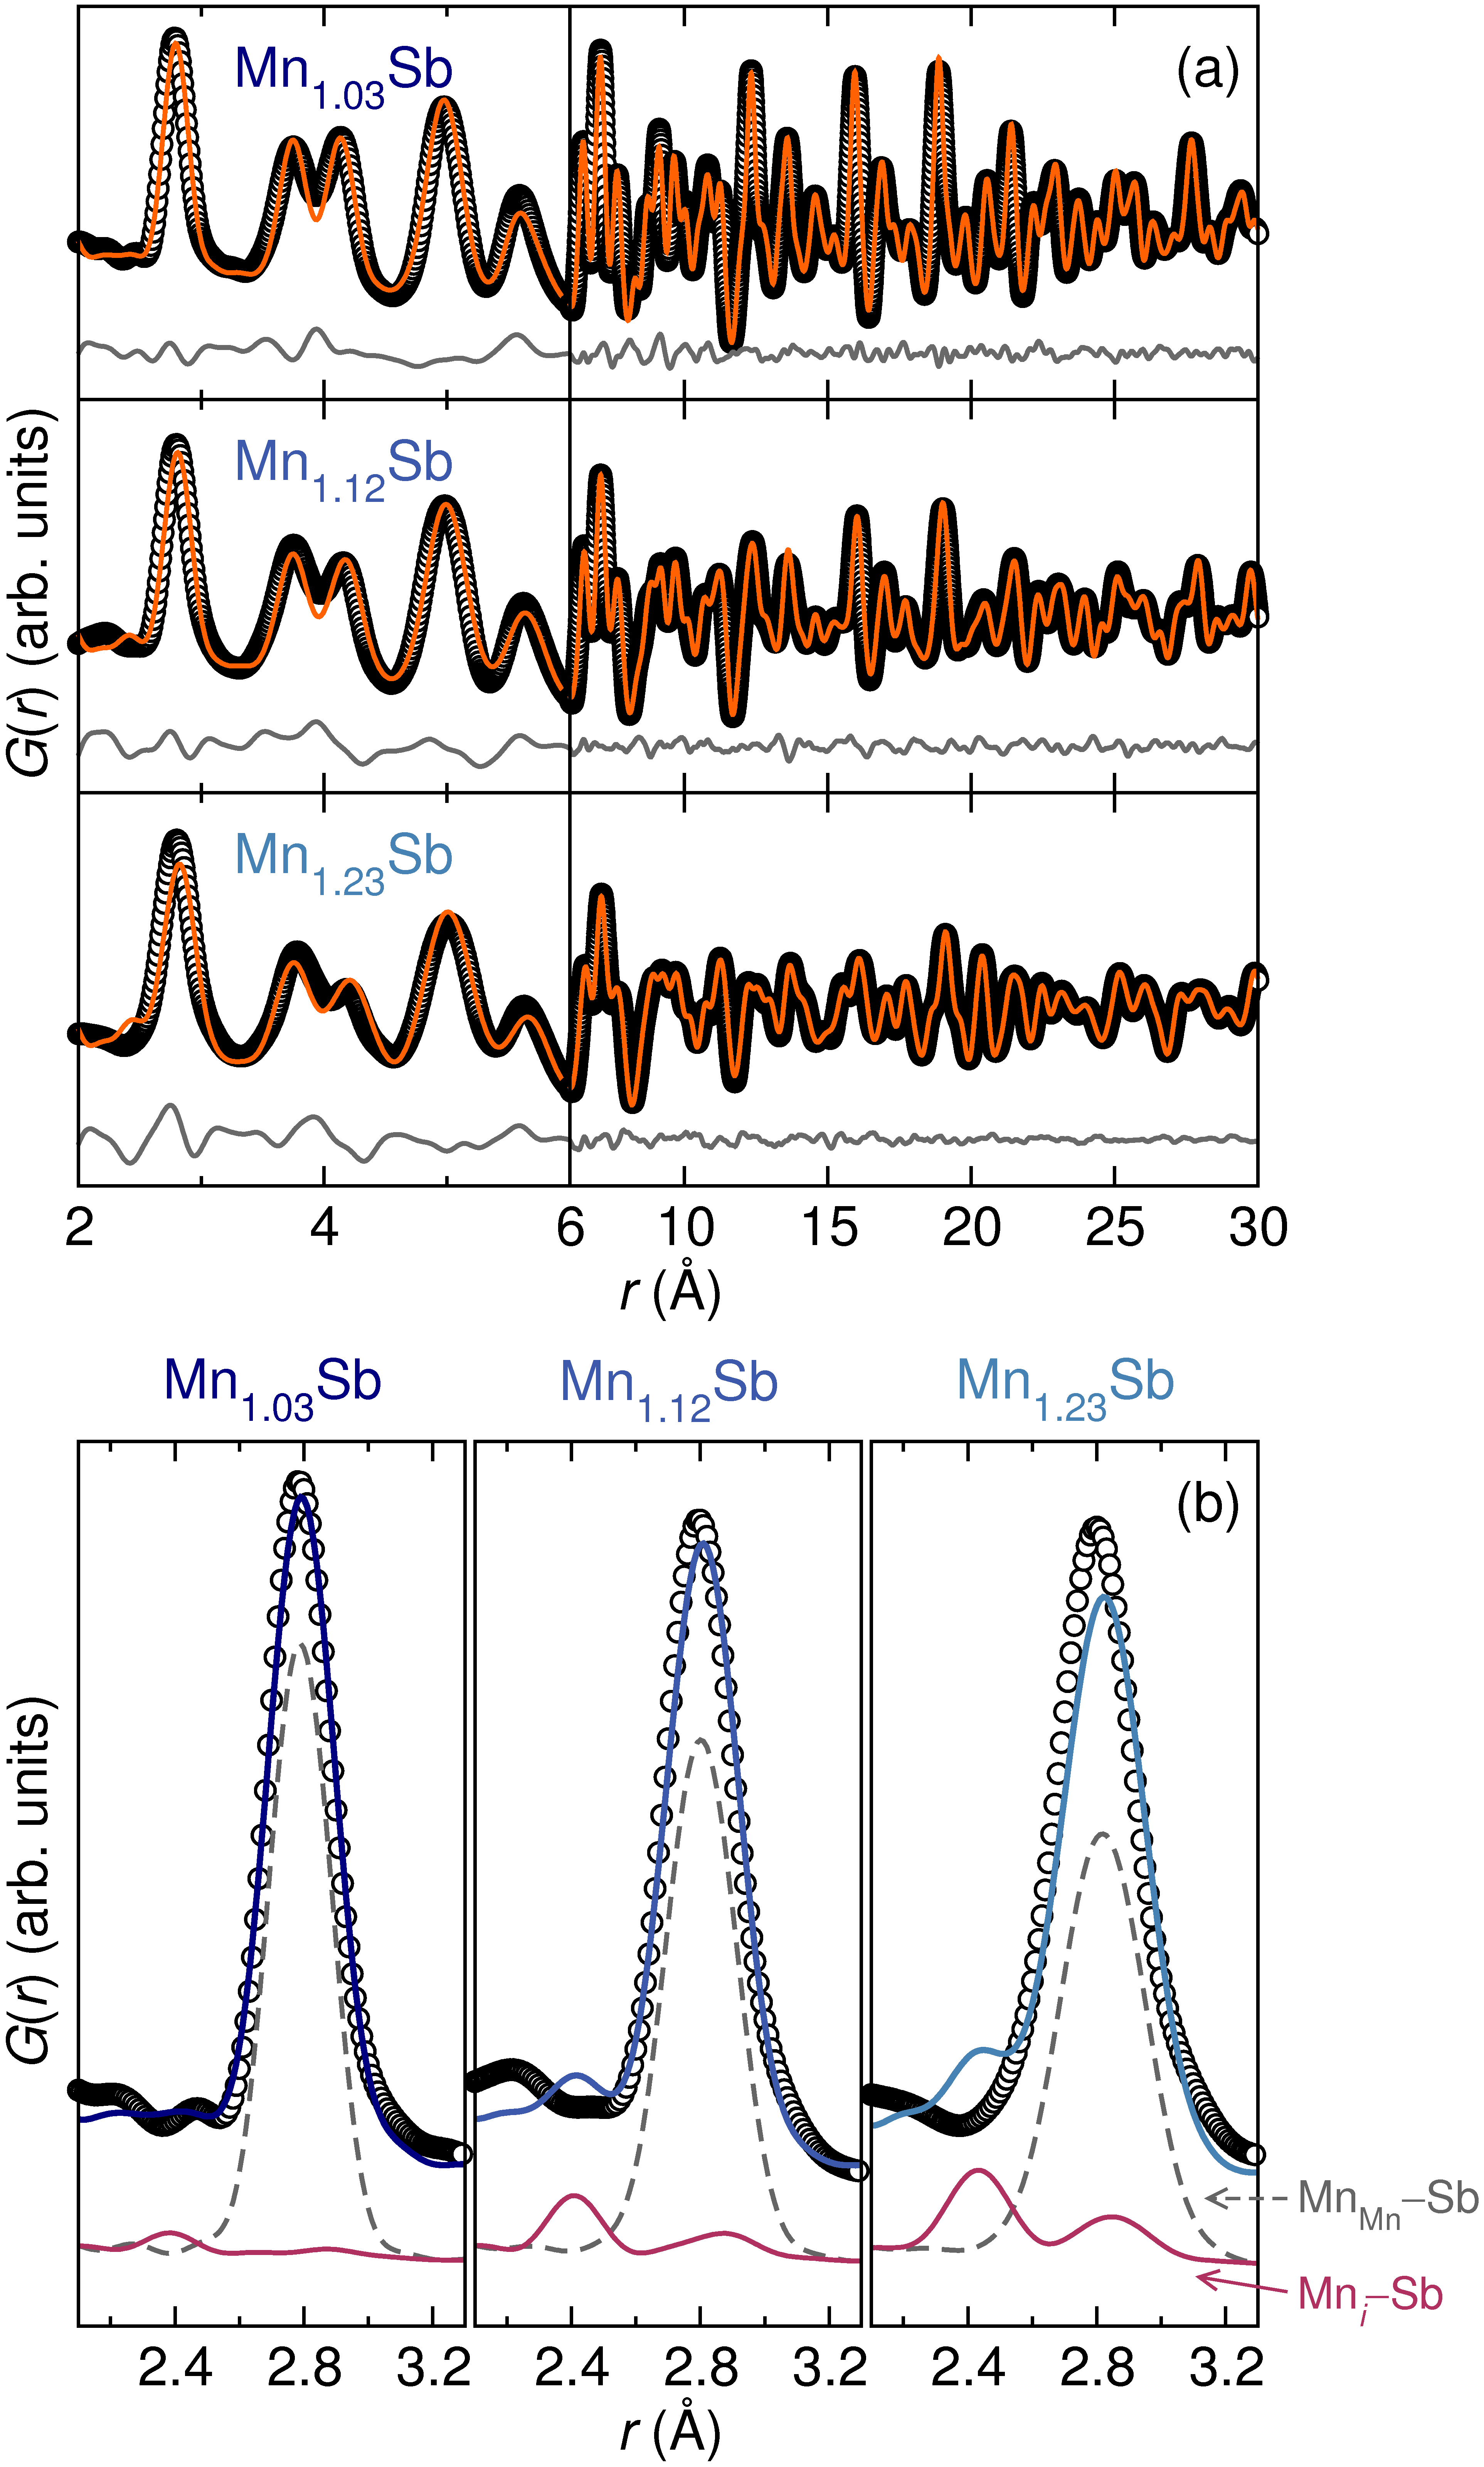
The corresponding first nearest-neighbor peaks, comprising contributions from MnMn–Sb, Mni–Sb and Mni–MnMn, are highlighted in Figure 4b; the PDF partials for MnMn–Sb and Mni–Sb pair correlations are shown below in dotted and solid lines, respectively. For clarity, MnMn–Mni partials are not shown as these contribute very weakly at the same distances as MnMn–Sb. The crystallographic model predicts contributions at approximately 2.4 Å, although none are observed experimentally; this intensity is derived from equatorial Mni–Sb correlations of the Mni trigonal bipyramid. The absence of observed intensity at this distance in is evidence that structural relaxation occurs either by or around interstitial atoms, which is also reflected in the poorer description of peak intensity and breadth for the more Mn-rich samples. This result is quantitatively consistent for the PDFs obtained from total scattering with two different x-ray wavelengths. This feature is also robust considering the Nyquist sampling frequency dictated by (Figure SM-2).Farrow et al. (2011) Comparing the crystallographic structural model against the observed data indicates that the equatorial Mni–Sb contacts are longer in the “real” material than reflected by the crystallographic cell. Qualitatively, a bond-lengthening around Mni would be expected to increase electron localization and its magnetic moment.Anderson (1961) The ability to directly inspect PDF data and infer plausible structure–property relations is an indisputable asset of the technique. However, a more rigorous modeling approach is required to support and reconcile the impact of structural relaxation on the properties of Mn1+δSb.
III.2 DFT: unifying local structure and magnetic properties
A series of density functional calculations were performed to assess relaxation by and around interstitial atoms in Mn1+δSb. To account for the disorder inherent to this system, a collection of 10 distinct supercell configurations was created for each of three compositions selected from the compositional range. All configurations are based on 96 atom MnSb supercells, with Mn48(Mni)4Sb48, Mn48(Mni)7Sb48, and Mn48(Mni)11Sb48 formulas chosen to provide compositions close to Mn1.08Sb, Mn1.15Sb, and Mn1.23Sb. The positions of Mni in the supercell configurations were selected stochastically. Representative structural depictions of one configuration for each composition are shown in Figure 5.
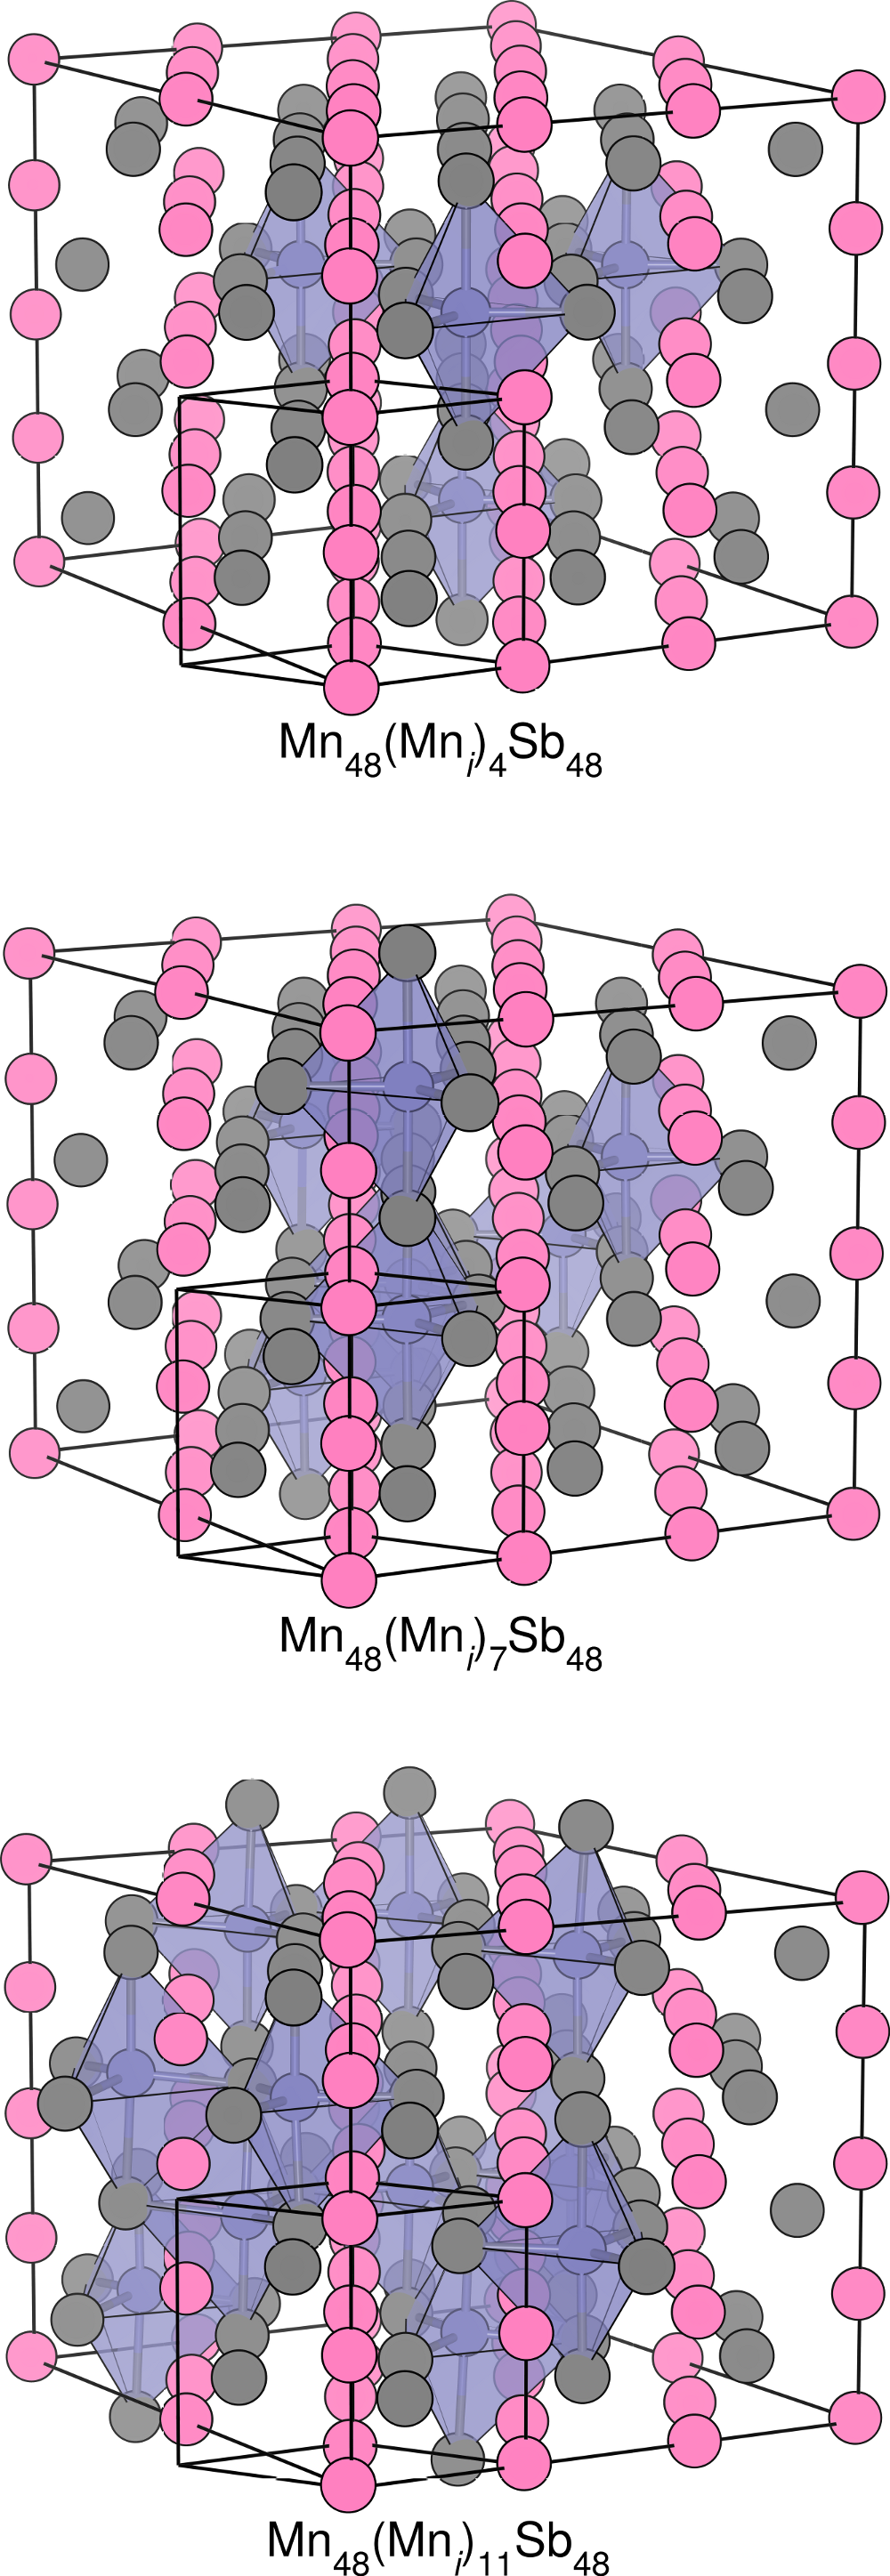
To facilitate comparison with the PDF data, supercells for a given composition were constrained to dimensions commensurate with the experimentally determined unit-cell parameters.
All of the PDFs for different configurations of a given composition are very similar (Figure SM-3), and differences are far less significant than termination artifacts introduced in the Fourier transform of . A comparison of fits at short to the PDF of Mn1.23Sb for the crystallographically-constrained structure (unit-cell model) versus a representative Mn48(Mni)11Sb48 supercell is shown in Figure 6a. DFT relaxation provides a clear improvement in the description of , reflected in the marked reduction of ; for fits over the range 2 to 6 Å the average -factor for all 10 configurations is 13(1) %, whereas % for the crystallographic structural model. Statistical improvement with the Mn48(Mni)7Sb48 DFT relaxed structures is also found for fits against the Mn1.15Sb PDF data (not shown), with % versus %. On the other hand, relaxed Mn48(Mni)4Sb48 configurations are marginally worse than the crystallographic structure, statistically, in fits against the Mn1.08Sb data ( % vs. %), but this most likely reflects limited sensitivity to Mni correlations for this composition. Indeed, refinement of a Mn1.00Sb unit-cell model against the Mn1.08Sb data provides a better statistical fit ( %) than such a model with partially occupied Mni.
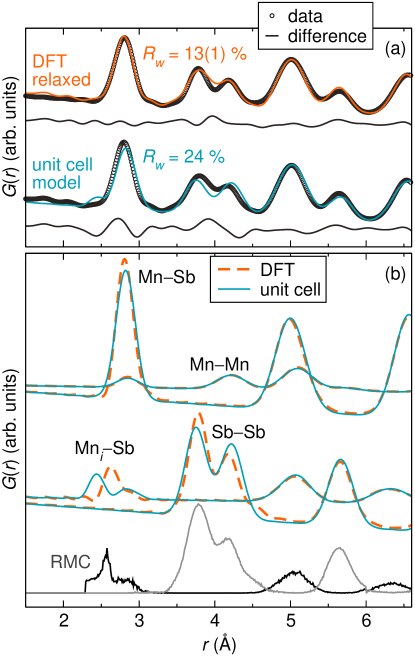
Select atom-pair partials for the crystallographic Mn1.23Sb structure and relaxed Mn48(Mni)11Sb48 supercell are shown in Figure 6b. The only pronounced differences occur for Mni–Sb and Sb–Sb pair correlations, with MnMn–Sb and MnMn–MnMn partials being notably very similar for the relaxed and unit cell models. As anticipated, equatorial Mni–Sb correlations are clearly shifted to longer in the DFT-relaxed model. Differences in the Sb–Sb correlations of the models indicates that the antimony sublattice experiences the largest disruption upon incorporation of Mni. PDF partials for Mni–Sb and Sb–Sb correlations obtained from reverse Monte Carlo simulation (bottom of Figure 6b) agree well with those obtained by DFT, lending additional support to our approach.
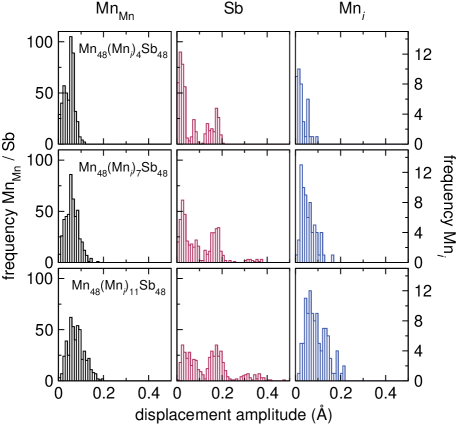
Histograms displaying the amplitudes of atom displacements away from their crystallographic (average) structural positions upon DFT relaxation are shown in Figure 7, arranged by site, and combined for all 10 supercell configurations of each composition. The MnMn and Mni sites show unimodal distributions extending to roughly 0.1, 0.15, and 0.2 Å, respectively, from lowest to highest Mni content. The approximately bimodal Sb histograms show displacements about twice as large for a given composition, with a third region of lower frequency but larger amplitude displacements observed for the Mn48(Mni)7Sb48 and Mn48(Mni)11Sb48 configurations associated with Sb that have more than one nearest-neighbor Mni. All of the larger amplitude Sb displacements ( Å) correspond to equatorial Mni–Sb distances, whereas the displacement of axial Sb atoms is typically Å. Despite the large degree of relaxation displayed by Sb atoms, the local distortions necessary to accommodate Mni induce very minimal changes in the MnMn–Sb and MnMn–MnMn bond distance distributions (Figure 6b), which are preserved because of cooperative distortions by MnMn. This suggests that relaxation should have a much more pronounced effect on the electronic environment of Mni than on either MnMn or Sb.
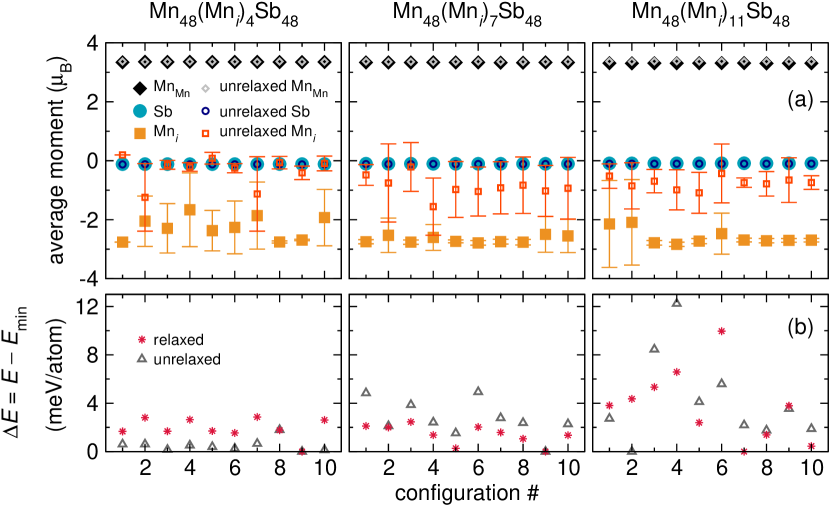
The average calculated moments of the MnMn, Sb, and Mni sites in the DFT relaxed supercells, along with the corresponding moments of unrelaxed supercells, are shown in Figure 8a. All 10 configurations are shown for each composition, but there is no relation between configurations of the same number for different compositions. It is immediately apparent that the moments on MnMn and Sb are insensitive and effectively invariant with respect to the different compositions, the different configurations, and also to structural relaxation. For the MnMn and Sb sites, the standard deviations of the average moments are much smaller than the symbols. The average moment on Mni, however, is consistently of smaller magnitude in unrelaxed configurations than the average Mni moment in relaxed supercells, but it is generally opposite in sign to that of MnMn. This is reflected in a smaller net magnetization for relaxed structures (Figure 2b). For many of the supercells, including both relaxed and unrelaxed structures, there is considerable variability in the individual moments of Mni sites, indicated by the error bars which show the standard deviation of the averages. The individual moments for each Mni site in each configuration are shown in Figure SM-4 of the supplemental material. The configuration coordinates are also supplied therein.
Types of variability in the Mni moments found in individual configurations include the following: (a) sites in relaxed configurations that remain antiparallel but with decreased magnitude of the moment, (b) sites in relaxed configurations with appreciable magnitude that display parallel alignment with respect to MnMn, (c) sites in unrelaxed configurations that are antiparallel and of significantly greater magnitude than the average moment, and (d) sites in unrelaxed configurations that have sizable moments and parallel alignment with MnMn. What is surprising about this result is that variability in the Mni moments does not necessarily appear to be associated with an energetic penalty. The energies of the relaxed configurations relative to the lowest energy (most stable) relaxed configuration for a given composition are shown in Figure 8b; the same comparison is also shown for unrelaxed configurations (relative to the most stable unrelaxed configuration). For example, configurations #9 are (coincidentally) the lowest energy structures for both Mn48(Mni)4Sb48 and Mn48(Mni)7Sb48, including both the unrelaxed and relaxed supercells. Configuration 9 of Mn48(Mni)4Sb48 is seemingly well-behaved, with large antiparallel moments in the relaxed structure, and small antiparallel moments in the unrelaxed structure. In configuration 9 for Mn48(Mni)7Sb48, on the other hand, one of the Mni sites in the relaxed structure has a significantly smaller (still antiparallel) moment, and two of the sites in the unrelaxed structure have notably larger moments than the average.
Similarly, there are other configurations for each composition that contain substantial variability in the individual Mni moments but are lower energy structures than configurations with far less variability. In the case of the relaxed supercells, decreased moments are associated with shorter Mni–MnMn and Mni–Sb distances (Figure SM-5). This is consistent with the general observation that the Mni moments are smaller in unrelaxed supercells. It does not explain why some of the individual moments are large in the unrelaxed structures; however, it is conceivable that the observed variations result from the imposed periodicities. Nevertheless, the general trends in the MnMn, Sb, and Mni moments should not be affected significantly.
III.3 Diffuse scattering and correlated disorder of Mni
We now return to the question of the diffuse magnetic scattering observed at the nominally systematically absent (001) position in the recent report by Taylor and co-workers (reference Taylor et al., 2015). The signal was observed at the lowest energies accessible in the inelastic experiment ( meV), but the presence or absence of an associated elastic diffuse signal could not be determined.Taylor et al. (2015) As noted by the authors, the observation of scattering intensity at this location – regardless of whether it is elastic or inelastic – implies symmetry breaking between the upper and lower portions of the unit cell along the axis. Such breaking could be induced if some MnMn are antiferromagnetically aligned along (which would double the magnetic unit cell), but both our work and theirs indicates that this is highly improbable. An alternative situation that would break the symmetry is the local population of Mni in only one of the two interstitial voids of a unit cell, which removes the reflection condition. This latter possibility, where interstitial atoms do not necessarily occur in pairs in a given unit cell, was introduced earlier in the discussion of Rietveld refinements (Section III A).
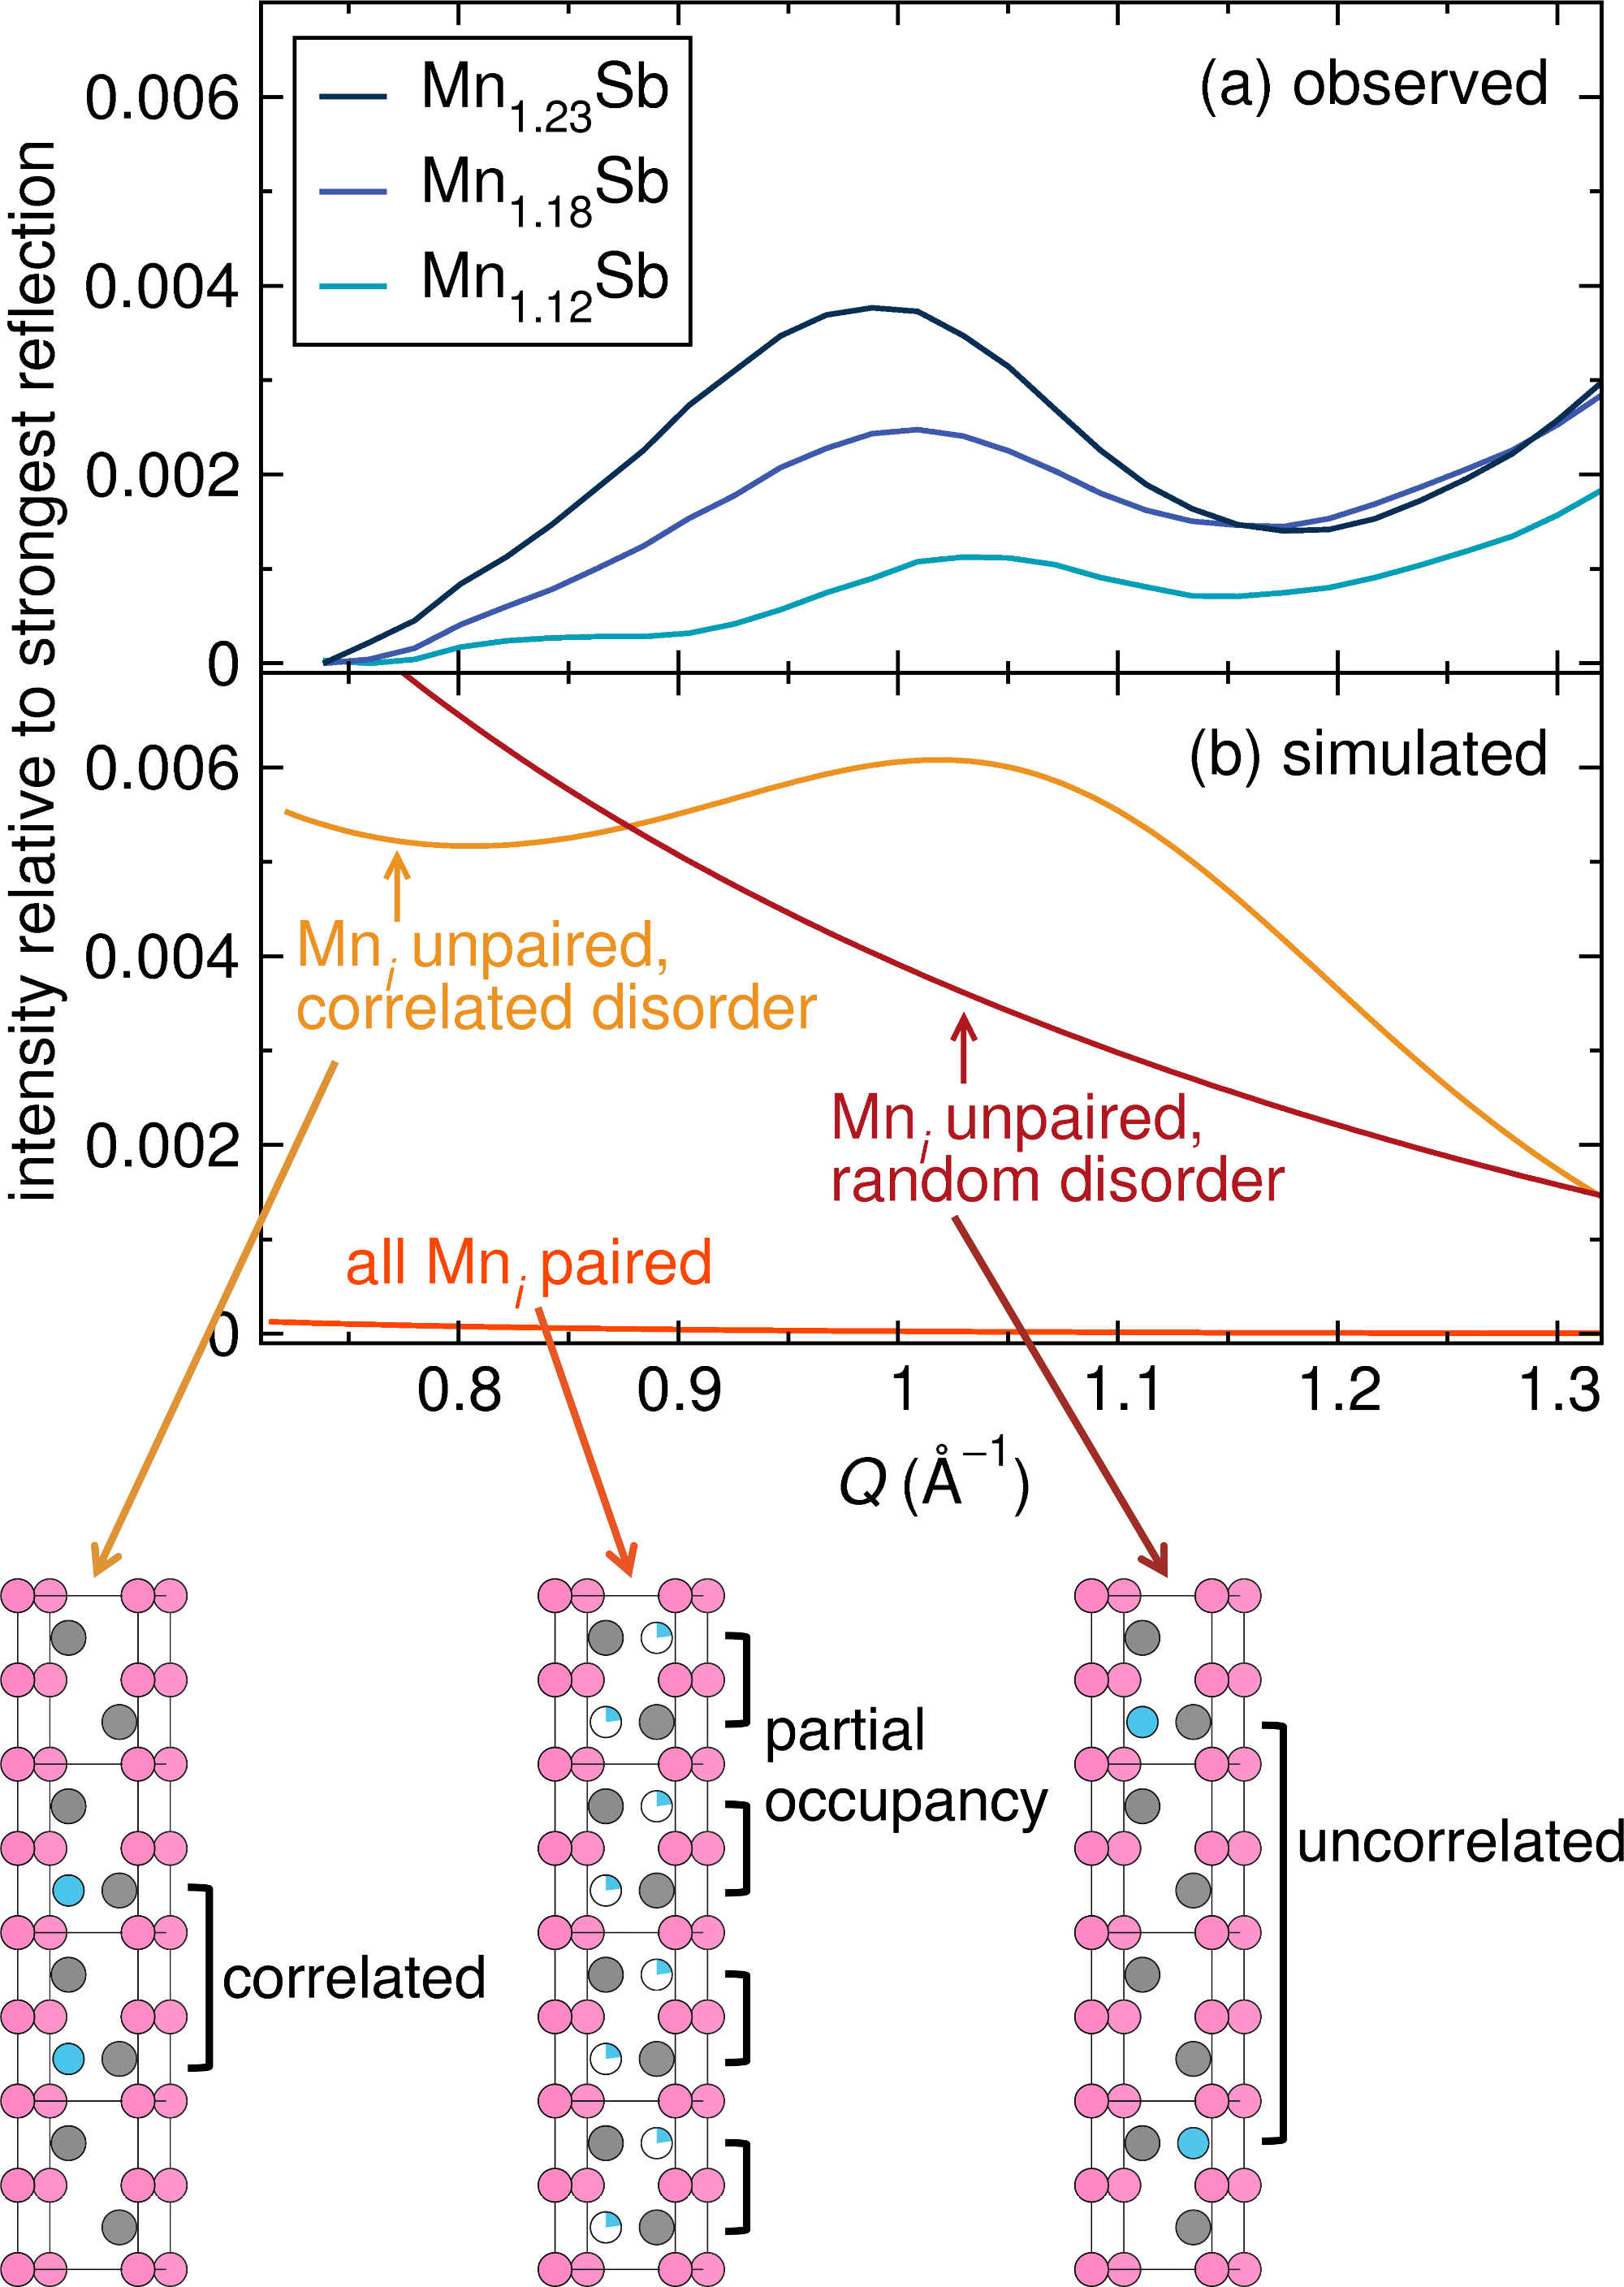
Close examination of our x-ray scattering data reveals a weak diffuse component on top of the systematically absent (001) reflection that is suggestive of correlated structural disorder. In Figure 9a we present the low- region of x-ray diffraction patterns for three Mn1+δSb samples (, , and ), from which the container scattering has been subtracted. Scattering intensities have been normalized to the most intense peak in the x-ray diffraction pattern of Mn1+δSb [i.e. the (101) reflection]. The intensity of the diffuse signal increases with , and the maxima of the diffuse features are all observed at lower (larger -spacing) than the center of the (001) reflection on the basis of the lattice constant. A shift of diffuse scattering maxima away from the associated Bragg positions is commonly observed in situations of local structural dilation or contraction.Dederichs (1971)
A series of simulations are presented in Figure 9b that offer support to the hypothesis that the diffuse signal at low arises from correlated structural disorder associated with “unpaired” Mni, that is, occupation of just one of the interstitial sites in a unit cell. Diffraction patterns were generated with the DIFFaX softwareTreacy et al. (1991) – which explicitly computes the incoherent intensity contribution to a given reflection – for structures comprising random and correlated stacking variations of discrete layers. All simulations were conducted on the basis of the Mn1.23Sb stoichiometry and cell dimensions.
As a control DIFFaX simulation, a single-layer Mn1+δSb model containing partially occupied Mni in both of the interstitial sites was considered. This model is designated “all Mni paired” in Figure 9b, and it results in no noticeable scattering intensity at the (001) position. Models containing unpaired Mni were constructed with three distinct layer types: (1) a layer without any interstitial atoms, (2) a layer with a fully occupied interstitial atom in the lower interstitial void, and (3) a layer with a fully occupied interstitial atom in the upper interstitial void. Two types of disorder were modeled for structures incorporating layers with singly occupied interstitial voids, namely random disorder and correlated disorder, as labeled in Figure 9. For the model containing layers with unpaired Mni stacked in a completely random assortment, no resolved diffuse intensity is generated at the (001) reflection. The rise in intensity at low is the result of the diffuse scattering from completely incoherent contributions, which emanate from (000). On the other hand, for an unpaired Mni model in which there is preferential stacking of the layers – correlated disorder – a well resolved diffuse signal near the (001) is generated. More specifically, the preferential stacking modeled here corresponds to an increased probability that a layer containing a single Mni in one of the interstitial voids will neighbor layers that also contain Mni in the same site. Although this simulation represents a rather coarse example of one type of correlated disorder that could be present in Mn1+δSb, it offers strong support for the presence of some degree of clustering associated with the interstitial atoms. As noted for the experimentally observed diffuse signal, the maximum of the diffuse component in the simulated pattern is also shifted to lower than the center of the (001) reflection. A single-crystal x-ray diffuse scattering study would be better suited to elucidating the origin of this observation.
While these observations and simulations soundly establish the existence of short-range structural order, the specific nature of clustering in Mn1+δSb remains an open question. Consideration of the many plausible local arrangements is beyond the scope of the present work; it is easily conceivable that a variety of short range-ordered motifs coexist. It is important to stress that although the presence of some unpaired Mni is a requisite for generating nuclear scattering intensity near the (001) reflection, this does not imply the absence of local regions with pairs of interstitials. Indeed, this type of diversity is represented in the DFT supercells. A comparison of the relative supercell stabilities does not suggest an obvious penalty for interstitial proximity (pairing), but because of their relatively small sizes and construction by stochastic population of the interstitial sites it would be conjecture to suggest an energetic preference for any particular type of clustering.
In summary, the observation of a diffuse signal consistent with the symmetry-forbidden (001) reflection suggests that the diffuse magnetic component observed by Taylor et al. by inelastic neutron scattering is rooted in short-range structural order. This explanation is further supported by our density functional studies, which challenge previous notionsYamaguchi et al. (1976); Watanabe and Yamaguchi (1980); Yamaguchi and Watanabe (1980); Coehoorn et al. (1985) that Mni induces a significant reduction in neighboring MnMn moments.
IV Conclusions
Analysis of x-ray total scattering data collected on polycrystalline powders of Mn1+δSb () reveals signatures of structural relaxation associated with the accommodation of interstitial atoms. In particular, the trigonal bipyramidal site of Mni is better described by longer equatorial Mni–Sb distances than reflected by the crystallographic unit cell. Density functional relaxation of large supercells for compositions close to , , and , provides excellent structural descriptions of the short-range disorder induced by Mni, evidenced by improved fits to the experimental PDFs. Relaxation has a pronounced effect on the calculated moment of Mni, which aligns antiparallel to MnMn, but our results suggest that Mni has effectively no influence on the moments of MnMn in proximity to interstitials. The observation of a diffuse signal near the (001) reflection position, which is systematically absent when Mni is distributed completely randomly, indicates that some degree of correlated disorder exists in Mn1+δSb.
acknowledgments
We gratefully acknowledge Dr. Kate A. Ross for useful discussions, Dr. Olaf J. Borkiewicz for assistance collecting total scattering data, and the instrument scientists at 11-BM for powder diffraction data acquisition. Use of the Advanced Photon Source at Argonne National Laboratory was supported by the U. S. Department of Energy, Office of Science, Office of Basic Energy Sciences, under Contract No. DE-AC02-06CH11357. This research utilized the CSU ISTeC Cray HPC System supported by NSF Grant CNS-0923386.
References
- Heikes (1955) R. R. Heikes, Phys. Rev. 99, 446 (1955).
- Zarkevich et al. (2014) N. A. Zarkevich, L. L. Wang, and D. D. Johnson, APL Mater. 2, 032103 (2014).
- Williams et al. (1957) H. J. Williams, R. C. Sherwood, F. G. Foster, and E. M. Kelley, J. Appl. Phys. 28, 1181 (1957).
- Chen et al. (1968) D. Chen, J. F. Ready, and E. Bernal, J. Appl. Phys. 39, 3916 (1968).
- Unger et al. (1972) W. K. Unger, E. Wolfgang, H. Harms, and H. Haudek, J. Appl. Phys. 43, 2875 (1972).
- Bai and Rama Rao (1984) V. S. Bai and K. V. S. Rama Rao, J. Appl. Phys. 55, 2167 (1984).
- Wada and Tanabe (2001) H. Wada and Y. Tanabe, Appl. Phys. Lett. 79, 3302 (2001).
- Sun et al. (2008) N. K. Sun, W. B. Cui, D. Li, D. Y. Geng, F. Yang, and Z. D. Zhang, Appl. Phys. Lett. 92, 072504 (2008).
- Teramoto and Vanrun (1968) I. Teramoto and A. M. J. Vanrun, J. Phys. Chem. Solids 29, 347 (1968).
- Vanyarkho et al. (1988) V. G. Vanyarkho, N. A. Moshchalkova, V. M. Gunchenko, and N. V. Fadeeva, Inorg. Mater. 24, 762 (1988).
- Okamoto (2006) H. Okamoto, Mn-Sb Phase Diagram, ASM Alloy Phase Diagrams Database, edited by P. Villars, H. Okamoto, and K. Cenzual (ASM International, Materials Park, OH, 2006).
- Reimers et al. (1982) W. Reimers, E. Hellner, W. Treutmann, and G. Heger, J. Phys. C: Solid State Phys. 15, 3597 (1982).
- Markandeyulu and Rama Rao (1987) G. Markandeyulu and K. V. S. Rama Rao, J. Magn. Magn. Mater. 67, 215 (1987).
- Taylor et al. (2015) A. E. Taylor, T. Berlijn, S. E. Hahn, A. F. May, T. J. Williams, L. Poudel, S. Calder, R. S. Fishman, M. B. Stone, A. A. Aczel, H. B. Cao, M. D. Lumsden, and A. D. Christianson, Phys. Rev. B 91, 224418 (2015).
- Okita and Makino (1968) T. Okita and Y. Makino, J. Phys. Soc. Jpn. 25, 120 (1968).
- Takei et al. (1963) W. J. Takei, D. E. Cox, and G. Shirane, Phys. Rev. 129, 2008 (1963).
- Yamaguchi et al. (1976) Y. Yamaguchi, H. Watanabe, and T. Suzuki, J. Phys. Soc. Jpn. 41, 703 (1976).
- Yamaguchi and Watanabe (1980) Y. Yamaguchi and H. Watanabe, J. Phys. Soc. Jpn. 48, 435 (1980).
- Watanabe and Yamaguchi (1980) H. Watanabe and Y. Yamaguchi, J. Magn. Magn. Mater. 15-18, 863 (1980).
- Reimers et al. (1983) W. Reimers, E. Hellner, W. Treutmann, and P. J. Brown, J. Phys. Chem. Solids 44, 195 (1983).
- Reimers et al. (1980) W. Reimers, E. Hellner, W. Treutmann, P. Brown, and G. Heger, J. Magn. Magn. Mater. 15-8, 479 (1980).
- Radhakrishna and Cable (1996) P. Radhakrishna and J. Cable, Phys. Rev. B 54, 11940 (1996).
- Coehoorn et al. (1985) R. Coehoorn, C. Haas, and R. A. Degroot, Phys. Rev. B 31, 1980 (1985).
- Blanc et al. (2011) F. Blanc, D. S. Middlemiss, Z. Gan, and C. P. Grey, J. Am. Chem. Soc. 133, 17662 (2011).
- Buannic et al. (2012) L. Buannic, F. Blanc, D. S. Middlemiss, and C. P. Grey, J. Am. Chem. Soc. 134, 14483 (2012).
- Dervisoglu et al. (2014) R. Dervisoglu, D. S. Middlemiss, F. Blanc, L. A. Holmes, Y.-L. Lee, D. Morgan, and C. P. Grey, Phys. Chem. Chem. Phys. 16, 2597 (2014).
- Grinberg et al. (2002) I. Grinberg, V. R. Cooper, and A. M. Rappe, Nature 419, 909 (2002).
- Grinberg and Rappe (2004) I. Grinberg and A. M. Rappe, Phys. Rev. B 70, 220101 (2004).
- Grinberg et al. (2004) I. Grinberg, V. R. Cooper, and A. M. Rappe, Phys. Rev. B 69, 144118 (2004).
- Levin et al. (2011) I. Levin, E. Cockayne, V. Krayzman, J. C. Woicik, S. Lee, and C. A. Randall, Phys. Rev. B 83, 094122 (2011).
- Li et al. (2007) J. Li, U. G. Singh, J. W. Bennett, K. Page, J. C. Weaver, J.-P. Zhang, T. Proffen, A. M. Rappe, S. Scott, and R. Seshadri, Chem. Mater. 19, 1418 (2007).
- Page et al. (2007) K. Page, M. W. Stoltzfus, Y.-I. Kim, T. Proffen, P. M. Woodward, A. K. Cheetham, and R. Seshadri, Chem. Mater. 19, 4037 (2007).
- White et al. (2010a) C. E. White, J. L. Provis, T. Proffen, D. P. Riley, and J. S. J. van Deventer, Phys. Chem. Chem. Phys. 12, 3239 (2010a).
- White et al. (2010b) C. E. White, J. L. Provis, T. Proffen, D. P. Riley, and J. S. J. van Deventer, J. Phys. Chem. A 114, 4988 (2010b).
- Kalland et al. (2013) L.-E. Kalland, A. Magraso, A. Mancini, C. Tealdi, and L. Malavasi, Chem. Mater. 25, 2378 (2013).
- Van de Walle and Neugebauer (2004) C. Van de Walle and J. Neugebauer, J. Appl. Phys. 95, 3851 (2004).
- Zunger et al. (1990) Z. Zunger, S.-H. Wei, L. G. Ferreira, and J. E. Bernard, Phys. Rev. Lett. 65, 353 (1990).
- Wei et al. (1990) S. H. Wei, L. G. Ferreira, J. E. Bernard, and A. Zunger, Phys. Rev. B 42, 9622 (1990).
- Voas et al. (2014) B. K. Voas, T.-M. Usher, X. Liu, S. Li, J. L. Jones, X. Tan, V. R. Cooper, and S. P. Beckman, Phys. Rev. B 90, 024105 (2014).
- Lee et al. (2008) P. L. Lee, D. Shu, M. Ramanathan, C. Preissner, J. Wang, M. A. Beno, R. B. Von Dreele, L. Ribaud, C. Kurtz, S. M. Antao, X. Jiao, and B. H. Toby, J. Synchrot. Radiat. 15, 427 (2008).
- Wang et al. (2008) J. Wang, B. H. Toby, P. L. Lee, L. Ribaud, S. M. Antao, C. Kurtz, M. Ramanathan, R. B. Von Dreele, and M. A. Beno, Rev. Sci. Instrum. 79, 085105 (2008).
- Toby et al. (2009) B. H. Toby, Y. Huang, D. Dohan, D. Carroll, X. Jiao, L. Ribaud, J. A. Doebbler, M. R. Suchomel, J. Wang, C. Preissner, D. Kline, and T. M. Mooney, J. Appl. Crystallogr. 42, 990 (2009).
- Larson and Von Dreele (2000) A. C. Larson and R. B. Von Dreele, Los Alamos National Laboratory Report LAUR 86-748 (2000).
- Toby (2001) B. H. Toby, J. Appl. Crystallogr. 34, 210 (2001).
- Chupas et al. (2007) P. J. Chupas, K. W. Chapman, and P. L. Lee, J. Appl. Crystallogr. 40, 463 (2007).
- Juhas et al. (2013) P. Juhas, T. Davis, C. L. Farrow, and S. J. L. Billinge, J. Appl. Crystallogr. 46, 560 (2013).
- Farrow et al. (2007) C. L. Farrow, P. Juhas, J. W. Liu, D. Bryndin, E. S. Bozin, J. Bloch, T. Proffen, and S. J. L. Billinge, J. Phys.: Condens. Matter 19, 335219 (2007).
- Tucker et al. (2007) M. G. Tucker, D. A. Keen, M. T. Dove, A. L. Goodwin, and Q. Hui, J. Phys.: Condens. Matter 19 (2007), 10.1088/0953-8984/19/33/335218.
- Treacy et al. (1991) M. M. J. Treacy, J. M. Newsam, and M. W. Deem, Proc. R. Soc. London, Ser. A 433, 499 (1991).
- Kresse and Hafner (1994) G. Kresse and J. Hafner, Phys. Rev. B 49, 14251 (1994).
- Kresse and Joubert (1999) G. Kresse and D. Joubert, Phys. Rev. B 59, 1758 (1999).
- Perdew et al. (1996) J. P. Perdew, K. Burke, and M. Ernzerhof, Phys. Rev. Lett. 77, 3865 (1996).
- Farrow et al. (2011) C. L. Farrow, M. Shaw, H. Kim, P. Juhás, and S. J. L. Billinge, Phys. Rev. B 84, 134105 (2011).
- Anderson (1961) P. W. Anderson, Phys. Rev. 124, 41 (1961).
- Dederichs (1971) P. H. Dederichs, Phys. Rev. B 4, 1041 (1971).