The energy gap of the compound determined by specific heat and point contact spectroscopy.
Abstract
The superconductor was studied with Point Contact spectroscopy and specific heat in polycrystalline samples. The transition temperature determined by magnetic measurement was K. The size of the energy gap measured by junctions is meV, whereas the gap determined by the specific heat measurements was meV. The gap evolution with temperature follows BCS, the ratio 2/ has values between 2.88 . The compound was grown by solid state synthesis in quartz ampoules under vacuum at 950 C. Crystal structure was characterized by X-ray diffraction. The superconducting properties were characterized by magnetization, resistivity and specific heat. This superconductor shows an isotropic energy gap as observed with the fitting of the specific heat at low temperature.
I Introduction
The new superconducting materials FeSe is interesting because they may give guides to elucidate the superconducting mechanism of other similar members with Fe and to others of the FeAs family. FeSe compound is one of the simplest Fe-Based superconductor with a transition temperature K. It has crystalline structure type anti-PbO and space group P4/nmm hsu ; mizu ; Lehman1 .
Compounds in these families have different transition temperatures, some with higher transition temperatures as the basic FeSe Yoichi ; kami ; mizu ; mcqueen ; mizu2 . Recently many study have been performed on these compounds mizu ; kami ; mizu2 ; singh ; sales some with transition temperatures as high as .
In those compounds the magnetism of Fe may play a relevant role which still is not totally understood for the superconducting behavior.
In this work we report a study of the superconductivity in Fe-Se-Te performed in polycrystalline samples. The study was mainly directed to observe and analyze the behavior of the energy gap and to determine the symmetry of the pairing wave function. In general for the determination of the energy gap, two tools that are well appropriate; Point Contact Spectroscopy (PCS) and Tunnel junctions. We used in this study one of those spectroscopic techniques. The junctions were formed with the superconducting compound with stoichiometry and a normal metal. The sample has a high transition temperature about K, as determined by Magnetic - Temperature measurements. Our studies show the size of the energy gap, the ratio , and the evolution with temperature of the gap. In addition, specific heat measurements indicated an isotropic energy gap with symmetry, the superconducting gap follows the BCS theory. The junctions were characterizes with the BTK model btk . With this model we can describe the type of junctions; i.e. PCS or tunnel, using the dimensionless barrier strength parameter given by the theory. Depending of this parameter the junctions may be considered tunnel or as a metallic contact (PCS).
II Experimental Details
II.1 compound and junctions characteristics
The superconducting samples were prepared by solid state reaction in evacuated quartz tubes with powder and purities; Fe 99.9%, Se 99.9%, and Te 99.99%. The nominal proportion was 1.01:0.5:0.05, the powders were mixed pressed and sintered at 950∘C for three days. Finally, annealed at 400 - 500∘C in a period of one day. R-X diffraction patterns gave the crystalline structure as the reported by cao ; Awana ; sales ; Migita ; Das ; JorgeLuiz ; Despina ; Tsurkan .
The study was performed with junctions that behave as metallic point contacts PCS. The junctions were prepared with the superconductor and a thin wire of tungsten plated gold W(Au) which has a diameter of 5 m, the stoichiometry of the superconductor was . For the fabrication of the PCS the wire was diagonally clipped as the procedure used in tips for use in scanning tunneling microscopy and carefully pressed into the superconducting sample. This cut allows to obtain very sharp tips with very small diameters about or less that 1 m Bai . Oxford varnish was used to glue the sample to a glass support. The estimated area of the junctions was 1 m2, as observed in an optical microscopy. The determined parameters with the BTK model gave values for the parameter from 3.4 to 6 btk . This was one of the main considerations to determinate the type of junction.
At the initial measurements several try outs were performed until reproducible data and stable characteristics were obtaining. Results presented in this work are the most reproducible for all the junctions.
Many junctions, more that 25 of PCS’s were prepared. The characteristics displayed in figures 4,5, were the most reproducible. The characteristics were measured from 1.7 to 25 K. Results show the size of the energy gap, the gap evolution with temperature, and ratio 2. The compound characteristics were determined by resistivity, - T, specific heat, , and magnetization, , accordingly to transport and magnetic measurements the transition temperature was K, as shown by other researchers mcqueen ; mizu2 ; cao ; Migita .

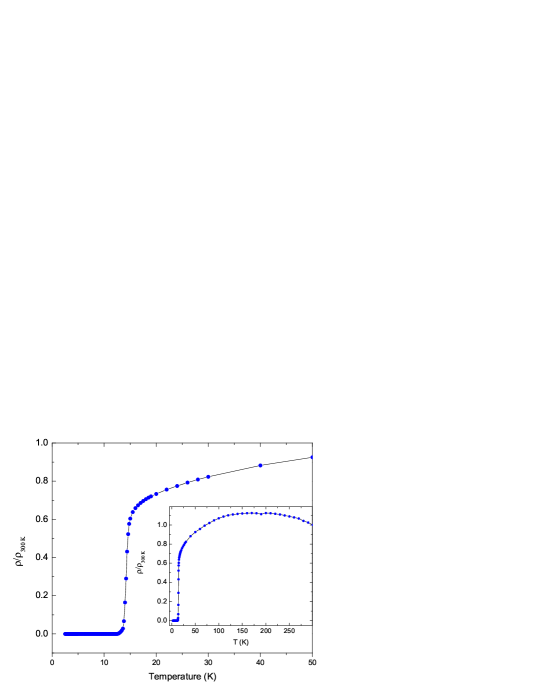
The superconducting characteristics were determined in a Quantum Design MPMS system, the amount of superconducting phase was estimated by Zero Field Cooling (ZFC) and Field Cooling (FC) measurements with 10 Oe. The proportion of superconducting material was 70%, compared with pure Pb with the same mass as the sample. Transport characteristic were determined in a Quantum Design PPMS system, Fig. 1 displays the resistivity versus temperature for the selected sample. Main panel shows the resistivity close to the transition temperature and the inset presents the overall behavior to high temperature. In Fig. 2 we display the magnetic characteristics of the three different compositions. The sample with the composition , was the used for determination of the spectroscopic characteristics because it has the maximum proportion of superconducting material.
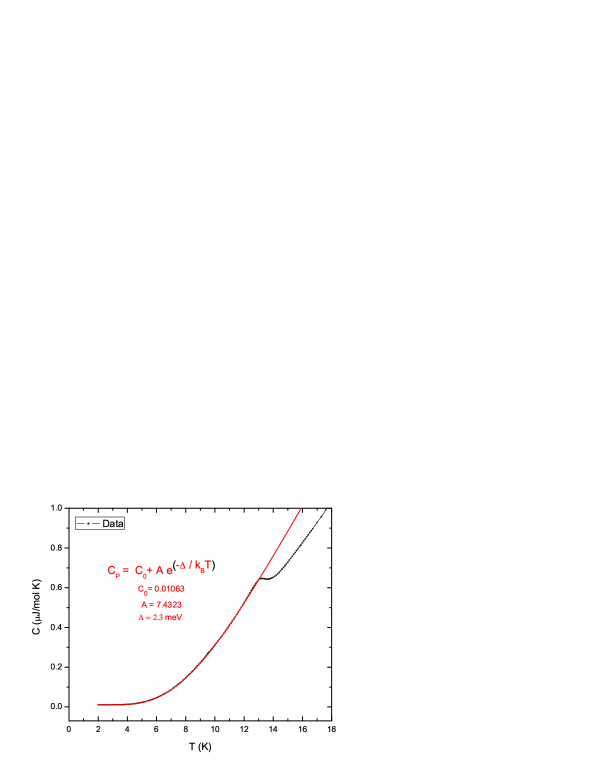
The isotropic characteristics of the energy gap were determined by thermal characterization measuring the specific heat capacity. The main panel in Fig. 3 displays the observed characteristic close to the transition temperature. The specific heat measurements, , were performed with a thermal relaxation method using a Quantum Design PPMS apparatus. The values were corrected by subtracting the addenda of the sample support and grease used to glue the sample to the support. Thermal measurements show similar overall characteristics as determined by Sales, and Awana. The Debye temperature was sales ; Awana . At low temperature specific heat measurements may give indications related to the type of superconducting pairing Dong . Our observations at low temperature, show a decreasing that fit quite well to an exponential decay, as . Two different parameters for the fitting were used as shown in the main panel of Fig. 3, and are parameters to adjust the background level of the specific heat curve at low temperature, whereas meV. The important result is that the superconducting compound is isotropic with a single gap and symmetry, the size of the energy gap is similar to as determined by the PCS, and the transition temperature, was about K. However, it is important to mention that determination of the energy gap with specific heat measurements is not as precise as tunneling or PCS measurements, nevertheless, specific heat may give clear information about features of multi-gap or single gap characteristics.
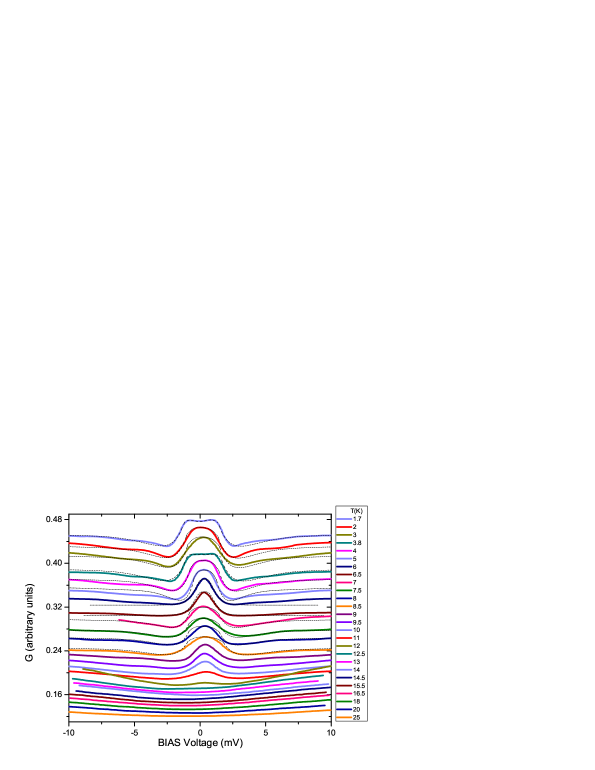
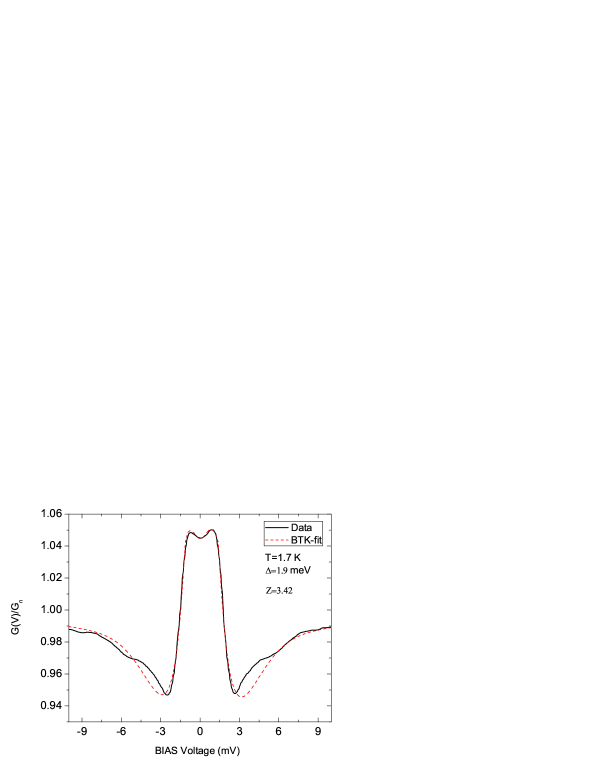
For the point contact measurements the differential resistance d/d as a function of the bias voltage for all junctions was measured with the standard techniques; AC Lock-in amplifier, and bridge wolf ; Adler . A Quantum Design MPMS system was used as a cryostat. The junctions were measured in the temperatures range from 1.7 to 25 K. PCSs were close to the ballistic regime according to the electronic parameters of the compound and to the values of the differential resistance (at zero bias voltage) and parameter. In figures 4 and 5 we show the overall characteristics of the PCS’s. Fig. 4 displays the general behavior of the differential conductance versus bias voltage at different temperatures measured from 1.7 to 25 K. In this set of measurements the BTK model fits well to the experimental data at low temperatures from 1.7 to about 7.5 K. With this result, it was possible to extract values for , which were , and energy gap meV. The parameter used in this study has the same meaning as the mentioned in the BTK theory; this, measure the barrier strength at the interface. As one example for the resulting fitting Fig. 5 shows the extracted parameters. In Fig. 6 we show the evolution of the gap with temperature plotted in terms of . The experimental data was plotted only at low temperature region, data at higher temperatures was difficult to fit as mentioned in description of Fig. 4. The characterization of the work regime of the PCS’s was estimated with the Wexler’s interpolation formula wexler ; we substituted the mean free electronic path estimated as Åusing the Drude model and according to the resistivity measurements ashcroft , the resistivity 40 -cm measured at 2 K and the resistance of the junction measured at zero bias voltage. The obtained radii values, were between 320 and 3700 , which indicate that some contacts are in the diffuse regime, and others in the ballistic limit, only PCS’s in the ballistic regime, or close to it were used to determined the spectroscopic features duif ; Jansen ; Daghero .
No broadening parameter was used for the determination of the spectroscopic characteristics as the one introduced by Dynes et.al., dynes .

III Results, Discussion and conclusions
Junctions with different characteristics behaving as PCS were used to investigate the nature of the superconducting state in a compound. PCS and tunneling are tools well appropriated to study electronic processes occurring close to the Fermi surface, as the energy gap and the evolution with temperature and ratio . Our measurements with specific heat give us information about the pairing and symmetry state of the compound, and information about the characteristics of the order parameter. Our analyses indicate the characteristics of the pairing symmetry accordingly to the experimental data this superconducting compound behaves as a full BCS superconductor. A single feature of the gap was observed in thermal measurements corroborated the shape of the decreasing of the specific heat below . An exponential decay of the specific heat with temperature was observed. It shows a good fitting to an exponential rate of decreasing, indicative that a single gap exist. The decreasing of below the transition is quite similar to the observations by Dong, et al., Dong in . In our work the curve can be well fitted to the exponential function without signs of a multi-gap system.
It is important to mention that Li, et al., Can-Li reported the evidence of nodes in a compound with a similar stoichiometry as in this work. The observation of the gap features by Li, et al., shown a wave pairing different from , that could be , or . However, the multigap feature determined by Li, et al., was measured close to a vortex state and the information could be distorted the real features. Lastly, other important probes appropriated to determine types of Cooper pairs was using ARPES. With this technique as observed by Miao, et al., found that at the composition , which is quite similar to our shown only an isotropic single energy gap miao .
Our conclusions of this work is that this superconductor behaves as a symmetry with a clear evolution of the energy gap with temperature of the BCS type. The values for the size of the energy gap with the PCS junctions gave meV, whereas with specific heat measurements the energy gap determined was meV. Other important parameter of this compound is the ratio = , accordingly, this superconducting material is in weak coupling limit.
Acknowledgements.
This work was supported by CONACyT project 129293, DGAPA-UNAM project IN106014, BISNANO, and ICYTDF, project PICCO. RELR was supported by DGAPA-UNAM project. We thanks to J. Morales, A. Lopez, for help in computational and technical problems, and to F. Silvar for He provisions.References
- (1) Fong-Chi Hsu, Jiu-Yong Luo, Kuo-Wei Yeh, Ta-Kun Chen, Tzu-Wen Huang, Phillip M. Wu, Yong-Chi Lee, Yi-Lin Huang, Yan-Yi Chu, Der-Chung Yan, and Maw-Kuen Wu, Superconductivity in the PbO-type structure -FeSe, PNAS, 105, 38, (2008).
- (2) Mizuguchi, Yoshikazu, Tomioka, Fumiaki, Tsuda, Shunsuke, Yamaguchi, Takahide, Takano, Superconductivity at 27 K in tetragonal FeSe under high pressure, Phys. Lett. 93, 152505 (2008).
- (3) M. C. Lehman, A. Llobet, K. Horigane and D. Louca, The crystal structure of superconducting by pulsed neutron diffraction, J. of Physics, 251 (2010).
- (4) Yoichi Kamihara, Takumi Watanabe, Masahiro Hirano and Hideo Hosono, Iron-Based Layered Superconductor (x=0.05-0.12) with =26 K, J. AM. CHEM. SOC. 130, 3296-3297 (2008).
- (5) T. Nomura, S. W. Kim, Y. Kamihara, M. Hirano, P. V. Sushko, K. Kato, M. Takata, A. L. Shluger and H. Hosono, Crystallographic phase transition and high- superconductivity in LaFeAsO:F, Soc. 130, 3296 (2008).
- (6) T. M. McQueen, Q. Huang, V. Ksenofontov, C. Felser, Q. Xu, H. Zandbergen, Y. S. Hor, J. Allred, A. J. Williams, D. Qu, J. Checkelsky, N. P. Ong, and R. J. Cava,Extreme sensitivity of superconductivity to stoichiometry in , Phys. Rev. B. 79, 014522 (2009).
- (7) Yoshikazu Mizuguchi, Yoshihiko Takano, A review of Fe-chalcogenide superconductors: the simplest Fe-based superconductor, Phys. Soc. Jap. 78, 074712 (2009).
- (8) U. R. Singh, S. C. White, S. Schmaus, V. Tsurkan, A. Loidl, J. Deisenhofer, and P. Wahl, Spatial inhomogeneity of the superconducting gap and order parameter in , Phys. Rev. B.88, 155124 (2013).
- (9) B. C. Sales, A. S. Sefat, M. A. McGuire, R. Y. Jin, and D. Mandrus, Bulk superconductivity at 14 K in single crystals of , Phys. Rev.B. 79, 094521 (2009).
- (10) G. E. Blonder, M. Tinkham, and T. M. Klapwijk, Transition from metallic to tunneling regimes in superconducting microconstrictions: Excess current, charge imbalance, and supercurrent conversion, Phys. Rev. B. 25, 4515 (1982).
- (11) Cao, S, et al., J. of Appl. Phys. 110, 033914 (2011).
- (12) M. Migita, Y. Takikawa, M. Takeda, M. Uehara, T. Kuramoto, Y. Takano, Y. Mizuguchi, Y. Kimishima, Intrinsic pinning property of , 240-8501 (2010).
- (13) V. P. S. Awana, Govind, Anand Pal, Bhasker Gahtori, S. D. Kaushik, A. Vajpayee, Jagdish Kumar, and H. Kishan, Anomalous heat capacity and x-ray photoelectron spectroscopy of superconducting FeSe1/2Te1/2, Journal of Applied Physics 109, 07E122 (2011).
- (14) P. Das, Ajay D. Thakur, Anil K. Yadav, C. V. Tomy, M. R. Lees, G. Balakrishnan, S. Ramakrishnan, and A. K. Grover, Magnetization hysteresis and time decay measurements in : Evidence for fluctuation in mean free path induced pinning, Phys. Rev. B 84, 214526 (2011).
- (15) Jorge Luiz Pimentel Júnior, Paulo Pureur, Cristiano Santos Lopes, Francisco Carlos Serbena, Carlos Eugênio Foerster, Simone Aparecida da Silva, Alcione Roberto Jurelo, and Adilson Luiz Chinelatto, Mechanical properties of highly oriented superconductor, J. Appl. Phys. 111, 033908 (2012).
- (16) Despina Louca, K. Horigane, A. Llobet, R. Arita, S. Ji, N. Katayama, S. Konbu, K. Nakamura, T.-Y. Koo, P. Tong, and K. Yamada, Local atomic structure of superconducting , Phys. Rev. B 81, 134524 (2010).
- (17) V. Tsurkan,a, J. Deisenhofer, A. Gnther, Ch. Kant, M. Klemm, H.-A. Krug von Nidda, F. Schrettle, and A. Loidl, Physical properties of single crystals grown under different conditions, Eur. Phys. J. B 79, 289–299 (2011).
- (18) C. Bai, Scanning Tunneling Microscopy and its Applications. Springer, Second Revised Edition (2000).
- (19) J. K. Dong, T. Y. Guan, S. Y. Zhou, X. Qiu, L. Ding, C. Zhang, U. Patel, Z. L. Xiao, and S. Y. Li, Multigap nodeless superconductivity in : Evidence from quasiparticle heat transport, Phys. Rev. B 80, 024518 (2009).
- (20) E. L. Wolf, Principles of electron tunneling spectroscopy, Oxford University Press, New York (1989).
- (21) J. G. Adler and J. E. Jackson, System for Observing Small Nonlinearities in Tunnel Junctions, American Institute of Physics, Rev. Sci. Instrum. 37, 1049; doi: 10.1063/1.1720405, (1966).
- (22) G. Wexler, The size effect and the non-local Boltzmann transport equation in orifice and disk geometry, Proc. Phys. Soc. London 89, 927 (1966).
- (23) N. W. Ashcroft and N. D. Mermin, Solid State Holt Saunders International Editions (1976).
- (24) A. M. Duif, A. G. M. Jansen, and P. Wyder, Point-contact spectroscopy, J. Phys.: Condens. Matter. 1, 3157 (1989).
- (25) A. G. M. Jansen, A. P. van Gelder and P. Wyder, Point-contact spectroscopy in metals, J. Phys. C: Solid St. Phys., 13, 6073-118. Printed in Great Britain, (1980).
- (26) D. Daghero and R. S. Gonnelli, Probing multiband superconductivity by point-contact spectroscopy, arXiv:0912.4858v1 [cond-mat.supr-con] 24 Dec 2009.
- (27) R. C. Dynes, V. Naraynamurti, J. P. Garno, Phys. Rev. Lett. 41, 1509 (1978).
- (28) Can-Li Song, Yi-Lin Wang, Peng Cheng, Ye-Ping Jiang, Wei Li, Tong Zhang, Zhi Li, Ke He, Lili Wang, Jin-Feng Jia, Hsiang-Hsuan Hung, Congjun Wu, Xucun Ma, Xi Chen, Qi-Kun Xue, Direct Observation of Nodes and Twofold Symmetry in FeSe Superconductor, Science 332, 1410 (2011).
- (29) H. Miao, P. Richard, Y. Tanaka, K. Nakayama, T. Qian, K. Umezawa, T. Sato, Y.-M. Xu, Y. B. Shi, N. Xu, X.-P. Wang, P. Zhang, H.-B. Yang, Z.-J. Xu, J. S. Wen, G.-D. Gu, X. Dai, J.-P. Hu, T. Takahashi, and H. Ding, Isotropic superconducting gaps with enhanced pairing on electron Fermi surfaces in FeTe0.55Se0.45, Phys. Rev. B 85, 094506 (2012).