An Extreme High-Velocity Bipolar Outflow in the Pre-Planetary Nebula IRAS 08005-2356
Abstract
We report interferometric mapping of the bipolar pre-planetary nebula IRAS 08005-2356 (I 08005) with an angular-resolution of 1”–5”, using the Submillimeter Array (SMA), in the 12CO J=2–1, 3–2, 13CO J=2–1 and SiO J=5–4 (v=0) lines. Single-dish observations, using the SMT 10-m, were made in these lines as well as in the CO J=4–3 and SiO J-6–5 (v=0) lines. The lines profiles are very broad, showing the presence of a massive ( ), extreme high-velocity outflow ( km s-1) directed along the nebular symmetry axis derived from the HST imaging of this object. The outflow’s scalar momentum far exceeds that available from radiation pressure of the central post-AGB star, and it may be launched from an accretion disk around a main-sequence companion. We provide indirect evidence for such a disk from its previously published, broad H emission profile, which we propose results from Ly emission generated in the disk followed by Raman-scattering in the innermost regions of a fast, neutral wind.
Subject headings:
circumstellar matter – planetary nebulae: individual (IRAS 08005-2356) – accretion disks – stars: AGB and post-AGB – stars: mass loss – stars: winds, outflows1. INTRODUCTION
Following the ejection of half or more of their mass via isotropic, slowy expanding winds, AGB stars evolve into planetary nebulae (PNe), which, surprisingly show a diverse range of aspherical (e.g., bipolar and multipolar) morphologies (e.g., Sahai & Trauger 1998, Sahai, Morris & Villar 2011a). Studies of pre-Planetary nebulae (PPNs), objects in transition between the AGB and planetary nebula (PN) evolutionary phases, are critical for characterising the physical processes responsible for this dramatic transformation. Sahai & Trauger (1998) proposed that fast collimated outflows or jets, operating during the PPN and/or very late AGB phase, are the primary agents for the dramatic change in the mass-loss geometry and dynamics during the AGB-to-PN evolutionary phase. However, the physical mechanism for producing these fast outflows remains a mystery. High-angular-resolution interferometric (sub)millimeter-wave observations are the best way to quantitatively probe the fast outflow’s dynamics and energetics – crucial information for theoretical models (e.g., Akashi & Soker 2013), and detailed numerical hydrodynamical simulations (e.g., Lee & Sahai 2003, Balick et al. 2013), for PN shaping.
Such observations have resulted in the discovery of a handful of “extreme-outflow” PPNs – objects in which the molecular outflows reach speeds in excess of 100 km s-1, e.g., Boomerang Nebula (Sahai et al. 2013), IRAS 22036+5306 (Sahai et al. 2006), IRAS 19374+2359 (Sánchez Contreras et al. 2013), IRAS 16342-3814 (Imai et al. 2012) and HD 101584 (Olofsson et al. 2015). Detailed studies of such extreme objects are likely to provide the best motivation for, and most stringent tests of, theoretical models to explain their origin (e.g., Blackman & Lucchini 2014).
In this Letter, we report (sub)millimeter-line observations of the PPN IRAS 08005-2356 (I 08005), which clearly reveal it to be an extreme-outflow PPN. Early CO J=2–1 observations by Hu et al. (1994) resulted in the marginal detection of a weak, broad line. I 08005’s F5 Ie central star V510 Pup (Slijkhuis et al. 1991) may have made a recent transition from ejecting oxygen-rich material to carbon-rich material (Bakker et al. 1997). Its morphological classification is Bo*(0.55) (Sahai et al. 2007), i.e., it has a bipolar morphology (resolved via HST imaging, Ueta et al. 2000) with lobes open at their ends and a central star seen at 0.55µm. Its optical spectrum reveals the presence of a prominent H emission line with very broad wings (FWZI km s-1) and a P-Cygni type blue-shifted absorption feature (Sánchez Contreras et al. 2008: SCetal08; also Slijkhuis et al. 1991, Klochkova & Chentsov 2004). Its estimated distance ranges between 2.85 kpc (Oppenheimer et al. 2005: OBS05) and 3–4 kpc (Klochkova & Chentsov 2004); we adopt a value of 3 kpc.
2. OBSERVATIONS
The 1.3 mm and 0.87 mm interferometric observations were obtained with the Submillimeter Array (SMA111The Submillimeter Array is a joint project between the Smithsonian Astrophysical Observatory and the Academia Sinica Institute of Astronomy and Astrophysics and is funded by the Smithsonian Institution and the Academia Sinica) at Mauna Kea, Hawaii. Bandpass calibration was performed using observations of 3C279. At 1.3 (0.87) mm, complex gain calibration was obtained from observations of the quasars 0750+125 and 0730-116 (0747-331 and 0826-225), and flux calibration was obtained from observations of Callisto (Europa). Additional observing parameters are listed in Table 1.
SMA data were calibrated using the MIR-IDL package222http://www.cfa.harvard.edu/cqi/mircook.html, and images were made using the Miriad software. Data cubes were obtained with a velocity resolution smoothed to 10 km s-1 per channel (to increase the S/N in each channel). Natural weighting was used to produce all images.
Single-dish observations of the 12CO J=2–1, 3–2 and 4–3, 13CO J=2–1, and SiO (v=0) J=5–4 and 6–5 line emission were obtained at SMT during 2014, Nov/Dec and 2015 Jan. Telescope pointing was frequently checked on VY CMa, and is estimated to be better than a small fraction of the beam. The weather was generally good, with system temparatures in the range K at 1.3 mm and K at 0.7 and 0.8 mm. Linear baselines were subtracted from the spectra shown. We have assumed main-beam efficiency factors of 0.76, 0.66, and 0.62 for the 230.6, 345.8, and 461.0 GHz observations (Edwards et al. 2014).
The optical images were taken with the NASA/ESA Hubble Space Telescope in GO programs ID 6364 (PI: M. Bobrowsky) and 6366 (PI: S. Trammell), using the PC on WFPC2, and extracted from the Hubble Legacy Archive333A collaboration between the Space Telescope Science Institute (STScI/NASA), the Space Telescope European Coordinating Facility (ST-ECF/ESA) and the Canadian Astronomy Data Centre (CADC/NRC/CSA).
3. RESULTS
3.1. Optical Imaging
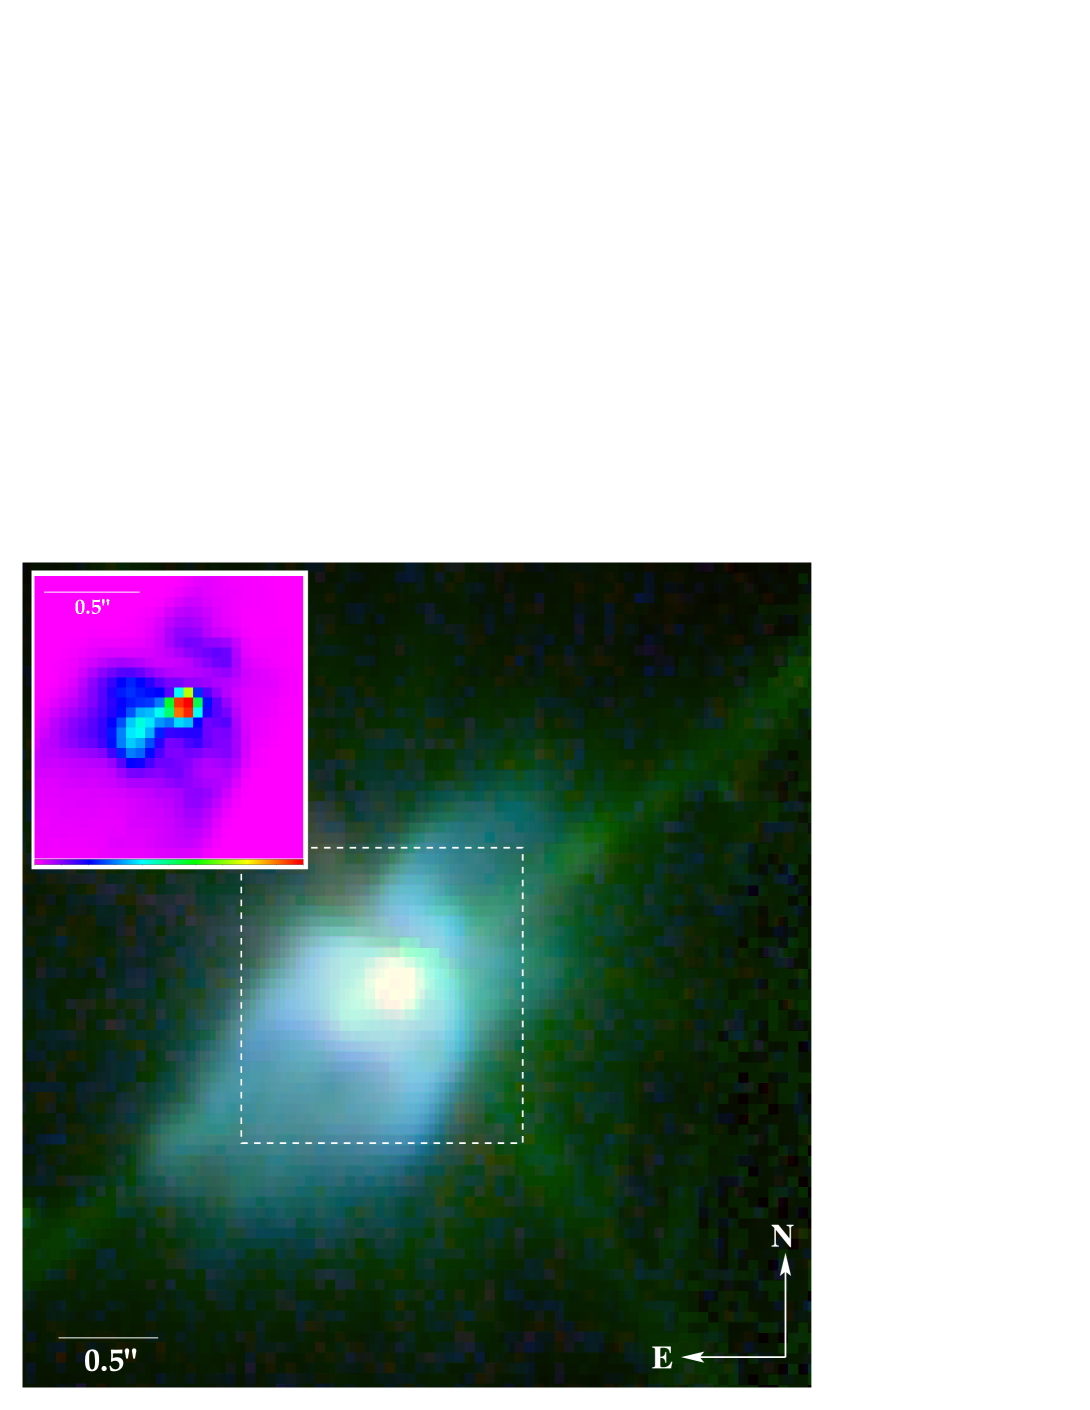
I 08005 shows an hourglass morphology in the HST F439W, F555W, and F675W images (Fig. 1) – the lobes, separated by a narrow dark lane, flare out from the central star’s location, and attain a cylindrical shape. The SE lobe is significantly brighter than the NW one. A narrow, slightly-curved feature of linear extent 038, is seen extending from the central star in the SE lobe (see inset). The feature is oriented at a , slightly different from the PA of the nebula symmetry axis, . The total linear extent of the nebula along its long axis, as seen in the F555W image, is ( cm).
3.2. Millimeter-Wave Observations
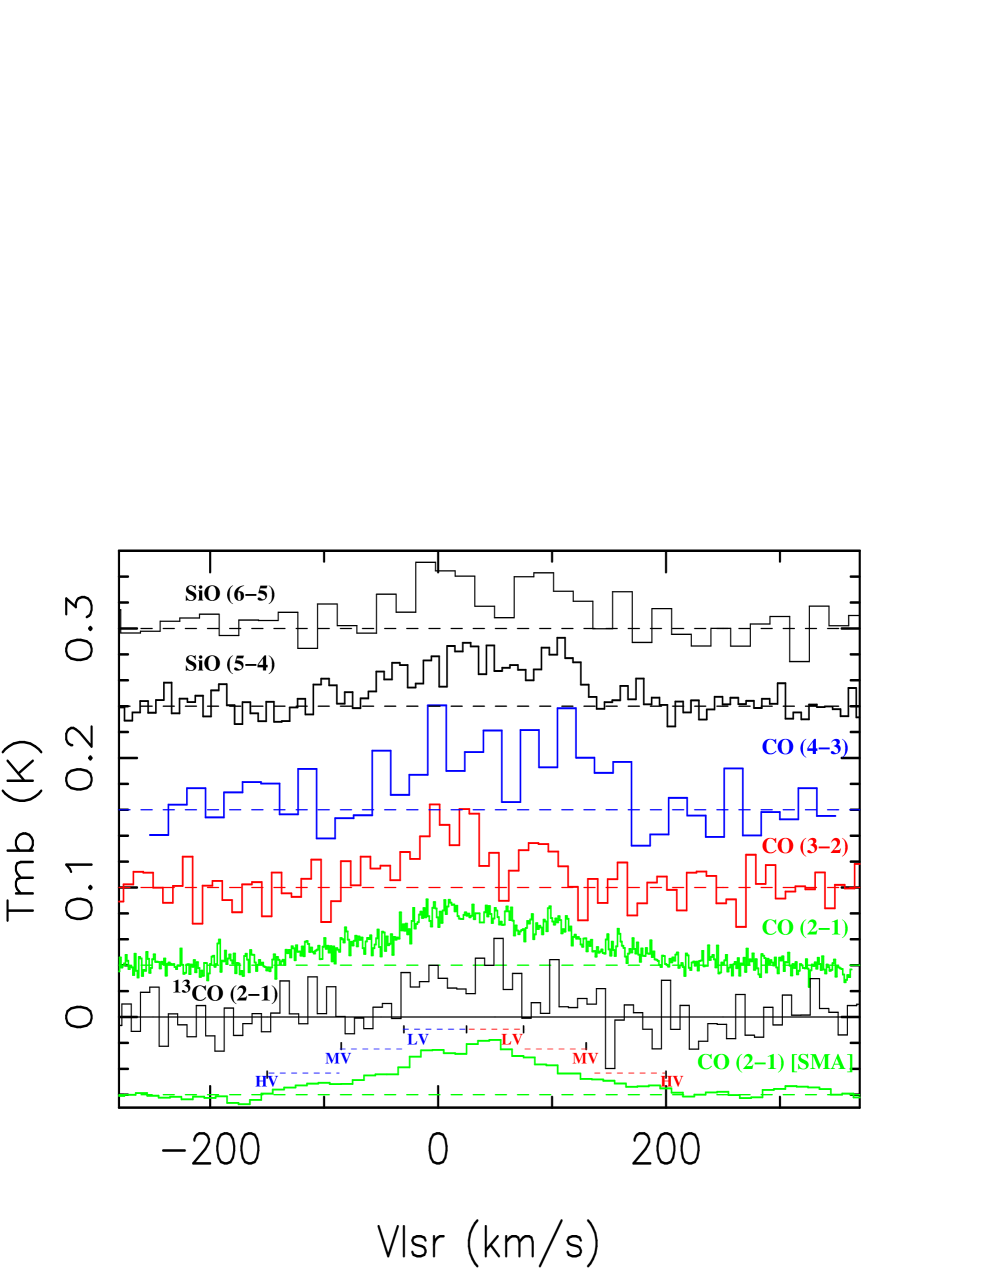
We detected the CO J=2–1, 3–2 and SiO J=5–4 lines with the SMA. The CO J=3–2 and SiO J=5–4 have significantly lower signal-to-noise, and the 13CO J=2–1 is tentatively detected. The (spatially) integrated SMA CO J=2–1 line profile (using a diameter circular aperture) shows a very broad profile (Fig. 2) covering a total velocity extent of about 350 km s-1, i.e., from . The SMT CO J=2–1 line profile (Fig. 2) is similar to the SMA one (a narrow emission feature at km s-1due to the presence of an unrelated line-of-sight interstellar cloud, has been removed from the profile by interpolation). A Gaussian fit to the profile gives a central velocity km s-1, and a FWHM of 196 km s-1.
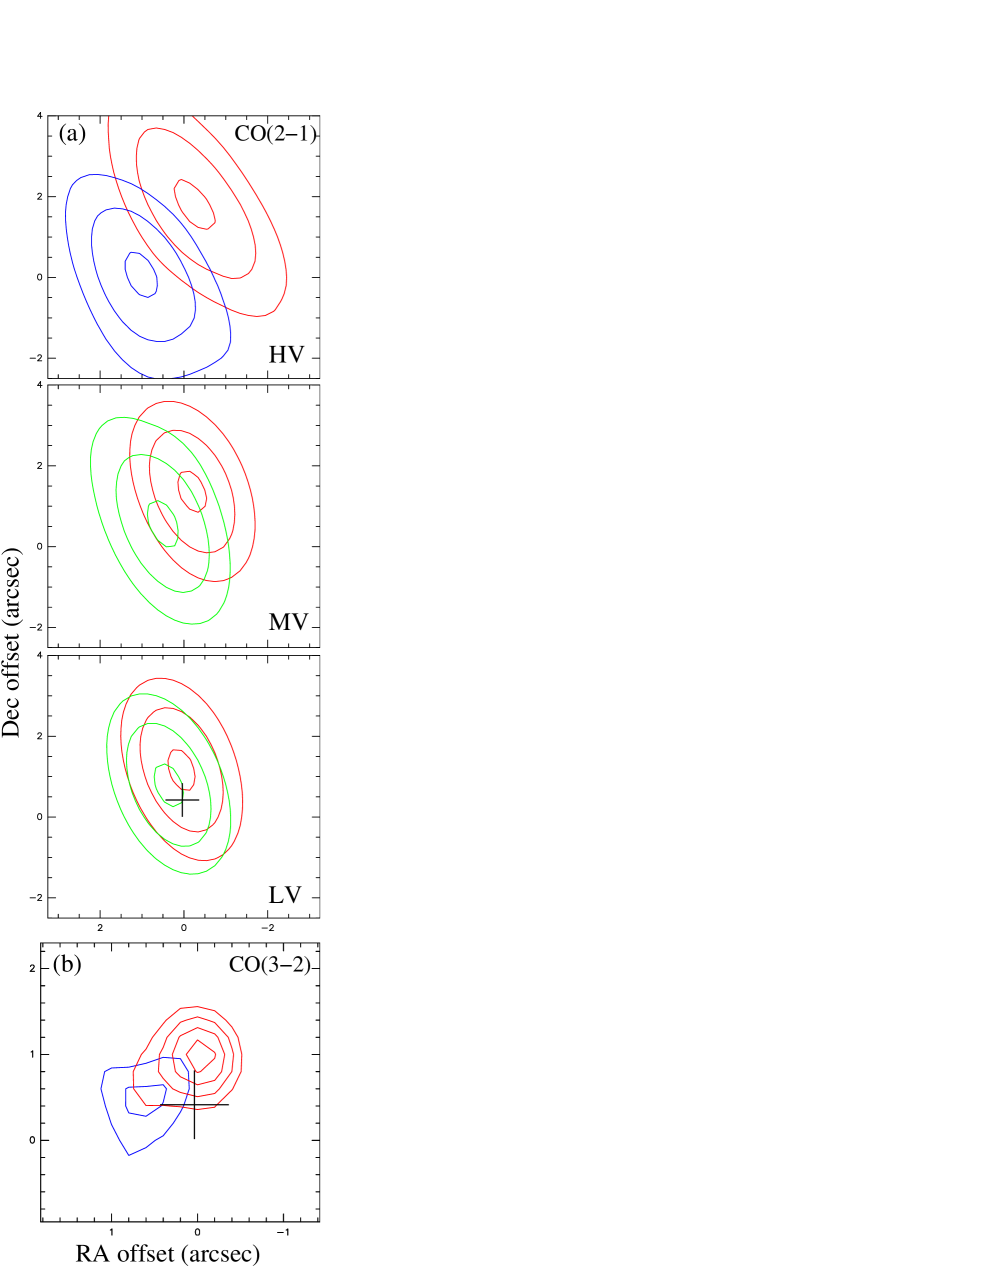
We have divided the velocity range spanned by the CO J=2–1 line into three intervals on each side of the central velocity – the extreme high-velocity or EV component (blue: , red: ), a medium-velocity or MV component (blue: , red: ), and a low-velocity LV component (blue: , red: ). The SMA CO J=2–1 emission in the blue and red-shifted parts of the EV, MV, and LV components show separations of about , , , respectively, along the nebular symmetry axis (Fig. 3a).
These results imply the presence of a fast, bipolar outflow with a (roughly) linear velocity-gradient, directed along the nebular symmetry axis, and a linear extent of . Since AGB mass-loss is typically spherical, with outflow velocities of 10–15 km s-1, we conclude that the outflow observed in CO J=2–1 emission is a fast, collimated post-AGB outflow, typical of the PPN evolutionary phase. We made similar plots from the SMA data cubes for CO J=3–2 (Fig. 3b) and SiO J=5–4 (not shown), dividing the emission velocity-range into two halves only (blue: , red: ) due to the lower S/N in these lines, and found that these show a separation of roughly along the nebular axis. This separation is equal to that derived from our CO J=2–1 data for the same red and blue outflow-velocity ranges, implying that the SiO outflow’s linear extent is likely comparable to that of CO.
We also detected the CO J=4–3, J=3–2 and 13CO J=2–1 as well as the SiO (v=0) J=5–4 and 6–5 lines with the SMT, but with lower S/N (Fig. 2). We have compared the total CO J=2–1 line fluxes from our SMA and SMT data, as these have the highest S/N, and find that these are consistent within 15%, i.e., within typical calibration uncertainties) – we conclude that the SMA data do not suffer from any significant flux losses.
Continuum images were obtained after removing spectral regions containing line emission, using the Miriad task uvlin. No continuum emission was detected from I 08005. Using line-free channels, we find a noise of 1.05 (1.2) mJy/beam in the USB (LSB) at 1.3 mm and 11 (18) mJy/beam in the USB (LSB) at 0.87 mm.
4. The Post-AGB Bipolar Outflow
4.1. Outflow Properties
We now determine the physical properties of the high-velocity bipolar outflow (e.g., scalar momentum, mass, and age) from an analysis of the molecular-line data. The observed ratios of the CO J=2–1, 3–2 and J=4–3 fluxes (in K km s-1) are , which imply corresponding non-beam diluted flux ratios of , since the source is unresolved by the SMT beams of , , and in these lines.
We first make a simple emission model assuming a spherical outflow at a uniform excitation temperature equal to the kinetic temperature, , and carry out a least-squares fit to the line fluxes444derived using the formulation in Olofsson et al. (1990), varying , the outer radius (), and mass of the emitting region (). We find and K. However, the derived is rather low compared to energy of the CO J=4 level (55.4 K), and modeling with the non-LTE RADEX code (van der Taak et al. 2007) shows that the J=4–3 excitation temperature, , is lower than by about (20–25)% due to the relatively low CO line optical depths in our model () and the average density, cm-3, implied by the emitting region’s mass and volume. Thus, the resulting, corrected model , too low to fit the data.
Using RADEX, we find that the average density required to bring closer to in order to fit the observed source brightness temperature ratios, is cm-3; the required K, giving a source size of , comparable to the CO source-size estimated from the SMA data. The model source size is similar to the size derived from the HST image, implying that the CO emission likely comes from the dense walls of the bipolar lobes seen in scattered light. The CO column density is, cm-2 (and the J=2–1, 3–2, and 4–3 lines have optical depths of 0.48, 0.44, 0.20). Assuming that the average emitting column is equal to the source radius, we find a CO-to-H2 abundance ratio of, , in reasonable agreement with the value typically assumed for PPNs, (e.g., Bujarrabal et al. 2001). Assuming a spherical emitting volume, the mass is, . The 12CO/13CO abundance ratio is, f(12C/13C)=9.6, from fitting the 12CO/13CO J=2–1 line flux ratio corrected for the different beam-dilutions (8.1).
The above values of and f(12C/13C) are lower limits since this is our “minimum-mass” model – models with higher values of are allowed. However, the total mass increases more slowly than the average density, since in models with higher values of , the emitting region’s size is smaller. For example, if we use the dust mass, =0.0019 derived by OBS05 from a detailed 2D radiative transfer model of I 08005’s SED, scale it to D=3 kpc, and adopt a typical gas-to-dust ratio for oxygen-rich AGB stars, , we get . For this value of , we need a CO model with cm-3, a factor higher than in our minimum-mass model; K, and cm-2. Since the CO J=2–1 optical depth is higher (), the abundance ratio is higher, f(12C/13C)=17.
We calculate the scalar momentum using the formulation described in Bujarrabal et al. (2001). Using our minimum-mass model, we find g cm s-1 for an inclination angle of the nebular axis to the sky-plane, (OBS05). The kinetic energy in the outflow is erg. These values of and lie near the upper end of the range for PPNs, g cm s-1 and erg (Bujarrabal et al. 2001). This outflow cannot be driven by radiation pressure because the lobes’ dynamical (expansion) time-scale, yr (from dividing the model CO shell-size by the CO J=2-1 FWHM line-width) is much smaller than that required by radiation pressure to accelerate the observed bipolar outflow to its current speed, yr, given I 08005’s luminosity of at D=3 kpc (using the value derived by OBS05, .) The mass-loss rate in the outflow is yr-1.
The observed SMT SiO J=6–5 to 5–4 line flux ratio is (with about % uncertainty), implying an intrinsic flux ratio (i.e., corrected for beam-dilution) of , since the source is unresolved by the SMT beams of and in these lines. Using RADEX, we find that for K, the average density in the SiO emission region is, cm-3 in order to fit the observed value of . The fractional SiO abundance is , close to the maximum value assuming cosmic abundances (), and comparable to the observed maximum circumstellar SiO abundance in oxygen-rich AGB stars (: Sahai & Bieging 1993). If the SiO emission comes from shocked gas at a higher kinetic temperature than that for CO, the minimum density required is higher.
4.2. A Central Accretion Disk?
Evidence of very fast outflows in I 08005 comes from three independent probes: (i) CO data (presented here), (ii) H spectrum in SCetal08, and (iii) OH maser emission (VLA mapping) reported in Zijlstra et al. (2001). The OH maser features cover the velocity range of , i.e., roughly the range covered by red half of the CO J=2–1 profile. In contrast to OH and CO emission, the H absorption probes atomic gas. Since the H absorption feature is not spatially resolved in the ground-based long-slit spectra, it is difficult to directly establish its relationship to the fast molecular outflow, however the close agreement between the terminal outflow velocities derived for these indicates that they are closely associated. The atomic gas may be located inside the lobes and may constitute unshocked material of an underlying jet, and/or the interface between the latter and the lobe walls, as proposed for IRAS 22036+5306 (Scetal06). The jet-like feature seen in the HST image (Fig. 1, inset) may represent the precessing jet’s signature close to its launch-site.
The high-speed bipolar outflow in I 08005 may be driven by an accretion disk. Bakker et al. (1997) find numerous narrow, double-peaked, chromospheric emission lines from neutral and singly ionized metals, and propose that these might arise in an accretion disk. We conjecture that the broad H wings seen towards this object might arise as a result of Raman-scattering of Ly emission generated by such a disk – a process that produces an H profile with a width that is a factor 6.4 larger than the Ly width and a wing profile. The very wide ( km s-1) H line wings in I 08005 show this shape, furthermore a weak emission feature around 6830Å with km s-1, corresponding to Raman-scattering of the 1032Å component of the O VI doublet at is also seen (SCetal08); the 7088Å feature that corresponds to the 1038Å component is a factor 4 weaker, and too weak to be visible.
Other line-broadening mechanisms include electron scattering and emission from a rotating disk. Arrieta & Torres-Peimbert (2003) find that electron scattering requires extreme densities (e.g., cm-3 in M 2-9) making that an implausible mechanism. Keplerian rotation in a disk around the central star is too low to directly account for the broad line-width in I 08005 (and PPNe in general: Sahai et al. 2011b) – taking the radius for the central post-AGB star of I 08005 to be (Slijkhuis et al. 1991) and a nominal stellar mass of 1, we find the maximum rotation speed is km s-1, too low for generating the extreme line-wings of the H profile, even with the factor 6.4 increase provided by Raman-scattering. We therefore conclude that the accretion disk in I 08005 must be around a much smaller star, e.g., a main-sequence companion.
The Raman-scattering likely occurs in the innermost regions of the fast neutral wind seen via its blue-shifted absorption feature signature in the H profile. In this case, following Sahai et al. (2011b), we scale from the minimum scattering column density, cm-2 needed to achieve the Raman conversion efficiency necessary for producing the very broad observed line-widths (see Fig. 1 of Lee & Hyung 2000), to find that yr-1( AU) (D/3 kpc) (/100 km s-1) (cm-2), where is the radius of the neutral wind where the Raman-scattering occurs. is set equal to of the broad CO J=2–1 line profile, and similar to the neutral outflow’s average outflow-velocity derived by SCetal08. The mass-loss rate requirement is easily met in I 08005 since OBS05 derive a mass-loss rate of yr-1 for a collimated fast wind in the 24-780 AU region around the central star,
5. Discussion
I 08005 is very similar to other extreme-outflow oxygen-rich PPNs, IRAS 22036+5306 (Sahai et al. 2006) and HD 101584 (Olofsson et al. 2015, Sivarani et al. 1999) in the properties of its collimated fast outflow (expansion-velocity, scalar-momentum, and kinetic-energy), and its H emission profile (very broad wings, P-Cygni absorption). But in striking contrast to these objects, it appears to lack mm and submm continuum emission from its central region – the ratio of its 1.3 mm to 60 micron flux is (), compared to and for HD 101584 and IRAS 22036+5306, respectively.
Both PPNs, as well as the “disk-prominent” sub-class of young post-AGB objects (dpAGB objects: Sahai et al. 2011c), which unlike PPNs, show little or no extended nebulosity, and have central stars that are radial-velocity binaries (e.g., van Winckel et al. 2008), emit relatively strong mm/submm continuum emission from their central regions. This emission has been attributed to the presence of substantial masses of cool, mm-sized grains (Sahai et al. 2011c, Gielen et al. 2007, de Ruyter et al. 2006). Their origin is not understood at present but is potentially a key probe of important mass-ejection processes occurring during the late-AGB and post-AGB evolutionary phases, especially those that lead to the formation of large dusty equatorial disks or torii. For example, in HD 101584, where a binary companion has been found from radial-velocity variations (Bakker et al. 1997), Olofsson et al. (2015) propose a scenarion in which both the formation of the central, equatorially-dense mass structure and the collimated outflow result from a common-envelope (CE) event – but the latter does not release enough energy to drive the mass-ejection, and another mechanism augments or even dominates it.
The apparent lack of a substantial mass of material in the equatorial waist of I 08005 suggests that perhaps it did not undergo a CE event, and its collimated outflow (and collimated outflows in PPNs generally) may be launched differently, possibly from an accretion disk as we have suggested earlier. I 08005 is thus a key post-AGB object for further detailed study. For example, ALMA can be used to probe its compact central region, in order to search for weak mm/submm continuum emission that may be present but was below our sensitivity limit, and for the presence of gas (and its kinematics) associated with its dusty waist.
References
- Akashi & Soker (2013) Akashi, M., & Soker, N. 2013, MNRAS, 436, 1961
- Arrieta & Torres-Peimbert (2003) Arrieta, A., & Torres-Peimbert, S. 2003, ApJS, 147, 97
- Bakker et al. (1997) Bakker, E. J., van Dishoeck, E. F., Waters, L. B. F. M., & Schoenmaker, T. 1997, A&A, 323, 469
- Balick et al. (2013) Balick, B., Huarte-Espinosa, M., Frank, A., et al. 2013, ApJ, 772, 20
- Blackman & Lucchini (2014) Blackman, E. G., & Lucchini, S. 2014, MNRAS, 440, L16
- Bujarrabal et al. (2001) Bujarrabal, V.,Castro-Carrizo, A., Alcolea, J., & Sánchez Contreras, C. 2001, A&A, 377, 868
- de Ruyter et al. (2006) de Ruyter, S., Van Winckel, H., Maas, T. et al. 2006, A&A, 448, 641
- Edwards et al. (1987) Edwards, S. et al. 1987, ApJ, 321, 473
- Edwards et al. (2014) Edwards, J. L., Cox, E. G., & Ziurys, L. M. 2014, ApJ, 791, 79
- Gielen et al. (2007) Gielen, C., van Winckel, H., Waters, L. B. F. M., Min, M., & Dominik, C. 2007, A&A, 475, 629
- Hu et al. (1994) Hu, J. Y., te Lintel Hekkert, P., Slijkhuis, F., et al. 1994, A&AS, 103, 301
- Imai et al. (2012) Imai, H., Chong, S. N., He, J.-H., et al. 2012, PASJ, 64, 98
- Klochkova & Chentsov (2004) Klochkova, V. G., & Chentsov, E. L. 2004, Astronomy Reports, 48, 301
- Lee & Hyung (2000) Lee, H.-W., & Hyung, S. 2000, ApJ, 530, L49
- Lee & Sahai (2003) Lee, C.-F., & Sahai, R. 2003, ApJ, 586, 319
- Olofsson et al. (2015) Olofsson, H., Vlemmings, W. H. T., Maercker, M., et al. 2015, A&A, 576, L15
- Olofsson et al. (1990) Olofsson, H., Carlstrom, U., Eriksson, K., Gustafsson, B., & Willson, L. A. 1990, A&A, 230, L13
- Oppenheimer et al. (2005) Oppenheimer, B. D., Bieging, J. H.,Schmidt, G. D., Gordon, K. D., Misselt, K. A., & Smith, P. S. 2005, ApJ, 624, 957
- Sahai & Bieging (1993) Sahai, R., & Bieging, J. H. 1993, AJ, 105, 595
- Sahai et al. (2011) Sahai, R., Claussen, M. J., Schnee, S., Morris, M. R., & Sánchez Contreras, C. 2011c, ApJ, 739, L3
- Sahai et al. (2011) Sahai, R., Morris, M. R., & Villar, G. G. 2011a, AJ, 141, 134
- Sahai et al. (2011) Sahai, R., Sánchez Contreras, C., Morris, M. R., & Claussen, M. 2011b, Asymmetric Planetary Nebulae 5 Conference, 11
- Sahai et al. (2007) Sahai, R., Morris, M., Sánchez Contreras, C., & Claussen, M. 2007, AJ, 134, 2200
- Sahai, R. & Trauger (1998) Sahai, R. & Trauger, J.T. 1998, AJ, 116, 1357
- Sahai et al. (2013) Sahai, R., Vlemmings, W. H. T., Huggins, P. J., Nyman, L.-Å., & Gonidakis, I. 2013, ApJ, 777, 92
- Sahai et al. (2006) Sahai, R., Young, K., Patel, N. A., Sánchez Contreras, C., & Morris, M. 2006, ApJ, 653, 1241
- Sivarani et al. (1999) Sivarani, T., Parthasarathy, M., García-Lario, P., Manchado, A., & Pottasch, S. R. 1999, A&AS, 137, 505
- Skopal (2006) Skopal, A. 2006, A&A, 457, 1003
- Slijkhuis et al. (1991) Slijkhuis, S., de Jong, T., & Hu, J. Y. 1991, A&A, 248, 547
- Sánchez Contreras et al. (2013) Sánchez Contreras, C., Martin, S., & Sahai, R. 2013, Highlights of Spanish Astrophysics VII, Eds.: J.C. Guirado, L.M. Lara, V. Quilis, and J. Gorgas., 671
- Sánchez Contreras et al. (2008) Sánchez Contreras, C., Sahai, R., Gil de Paz, A., & Goodrich, R. 2008, ApJS, 179, 166
- Van der Tak et al. (2007) van der Tak, F.F.S., Black, J.H., Schoier, F.L., Jansen, D.J., van Dishoeck, E.F., 2007, A&A 468, 627
- Ueta et al. (2000) Ueta, T., Meixner, M., & Bobrowsky, M. 2000, ApJ, 528, 861
- van Winckel et al. (2008) van Winckel, H., Deroo, P., Gielen, C., et al. 2008, Evolution and Nucleosynthesis in AGB Stars, AIP Conference Proceedings, 1001, 349
- Zijlstra et al. (2001) Zijlstra, A. A., Chapman, J. M., te Lintel Hekkert, P., Likkel, L., Comeron, F., Norris, R. P., Molster, F. J., & Cohen, R. J. 2001, MNRAS, 322, 280
| Lines | Freq.Range | Array (# Ants.) | Time11On-source integration time | Beam, PA | Tsys | Epoch | |
| [GHz] | [kHz] | [hr] | [K] | yy/mm/dd | |||
| 12CO(2-1) | USB22The frequency range for the full spectrometer passband covering line and continuum regions: 228.85–232.85 | 812.5 | compact (6) | 1 | , 20.8 | 100–230 | 13/12/11 |
| continuum33The frequency ranges used for extracting the continuum | 228.9–229.6, 229.9–230.2 | … | … | … | … | … | … |
| 230.8–232.9 | … | … | … | … | … | … | |
| 13CO, C18O(2-1) | LSB22The frequency range for the full spectrometer passband covering line and continuum regions: 216.85–220.85 | … | … | … | … | … | … |
| SiO(5-4),v=0 | |||||||
| continuum33The frequency ranges used for extracting the continuum | 216.9–217.0, 217.3–219.4 | … | … | … | … | … | … |
| 12CO(3-2) | LSB22The frequency range for the full spectrometer passband covering line and continuum regions: 342.0–346.0 | 812.5 | extended (7) | 2 | , 33.5 | 240–400 | 14/04/13 |
| continuum33The frequency ranges used for extracting the continuum | 342.0–345.4 | … | … | … | … | … | … |
| continuum33The frequency ranges used for extracting the continuum | USB22The frequency range for the full spectrometer passband covering line and continuum regions: 354.0–358.0 | … | … | … | … | … | … |