KIC 4768731: a bright long-period roAp star in the Kepler Field
Abstract
We report the identification of 61.45 d-1 (711.2 Hz) oscillations, with amplitudes of 62.6-mag, in KIC 4768731 (HD 225914) using Kepler photometry. This relatively bright (=9.17) chemically peculiar star with spectral type A5 Vp SrCr(Eu) has previously been found to exhibit rotational modulation with a period of 5.21 d. Fourier analysis reveals a simple dipole pulsator with an amplitude that has remained stable over a 4-yr time span, but with a frequency that is variable. Analysis of high-resolution spectra yields stellar parameters of K, , [Fe/H] = and km s-1. Line profile variations caused by rotation are also evident. Lines of Sr, Cr, Eu, Mg and Si are strongest when the star is brightest, while Y and Ba vary in anti-phase with the other elements. The abundances of rare earth elements are only modestly enhanced compared to other roAp stars of similar and . Radial velocities in the literature suggest a significant change over the past 30 yr, but the radial velocities presented here show no significant change over a period of 4 yr.
keywords:
asteroseismology – stars: abundances – stars: chemically peculiar – stars: individual (KIC 4768731) – stars: magnetic field – stars: oscillations – techniques: photometric1 Introduction
The chemically peculiar Ap stars are a spectroscopic subclass of A-type stars which exhibit strong enhancements of one or more elements, notably Cr, Eu, Si and Sr (Morgan, 1933). Strong magnetic fields in Ap stars were found by Babcock (1947) and their presence appears ubiquitous with field strengths reaching several kilogauss (Donati & Landstreet, 2009). As a group the Ap stars rotate more slowly than normal A-type stars due to magnetic breaking (Stȩpień, 2000) and exhibit photometric and spectral variability due to inhomogeneous surface distributions of elemental abundances concentrated into spots by the magnetic field (Wolff, 1983; Smith, 1996).
| HD | Name | Frequencies | Reference | |||||
|---|---|---|---|---|---|---|---|---|
| K | L☉ | km s-1 | kG | d | Hz | |||
| 6532 | AP Scl | 3.914 | 1.22 | 30.0 | 0.40 | 1.944973 | 2390.2, 2396.2, 2402.2, 2408.1, | Kurtz et al. (1996) |
| 9289 | BW Cet | 3.907 | 1.08 | 10.5 | 0.07 | 8.55 | 1585.1, 1554.8, 1605.4 | Kurtz, Martinez & Tripe (1994) |
| 12098 | V988 Cas | 3.892 | 0.88 | 1.00 | 5.460 | 2173.7, 2164.2, 2180.6, 2305.6 | Girish et al. (2001) | |
| 12932 | BN Cet | 3.884 | 1.21 | 2.5 | 0.64 | 3.5295? | 1436.3 | Martinez, Kurtz & van Wyk (1994) |
| 19918 | BT Hyi | 3.899 | 1.06 | 3.0 | 0.21 | 1510.2, 3020.1, 1480.7 | Martinez et al. (1995) | |
| 24355 | J0353 | 3.916 | 13.859611 | 2596 | Holdsworth et al. (2014a) | |||
| 24712 | HR 1217 | 3.860 | 0.89 | 0.76 | 12.45877 | 2619.5, 2653.0, 2687.6, 2721.0, | Kurtz et al. (2002) | |
| 42659 | UV Lep | 3.900 | 1.48 | 19.0 | 0.39 | 1735.5 | Martinez, Kurtz & Ashley (1993) | |
| 60435 | V409 Car | 3.910 | 1.14 | 10.8 | 0.30 | 7.6793 | 709.0, 761.4, 842.8, 939.7, | Matthews, Wehlau & Kurtz (1987) |
| 69013 | 3.881 | 0.60 | 4.0 | 4.8 | 1485 | Kochukhov et al. (2013) | ||
| 75445 | 3.886 | 1.17 | 2.0 | - | 1850.0 | Kochukhov et al. (2009) | ||
| 80316 | LX Hya | 3.918 | 1.05 | 32.0 | - | 2.08860 | 2246.1, 2251.6, 2257.2 | Kurtz et al. (1997a) |
| 83368 | HR 3831 | 3.877 | 1.09 | 33.0 | 0.81 | 2.851982 | 1415.8, 1419.9, 1424.0, 1428.0, | Kurtz et al. (1997b) |
| 84041 | AI Ant | 3.916 | 25.0 | 0.48 | 3.69 | 1113.0, 1085.0, 1145.0 | Martinez et al. (1993) | |
| 86181 | V437 Car | 3.865 | 1.05 | 0.40 | 2688.0 | Kurtz & Martinez (1994) | ||
| 92499 | 3.875 | 1.14 | 3.3 | 8.2 | 1602 | Elkin et al. (2010) | ||
| 96237 | TX Crt | 3.892 | 0.88 | 6.0 | 2.9 | 1200 | Kochukhov et al. (2013) | |
| 99563 | XY Crt | 3.886 | 1.10 | 28.0 | 0.57 | 1553.7, 1561.6, 1545.7, 1557.6, | Handler et al. (2006) | |
| 101065 | V816 Cen | 3.810 | 0.91 | 4.0 | 1.02 | 1372.8, 1381.5, 1314.6, 1379.8, | Mkrtichian et al. (2008) | |
| 115226 | 3.883 | 0.86 | 27.0 | 0.74 | 1534.0 | Kochukhov et al. (2008b) | ||
| 116114 | 3.870 | 1.32 | 2.2 | 1.92 | 790.0 | Elkin et al. (2005b) | ||
| 119027 | LZ Hya | 3.875 | 0.79 | 1953.7, 1940.5, 1913.4, 1887.9, | Martinez, Koen & Sullivan (1998) | |||
| 122970 | PP Vir | 3.840 | 0.82 | 4.2 | 0.19 | 3.877 | 1502.5, 1477.8, 1476.8, 1478.9 | Handler et al. (2002) |
| 128898 | Cir | 3.875 | 1.03 | 13.5 | 0.32 | 4.4792 | 2442.6, 2265.4, 2341.8, 2366.5, | Kurtz et al. (1994) |
| 132205 | 3.892 | 0.77 | 9.5 | 5.2 | 2334 | Kochukhov et al. (2013) | ||
| 134214 | HI Lib | 3.858 | 0.85 | 2.6 | 0.46 | 248.00 | 2947.0, 2784.0, 2644.0, 2842.0, | Kurtz et al. (2007) |
| 137909 | CrB | 3.908 | 1.37 | 3.5 | 0.51 | 967.0, 1062.0 | Kochukhov et al. (2008a) | |
| 137949 | 33 Lib | 3.869 | 1.09 | 3.0 | 2.14 | 2014.8, 4029.6, 1769.0 | Kurtz, Elkin & Mathys (2005) | |
| 143487 | 3.845 | 0.0 | 1.5 | 4.7 | 1730 | Kochukhov et al. (2013) | ||
| 148593 | 3.894 | 0.78 | 5.0 | 3.0 | 1560 | Kochukhov et al. (2013) | ||
| 150562 | V835 Ara | 3.9: | 1.5 | 5.0 | 1550.0 | Martinez & Kurtz (1992) | ||
| 151860 | 3.848 | 0.42 | 4.5 | 2.5 | 1355 | Kochukhov et al. (2013) | ||
| 154708 | 3.829 | 0.73 | 4.0 | 6.54 | 5.3666 | 2088.0 | Kurtz et al. (2006) | |
| 161459 | V834 Ara | 1.76 | 1390.9 | Martinez & Kauffmann (1990) | ||||
| 166473 | V694 CrA | 3.889 | 1.22 | 2.5 | 2.15 | 1833.0, 1886.0, 1928.0 | Mathys, Kurtz & Elkin (2007) | |
| 176232 | 10 Aql | 3.899 | 1.32 | 2.7 | 0.46 | 1447.9, 1396.9, 1427.1, 1366.2, | Huber et al. (2008) | |
| 177765 | 3.903 | 1.54 | 2.5 | 3.6 | 706 | Alentiev et al. (2012) | ||
| 185256 | V4373 Sgr | 6.2 | 0.71 | 1630.0 | Kurtz & Martinez (1995) | |||
| 190290 | CK Oct | 16.0 | 3.00 | 4.03 | 2270.0, 2230.0 | Martinez, Kurtz & Kauffmann (1991) | ||
| 193756 | QR Tel | 17.0 | 0.36 | 1284.0 | Martinez & Kurtz (1990) | |||
| 196470 | AW Cap | 1.47 | 1544.0 | Martinez et al. (1990) | ||||
| 201601 | Equ | 3.878 | 1.10 | 2.5 | 0.79 | 1785.70 | 1364.6, 1365.4, 1427.1, 1388.9, | Gruberbauer et al. (2008) |
| 203932 | BI Mic | 4.7 | 0.25 | 1280.5, 2838.0, 2772.3, 2737.3 | Martinez, Kurtz & Heller (1990) | |||
| 213637 | MM Aqr | 3.822 | 0.64 | 3.5 | 0.74 | 1452.3, 1410.9 | Martinez et al. (1998) | |
| 217522 | BP Gru | 3.816 | 0.85 | 2.7 | 0.69 | 1215.3, 1199.9, 2017.4 | Kreidl et al. (1991) | |
| 218495 | CN Tuc | 3.888 | 1.10 | 16.0 | 0.77 | 2240.0 | Martinez & Kurtz (1990) | |
| 218994 | 3.881 | 1.06 | 5.2 | 1170.0 | González et al. (2008) | |||
| 225914 | KIC 4768731 | 3.888 | 1.33 | 14.8 | 2.7 | 5.205 | 711.2, 713.5, 709.0 | This Work |
| J0008 | 3.863 | 1739 | Holdsworth et al. (2014a) | |||||
| 258048 | J0629 | 3.820 | 1962 | Holdsworth et al. (2014a) | ||||
| J0651 | 3.869 | 1532 | Holdsworth et al. (2014a) | |||||
| J0855 | 3.892 | 3.09 | 2283 | Holdsworth et al. (2014a) | ||||
| 97127 | J1110 | 3.799 | 1234 | Holdsworth et al. (2014a) | ||||
| J1430 | 3.851 | 2726 | Holdsworth et al. (2014a) | |||||
| J1640 | 3.869 | 3.67 | 1758 | Holdsworth et al. (2014a) | ||||
| KIC 7582608 | 3.940 | 1.13 | 4 | 3.1 | 20.20 | 2103 | Holdsworth et al. (2014b) | |
| J1921 | 3.792 | 1490 | Holdsworth (2015) | |||||
| J1940 | 3.839 | 9.58 | 2042 | Holdsworth et al. (2014a) | ||||
| KIC 8677585 | 3.863 | 0.80 | 4.2 | 1659.8, 1621.8, 1504.3, 1676.0 | Balona et al. (2011b) | |||
| KIC 10195926 | 3.869 | 1.61 | 21.0 | 5.68459 | 972.6, 976.7, 974.6, 970.6 | Kurtz et al. (2011) | ||
| KIC 10483436 | 3.869 | 0.84 | 4.303 | 1353.0, 1347.6, 1358.4, 1508.9 | Balona et al. (2011a) |
The rapidly oscillating Ap (roAp) stars are a subset of the magnetic Ap stars (Kurtz, 1982). These exhibit short-timescale variations with periods between 5 and 25 minutes and amplitudes up to 0.01 mag. The roAp stars are relatively rare with 61 known to date (Table 1), compared to around 2000 known Ap stars (Renson & Manfroid, 2009). Most have been found using ground-based photometry of already known Ap stars. Some, which do not exhibit photometric variations detectable from the ground, have been found by spectroscopic studies looking for radial velocity variations (e.g. Kochukhov et al., 2002; Elkin et al., 2005a). Eleven of the 61 known roAp stars have now been found using the SuperWASP archive with -band amplitudes 0.5 mmag (Holdsworth et al., 2014a; Holdsworth, 2015).
The launch of the Kepler spacecraft enabled the search for photometric oscillations with amplitudes well below those detectable from the ground. Seven stars previously classified as Ap stars were observed by Kepler to search for rapid oscillations, but only one was found to exhibit roAp pulsations (Balona et al., 2011b). Two further previously unknown Ap stars were identified from their pulsations and subsequent spectral analyses (Balona et al., 2011a; Kurtz et al., 2011). In the spectroscopic survey of 117 A and F stars observed by Kepler, Niemczura et al. (2015) identified one new Ap star (KIC 4768731), and re-classified two of the stars by Balona et al. (2011b) as not Ap (KIC 8750029 and KIC 9147002). All the Kepler-discovered roAp stars have oscillation amplitudes below 0.1 mmag, while one initially discovered by SuperWASP located in the Kepler field has an amplitude of over 1 mmag (Holdsworth et al., 2014b). The star discussed here, KIC 4768731, is brighter and has a lower pulsation frequency than the other known roAp stars in the Kepler field.
2 KIC 4768731
Prior to the Kepler mission, KIC 4768731 (HD 225914, BD +39 3919) was a rather anonymous star (Høg et al., 2000) with a spectral type A7 (Cannon, 1925). The star is part of the double system WDS 19484+3952 with a 12th magnitude star (KIC 4768748) at 12″ (Mason et al., 2001). There has been very little change in separation or position angle over a period of 74 yr, suggesting that the two stars might be a common proper motion pair. Recent proper motion catalogues (Roeser, Demleitner & Schilbach, 2010; Zacharias et al., 2013) are inconclusive in this regard, with both stars having proper motions that agree to within the error bars. Unfortunately, the Hipparcos parallax (Perryman & ESA, 1997) of mas is too uncertain to provide any meaningful distance constraint. The distance of 350 pc estimated from the stellar parameters (see Sect. 7) would imply a physical separation of at least 4000 au. However, the Kepler Input Catalog estimates = 4220 K and = 1.55 for the companion star, suggesting that this it a background K-type giant star. In Sect. 6 spectroscopic observations confirm this.
3 Spectral Classification

KIC 4768731 was included in the sample of several hundred A- and F-type stars to be observed at high-resolution as part of the Kepler Asteroseismic Science Consortium (KASC) spectroscopic follow-up of stars with Kepler light curves (Niemczura et al., 2015). A spectrum of this star was taken on 2011 July 13 using the fibre-fed High Efficiency and Resolution Mercator Echelle Spectrograph (HERMES; Raskin et al., 2011). Fig. 1 presents the spectrum at classification resolution. This spectrum is a smoothed version of the high-resolution spectrum downgraded to a resolution of 1.8Å to match that of the spectral standards111Spectra of the MK standards were obtained at R.O. Gray’s website: http://stellar.phys.appstate.edu/Standards/std1_8.html.
The H line and the strength of the metal lines in general match that of the A5V standard, but for an A5V star the Ca ii K line is shallow and abnormally broad. This abnormal shape is due to abundance stratification within the star’s atmosphere (see Sect. 7.3). The Ca i 4226Å line, however, does not look abnormal. Sr ii lines are particularly strong (see the 4077 and 4216Å lines). Cr lines are also strong: the Cr ii 4111Å line that is blended in the redward core-wing boundary of H is pronounced, and this is confirmed with the Cr ii 3866Å line. The Cr ii 4172Å line is mixed in with the Fe-Ti 4172–9Å blend, but the 4172Å component is noticeably stronger.
Other features to look for in the spectrum of Ap stars include strong Eu and Si lines (for an atlas of Ap star spectra, see Gray & Corbally, 2009). The Eu ii 4205Å line is enhanced, but the Eu ii 4130Å line is blended with the Si ii doublet. That doublet of Si ii (4128 and 4131Å) is strong and, unlike in the comparison spectra, is more of a blended feature than a separated doublet. This is not a product of rotation, as KIC 4768731 is clearly not a rapid rotator, but could reflect a strong Eu line. The Si ii 3856Å line appears strong, but other Si ii lines (4002, 4028 and 4076Å) are not pronounced. These findings lead to the classification A5 Vp SrCr(Eu).
4 Kepler Observations
Debosscher et al. (2011) classified KIC 4768731 as exhibiting rotational modulation with a frequency of 0.191206 d-1 (5.23 d) and an amplitude of 5.407 mmag. The AAVSO Variable Star Index (VSX; Watson, 2006) noted this star as ACV: (a suspected CVn variable) with a period of 5.21 d and magnitude range of 10 mmag based on Kepler light curves. The VSX entry by R. Jansen was dated 2011 May based on a phase plot of Kepler data from JD 2454964 to 2454998, noting also that the rise time from minimum to maximum light is 50 per cent of the variable’s period.
One month of Short Cadence (SC) data was acquired by KASC for this star in Q2.1 (2009 June 20 – 2009 July 20), but with a 2-d gap due to a safe mode event. The star was, nevertheless, observed nearly continuously in Long Cadence (LC) mode throughout the Kepler mission from Q0 to Q17 (2009 May 02 – 2013 May 2013). A periodogram of the SC data shows the previously reported rotational modulation, plus a weak higher frequency signal at 61.45 d-1. The variability of KIC 4768731 obtained from the Kepler light curves is discussed in detail in Sect. 5.
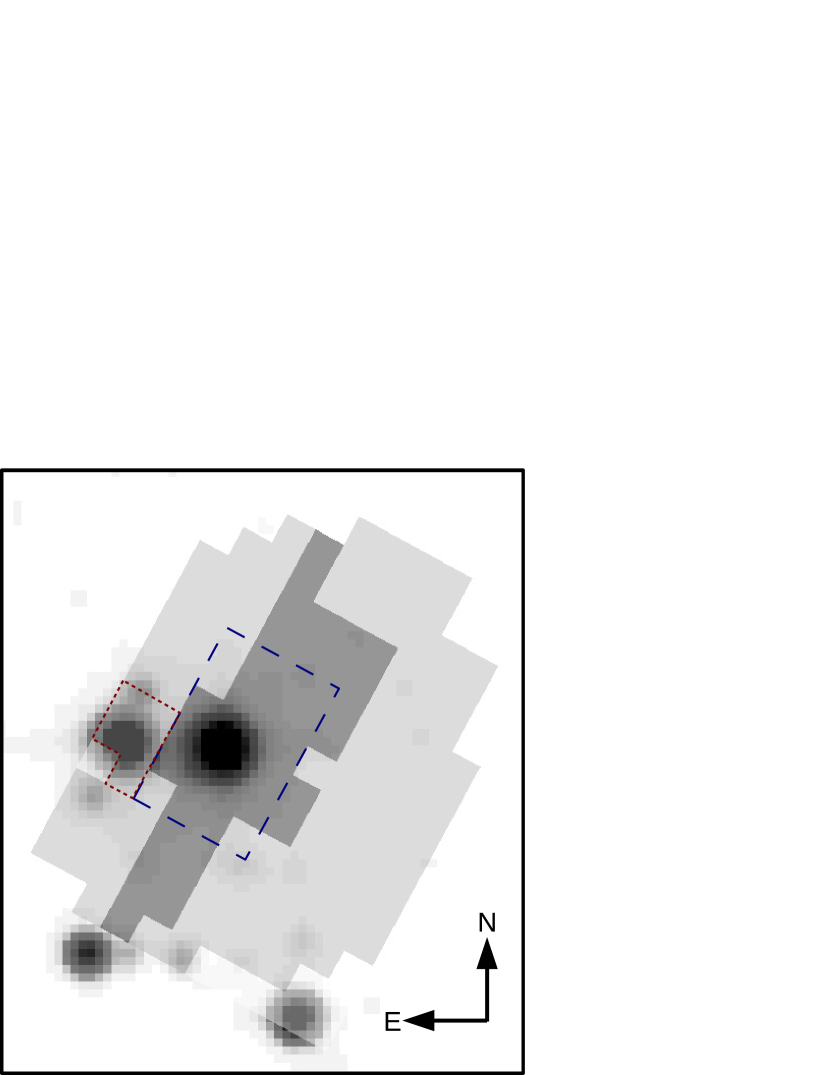
The presence of the nearby companion star (KIC 4768748) could potentially affect the Kepler light curve of KIC 4768731. Fig. 2 shows the SC pixel map overlaid with the 2MASS -band image. The standard pdcsap light curve extraction does not include the companion star, but it is very close. Therefore, using pyke tools (Still & Barclay, 2012), we extracted two light curves; one containing just the pixels centred on KIC 4768731 and the other centred on the companion star KIC 4768748. The light curve of KIC 4768748 contains neither the rotational modulation nor the high-frequency signal, while the light curve of KIC 4768731 show the previously reported rotational modulation plus the weak higher frequency signal.
5 Frequency analysis of the Kepler data


KIC 4768731 was observed by Kepler in all quarters Q0–17 in LC, and during one month, Q2.1, in SC. We use these data to study the pulsation frequencies, amplitudes and phases for the full 4-yr data set. There is no Nyquist limitation with Kepler LC data, although there is a reduction in amplitude as a consequence of the pulsation periods being shorter than the integration times. See Murphy, Shibahashi & Kurtz (2013) for an explanation. Fig. 3 shows an amplitude spectrum of the Q0–17 data where only the low-frequency peaks generated by the rotational variation can be seen in the top panel. We ran a high-pass filter that removed the rotational variations from the light curves, and the lower panel of Fig. 3 shows the amplitude spectrum of those filtered data. There is a clear frequency triplet centred at 12.51 d-1. A closer look at these peaks shows them to be Nyquist aliases of higher frequency peaks near 61.5 d-1, as is evident from the SC data.
The rotation frequency found by fitting the highest peak in Fig. 3 to the LC data by nonlinear least-squares gives d-1, or d.


Fig. 4 shows an amplitude spectrum of the Kepler Q2.1 SC data in the top left panel, where a clear peak is seen at 61.45 d-1. After pre-whitening by the highest peak, the rotational sidelobes at and become evident on the lower left panel. This frequency triplet is equally spaced and is evidence of an oblique dipole pulsation mode. This shows that the 12.51 d-1 peak seen in Fig. 3 is a Nyquist alias of this peak, since 61.45 - = 12.51, where is the Kepler LC sampling frequency. The top right panel of Fig. 4 therefore shows the same section of the amplitude spectrum for the entire Q0–17 Kepler LC data set, where the frequency resolution is the highest available. Of course, the amplitude is reduced because the integration times of the LC data are longer than the pulsation period. From Murphy (2012) we calculate the reduction factor to be , where is the number of data points per oscillation cycle; this explains the lower amplitude in the LC data when compared to the SC data. The bottom right panel then shows the amplitude spectrum of the LC data after prewhitening by , where the rotational sidelobes can be seen, along with residual amplitude around . This residual amplitude is a consequence of frequency variability over the 4-yr data set, as we show below.
| labels | frequency | amplitude | phase |
|---|---|---|---|
| d-1 | mag | radians | |
| rotation | |||
| pulsation – long cadence (LC) data | |||
| pulsation – short cadence (SC) data | |||
This triplet seen in Fig. 4 for both the SC and LC data is equally split by exactly the rotation frequency to better than 1. This is the signature of an oblique dipole pulsation mode. The three frequencies have been fitted to the data by a combination of linear and nonlinear least-squares. Table 2 shows the results where the frequency splitting has been set to be exactly the rotation frequency. A time zero point was selected to set the phases of the sidelobes equal, and we found that the phase of the central frequency is also equal, showing that the triplet is the result of pure amplitude modulation. This is typical of pure oblique dipole pulsation. We then find that the time of pulsation maximum, when all three frequencies of the triplet have the same phase, , coincides with maximum brightness of the rotational light modulation. That is shown by the phase of the rotational frequency, near , with that time zero point. Because we have fitted a cosine function, and the data are in magnitudes, the phase at maximum rotational brightness is radians. This can also be seen in the light curve, which we do not show here.
Maximum pulsation amplitude at rotational light minimum is expected for dipole oblique pulsation where the spots that produce the rotational light variations are aligned with the magnetic and pulsation poles. For KIC 4768731 the relationship differs by radians from this simplest case, suggesting that the spots, magnetic field pole and pulsation pole lie in the same plane, but are not completely aligned. This is consistent with the improved oblique pulsator model (Bigot & Kurtz, 2011).
We can constrain the pulsation geometry within the oblique pulsator model (Kurtz 1982; Bigot & Kurtz 2011) with the amplitudes of the components of the frequency triplet:
where is the rotational inclination, is the inclination of the magnetic pole to the rotation axis, , and are the amplitudes of the rotational sidelobes and central frequency. From this equation we obtain and from LC and SC data, respectively. Using the stellar radius and obtained from spectral analysis (Sect. 7) and the rotation period, we obtain values of ° and °. The angle between the magnetic and rotation axes is therefore relatively small. In addition, and only one pole is seen, hence the simple, almost sinusoidal rotational light variations.


To study the residual amplitude around seen for the LC data, we fitted to 20-d sections of the data by least-squares and examined the time series of amplitude and phase. Fig. 5 shows that the amplitude is stable over the 4-yr time span, and the phase is variable. Since phase and frequency variability are indistinguishable, we interpret this as frequency variability. This is the source of the residual amplitude in the amplitude spectrum that is unresolved from as seen in the bottom right panel of Fig. 4. Such frequency variability is known in many other roAp stars, as is discussed by Holdsworth et al. (2014b) for the roAp star KIC 7582608. The cause of such frequency variability is not yet known.
6 Spectroscopic Observations
To examine the abundances in detail and to investigate line profile variations as the star rotates, we obtained 33 high-resolution spectra.
Two high-resolution (=85 000) spectra covering the wavelength range 3780–9000Å were obtained using the fibre-fed High Efficiency and Resolution Mercator Echelle Spectrograph (HERMES; Raskin et al., 2011) mounted on the 1.2-m Mercator Telescope at the Roque de los Muchachos Observatory, La Palma. The data were reduced using the HERMES drs222%****␣KIC4768731.tex␣Line␣550␣****http://www.mercator.iac.es/instruments/hermes/hermesdrs.php pipeline software.
A further two high-resolution spectra with a resolution =67 000 covering the wavelength region 3660–7360Å were obtained with the 2.5-m Nordic Optical Telescope (NOT) using the FIbre-fed Echelle Spectrograph (FIES; Telting et al., 2014). These spectra were extracted with the bespoke data reduction package, fiestool333http://www.not.iac.es/instruments/fies/fiestool/.
A series of 26 high-resolution spectra were obtained in 2013 August using the coudé-échelle spectrograph attached to the 2.0-m telescope at the Thüringer Landessternwarte (TLS) Tautenburg, Germany. The spectrograph has a resolving power of = 63 000 and exposures cover the wavelength range from 4720–7360Å. The spectra were reduced using standard ESO midas packages. All spectra were corrected in wavelength for individual instrumental shifts by using a large number of telluric O2 lines.
Table 3 gives the dates of the observations, along with the rotational phase () at the time of the midpoint of the exposures and measured radial velocity (see Sect. 7.2). The rotational phase is obtained from the fractional part of , where phase zero is the time of maximum light.
A TLS spectrum of the companion star, KIC 4768748, obtained on 2014 June 6, revealed that the star is indeed a late-K giant. In addition, the radial velocity of this star is km s-1, compared to km s-1 for KIC 4768731 (See Sect. 7.2). Thus, we conclude that the two stars are not physically associated, KIC 4768748 is a background giant.
| Instrument | Date | Exp Time (s) | S/N | BJD (TDB) | RV (km s-1) | |
|---|---|---|---|---|---|---|
| HERMES | 2011 Jul 13 22:53:56 | 1900 | 87 | 2455756.45765 | 0.227 | 12.0 |
| FIES | 2013 Aug 04 00:43:06 | 2000 | 102 | 2456508.53370 | 0.597 | 12.3 |
| FIES | 2013 Aug 06 00:19:54 | 1748 | 112 | 2456510.51759 | 0.978 | 11.8 |
| HERMES | 2013 Aug 10 03:26:10 | 1800 | 80 | 2456514.64693 | 0.771 | 12.2 |
| TLS | 2013 Aug 14 22:59:41 | 1800 | 80 | 2456519.46185 | 0.695 | 12.3 |
| TLS | 2013 Aug 14 23:30:42 | 1800 | 73 | 2456519.48339 | 0.699 | 12.3 |
| TLS | 2013 Aug 15 00:01:43 | 1800 | 70 | 2456519.50493 | 0.703 | 12.4 |
| TLS | 2013 Aug 15 00:32:44 | 1800 | 63 | 2456519.52646 | 0.708 | 12.4 |
| TLS | 2013 Aug 15 01:41:49 | 1800 | 58 | 2456519.57444 | 0.717 | 12.3 |
| TLS | 2013 Aug 15 02:12:50 | 1800 | 49 | 2456519.59598 | 0.721 | 12.3 |
| TLS | 2013 Aug 15 02:43:51 | 1800 | 46 | 2456519.61752 | 0.725 | 11.7 |
| TLS | 2013 Aug 15 21:54:18 | 2400 | 108 | 2456520.41643 | 0.879 | 12.1 |
| TLS | 2013 Aug 16 01:58:32 | 2400 | 85 | 2456520.58604 | 0.911 | 12.7 |
| TLS | 2013 Aug 16 21:44:06 | 2400 | 95 | 2456521.40934 | 0.069 | 12.4 |
| TLS | 2013 Aug 17 01:59:27 | 2400 | 71 | 2456521.58667 | 0.103 | 12.4 |
| TLS | 2013 Aug 17 22:59:50 | 2400 | 89 | 2456522.46192 | 0.271 | 12.3 |
| TLS | 2013 Aug 21 19:54:11 | 2400 | 76 | 2456526.33295 | 0.014 | 11.9 |
| TLS | 2013 Aug 22 20:10:07 | 2400 | 72 | 2456527.34400 | 0.208 | 11.9 |
| TLS | 2013 Aug 23 19:51:48 | 2400 | 76 | 2456528.33127 | 0.398 | 12.2 |
| TLS | 2013 Aug 24 00:50:49 | 2417 | 70 | 2456528.53891 | 0.438 | 12.2 |
| TLS | 2013 Aug 26 20:58:21 | 2400 | 67 | 2456531.37743 | 0.983 | 12.4 |
| TLS | 2013 Aug 26 22:25:29 | 2400 | 78 | 2456531.43794 | 0.994 | 12.4 |
| TLS | 2013 Aug 26 23:06:30 | 2400 | 73 | 2456531.46642 | 1.000 | 12.3 |
| TLS | 2013 Aug 27 01:42:35 | 2400 | 60 | 2456531.57481 | 0.021 | 12.3 |
| TLS | 2013 Aug 27 20:42:41 | 2400 | 45 | 2456532.36653 | 0.172 | 12.1 |
| TLS | 2013 Aug 27 21:24:35 | 2400 | 98 | 2456532.39563 | 0.178 | 12.2 |
| TLS | 2013 Aug 27 22:07:30 | 2400 | 95 | 2456532.42543 | 0.184 | 12.3 |
| TLS | 2013 Aug 27 22:48:31 | 2400 | 84 | 2456532.45392 | 0.189 | 12.3 |
| TLS | 2013 Aug 27 23:29:32 | 2400 | 90 | 2456532.48240 | 0.195 | 12.4 |
| TLS | 2013 Aug 28 00:10:33 | 2400 | 76 | 2456532.51088 | 0.200 | 12.3 |
| TLS | 2014 Jun 17 23:10:15 | 2400 | 86 | 2456826.46545 | 0.628 | 12.4 |
| TLS | 2015 May 10 22:55:57 | 2400 | 84 | 2457153.45487 | 0.398 | 12.2 |
| TLS | 2015 May 11 01:07:39 | 2400 | 75 | 2457153.54733 | 0.416 | 12.1 |
Notes: The rotational phase () is given by the fractional part of , where phase zero is the time of maximum light. The signal-to-noise (S/N) ratio obtained using the DER_SNR algorithm (Stoehr et al., 2008).
7 Spectroscopic Analysis
A detailed spectroscopic analysis of the 2011 HERMES spectrum was presented in Niemczura et al. (2015) who identified KIC 4768731 as an Ap CrSrEu star. Table 4 summarizes the basic stellar parameters obtained for this star.
| Parameter | Value | Units |
|---|---|---|
| 8100 200 | K | |
| 4.0 0.2 | ||
| [Fe/H] | +0.31 0.24 | |
| 0.5 0.3 | km s-1 | |
| 14.8 1.6 | km s-1 | |
| 2.11 0.27 | M☉ | |
| 2.39 0.68 | R☉ | |
| 1.34 0.25 | L☉ | |
| 1.43 0.67 | mag. | |
| Sp. Type | A5 Vp SrCr(Eu) |
Note: Mass () and radius () are estimated using the Torres, Andersen & Giménez (2010) calibration.
7.1 Magnetic field
The ratio of the strengths of the Fe ii 6147.7Å and 6149.2Å lines can be used to estimate the mean magnetic field modulus (Mathys & Lanz, 1992). From the individual spectra we obtain a mean value for the relative intensification of the Fe ii 6147.7Å line with respect to the Fe ii 6149.2Å line, , of 0.08 0.03, where . This yields a mean magnetic field modulus, , of 2.7 0.8 kG using the empirical relationship given in Mathys & Lanz (1992). The error bar includes both the scatter in the observed values of and the uncertainty in the calibration for . The individual values for show no significant variation with rotational phase.
For the magnetic modulus obtained above the splitting of the 6149.2Å Zeeman doublet components would be 0.13 Å (Mathys et al., 1997). However, there is no sign of any splitting in our spectra due to the relatively large of this star.
7.2 Radial velocity variations?
A radial velocity (RV) for each spectrum was determined by cross-correlation with a synthetic spectrum covering the wavelength range 5000–5800Å using the parameters and abundances obtained from the detailed spectroscopic analysis. The barycentric radial velocities are given in Table 3 and the formal uncertainties are 0.2 km s-1. The average radial velocity from the spectra obtained in 2013 is 12.2 0.2 km s-1. However, Fehrenbach & Burnage (1990) reported a value of 291.2 km s-1 based on four observations obtained on 1984 June 27, 1986 August 2, 30 and 31. They used the Fehrenbach Objective Prisms on the Schmidt telescope at the Observatorie de Haute-Provence and the external error is given as 3.5 km s-1. The difference between the two epochs of 17 km s-1 suggests that the star could be a spectroscopic binary. The HERMES spectrum taken in July 2011 has a radial velocity that is consistent with those taken during August 2013. In June 2014 and May 2015 we obtained further TLS spectra and their RV values are consistent with the previous years (Fig. 6). Hence, we find no significant change in RV over a period of 4 yr.

7.3 Spectral line profile variations
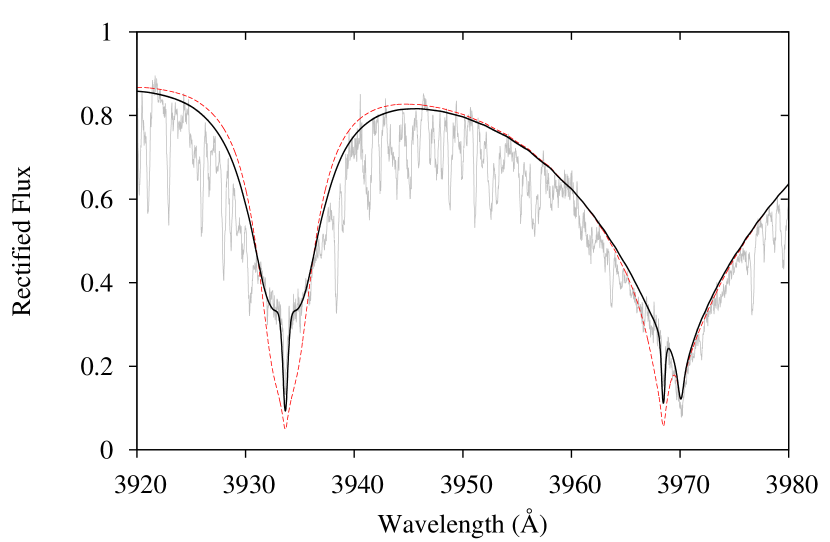
The individual spectra were examined for evidence of spectral line profile variations with rotational phase. The H and H Balmer lines and the Na D lines do not show any variation with phase. Similarly, the HERMES and FIES spectra of the Ca H and K lines do not show any variation with rotational phase, but have the unusual line profiles associated with abundance stratification in the atmosphere (Babel, 1994; Ryabchikova et al., 2002). The sharp cores of Ca H and K lines can be recreated using a step-shaped stratified abundance profile with [Ca/H] = +1.0 dex for layers deeper than and [Ca/H] = 2 dex for higher layers (Fig. 7). In contrast, a global enhancement of [Ca/H] = +0.5 dex is unable to reproduce the observed line profile.
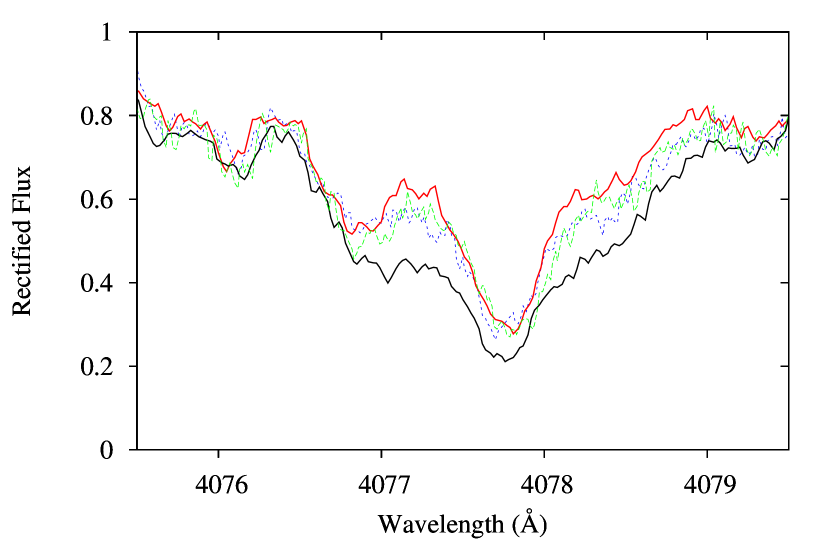
The HERMES and FIES spectra of the Sr ii 4077.7Å line shows considerable variation with rotational phase (Fig. 8). The line is strongest at = 0.978 and weakest at = 0.597. This is consistent with the weakest line strength occurring at or around = 0.5. The other two spectra are very similar, but their phases with respect to = 0.5 are 0.271 and +0.273, respectively. This suggests that there is a region of enhanced Sr crossing the stellar meridian at the time of maximum light ( = 0.0).
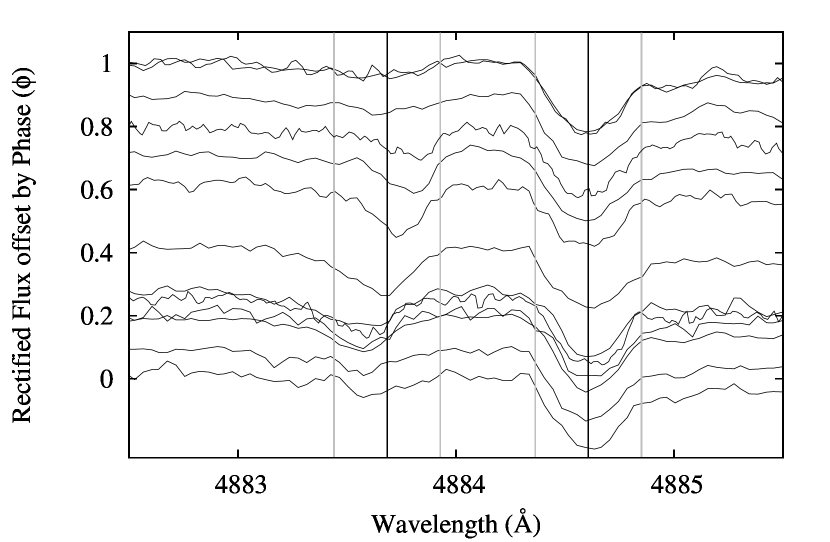
Fig. 9 shows the variation of the Y ii 4883.7Å line profile with rotational phase. There is a clear absorption feature moving redward with increasing phase, first appearing on the blue edge of the line profile at around = 0.1 and disappearing around = 0.9. The feature crosses the centre of the line around = 0.5, coinciding with the time of minimum light in the rotation cycle. Similar behaviour is seen in the Y ii 4900.1 and Ba ii 6141.7Å lines. This is in anti-phase to the variation of the Sr ii line.
| El | Aug 14–15 | Aug 15–16 | Aug 16–17 | Aug 23–24 | Aug 26–27 | Aug 27–28 | Solar | |
|---|---|---|---|---|---|---|---|---|
| () | () | () | () | () | () | |||
| C | 19 | 8.45 0.33 | 8.26 0.27 | 8.47 0.36 | 8.51 0.28 | 8.43 0.34 | 8.46 0.37 | 8.43 |
| N | 1 | 8.16 | 8.38 | 8.06 | 8.20 | 7.94 | 8.15 | 7.83 |
| O | 5 | 9.37 0.22 | 9.10 0.51 | 9.14 0.41 | 8.62 0.55 | 9.16 0.42 | 9.40 0.21 | 8.69 |
| Na | 3 | 7.13 0.06 | 7.08 | 7.21 0.12 | 6.81 0.31 | 7.22 0.12 | 6.77 | 6.24 |
| Mg | 8 | 7.83 0.18 | 7.87 0.21 | 7.82 0.20 | 7.73 0.17 | 7.86 0.20 | 7.84 0.16 | 7.60 |
| Al | 2 | 7.47 | 7.43 | 7.45 | 7.04 | 7.34 | 7.15 | 6.45 |
| Si | 34 | 7.53 0.27 | 7.66 0.24 | 7.75 0.21 | 7.45 0.26 | 7.74 0.23 | 7.56 0.22 | 7.51 |
| S | 9 | 7.34 0.43 | 7.56 0.49 | 7.57 0.25 | 7.02 0.26 | 7.27 0.33 | 7.22 0.34 | 7.12 |
| Ca | 18 | 6.81 0.21 | 6.77 0.20 | 6.88 0.21 | 6.80 0.18 | 6.81 0.20 | 6.83 0.22 | 6.34 |
| Sc | 7 | 2.45 0.10 | 2.47 0.35 | 2.46 0.33 | 2.66 0.45 | 2.30 0.35 | 2.53 0.45 | 3.15 |
| Ti | 42 | 5.08 0.29 | 5.00 0.28 | 5.13 0.25 | 5.12 0.24 | 5.17 0.24 | 5.19 0.27 | 4.95 |
| V | 8 | 5.10 0.30 | 5.17 0.30 | 5.19 0.28 | 5.14 0.30 | 5.22 0.28 | 5.21 0.24 | 3.93 |
| Cr | 111 | 7.36 0.18 | 7.50 0.18 | 7.51 0.17 | 7.21 0.16 | 7.55 0.17 | 7.38 0.19 | 5.64 |
| Mn | 17 | 5.77 0.35 | 5.82 0.36 | 5.72 0.32 | 5.79 0.28 | 5.84 0.34 | 5.69 0.30 | 5.43 |
| Fe | 142 | 7.79 0.18 | 7.83 0.18 | 7.83 0.17 | 7.80 0.19 | 7.81 0.18 | 7.83 0.18 | 7.50 |
| Co | 6 | 5.78 0.25 | 6.11 0.37 | 6.14 0.33 | 5.84 0.24 | 6.28 0.26 | 5.74 0.18 | 4.99 |
| Ni | 31 | 6.30 0.34 | 6.37 0.36 | 6.33 0.37 | 6.18 0.28 | 6.24 0.35 | 6.39 0.31 | 6.22 |
| Cu | 1 | 3.09 | 3.05 | 3.12 | 3.34 | 3.63 | 3.08 | 4.19 |
| Zn | 1 | 4.73 | 4.70 | 4.53 | 4.68 | 4.69 | 4.72 | 4.56 |
| Y | 9 | 3.05 0.24 | 2.74 0.39 | 2.90 0.25 | 3.12 0.21 | 2.82 0.20 | 2.79 0.35 | 2.21 |
| Zr | 3 | 3.60 | 4.67 0.77 | 4.36 0.69 | 3.49 | 3.48 | 4.27 0.58 | 2.58 |
| Ba | 2 | 2.50 | 1.81 | 1.87 | 2.52 | 1.80 | 2.05 | 2.18 |
| La | 2 | 1.60 | 1.34 | 1.91 | 0.77 | 1.23 | 1.75 | 1.10 |
| Nd | 6 | 2.34 0.15 | 2.24 0.02 | 2.31 0.14 | 2.19 0.24 | 2.40 0.02 | 2.28 0.06 | 1.42 |
| Eu | 3 | 2.65 0.31 | 2.50 0.11 | 2.33 0.36 | 1.93 0.50 | 2.47 0.34 | 2.20 0.26 | 0.52 |

Fig. 10 shows the variation of the Eu ii 6437.6Å line profile with rotational phase. The line is quite weak around = 0.4. By = 0.7 an absorption feature can be seen in the blue wing of the profile. As phase increases the feature moves redward across the line profile, reaching a maximum around = 0.0 when it is close to the line centre. The feature then moves to the red wing and weakens, disappearing around = 0.2. Similar behaviour is seen in other Eu lines. The variations in the Eu lines are in anti-phase with those for Y and Ba lines, but in phase with the Sr line.
To further investigate line strength variations with rotational phase, we selected six nights in 2013 August with multiple TLS spectra. For each night the spectra were co-added to produce a single nightly spectrum with signal-to-noise (S/N) ratios in the range 100 – 150. For each of the six spectra abundances were obtained using the same spectral synthesis methodology as Niemczura et al. (2015). The results of the spectral fitting are given in Table 5. The overall abundance pattern is consistent with that found by Niemczura et al. (2015) and with the spectral classification presented in Sect. 3: Cr is considerably enhanced, Eu is modestly enhanced, while Ca and Si are relatively normal. V and Co are also considerably enhanced and there is general modest ( dex) overabundance of most other transition-group elements, with the exception of Sc, which is depleted by over 0.5 dex. Several elements, Mg, Si, Cr, Co and Eu, have abundance variations in phase with rotation – they are strongest when the star is the brightest. In addition, the same behaviour was noted for the Sr line above. The Y and Ba lines, on the other hand, vary in anti-phase with rotation – they are strongest when the star is the faintest. Other elements, including Ca, Ti, V, Mn and Fe, show little variation with phase or the results are inconclusive.
To search for the presence of other rare earth elements, the individual TLS spectra from 2013 were co-added to produce a single spectrum with a S/N of 245. This spectrum was visually searched for lines due to various rare earth elements. With the exception of the already detected La, Nd and Eu, only tentative detections or upper limits were obtained (see Table 6).
| El | n | Solar | |
|---|---|---|---|
| La | 2 | 1.40 | 1.10 |
| Ce | 6 | 2.5 | 1.58 |
| Pr | 3 | 3.2: | 0.72 |
| Nd | 6 | 2.25 0.12 | 1.42 |
| Sm | 2 | 2.2: | 0.96 |
| Eu | 3 | 2.45 0.11 | 0.52 |
| Gd | 4 | 3.0: | 1.07 |
| Tb | 3 | 2.5 | 0.30 |
| Dy | 4 | 3.3 | 1.10 |
| Er | 2 | 3.5: | 0.92 |
| Tm | 2 | 2.5 | 0.10 |
| Yb | 6 | 3.5 | 0.84 |
| Lu | 5 | 2.0 | 0.10 |
The relatively large, and variable, scatter in the standard deviations of some of the abundances obtained is probably the result of the surface inhomogeneities and vertical stratification present in the atmosphere of this Ap star. A detailed spectral analysis taking into account surface inhomogeneities and abundance stratification will be presented in Niemczura, Shulyak et al. (in preparation).
8 Non-adiabatic oscillation modelling
The mechanism responsible for exciting the oscillations observed in roAp stars is still not fully understood. The opacity mechanism acting on the hydrogen ionization region leads to the excitation of high radial-order acoustic pulsations in models of cool Ap stars with fully radiative envelopes, where convection is assumed to be suppressed by the strong magnetic field (Balmforth et al., 2001). This mechanism has been shown to provide a promising explanation for the observed pulsations in roAp stars with pulsation frequencies below the acoustic cutoff (Cunha, 2002). However, in a fraction of the known roAp pulsators, the observed frequencies are too high to be driven in this way (Cunha et al., 2013) and an alternative mechanism needs to be considered, such as the effect of turbulent pressure suggested by Cunha et al. (2013) and recently found to be a likely explanation for pulsations in an Am star (Antoci et al., 2014).
The oscillation frequency observed in KIC 4768731 is below the acoustic cutoff frequency derived from models covering the region of the HR diagram where the star is located. To check if the opacity mechanism can drive the observed pulsation, and further constrain the global parameters of the star, we carried out a linear, non-adiabatic stability analysis of a grid of models covering that region of the HR diagram. Evolutionary tracks were produced with the mesa stellar evolution code (Paxton et al., 2013) for stellar masses in the range 1.6–2.4 M☉, in intervals of 0.05 M☉, and with initial mass fraction of hydrogen and helium of and , respectively. Mixing beyond the convective core during the main-sequence has been considered, taking the convective overshoot parameter defined in Paxton et al. (2013) (their equation (9)) to be . Only models with in the range 7850–8350 K were considered for the stability analysis (vertical dashed lines in Fig. 11). The mass, luminosity, and effective temperature extracted from the mesa models were used to generate the equilibrium models necessary for the non-adiabatic computations.
The non-adiabatic analysis followed closely that of Cunha et al. (2013), except that we have considered only their ‘polar’ models (models with fully radiative envelopes) as these are the models in which roAp-type pulsations are found to be driven by the opacity mechanism. Following that work, for each set of mass, luminosity, and effective temperature, we have considered four different case studies. In the first (or standard ) case the equilibrium model has a surface helium abundance of and an atmosphere that extends to a minimum optical depth of . Moreover, in the pulsation analysis a fully reflective boundary condition is applied at the surface for this case study. The other three case studies are obtained by swapping these properties, one at the time to: , , and a transmissive boundary condition. Together, these four case studies cover the main uncertainties in the modelling. If modes with frequencies similar to that observed in KIC 4768731 are found unstable in at least one of the case studies, then the corresponding model parameter set is identified as unstable at the observed frequency.
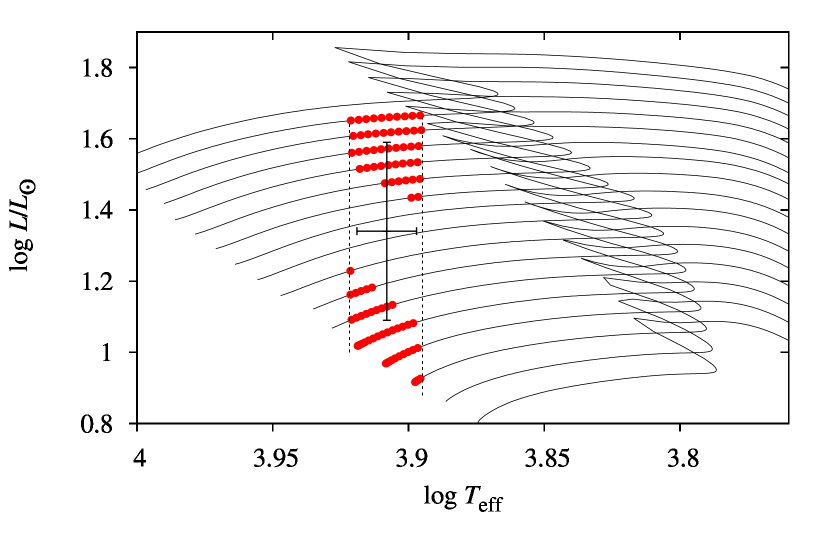
Models found to be unstable at the observed frequency are marked by filled-circles in Fig. 11. Inspection of this figure shows that there are two independent regions within the part of the HR diagram explored in which pulsations with the observed frequency are predicted to be excited. In the lower luminosity region, the modes excited at the observed frequency are of low radial-order, characteristic of -Scuti stars, while in the higher luminosity region they are of high radial-order, characteristic of roAp stars.
The non-adiabatic analysis performed here does not include the direct effect of the magnetic field on pulsations, but only its indirect effect through the suppression of convection in the stellar envelope. However, it is known from studies addressing the direct effect of the magnetic field that the coupling of acoustic and magnetic waves in the outer layers of roAp stars leads to wave energy losses through the dissipation of acoustic waves in the atmosphere (Sousa & Cunha, 2008) and magnetic waves in the interior (Cunha & Gough, 2000). In fact, Saio (2005) has shown that energy losses through the latter process are particularly significant for low radial-order modes. These modes are then stabilised, explaining their absence in roAp stars. If this is the case for KIC 4768731, then the lower luminosity unstable region shown in Fig. 11 is likely to be spurious, resulting from the non-inclusion of the direct effect of the magnetic field on pulsations in the non-adiabatic computations. Our non-adiabatic calculations thus point to KIC 4768731 being a relatively evolved and luminous star.
9 Discussion and conclusions
Given the identification of KIC 4768731 as an Ap star, the pulsation is almost certainly of the roAp type, and with a frequency of 61.45 d-1 (corresponding to a period of 23.43 min) this star only just misses out on being the longest period roAp star known (HD 177765; Alentiev et al. 2012, 23.56 min). Other low-frequency roAp stars, discovered from their low-amplitude radial velocity variations, include HD 116114 (21 min) and CrB (16.2 min) (Elkin et al., 2005b; Kurtz, Elkin & Mathys, 2007). All four of these stars occupy a similar location in the HR diagram, around = 8000 K and = 4.0, with KIC 4768731 having the shortest rotation period.
Spectral lines from rare earth elements are usually strong in Ap stars (Wolff, 1983). However, we find a distinct lack of significant overabundances in rare earth elements compared to those found in other roAp stars of similar effective temperatures: HD 177765 (Alentiev et al., 2012), HD 116114 and CrB (Ryabchikova et al., 2004) (Fig. 12). A similar conclusion was found for another, cooler, Kepler roAp star, KIC 10195926 (Elkin et al., 2014).

The Mg, Si, Cr, Co, Sr, and Eu lines in KIC 4768631 show line strength variations in phase with rotation – they are strongest when the star is the brightest. The Y and Ba lines, on the other hand, vary in anti-phase with rotation – they are strongest when the star is the faintest. Other elements, including Ca and Fe, show little variation with rotational phase or the results are inconclusive. The pulsation analysis has shown that the pulsation axis is in the same plane as the abundance spots that lead to rotational light maximum, but not completely aligned. The pulsations are coincident with light maximum, hence with Sr ii maximum, and out of phase with Y ii maximum. Where the pulsation axis, magnetic poles and spots are located is problematic, but they appear to lie in a single plane, which is consistent with the improved oblique pulsator model of Bigot & Kurtz (2011). KIC 4768631, however, is unusual in having pulsation maximum at maximum rotational brightness. Many roAp stars have pulsation maximum at rotational light minimum, which can be associated with strong rare earth element spots.
It tends to be the slow rotators, with periods longer than one month, that have aligned rotation and magnetic axes (Landstreet & Mathys, 2000), or the more evolved stars, since North (1985) found essentially random angles of alignment for near-ZAMS stars (for a review see Murphy, 2014). The former is ruled out by the 5.2 d rotation period, but the latter case is a possibility since the non-adiabatic modelling suggests that the roAp-type pulsations would be expected for the star nearer the terminal-age main-sequence (TAMS) than the ZAMS. The luminosity, and hence age, of KIC 4768731 is, however, uncertain due to the lack of an independent distance determination. Furthermore, Ap (SrCrEu) stars are supposed to take about half their main-sequence lifetime to develop their peculiarities (Abt, 2009), so the age is of interest. If Abt is right, then perhaps this star is not old enough to have accumulated very anomalous rare earth elements. Hence, KIC 4768731 may prove to be an interesting test case for the development of chemical peculiarities in Ap stars.
Acknowledgements
This work made use of pyke (Still & Barclay, 2012), a software package for the reduction and analysis of Kepler data. This open source software project is developed and distributed by the NASA Kepler Guest Observer Office.
Part of this work is based on observations obtained with the HERMES spectrograph, which is supported by the Fund for Scientific Research of Flanders (FWO), Belgium, the Research Council of K.U.Leuven, Belgium, the Fonds National de la Recherche Scientifique (F.R.S.-FNRS), Belgium, the Royal Observatory of Belgium, the Observatoire de Genée, Switzerland and the Thüringer Landessternwarte Tautenburg, Germany.
Calculations have been carried out in Wrocław Centre for Networking and Supercomputing (http://www.wcss.pl), grant No. 214.
EN acknowledges support from the NCN grant No. 2014/13/B/ST9/00902. SJM acknowledges research support by the Australian Research Council. Funding for the Stellar Astrophysics Centre is provided by the Danish National Research Foundation (grant agreement no.: DNRF106). The research is supported by the ASTERISK project (ASTERoseismic Investigations with SONG and Kepler) funded by the European Research Council (grant agreement no.: 267864). MSC is supported by FCT through research grant UID/FIS/04434/2013 and through the Investigador FCT contract of reference IF/00894/2012 and POPH/FSE (EC) by FEDER funding through the program COMPETE. Funds for this work were provided also by the EC, under FP7, through the project FP7-SPACE-2012-31284. LAB wishes to thank the National Research Foundation of South Africa for financial support. MB is F.R.S.-FNRS Postdoctoral Researcher, Belgium AOT acknowledges support from Sonderforschungsbereich SFB 881 “The Milky Way System” (subprojects A4 and A5) of the German Research Foundation (DFG).
References
- Abt (2009) Abt H. A., 2009, AJ, 138, 28
- Alentiev et al. (2012) Alentiev D., Kochukhov O., Ryabchikova T., Cunha M., Tsymbal V., Weiss W., 2012, MNRAS, 421, L82
- Antoci et al. (2014) Antoci V. et al., 2014, ApJ, 796, 118
- Asplund et al. (2009) Asplund M., Grevesse N., Sauval A. J., Scott P., 2009, ARA&A, 47, 481
- Babcock (1947) Babcock H. W., 1947, ApJ, 105, 105
- Babel (1994) Babel J., 1994, A&A, 283, 189
- Balmforth et al. (2001) Balmforth N. J., Cunha M. S., Dolez N., Gough D. O., Vauclair S., 2001, MNRAS, 323, 362
- Balona et al. (2011a) Balona L. A. et al., 2011a, MNRAS, 413, 2651
- Balona et al. (2011b) —, 2011b, MNRAS, 410, 517
- Bigot & Kurtz (2011) Bigot L., Kurtz D. W., 2011, A&A, 536, A73
- Bychkov, Bychkova & Madej (2009) Bychkov V. D., Bychkova L. V., Madej J., 2009, MNRAS, 394, 1338
- Cannon (1925) Cannon A. J., 1925, Annals of Harvard College Observatory, 100, 17
- Cunha (2002) Cunha M. S., 2002, MNRAS, 333, 47
- Cunha et al. (2013) Cunha M. S., Alentiev D., Brandão I. M., Perraut K., 2013, MNRAS, 436, 1639
- Cunha & Gough (2000) Cunha M. S., Gough D., 2000, MNRAS, 319, 1020
- Debosscher et al. (2011) Debosscher J., Blomme J., Aerts C., De Ridder J., 2011, A&A, 529, A89
- Donati & Landstreet (2009) Donati J.-F., Landstreet J. D., 2009, ARA&A, 47, 333
- Elkin et al. (2010) Elkin V. G., Kurtz D. W., Mathys G., Freyhammer L. M., 2010, MNRAS, 404, L104
- Elkin et al. (2005a) Elkin V. G., Kurtz D. W., Mathys G., Wade G. A., Romanyuk I. I., Kudryavtsev D. O., Smolkin S., 2005a, MNRAS, 358, 1100
- Elkin et al. (2014) Elkin V. G., Kurtz D. W., Shibahashi H., Saio H., 2014, MNRAS, 444, 1344
- Elkin et al. (2005b) Elkin V. G., Riley J. D., Cunha M. S., Kurtz D. W., Mathys G., 2005b, MNRAS, 358, 665
- Fehrenbach & Burnage (1990) Fehrenbach C., Burnage R., 1990, A&AS, 83, 91
- Girish et al. (2001) Girish V. et al., 2001, A&A, 380, 142
- González et al. (2008) González J. F., Hubrig S., Kurtz D. W., Elkin V., Savanov I., 2008, MNRAS, 384, 1140
- Gray & Corbally (2009) Gray R. O., Corbally, J. C., 2009, Stellar Spectral Classification. Princeton University Press
- Gruberbauer et al. (2008) Gruberbauer M. et al., 2008, A&A, 480, 223
- Handler et al. (2002) Handler G. et al., 2002, MNRAS, 330, 153
- Handler et al. (2006) —, 2006, MNRAS, 366, 257
- Høg et al. (2000) Høg E. et al., 2000, A&A, 355, L27
- Holdsworth (2015) Holdsworth D. L., 2015, PhD thesis, Keele University, UK
- Holdsworth et al. (2014a) Holdsworth D. L. et al., 2014a, MNRAS, 439, 2078
- Holdsworth et al. (2014b) Holdsworth D. L., Smalley B., Kurtz D. W., Southworth J., Cunha M. S., Clubb K. I., 2014b, MNRAS, 443, 2049
- Huber et al. (2008) Huber D. et al., 2008, A&A, 483, 239
- Kochukhov et al. (2013) Kochukhov O., Alentiev D., Ryabchikova T., Boyko S., Cunha M., Tsymbal V., Weiss W., 2013, MNRAS, 431, 2808
- Kochukhov et al. (2009) Kochukhov O., Bagnulo S., Lo Curto G., Ryabchikova T., 2009, A&A, 493, L45
- Kochukhov et al. (2002) Kochukhov O., Landstreet J. D., Ryabchikova T., Weiss W. W., Kupka F., 2002, MNRAS, 337, L1
- Kochukhov et al. (2008a) Kochukhov O., Ryabchikova T., Bagnulo S., Lo Curto G., 2008a, Contributions of the Astronomical Observatory Skalnate Pleso, 38, 423
- Kochukhov et al. (2008b) —, 2008b, A&A, 479, L29
- Kreidl et al. (1991) Kreidl T. J., Kurtz D. W., Bus S. J., Kuschnig R., Birch P. B., Candy M. P., Weiss W. W., 1991, MNRAS, 250, 477
- Kurtz (1982) Kurtz D. W., 1982, MNRAS, 200, 807
- Kurtz et al. (2011) Kurtz D. W. et al., 2011, MNRAS, 414, 2550
- Kurtz et al. (2006) Kurtz D. W., Elkin V. G., Cunha M. S., Mathys G., Hubrig S., Wolff B., Savanov I., 2006, MNRAS, 372, 286
- Kurtz, Elkin & Mathys (2005) Kurtz D. W., Elkin V. G., Mathys G., 2005, MNRAS, 358, L6
- Kurtz, Elkin & Mathys (2007) —, 2007, MNRAS, 380, 741
- Kurtz et al. (2007) Kurtz D. W., Elkin V. G., Mathys G., van Wyk F., 2007, MNRAS, 381, 1301
- Kurtz et al. (2002) Kurtz D. W. et al., 2002, MNRAS, 330, L57
- Kurtz & Martinez (1994) Kurtz D. W., Martinez P., 1994, Information Bulletin on Variable Stars, 4013, 1
- Kurtz & Martinez (1995) —, 1995, Information Bulletin on Variable Stars, 4209, 1
- Kurtz et al. (1996) Kurtz D. W., Martinez P., Koen C., Sullivan D. J., 1996, MNRAS, 281, 883
- Kurtz, Martinez & Tripe (1994) Kurtz D. W., Martinez P., Tripe P., 1994, MNRAS, 271, 421
- Kurtz et al. (1997a) Kurtz D. W., Martinez P., Tripe P., Hanbury A. G., 1997a, MNRAS, 289, 645
- Kurtz et al. (1994) Kurtz D. W., Sullivan D. J., Martinez P., Tripe P., 1994, MNRAS, 270, 674
- Kurtz et al. (1997b) Kurtz D. W., van Wyk F., Roberts G., Marang F., Handler G., Medupe R., Kilkenny D., 1997b, MNRAS, 287, 69
- Landstreet & Mathys (2000) Landstreet J. D., Mathys G., 2000, A&A, 359, 213
- Martinez & Kauffmann (1990) Martinez P., Kauffmann G., 1990, Information Bulletin on Variable Stars, 3507, 1
- Martinez, Koen & Sullivan (1998) Martinez P., Koen C., Sullivan D. J., 1998, MNRAS, 300, 188
- Martinez & Kurtz (1990) Martinez P., Kurtz D. W., 1990, Information Bulletin on Variable Stars, 3509, 1
- Martinez & Kurtz (1992) —, 1992, Information Bulletin on Variable Stars, 3750, 1
- Martinez, Kurtz & Ashley (1993) Martinez P., Kurtz D. W., Ashley R., 1993, Information Bulletin on Variable Stars, 3844, 1
- Martinez, Kurtz & Heller (1990) Martinez P., Kurtz D. W., Heller C. H., 1990, MNRAS, 246, 699
- Martinez et al. (1995) Martinez P., Kurtz D. W., Hoffman M. J. H., van Wyk F., 1995, MNRAS, 276, 1435
- Martinez et al. (1990) Martinez P., Kurtz D. W., Kauffmann G., Jonson A. C., 1990, Information Bulletin on Variable Stars, 3506, 1
- Martinez, Kurtz & Kauffmann (1991) Martinez P., Kurtz D. W., Kauffmann G. M., 1991, MNRAS, 250, 666
- Martinez et al. (1993) Martinez P., Kurtz D. W., Kreidl T. J., Koen C., van Wyk F., Marang F., Roberts G., 1993, MNRAS, 263, 273
- Martinez, Kurtz & van Wyk (1994) Martinez P., Kurtz D. W., van Wyk F., 1994, MNRAS, 271, 305
- Martinez et al. (1998) Martinez P., Meintjes P., Ratcliff S. J., Engelbrecht C., 1998, A&A, 334, 606
- Mason et al. (2001) Mason B. D., Wycoff G. L., Hartkopf W. I., Douglass G. G., Worley C. E., 2001, AJ, 122, 3466
- Mathys et al. (1997) Mathys G., Hubrig S., Landstreet J. D., Lanz T., Manfroid J., 1997, A&AS, 123, 353
- Mathys, Kurtz & Elkin (2007) Mathys G., Kurtz D. W., Elkin V. G., 2007, MNRAS, 380, 181
- Mathys & Lanz (1992) Mathys G., Lanz T., 1992, A&A, 256, 169
- Matthews, Wehlau & Kurtz (1987) Matthews J. M., Wehlau W. H., Kurtz D. W., 1987, ApJ, 313, 782
- Mkrtichian et al. (2008) Mkrtichian D. E., Hatzes A. P., Saio H., Shobbrook R. R., 2008, A&A, 490, 1109
- Morgan (1933) Morgan W. W., 1933, ApJ, 77, 330
- Murphy (2012) Murphy S. J., 2012, MNRAS, 422, 665
- Murphy (2014) —, 2014, PhD thesis, University of Central Lancashire, UK
- Murphy, Shibahashi & Kurtz (2013) Murphy S. J., Shibahashi H., Kurtz D. W., 2013, MNRAS, 430, 2986
- Niemczura et al. (2015) Niemczura E. et al., 2015, MNRAS, 450, 2764
- North (1985) North P., 1985, A&A, 148, 165
- Paxton et al. (2013) Paxton B. et al., 2013, ApJS, 208, 4
- Perryman & ESA (1997) Perryman M. A. C., ESA, eds., 1997, ESA Special Publication, Vol. 1200, The HIPPARCOS and TYCHO catalogues
- Raskin et al. (2011) Raskin G. et al., 2011, A&A, 526, A69
- Renson & Manfroid (2009) Renson P., Manfroid J., 2009, A&A, 498, 961
- Roeser, Demleitner & Schilbach (2010) Roeser S., Demleitner M., Schilbach E., 2010, AJ, 139, 2440
- Ryabchikova et al. (2004) Ryabchikova T., Nesvacil N., Weiss W. W., Kochukhov O., Stütz C., 2004, A&A, 423, 705
- Ryabchikova et al. (2002) Ryabchikova T., Piskunov N., Kochukhov O., Tsymbal V., Mittermayer P., Weiss W. W., 2002, A&A, 384, 545
- Saio (2005) Saio H., 2005, MNRAS, 360, 1022
- Smith (1996) Smith K. C., 1996, Ap&SS, 237, 77
- Sousa & Cunha (2008) Sousa S. G., Cunha M. S., 2008, MNRAS, 386, 531
- Stȩpień (2000) Stȩpień K., 2000, A&A, 353, 227
- Still & Barclay (2012) Still M., Barclay T., 2012, Astrophysics Source Code Library, 1208.004
- Stoehr et al. (2008) Stoehr F. et al., 2008, in Astronomical Society of the Pacific Conference Series, Vol. 394, Astronomical Data Analysis Software and Systems XVII, Argyle R. W., Bunclark P. S., Lewis J. R., eds., p. 505
- Telting et al. (2014) Telting J. H. et al., 2014, Astronomische Nachrichten, 335, 41
- Torres, Andersen & Giménez (2010) Torres G., Andersen J., Giménez A., 2010, A&A Rev., 18, 67
- Watson (2006) Watson C. L., 2006, Society for Astronomical Sciences Annual Symposium, 25, 47
- Wolff (1983) Wolff S. C., 1983, The A-type stars: problems and perspectives. NASA SP-463
- Zacharias et al. (2013) Zacharias N., Finch C. T., Girard T. M., Henden A., Bartlett J. L., Monet D. G., Zacharias M. I., 2013, AJ, 145, 44