On the Angular Resolution of the AGILE gamma-ray imaging detector
Abstract
We present a study of the Angular Resolution of the AGILE gamma-ray imaging detector (GRID) that is operational in space since April 2007. The AGILE instrument is made of an array of 12 planes each equipped with a Tungsten converter and Silicon microstrip detectors and is sensitive in the energy range 50 MeV - 10 GeV. Among the space instruments devoted to gamma-ray astrophysics, AGILE uniquely exploits an analog readout system with dedicated electronics coupled with Silicon detectors. We show the results of Monte Carlo simulations carried out to reproduce the gamma-ray detection by the GRID, and we compare them to in-flight data. We use the Crab (pulsar Nebula) system for discussion of real data performance, since its energy spectrum is representative of the majority of gamma-ray sources. For Crab-like spectrum sources, the GRID angular resolution (FWHM of at 100 MeV; at 1 GeV; integrating the full energy band from 100 MeV to tens of GeV) is stable across a large field of view, being characterized by a flat response up to 30∘ off-axis. A comparison of the angular resolution obtained by the two operational gamma-ray instruments, AGILE-GRID and Fermi-LAT, is interesting in view of future gamma-ray missions, that are currently under study. The two instruments exploit different detector configurations affecting the angular resolution: the former being optimized in the readout and track reconstruction especially in the low-energy band, the latter in terms of converter thickness and power consumption. We show that, despite these differences, the angular resolution of both instruments is very similar between 100 MeV and a few GeV.
1 Introduction
Gamma-ray astrophysics in space enormously advanced since the first detection of photons above 100 MeV (Kraushaar et al., 1972). The progression of space missions and instruments over the last decades (OSO-3, SAS-2, COS-B, EGRET on board of the Compton Gamma-Ray Observatory) led to improvements of the overall detector performance, in terms of both angular resolution and sensitivity. In addition to this, the progressively wider Field-of-View (FoV) allowed a continuous monitoring of the variable gamma-ray sky. Following the early cosmic gamma-ray detection by the OSO-3 satellite (Kraushaar et al., 1972), the first gamma-ray telescope SAS-2 launched in 1972 reached an angular resolution of a few degrees (Fichtel et al., 1975). This mission was followed by the European mission COS-B, launched in 1975 August 8 and operational for 7 years (Mayer-Hasselwander et al., 1979; Swanenburg et al., 1981). The Compton Gamma-Ray Observatory (CGRO), active between 1991-2000, provided the first complete investigation of the gamma-ray sky. In particular, CGRO hosted the Energetic Gamma-Ray Experiment Telescope (EGRET), operating in the energy range 30 MeV - 30 GeV Fichtel & Trombka (1997); Thompson et al. (1993, 1998). Pre-AGILE/Pre-Fermi space instruments were mostly based on spark chamber technology.
Further improvements to the overall
performance of gamma-ray detectors in space became possible with
the advent of solid-state Silicon
detector technology. The scientific objectives of the new generation of instruments
required the following enhancements: (1) improving the gamma-ray angular resolution near 100
MeV by at least a factor of 2-3 compared to EGRET; (2) obtaining
the largest possible FoV at 100 MeV reaching 2.5-3
sr ; (3) increasing flux sensitivity near 100 MeV.
The current generation of gamma-ray space instruments, AGILE-GRID (Gamma-Ray Imaging Detector) and Fermi-LAT
(Large Area Telescope), launched in April 2007 and June
2008 respectively, were designed to achieve these objectives.
Both instruments
make use of tungsten-silicon detectors for the
conversion and detection of gamma-ray photons, having a common overlapping
energy range in the MeV - 10 GeV band
(Tavani et al., 2009; Atwood et al., 2009).
The gamma-ray
detector is structured to form a “Silicon Tracker” made of
several trays, each containing a tungsten layer (used as
converter of the incident -ray photon into an
e+/e- pair) and two silicon strip layers (used to track
the the e+/e- pair path across the instrument, through
their (x,y) projections along each tray). The detected tracks are
identified and fitted by a Kalman filter that allows for the
reconstruction of the original direction and energy of the
incident photon. The main source of contamination in the
detection of -ray photons is then by charged particle
tracks, which can be confused with e+/e- pairs. For this
reason, background rejection filters
are used both on-board and on-ground, to process the data and
obtain a final discrimination and classification of the events.
An important parameter in the assessment of the overall instrument scientific performance is the resulting angular resolution, i.e. the minimum distance at which two close sources are distinguished as separated. The Point Spread Function (PSF) describes the response of an imaging instrument to a point source and the angular resolution is usually described by either the Full Width at Half Maximum (FWHM) of the PSF radial profile or the 68 containment radius (CR68%) of the PSF. Key parameters of the instrument configuration affecting the angular resolution of -ray solid-state silicon detectors are:
-
•
the size of the silicon strips (the pitch) and the silicon detector readout system (e.g., either digital or analog) resulting in different effective spatial resolution of the particle trajectory due to charge coupling between adjacent silicon strips;
-
•
the distance between consecutive silicon planes that, combined with the spatial resolution, defines the limiting angular resolution;
-
•
the thickness of tungsten layers promoting gamma-ray photon conversion, and at the same time inducing multiple scattering that leads to a degradation of the charged particle tracks;
-
•
the reconstruction and event classification algorithms.
Table A1 in the Appendix summarizes the main characteristics of the AGILE and Fermi gamma-ray detectors, whose configurations are different in several ways: the former being optimized in the readout and track reconstruction especially in the low energy band, the latter in terms of converter thickness, geometrical area, and power consumption. An important difference between the two instruments, that can be crucial for the scientific performance of the instrument, is the readout system (analog for the AGILE-GRID and digital for Fermi-LAT).
In the following sections, we focus on the characterization of the AGILE-GRID angular resolution both from simulations and from in-flight data. In section 2 we define the parameters that are used across the paper to describe the instrument angular resolution; section 3 describes the Monte Carlo (MC) simulations setup and data processing pipeline; section 4 shows the results from the MC simulations; section 5 compares the results of the simulation with the in-flight data angular resolution. This paper complements the work by Chen et al. (2013): here we focus on simulations characterizing the overall performance of the GRID instrument and in a special study of Crab-like sources, reproducing the behaviour of the majority of detected cosmic gamma-ray sources; we also present a direct comparison of AGILE and Fermi in-flight data for the Crab111The case of the Vela pulsar has been addressed by Chen et al. (2013) and (Ackermann et al., 2013)., and discuss the results concerning the angular resolution in terms of the different instrument configurations (section 6), which can be crucial in the study of future missions.
2 The Angular Resolution
For an imaging telescope, the response in terms of reconstruncted positions
of a set of photons from a point-like source in the sky defines its Point Spread
Function (PSF). Since this function can be considered azymuthally
symmetric in -ray telescopes for incidence angle within 30∘ as used in this paper,
the effect of
the dispersion can be described as a function of one parameter, the angular
distance between reconstructed and nominal direction.
Defining the PSF radial profile, P(),
as the probability distribution per steradian of measuring an incoming photon
at a given angular distance
from its true direction, we have therefore:
PSF()=2sin()).
In the following, we adopt two parameters widely used in the literature to assess the angular resolution in terms of the “width” of the PSF (e.g. Thompson et al., 1993):
-
•
the Full Width at Half Maximum (FWHM) of the probability distribution per steradian, )
-
•
the 68% Containment Radius (CR68%) of the probability distribution, PSF().
The CR68% is strongly related to the source image compactness, taking into account the whole contribution of source profile and being more affected by possible extended tails; while the FWHM is mainly determined by the central core emission of the source.
3 Setup and data processing of the AGILE simulated data
In order to fully understand how the instrument configuration and
the data analysis pipeline affect the final angular resolution of a gamma-ray
telescope, we carried out dedicated MC simulations of the
AGILE-GRID analyzing simulated data with the same pipeline
used to process in-flight data. The simulations were carried out using an
available simulation tool (“GAMS”, GEANT AGILE
MC Simulator; Cocco et al., 2002; Longo et al., 2002), implemented during the
development phase of the AGILE mission.
The tool makes use of the GEANT3 environment222
http://wwwasd.web.cern.ch/wwwasd/geant/index.html
and takes into account all the main components of the
AGILE instrument configuration: the spacecraft (bus) MITA
and the AGILE payload,
consisting of the CsI Mini-Calorimeter, the silicon-tungsten
Tracker, the Anti-Coincidence system, the X-ray detector (Super-AGILE), the thermal shield,
the mechanical structure and the lateral electronics boards.
The tool allows to simulate a parallel front of given direction
for both charged particles and/or photons and its interactions across
the instruments. The spectral energy distribution of the front can
be monochromatic or with any given law.
The simulated tracks are then processed by the
DHSIM, the Data Handling SIMulator Argan et al. (2004, 2008), which
implements the on-board algorithms for a first track reconstruction,
event classification and background rejection
(Giuliani et al., 2006). The DHSIM output is a data file in the same
format as the AGILE in-flight telemetry and can be processed
using the same pipeline as for real data analysis.
Further background rejection techniques are applied to the data on ground,
producing the final classification of the events. The
currently used filter for the scientific analysis of the AGILE-GRID data (“FM3.119”) was used in this paper also for the
processing of the simulated data.
Each simulation contains photons that cross
the tracker and the data are analyzed with the same pipeline as for real data.
Typical efficiency after background rejection within 30∘ off-axis angle
is , leaving therefore a set of events classified
as photons and used for our calculations in the paper.
4 The Angular Resolution for simulated AGILE-GRID data
With the aim of investigating the dependence of the telescope angular resolution
upon the energy of incoming photons and their incident direction in the FoV,
we carried out simulations of parallel fronts of photons by varying
those parameters.
We describe the incident direction as the composition of a
zenith angle (i.e. the angular distance of the
incoming photon direction from the vertical axis of the Tracker,
also named off-axis angle) and an azimuthal angle (i.e.,
the angular distance between a given axis in the instrument plane
and the projection of the incoming direction in the plane). Since the detector
response is mostly azimuthally symmetric, we expect the main dependence
to be upon .
Simulations were carried out for the following values of these
angles: 333For the on-axis case we use a value of
,
since the case of induces a singularity in the software that generates the parallel front of
photons. For our purposes well resembles the on-axis case.;
. Two different
sets of simulations were performed:
-
•
parallel fronts of monochromatic photons of energies 50, 100, 200, 400, 1000, 5000 MeV;
-
•
parallel fronts of photons with a Crab-like photon spectrum of the type , in the energy range 30 MeV - 50 GeV.
The simulated data are analysed with the same pipeline as for the real data. In particular data were analysed using the most recent pipeline for the data processing (“BUILD21”) and instrument response functions (“I0023”).
AGILE-GRID PSF HWHM
| Centroid | Energy | Err | ||||
|---|---|---|---|---|---|---|
| Energy | Band | |||||
| (MeV) | (MeV) | (deg) | (deg) | (deg) | (deg) | (deg) |
| 50 | 30 - 70 | 4.0 | 4.5 | 4.5 | 4.5 | 0.5 |
| 100 | 70 - 140 | 2.25 | 2.25 | 2.5 | 2.25 | 0.25 |
| 200 | 140 - 300 | 1.1 | 1.2 | 1.3 | 1.2 | 0.1 |
| 400 | 300 - 700 | 0.7 | 0.7 | 0.7 | 0.7 | 0.1 |
| 1000 | 700 - 1700 | 0.4 | 0.4 | 0.4 | 0.4 | 0.1 |
| 5000 | 1700 - 10000 | 0.2 | 0.2 | 0.2 | 0.2 | 0.1 |
AGILE-GRID PSF CR68%
| Centroid | Energy | Err | ||||
|---|---|---|---|---|---|---|
| Energy | Band | |||||
| (MeV) | (MeV) | (deg) | (deg) | (deg) | (deg) | (deg) |
| 50 | 30 - 70 | 7.5 | 7.5 | 8.5 | 8.5 | 0.5 |
| 100 | 70 - 140 | 4.3 | 4.3 | 4.7 | 5.0 | 0.25 |
| 200 | 140 - 300 | 2.2 | 2.2 | 2.6 | 2.7 | 0.1 |
| 400 | 300 - 700 | 1.2 | 1.2 | 1.3 | 1.4 | 0.1 |
| 1000 | 700 - 1700 | 0.6 | 0.6 | 0.6 | 0.7 | 0.1 |
| 5000 | 1700 - 10000 | 0.3 | 0.3 | 0.3 | 0.3 | 0.1 |
4.1 Monochromatic photons
Monochromatic simulated data can be used for an ideal characterization of the instrument response and were simulated for different energies and different incident directions as previously described.
According to the definitions given in section 2, Table 2 and 2 show the values obtained for the HWHM444Here we show the HWHM in place of the FWHM used in the figures in order to help for a direct comparison with the CR68% and in the identification of the width of the radial profile (see e.g. Fig 2, right panel). (calculated from the PSF radial profile) and for the CR68% (calculated from the PSF) for different energies and different off-axis angles. We use both parameters for symplifing the comparison with previous papers, related both to gamma rays or to other wavelengths. In the rest of the paper we prefer adopting the FWHM to describe the angular resolution of the instruments in order to be more compliant with the definition in the multi-frequency domain.
Note that for this analysis we do not fit the PSF with any specific function, we just obtain the above parameters from the raw distribution of the reconstructed directions (see e.g. Fig. 2 right panel). The source radial profile is given by the average source counts within circular crowns of increasing radii, centered at the source centroid. The instrumental background counts are subtracted by evaluating their contribution in a circular crown at distance large enough to avoid contamination by the source tails (see e.g. Fig. 4). In Tables 2 and 2 we also report the intrinsic error in the estimate, given by the bin size of the profile, which has a minimum value of . This value is the minimum bin size allowed for the generation of typical count maps in the AGILE real data for high significance sources. At the same time this value allowed us to have a statistical significance well above 5- per bin in the radial profiles used to calculate the FWHM with the adopted number of simulated input events.
Table 2 shows that the AGILE angular resolution, as inferred from the FWHM, is stable across the instrument field of view up to of off-axis angle. Table 2 shows that, on the contrary, the CR68% increases slightly with off-axis angle below 1000 MeV, since this parameter is much more affected by tails in the radial profile than the FWHM. This is expected, since at off-axis angle tracks pass through much more material compared to the on-axis case: this causes a higher dispersion in the reconstructed direction due to the effect of multiple scattering, more pronounced below 1000 MeV (see Sec. 6).


4.2 Simulations of Crab-like sources
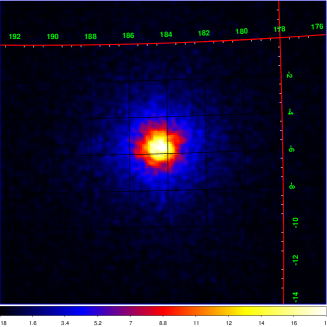
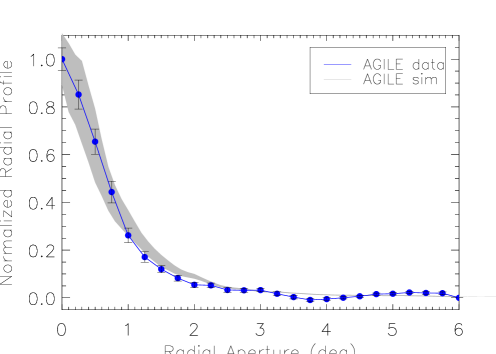
Simulations of Crab-like spectrum sources were carried out as previously described and, as an example, Fig. 2 shows a count map obtained from the MC simulated data for the 100 - 400 MeV energy band at the incident direction (left panel) and the average radial profile of the source (right panel). The map was obtained by the simulated event list using the same pipeline as that for producing real data maps.

HWHM for the Crab simulations
| Centroid | Energy | Err | ||||||
|---|---|---|---|---|---|---|---|---|
| Energy | Band | |||||||
| (MeV) | (MeV) | (deg) | (deg) | (deg) | (deg) | (deg) | (deg) | (deg) |
| 50 | 30 - 70 | 3.5 | 3.5 | 3.0 | 3.0 | 3.0 | 4.0 | 0.5 |
| 100 | 70 - 140 | 2.0 | 2.0 | 2.0 | 2.0 | 2.4 | 2.4 | 0.4 |
| 200 | 140 - 300 | 1.0 | 1.2 | 1.2 | 1.2 | 1.4 | 1.4 | 0.2 |
| 400 | 300 - 700 | 0.6 | 0.6 | 0.8 | 0.8 | 0.8 | 0.8 | 0.2 |
| 1000 | 700 - 1700 | 0.4 | 0.4 | 0.4 | 0.4 | 0.4 | 0.4 | 0.1 |
| 5000 | 1700 - 10000 | 0.3 | 0.3 | 0.3 | 0.3 | 0.3 | 0.3 | 0.1 |
| 100 - 400 | 100 - 400 | 0.9 | 0.9 | 0.9 | 1.0 | 1.1 | 1.0 | 0.1 |
| 400 - 1000 | 400 - 1000 | 0.45 | 0.45 | 0.35 | 0.35 | 0.45 | 0.35 | 0.1 |
| 100 - 50000 | 100 - 50000 | 0.50 | 0.50 | 0.40 | 0.40 | 0.45 | 0.30 | 0.1 |
Table 3 shows the results of the whole analysis
for the Crab simulations at varying photon energy and incident direction.
The instrument
response is stable within across the FoV within the errors and the
overall response is dominated by the zenith angle (), since the
dependency upon azymuthal angle is minimal, if any.
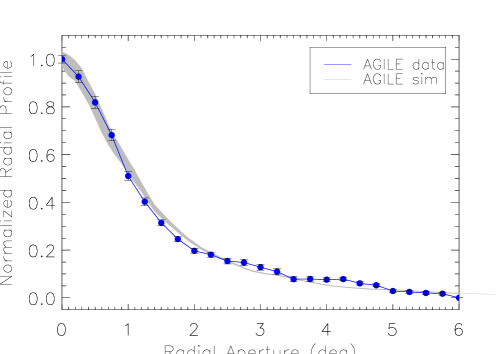
Fig. 3 shows the angular resolution as a function
of photon energy for on-axis incident directions.
We also report in Table 3 the HWHM
for the typical broad bands used in the AGILE-GRID data analysis, i.e.
the 100 - 400 MeV, the 400 - 1000 MeV channels and the 100 MeV - 50 GeV full band,
which gives on average an angular resolution of ,
and for off-axis angles within
respectively. These values will be compared to the ones obtained with the in-flight data
analysis.

5 In-flight data analysis
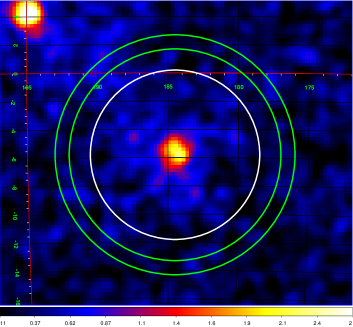
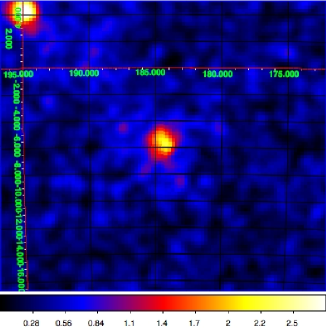
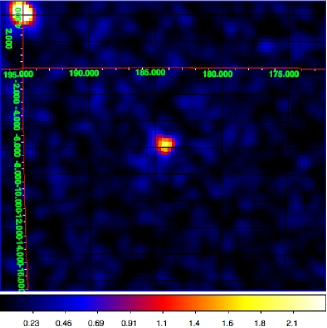
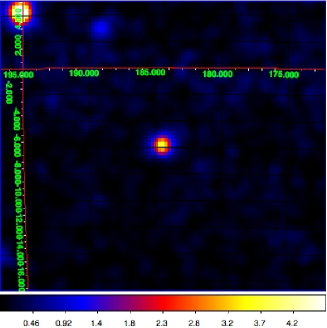
The whole simulation setup and the above results for the angular resolution can be validated by a comparison with the values obtained by in-flight data. The AGILE satellite has been operational since July 2007 and the angular resolution of the GRID has been studied both on-ground (Cattaneo et al., 2012; Cattaneo & Rappoldi, 2013) and in-flight (Chen at el., 2013). Here however we focus in particular on the case of the Crab source (pulsar + Nebula), whose spectral energy distribution in the gamma-ray energy band is dominated by the pulsar and is described by a power law with a spectral index of 2.1. As previously mentioned, this spectral energy distribution is representative of the majority of the gamma-ray sources and we therefore think that it is an ideal test case to assess the instrument response, also in view of future gamma-ray missions under study (see next section). We selected AGILE data from a long-term pointing of the region (11 days, 2007-09-23T12:01:05 - 2007-10-04T12:01:05), during which the source was located at an off-axis angle . Due to the resulting overall exposure of the region, we focus hereafter on two wide energy bands in order to obtain a good photon statistics for a robust assessment of the angular resolution: the 100 - 400 MeV and 400 MeV - 1 GeV energy bands. Fig. 4 and 6 show the Crab intensity map for the two energy bands respectively and the average count radial profile for the source. The FWHM associated to these profiles turns out to be in the 100 - 400 MeV energy range, and for the 400 MeV - 1 GeV band. The good agreement with the results from the simulations (see Table 3) validate the whole setup and data analysis carried out for the simulations.
6 AGILE and Fermi: comparison of in-flight data for the Crab system
As already mentioned in section 1, although implementing the same silicon-tungsten detector concept, the instrument configurations for the AGILE-GRID and Fermi-LAT detectors are quite different in terms of converter thickness, distance between trays and spacing between adjacent silicon strips (see Table A1). In the case of the AGILE-GRID, the Silicon Tracker is composed of 10 tungsten converter planes of homogeneous thickness (0.07 radiation length each) plus 2 additional planes without converter (for a total of 12 planes); the overall GRID radiation length is X∘ (Barbiellini et al., 2002; Prest et al., 2003). The Fermi-LAT has 12 tungsten planes of radiation length thickness (“LAT-front”), and an additional set of 4 tungsten planes of 0.18 radiation length (“LAT-back”) plus two planes without converter Atwood et al. (2009). In both instruments, each tungsten plane is interleaved with 2 layers of silicon strip detectors which are sensitive to charged particles and are used for the x,y positioning of the e+/e- pair track resulting from the pair conversion. The ratio of strip pitch to vertical spacing between tracker planes is 0.007 for both Fermi-LAT and AGILE-GRID.
An important difference between the two instruments, is the Silicon tracker readout system, analog for AGILE-GRID and digital for Fermi-LAT. Barbiellini et al. (2002) and Prest et al. (2003) describe extensively the GRID dedicated front-end electronics, characterizing the effective spatial resolution for particle incidence between and and comparing the performances of digital to analog readout. Although the GRID analog readout is structured to read only odd-numbered strips with no signal pick up at even-numbered strips (“floating strip readout”), the capacitive coupling between adjacent strips allows to obtain a complete sampling of the particle hit positions, discriminating between hits involving directly read and not-read microstrips. Typically, each particle hit is characterized by a signal spread out over several adjacent readout-strips (a “cluster”). GRID events produce energy deposition histograms per cluster which are very well characterized and typically result in 2-3 triggered strips depending on off-axis angle (Barbiellini et al. 2002; Fedel et al. 2000). Note that also for on-axis incidence a cluster is composed of a minimum of 2 strips. The effective spatial resolution obtained by the GRID for particle incidence between and is , substantially less than the Silicon microstrip size of 121 (see Fig. 15 in Barbiellini et al., 2002). The advantage of the analog vs. digital readout for the resulting spatial resolution of silicon strip detectors is discussed in Barbiellini et al. (2002) for the AGILE tracker configuration, showing an improvement of a factor of 2 (i.e. vs. ).
The Fermi-LAT system is based on a digital readout. The LAT Tracker is non-homogeneous and is characterized by two different values for the angular resolution, the one for the “LAT-front” and the of the “LAT-back” (Ackermann et al., 2013). In the following, we use only LAT-front data for comparison with the AGILE-GRID, proving the best angular resolution for Fermi. Note also that Fermi usually operates in scanning mode, with sources observed most of the time at large off-axis angles, with a consequent degradation of the angular resolution for a given source, compared to the on-axis performance.
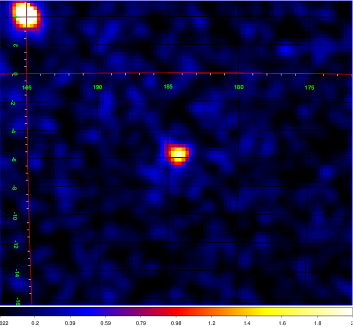
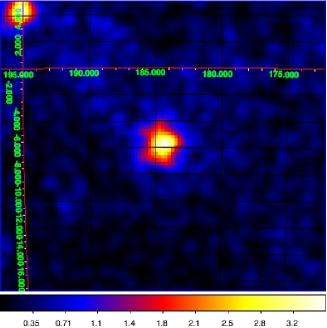
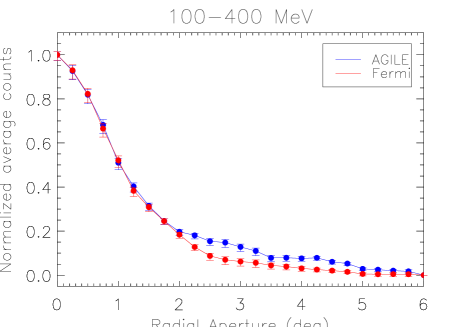
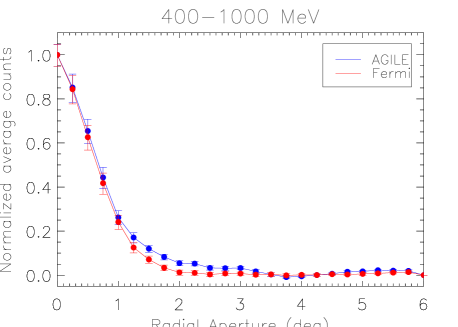
In order to compare the angular resolution of the two instruments at similar conditions, we selected Fermi data of the Crab system in pointing mode. We analyzed therefore a comparable set of data, with an exposure ensuring a similar photon statistics and with both gamma-ray detectors in pointing mode. The AGILE data in pointing mode555An analysis of AGILE-GRID data in “spinning mode” will be discussed in a forthcoming paper by Lucarelli et al., 2015. used for this comparison are the ones described in section 5. The Fermi data consist of 4 days of integration in the period 2012-07-04T23:24:44 - 2012-07-08T10:44:43 during which the satellite was stably pointing at the Crab following a gamma-ray flaring episode, with the source located at of off-axis angle in the FoV. We used the best available quality cut for the Fermi data, (the“ULTRA-CLEAN” event class, LAT-front photons, P7REP) in order to optimize the angular resolution of the data. We focus on the analysis of two representative energy bands for AGILE in order to have a robust statistics for both instruments: 100 - 400 MeV, and 400 - 1000 MeV.
Fig. 7 shows the intensity maps for the two gamma-ray telescopes in the two energy bands and Fig. 8 shows the corresponding radial profiles. The resulting angular resolution deduced from the in-flight data are the same, even though the AGILE data show a more pronounced non-gaussian tail, due to the converter thickness: the FWHM are and in the energy range 100 - 400 MeV and 400 MeV - 1 GeV respectively.
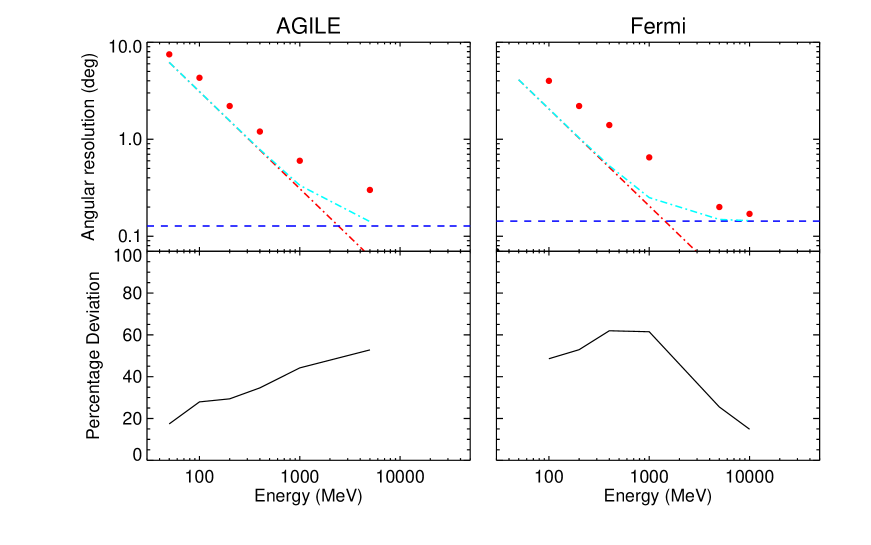
As already mentioned, several factors determine the instrument angular resolution as a function of gamma-ray photon energy, including: (1) multiple scattering, (2) the effective spatial resolution, (3) the photon energy reconstruction, (4) specific particle track reconstruction algorithms, (5) quality cuts. Fig. 6 shows the relative contibution of these factors as a function of energy for both trackers, AGILE and Fermi. Regarding the multiple scattering, we assume an effective radiation length per tray of 0.085 and 0.04 for AGILE-GRID and Fermi-LAT respectively, taking into account the contributions of the Tungsten converter and the supporting material666In the case of AGILE the effective radiation length due to the supporting material for each tray is from laboratory measurements; since Fermi has a similar tray structure Atwood et al. (2009) we assume a similar contribution of . . Top panels show that the multiple scattering effect dominates the overall angular resolution up 700 MeV and 350 MeV respectively for the two instruments. Bottom panels show the percentage deviation of the measured angular resolution to the overall expected limiting value. The amplitude of the deviation quantifies the reconstruction accuracy, that is optimized in different energy ranges for the two instruments: the accuracy is below 40 up to 400 MeV in the case of AGILE and above 2 GeV in the case of Fermi. Besides the different tracker configuration, crucial features distinguishing the two instruments and affecting the final reconstruction accuracy are the effective spatial resolution and the quality of the reconstruction algorithms777Note that ongoing developments for the track reconstruction algorithms and events classification for both AGILE (updated FM filter) and Fermi-LAT (PASS8) may lead to further improvements of the current angular resolution.. Therefore we believe that in view of future gamma-ray missions (e.g. Morselli et al., 2013; Galper et al., 2013) the optimization of the angular resolution should not only rely on a reduced converter thickness, but also on the implementation of an analog readout system if the power budget allows it, together with an optimization of the reconstruction algorithms.
7 Conclusions
The current generation of gamma-ray space instruments is based on Silicon detector technology and associated electronics. Both AGILE-GRID and Fermi-LAT show a quite stable performance in orbit which is the basis for prolonged operations (AGILE is at its 9th year of life in space, Fermi at its 8th year). Compared to the previous generation, the instrument performance improvements both in terms of sensitivity and angular resolution is well established.
In this paper, we summarized the main results concerning the GRID angular resolution, a crucial feature of the AGILE instrument, at the basis of the scientific performance of a gamma-ray detector together with its FoV and background rejection capabilities at energies below 400 MeV, allowing for the best exploitation of the instrument configuration. We showed that the AGILE-GRID angular resolution is optimized given the overall characteristics of the detector and allows for state-of-the-art mapping of Galactic and extragalactic regions/sources: the FWHM for off-axis angles in the range is at 100 MeV, and at 1 GeV. The angular resolution is quite uniform in the FoV up to off-axis. The FWHM obtained from in-flight data in pointing mode is in the range 100 - 400 MeV, and in the 400 MeV - 1 GeV.
Although the AGILE-GRID multiple scattering due to the heavy converter is relatively high, we proved that a crucial role is played by the optimization of the readout system (analog) of the Silicon Tracker and of the particle track reconstruction algorithms888It is interesting to note that the AGILE Tracker configuration is quite similar to the basic element of the gamma-ray instrument currently under study for the GAMMA-400 mission (Galper etal. 2013). The analog readout of a Silicon Tracker with AGILE-like characteristics is required to optimize the angular resolution with a thick converter (that in the case of GAMMA-400 is currently designed to be per plane)..
The GRID angular resolution as a function of gamma-ray energies is shown in Fig. 1 as resulting from simulations. These values are in good agreement with the ones deduced from in-flight data as demonstrated in this paper for Crab-like sources.
Furthermore, by a direct comparison of in-flight data of the Crab system, we find that despite the differences in structure, geometry, readout system and overall size, the AGILE-GRID and Fermi-LAT front show similar angular resolutions at energies between 100 MeV and 1 GeV, due to different optimizations of the readout system and reconstruction algorithms.
Acknowledgements
We ackowledge several discussions with our colleagues of the Fermi Team. The AGILE mission is funded by the Italian Space Institute (ASI) with scientific and programmatic participation by the Italian Istitute of Astrophysics (INAF) and the Italian Insitute of Nuclear Physics (INFN). Our research is partially supported by the ASI grants I/042/10/0, I/028/12/0 and I/028/12/02. We would like to thank the referee for the careful review and for providing valuable comments that helped in improving the contents of this paper.
References
- Ackermann et al. (2013) Ackermann et al., 2013, ApJ, 765, 19
- Argan et al. (2004) Argan, A. et al., 2004, Proceedings IEEE-NSS, vol. 1,371.
- Argan et al. (2008) Argan A., Tavani M., Trois A., et al., 2008, NSS. IEEE (IEEE), 774
- Atwood et al. (2009) Atwood W.B. and the Fermi LAT collaboration, 2009, ApJ, 697, 1071
- Barbiellini et al. (2002) Barbiellini G., Fedel G., Liello F. et al., 2002, NIM A, 490, 146
- Cattaneo et al. (2012) Cattaneo P.W., Argan A., Boffelli A., Buonomo B., Chen A.W., D’Ammando F., Foggetta L., Froysland T. et al., 2012, NIM A, 674, 55
- Cattaneo & Rappoldi (2013) Cattaneo P.W., Rappoldi P., 2013, NIM B, 239, 241
- Chen et al. (2013) Chen A.W. et al., 2013, A&A, 558, 37
- Cocco et al. (2002) Cocco V., Longo F., Tavani M., 2002, NIM A, 486,623
- Fedel et al. (2000) Fedel G. et al., 2000, SPIE, Vol. 4140
- Feroci et al. (2007) Feroci M. et al, 2007, NIM A, 581, 728.
- Fichtel et al. (1975) Fichtel C.E., Hartman, R.C., Kniffen, D.A., Thompson, D.J., Bignami, G.F., Ogelman, H.B., Ozel, M.E., and Turner, T., 1975, ApJ, 198, 163.
- Fichtel & Trombka (1997) Fichtel C.E. & Trombka J.I., 1997, Gamma-Ray Astrophysics, NASA Reference Publication n. 1386, September 1997.
- Galper et al. (2013) Galper A.M. et al, 2013, Proceedings of the International Cosmic-Ray Conference 2013, Brazil, Rio de Janeiro, http://arxiv.org/ftp/arxiv/papers/1306/1306.6175.pdf
- Giuliani et al. (2003) Giuliani A., 2003, The Kalman Algorithm for the AGILE Mission, Ph.D. Thesis, University of Milan
- Giuliani et al. (2006) Giuliani A., Cocco V., Mereghetti S., Pittori C., Tavani M., 2006, NIM A, 568, 692
- Hartman et al. (1999) Hartman R.C. et al., 1999, ApJS, 123, 279
- Kraushaar et al. (1972) Kraushaar W.L. et al., 1972, ApJ, 177, 341
- Labanti et al. (2006) Labanti C. et al., 2006, proc SPIE, 6266, 62663
- Longo et al. (2002) Longo F., Cocco V., Tavani M., 2002, NIM A, 486, 610-622
- Lucarelli et al., (2015) Lucarelli F. et al., 2015, in preparation
- Mayer-Hasselwander et al. (1979) Mayer-Hasselwander et al., 1979, Annals of the New York Academy of Sciences, Proc. of the Ninth Texas Symp., 226, 211
- Morselli et al. (2013) Morselli A. et al., 2013, NuPhS, 239, 193
- Perotti et al. (2006) Perotti F. et al., 2006, NIM A, 556, 228
- Prest et al. (2003) Prest M., Barbiellini G., Bordignon G. et al., 2003, NIM A, 501, 280
- Swanenburg et al. (1981) Swanenburg, B.N. et al., 1981, ApJ, 242, L69
- Tavani et al. (2009) Tavani M., Barbiellini G., Argan A. et al., 2009, A&A, 502, 995
- Thompson et al. (1993) Thompson D.J. et al., 1993, ApJS, 86, 629.
- Thompson et al. (1998) Thompson D.J., et al., 1998, in Proc. 4th CGRO Symp., AIP Conf. Ser. n. 410, p. 39.
- Yang et al. (2005) Yang, H.J., Roe, B.P. & Zhu, J., 2005, NIM A, 555, 370
8 Appendix: The AGILE GRID vs. Fermi-LAT
AGILE is an ASI Small Scientific Mission (Tavani et al. 2009) of total weight of 320 kg. It carries a scientific instrument dedicated to high-energy astrophysics whose heart is the Gamma-Ray Imaging Detector (GRID). Complementary items are the imaging Super-AGILE detector sensitive in the range 20-60 keV (Feroci et al., 2007), the Mini-Calorimeter (Labanti et al. 2006), and the Anticoincidence system (Perotti et al. 2006). AGILE was launched in April 2007 and is operational in an equatorial orbit of average height of 530 km.
Fermi is a NASA mission of a large class with a broad international collaboration. Its imaging gamma-ray instrument is based on a 16-unit Tracker (LAT) (Atwood et al., 2009), which is complemented by a massive Calorimeter and an Anticoindence system. Fermi was launched in June 2008 in an orbit with inclination of and average height of 550-600 km.
Table A1 summarizes the main parameters of the two instrument configurations, which are relevant for the angular resolution determination.
Table A1: A comparison between the AGILE-GRID and Fermi-LAT
| Parameter | AGILE-GRID | Fermi-LAT |
|---|---|---|
| Number of towers | 1 | 16 |
| Total number of Tracker planes | 12 | 18 |
| Vertical spacing () between adjacent planes | 1.8 cm | 3.2 cm |
| Silicon tile size | 9.5 x 9.5 | 8.95 x 8.95 |
| Silicon detector array for each plane | 4 x 4 | 4 x 4 |
| Silicon-strip pitch () | 121 | 228 |
| Readout pitch | 242 | 228 |
| Signal readout | analog | digital |
| Ratio | 0.007 | 0.007 |
| Tungsten converter thickness per plane | 0.07 | 0.03 (front) |
| 0.18 (back) | ||
| Number of planes with W converter | 10 | 12 (front) |
| 4 (back) | ||
| On-axis total radiation length | 0.9 | 0.5 (front) |
| 0.8 (back) | ||
| Total n. of readout channels | 36,864 | 884,736 |
| Power consumption/channels | 400 W | 180 W |