A Kinematically-Distinct RR-Lyrae Overdensity in the Inner Regions of the Milky Way
Abstract
We combine the Siding Spring Survey of RR Lyrae stars with the Southern Proper Motion Catalog 4, in order to detect and kinematically characterize overdensities in the inner halo of the Milky Way. We identify one such overdensity above the Galactic plane, in quadrant 4 of the Galaxy. The overdensity extends at least in longitude, has an average heliocentric distance of 8 kpc with a depth of 4 kpc, and is confined within 4 kpc of the Galactic plane. Its metallicity distribution is distinct from that of the field population having a peak at -1.3 and a pronounced tail to -2.0. Proper motions indicate a net vertical motion away from the plane, and a low orbital angular momentum. Qualitatively, these orbit properties suggest a possible association with Centauri’s parent satellite. However, comparison to a specific Cen N-body disruption model does not give a good match with observations. Line-of-sight velocities, and more extensive N-body modelling will help clarify the nature of this overdensity.
1 Introduction
RR Lyrae stars are established tracers of old, metal-poor populations. Being bright, well-calibrated standard candles, these stars have been used extensively for studies of the halo, thick disk and bar of our Galaxy, as well as studies of the Milky Way (MW) satellites. Typically, the presence (or absence) of an RR-Lyrae stellar overdensity will help establish (or refute) the origin of the overdensity as a disrupted satellite (see e.g., Cseresjnes et al. 2000 for the Sagittarius dwarf galaxy, Vivas & Zinn 2006 for the Virgo Overdensity, Mateu et al. 2009 for the Canis Major overdensity).
The recent releases of large-area RR Lyrae databases by the Catalina surveys (Drake et al. 2013ab, Torrealba et al. 2015 - hereafter T15) have opened new avenues of halo-substructure investigation. Here, we report on one such study in which we combine the recently released Siding Spring Survey (SSS; aka Catalina south) of RR Lyrae stars described in T15 with the Southern Proper Motion Catalog SPM4 (fourth installment, Girard et al. 2011, hereafter G11). Our aim is to detect and kinematically characterize stellar overdensities within a heliocentric distance of 15 kpc, specifically in the inner halo/thick disk of the MW.
Comparing two areas symmetrically situated about the Galactic plane, we find an overdensity in the fourth quadrant of the Galaxy, above the plane. This overdensity was also singled out by T15 in their comparison with a halo density model; however it was unclear whether that detection was the result of a poor halo model, or a genuine stellar excess. Here we establish that the overdensity is kinematically distinct from canonical MW components. Specifically we find that the overdensity: 1) has a net vertical motion, yet it is confined to within 4 kpc of the plane, 2) has a relatively low orbital angular momentum, allowing for both prograde and retrograde orbits and 3) is predominantly metal-poor with a peak at [Fe/H] = -1.3 and a pronounced tail to [Fe/H] = -2.0.
Qualitatively, our findings are consistent with debris from Centauri’s parent satellite: i.e. a flattened spatial distribution with low orbital angular momentum (Tsuchiya et al. 2003, 2004; hereafter T04, Bekki & Freeman 2003, Mizutani et al. 2003, Meza et al. 2005). However, a direct comparison with the T04 N-body model does not give a good match. Likewise, a comparison with the Law & Majewski (2010) model for the Sagittarius dwarf galaxy does not favor such an origin. We speculate that another possible origin mechanism is bar-induced resonant trapping as envisioned by Moreno et al. (2015).
Key to clarifying the origin of this overdensity are radial velocities: N-body models for Cen debris give an average velocity that is distinct from field stars. Also, better constrained models should help clarify the origin, in particular the above- versus below-the-plane asymmetry.
2 Catalog Data
The SSS RR Lyrae catalog (T15) contains stars down to a limiting magnitude . The SSS detects ab-type RR Lyrae (RRab) within the declination range , and has an estimated overall completeness of . The SPM4 catalog covers the sky below , and is approximately complete to (G11). Thus, there is good overlap between the two catalogs.
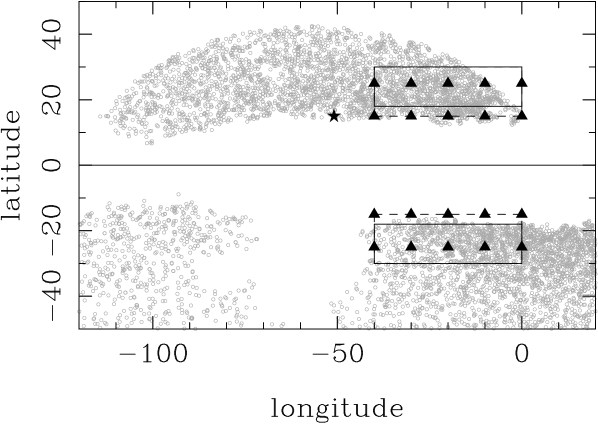
During the cross-matching process we found that the SSS positions have errors of up to 5 arcsec. Specifically, the separation in positions between SPM4 and SSS has a wide distribution that varies with declination; 1-2 arcsec at , increasing to 4-5 arcsec at . We therefore chose a matching tolerance of 5 arcsec, then eliminated duplicates/multiples by keeping the lowest separation. Objects with magnitude differences in excess of 2.0 mags were discarded. This yielded a list of 8023 unique matches. In Figure 1 we show the spatial distribution of these objects.
3 Analysis
3.1 Sample Selection
We focus on two regions symmetrically placed with respect to the Galactic plane and with longitude range . This choice was prompted by the area-coverage uniformity in the above- and below-galactic plane samples; hereafter designated ABOVE and BELOW.
The “primary” samples have a latitude range of (Fig.1 continuous line), and these were used to produce spatial and metallicity distributions. The “extended” samples have a latitude range of (Fig. 1, dashed line); these were used for the kinematical analysis. At low latitudes, the SSS completeness varies with latitude due to crowding (see Fig. 1). Therefore, we decided to limit the spatial analysis to a low-latitude limit of thus alleviating completeness variations in the ABOVE versus BELOW samples. For the kinematical analysis, we extend the low-latitude limit to . Note that the ABOVE sample is missing a corner at the end, which can be mirrored in the BELOW sample.
To minimize the effect of proper-motion errors, we restrict our analysis to objects within a heliocentric distance of kpc. With this distance limit, the sample is well-represented to , with only of the stars within . Estimated proper-motion errors in SPM4 are mas/yr at these magnitudes (see Fig. 6 in G11).
The stars we study are located in quadrant 4 of the Galaxy, to distances that well encompass the Galactic bulge. However, the low-latitude limit , corresponds to a vertical distance from the plane of 2.1 kpc at the center of the Galaxy ( kpc). The plane-projected galactocentric radius ranges between 0.9 and 9.0 kpc for the ABOVE sample, and between 0.1 and 8.8 kpc for the BELOW sample. The near-end of the Galactic bar is located in quadrant 1. Given our low-latitude limit of we therefore believe we do not sample any portions of the known bar of the Milky Way (e.g., Wegg et al. 2015), and very little, if any of the bulge.
3.2 Spatial and Metallicity Distributions
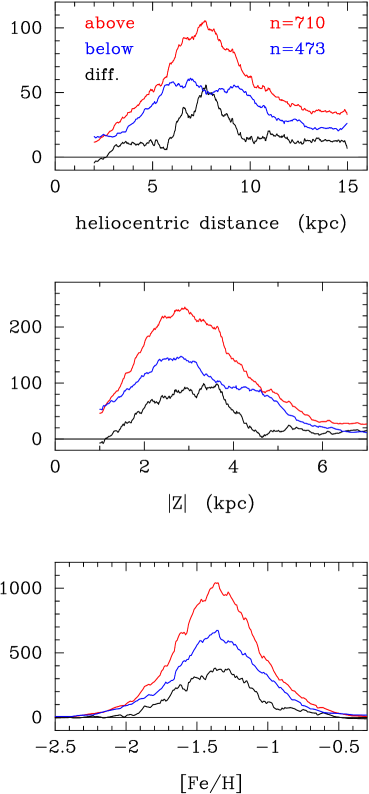
With these cuts, we obtain 710 stars in the ABOVE sample, and 629 in the BELOW sample. When the BELOW sample is trimmed to exactly match the area in the ABOVE sample, i.e., subtract the corner at the end, the number of stars is 473. The ABOVE sample has higher reddening () than that of the BELOW sample () on average, and also a wider reddening distribution. Expectations of star-counts are therefore opposite to the observations.
In Figure 2 we show the distributions in heliocentric distance, ; distance from the plane, ; and metallicity, [Fe/H], for the ABOVE (red) and the corner-trimmed BELOW (blue) samples. In the same plots, we also show the difference between the ABOVE and BELOW distributions by simple subtraction of one from another (black line). The frequency distributions are constructed using a box of half-width 1 kpc; 0.5 kpc; and 0.15 dex in heliocentric distance; distance from the plane; and metallicity, respectively. In all three plots, a stellar overdensity is apparent in the ABOVE sample. A normalization issue between the ABOVE and BELOW plane may arise simply because the BELOW sample may have fewer stars due to incompleteness differences at low latitudes. This is suggested by Fig. 2-top, where the difference shows a substantial overdensity between distances of 6 to 10 kpc, while remaining flat yet nonzero outside of this range. The -distribution difference (middle panel) shows the overdensity extends up to about 4.5 kpc. The lower limit of about 1 kpc is less certain, due to incompleteness issues at the low-latitude side. The metallicity-distribution difference (bottom panel) indicates the overdensity has metallicities between -2.0 and -1.0 dex. Its shape differs from that of the ABOVE and BELOW distributions, having a pronounced wing at low metallicities. A KS test performed between the difference distribution and the BELOW distribution gives just a chance that they are drawn from the same population.
T15 search for overdensities in their entire survey by RR Lyrae densities to predictions of a halo density model. Their second most-significant overdensity is Hydra 1 (Hya 1; see Fig. 14 in T15) located in an area similar to ours, but more extended in longitude. The longitude extent of our overdensity is limited by the SPM4 declination limit reflected at , and by the kinematical analysis at the negative longitude end (see Section 3.3). Also, our overdensity is on average more distant than Hya 1: kpc compared to 5.1 kpc, but its depth is similar: kpc. We believe that Hya 1 coincides with what we have detected here. We note that our detection and characterization is by direct comparison, above and below the plane, while also including kinematics and metallicities.
3.3 Kinematics from Transverse Velocities
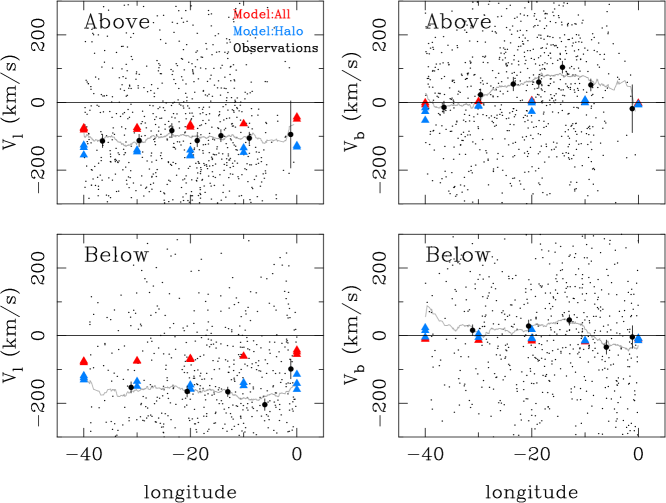
We calculate transverse velocities along longitude and latitude as where is a constant to account for the appropriate units. Here, we use the extended samples, i.e., with the low-latitude limit of . We also discard objects with km/s. Besides comparing observed samples, we also use the Besancon galactic model (Robin et al. 2003) to explore the expectations for a “default” Milky Way, along a grid of pointings as indicated in Fig. 1. The Besancon simulations were run in the magnitude range , and assumed a fixed proper-motion error of 2 mas/yr. The simulated stars were then trimmed with the same distance and velocity cuts as applied to our observed samples. For each pointing we calculate the average and for the entire sample, which we label “all”, and for a subsample with metallicities [Fe/H], which we label “halo”. The “all” sample is dominated by thin-disk kinematics, while the “halo” sample is dominated by halo kinematics with a small contribution from the thick disk. This latter sample is chosen to be representative of our RR Lyrae stars. In the Besancon model, the halo has 0 km/s rotation velocity, while the thick disk has 176 km/s. Thus our two Besancon samples act to guide us in space between a disk-like prograde population and a practically non-rotating, or mildly prograde rotating population.
In Figure 3 we present the run of (left) and (right) as a function of longitude. Besancon predictions are shown with colored triangles, while observations are shown with black symbols. Filled, large circles show velocity averages in longitude bins that contain 150 stars (except for the bin near which includes the remaining stars). The gray line shows a moving mean of the velocities. In the BELOW sample, Besancon predictions for the halo population agree reasonably well with the observations. However, in the ABOVE sample, both velocity components disagree with model predictions. is offset by km/s from the prediction of nearly 0 km/s, across four longitude bins, while lies between the predictions for the thin disk and halo in the same longitude range. Thus, the overdensity has a net vertical motion away from the plane, and appears to be in a prograde motion, yet lagging the thin disk.
3.4 Checking Proper-Motion Systematics
The overdensity’s mean velocity of km/s seen in Fig. 3 (top, right) corresponds to about 2 mas/yr. The ABOVE sample includes measurements from a total of 23 SPM fields. It is unlikely that systematic errors in proper motions along RA and Dec would produce a constant mas/yr over some in the sky.
As a check, we make a comparison of the SPM4 to SPM2 — a previous SPM version — in the areas of interest. The SPM2 catalog contains only a fraction of the objects in the SPM4, but the proper motions should be considered more reliable, as explained in G11. In particular, in the SPM2 field-to-field systematics are better controlled, due to the visual confirmation of all galaxies used as proper-motion reference. Thus, even though the catalogs are not independent, the SPM2 can still serve as a check on the SPM4. The comparison shows that systematic errors of 1 mas/yr are the norm. While regions with systematics up to 2 mas/yr do exist over short longitude spans, such are not seen in the range of our samples.
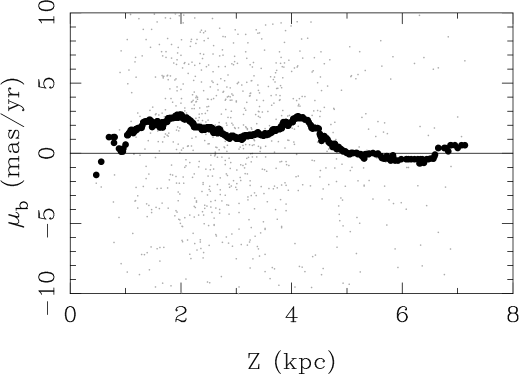
Another check shown in Figure 4 is the run of as a function of for the ABOVE sample. The dark line is a moving median of the data points. The average is about 2 mas/yr for vertical distances up to 4 kpc, it then decreases to zero for kpc. This is the same value at which the overdensity is no longer seen in the spatial distributions (Fig. 2, middle). The above evidence argues against proper-motion systematics as an explanation for the intriguing kinematical feature seen in Fig. 3. Rather, we believe it is indicative of the kinematics of this overdensity.
4 Origin of the Overdensity
4.1 Orbital Constraints
Knowing five of the six phase-space coordinates, we now attempt to constrain the orbit of the overdensity en masse by exploring plausible orbits for a “test particle” having the same mean properties. First, we strive to isolate the sample of overdensity stars by trimming in parameter space where the overdensity is observed: , kpc, kpc, [Fe/H] = -2.0 to -1.0, and with proper-motion errors in both coordinates less than 5 mas/yr. This yields a sample of 226 RR Lyrae from which we derive a mean position, distance, and proper motion – the proper motion being mas/yr, mas/yr. A count of Catalina RR Lyrae stars in a symmetrically trimmed BELOW sample yields 119 stars, which implies a rather large field contamination of roughly 53% in our “isolated” overdensity sample. Thus, a correction is made to the mean proper motion, assuming the field has mas/yr, based on the similarly trimmed BELOW sample, and (reflex solar motion along is small at these distances). After correcting for contamination, the overdensity-representing test particle is given a motion of mas/yr, mas/yr. It is located at kpc, where the Sun is at (8.0,0,0) kpc. We adopt an uncertainty in the proper motion of 1 mas/yr to account for possible systematics, which are described in Section 3.4. Finally, we explore a range of values for the unknown heliocentric radial velocity; from -200 km/s to +250 km/s, in steps of 50 km/s.
A set of 100 such orbit integrations were generated at each radial-velocity value using a three-component analytical model of the Galaxy (Dinescu et al. 1999). The results show that the test particle’s orbit generally exceeded the observed limits of the overdensity, namely kpc and , as seen in Figures 2 and 3. Overall, only of the test orbits were contained within the observed spatial-distribution limits, and none of these were from sets at the extremes in radial velocity, -200 and +250 km/s.
At the position of the overdensity – , , and heliocentric distance kpc – is primarily aligned with velocity along Galactocentric radius, line-of-sight velocity corresponds to rotational motion in the Galactic plane, and correlates to vertical motion out of the plane. With this geometry in mind, it becomes evident that the mean motion of the overdensity sample before correction for possible field contamination was actually more likely to yield orbits consistent with its observed spatial extent. For instance, assigning the test particle the raw mean motion of the sample of 226 stars and repeating the orbit integrations, yields orbits that fall within the spatial limits of the time. Low heliocentric-radial-velocity runs are still preferred, with of the orbits from sets having km/s being consistent with the spatial distribution’s limits. Thus, either contamination is much lower than estimated, or proper-motion systematics have conspired to shift the sample’s mean motion by roughly 2-sigma. Furthermore, these allowed orbits have low orbital angular momentum, , with values ranging from -300 to 700 km/s kpc. Radial-velocity measures of the candidate stars would decisively establish the prograde versus retrograde nature of the orbits.
4.2 Centauri and Sagittarius as Progenitors
The moderate vertical excursion of the stars in the overdensity (to kpc), and the small-size orbital angular momentum, allowing for both pro and retrograde orbits, suggest that the overdensity may be debris from Cen’s parent satellite as envisioned by T04, Bekki & Freeman (2003). While Cen is on a retrograde orbit (Dinescu et al. 1999), N-body disruption models allow for a fraction of the debris to be on prograde orbits, especially closer to the center of the Galaxy. Here, we explore the kinematics of the H4 model from T04, by “observing” an above-the-plane sample with the same spatial restrictions as in Section 3.3 (, , and kpc). In Table 1 we list the number of particles found within the spatial restrictions, the average and .
We also explore the Law & Majewski (2010) model for the disruption of the Sagittarius dwarf galaxy, applying the same restrictions as above; the respective quantities are listed in the second line of the Table.
On the last line of Table 1 we present the same quantities, but for our best-trimmed sample of candidates in the overdensity as described in Section 4.1, to represent the kinematics of the overdensity. Based on these specific models, the observations do not confirm either an Cen or Sagittarius’ origin.
Still, an Cen origin for the overdensity, in particular, cannot be ruled out. It is not a straightforward exercise to model the complex dynamical interaction of the central, non-axis symmetric parts of the Milky Way with the parent satellite of Cen. Disruption models vary substantially in the initial mass of the satellite, the launching location, and the time spent in disruption and phase-mixing. For instance, the H4 (T04) -Cen model predicts debris from the parent satellite above and below the plane, but with an excess below the plane. Presumably, had the launching location been flipped with respect to the plane, a spatial excess in the opposite sense would result. Model predictions indicate a net positive heliocentric radial velocity for Cen debris ( km/s), different from the radial velocities of halo stars ( km/s). Thus, radial-velocity measures of the candidate overdensity stars and refined models will help to clarify the situation. We note that velocity dispersion predicted by the H4 model is large ( km/s); thus, one should not expect to find a “cold” kinematical feature, as is the case in more recent accretion events.
| Sample | N | ||
|---|---|---|---|
| (km/s) | (km/s) | ||
| Cen model | 463 | ||
| Sgr model | 7 | ||
| RRab candidates | 226 |
Finally, we point out recent studies proposing resonant trapping in the disk and halo as the cause of some moving groups and overdensities. Moreno et al. (2015) suggest that this trapping is induced by the Galactic bar, while Molloy et al. (2015) suggest that bar-driven kinematic substructure can be found near the bar as well as in the outer parts of the disk. It is beyond the scope of this paper to examine such scenarios, but these might also offer a viable origin explanation. Although, the observed asymmetry, above-vs-below the plane, might be difficult to reconcile with effects from what is typically assumed to be a symmetric bar.
We thank Marcio Catelan for speedily providing us the SSS catalog of RR Lyrae stars while their publication was in press. VIK acknowledges support from the grant N 231.01-214/013B to the Southern Federal University, Russia.
References
- (1)
- (2) Bekki, K. & Freeman, K. C. 2003, MNRAS, 346, L11
- (3) Cseresnjes, P., Alard, C. & Guibert, J. 2000, A&A, 357, 871 Ed. F. van Leewen, J. D. Hughes, and G. Piotto 265, 365
- (4) Dinescu, D. I., Girard, T. M., & van Altena, W. F. 1999, AJ, 117, 1792
- (5) Drake, A. J., et al. 2003a, ApJ, 765, 154
- (6) Drake, A. J., et al. 2003b, ApJ, 763, 32
- (7) Girard, T. M., van Altena, W. F., Zacharias, N., Vieira, K., Casetti-Dinescu, D. I., Castillo, D., Herrera, D., Lee, Y. S., Beers, T. C., Monet, D. G., & López, C. E. 2011, AJ, 142, 12
- (8) Law, D. R. & Majewski, S. R. 2010, ApJ, 718, 1128
- (9) Mateu, C., Vivas, A. K., Zinn, R., Miller, L. R.& Abad, C. 2009, AJ, 137, 4412
- (10) Meza, A., Navarro, J. F., Abadi, M. G., & Steinmetz, M. 2005, MNRAS, 359, 93
- (11) Mitzutani, A., Chiba, M., & Sakamoto, T. 2003, ApJ, 598, L89
- (12) Molloy, M., Smith, M. C., Shen, J., & Wyn Evans, N. 2015, ApJ, 804, 80
- (13) Moreno, E., Pichardo, B., & Schuster, W. 2015, arXiv:1505.04355, MNRAS, in press Gran, F., Alonso-García, J., Angeloni, R., Hempel, M., Dékaáni, I. & Minniti, D. 2015, A&A, 577, 99
- (14) Robin, A. C., Reylé., C., Derrière, S., & Picaud, S. 2003, A&A, 409, 523
- (15) Torrealba, G., Catelan, M., Drake, A. J., Djorgovski, S. G., McNaught, R. H., Belokurov, V., Koposov, S., Graham, M. J., Mahabal, A. A., Larson, S., & Christensen, E. 2015 MNRAS, 446, 2251
- (16) Tsuchiya, T., Dinescu D. I., & Korchagin, V. I., 2003, ApJ, 589, L29
- (17) Tsuchiya, T., Korchagin, V. I., & Dinescu, D. I. 2004, MNRAS, 350, 1141
- (18) Vivas, A. K. & Zinn, R. 2006, AJ, 132, 714
- (19) Wegg, C., Gerhard, O. & Portail, M. 2015, MNRAS, in press
- (20)