Unconventional superconductivity in the layered iron germanide YFe2Ge2
Abstract
The iron-based intermetallic YFe2Ge2 stands out among transition metal compounds for its high Sommerfeld coefficient of the order of , which signals strong electronic correlations. A new generation of high quality samples of YFe2Ge2 show superconducting transition anomalies below in thermodynamic as well as transport measurements, establishing that superconductivity is intrinsic in this layered iron compound outside the known superconducting iron pnictide or chalcogenide families. The Fermi surface geometry of YFe2Ge2 resembles that of KFe2As2 in the high pressure collapsed tetragonal phase, in which superconductivity at temperatures as high as has recently been reported, suggesting an underlying connection between the two systems.
Since the discovery of superconductivity in LaFePO Kamihara et al. (2006), numerous iron-based superconductors have been identified within diverse structure families, all of which combine iron with a group-V (pnictogen) or group-VI (chalcogen) element. Unconventional superconductivity is extremely rare among transition metal compounds outside these layered iron systems and the cuprates, and it is almost universally associated with highly anisotropic electronic properties and nearly 2D Fermi surface geometries. This contrasts with the comparatively isotropic, 3D electronic structure of the iron germanide YFe2Ge2 Avila et al. (2004), in which resistive and magnetic signatures of superconductivity have recently been reported Zou et al. (2014); Kim et al. (2015), motivating competing scenarios for the nature of the pairing mechanism Subedi (2014); Singh (2014). YFe2Ge2 shares key properties with the alkali metal iron arsenides (K/Rb/Cs)Fe2As2: it has the same ThCr2Si2 structure, featuring square lattice iron layers, its low temperature heat capacity Sommerfeld coefficientis similarly enhanced, and antiferromagnetic order can be induced by chemical substitution Ran et al. (2011). Recent x-ray absorption and photoemission studies have demonstrated the presence of large fluctuating Fe-moments in YFe2Ge2 Sirica et al. (2015), suggesting that this system is close to the border of magnetism. There is an important difference, however: although YFe2Ge2 appears at first sight to be isoelectronic to the alkali metal iron arsenide superconductors, the existence of Ge-Ge bonds in YFe2Ge2, contrasting with the absence of As-As bonds in the arsenides, causes the Fe oxidation state and consequently the electronic structure to differ from that of the arsenides.
Because initial experimental studies have failed to produce thermodynamic evidence for a bulk superconducting transition in YFe2Ge2, the possibility of filamentary superconductivity from alien phases, advanced also in Felner et al. (2015), has held back further work on this material. Here, we present transport and thermodynamic evidence for a bulk superconducting transition in YFe2Ge2 obtained in a new generation of high quality samples resulting from a comprehensive programme of growth optimisation. This confirms the intrinsic nature of superconductivity in YFe2Ge2 and motivates further investigations into the nature of its unconventional superconducting and anomalous normal state. We note, also, the striking similarity between the electronic structure of YFe2Ge2 and that of KFe2As2 in the pressure induced collapsed tetragonal state, which suggests that the two systems share a common pairing mechanism.
Polycrystalline ingots of YFe2Ge2 were obtained by radio frequency induction melting on a water-cooled copper boat in an argon atmosphere. To circumvent the formation of stable Y-Ge alloys, YFe2 was first grown from the elements (Y 3N, Fe 4N). Together with elemental Ge (6N) this was then used to grow stoichiometric as well as slightly off-stoichiometric YFe2Ge2. The melt was quenched and then annealed in argon at for 1 hour, followed by further annealing in vacuum at for 8 days. More than 20 ingots with varying nominal starting compositions have been produced, reaching up to four times higher RRR than those reported previously Zou et al. (2014).
The electrical resistance was measured using a standard four-terminal AC technique in an adiabatic demagnetisation refrigerator to and in a Quantum Design Physical Properties Measurement System (PPMS) to . Data were scaled at 300 K to the published high temperature resistivity Avila et al. (2004). The specific heat capacity was measured in a PPMS to below . X-ray studies Sup (2015) confirm the quality and composition of our samples. Our samples are typically phase pure, and the dominant impurity phase is a ferromagnetic Fe-Ge alloy with composition approximately Fe0.85Ge0.15. The electronic structure was calculated using the Generalized Gradient Approximation Perdew et al. (1996) with Wien2k Blaha et al. (2001). Experimentally determined lattice parameters were used for YFe2Ge2 and for KFe2As2 at ambient pressure and at a pressure of Ying et al. (2015) (Tab. 1). and 100,000 -points were used (6768 -points in the irreducible Brillouin zone), and spin orbit coupling and relativistic local orbitals were included. The fractional internal position of the Ge or As layer, , the only free internal coordinate, was optimised numerically, resulting in in YFe2Ge2 and in collapsed tetragonal KFe2As2.
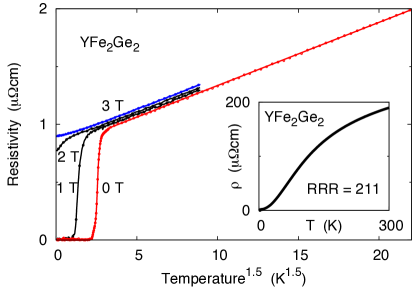
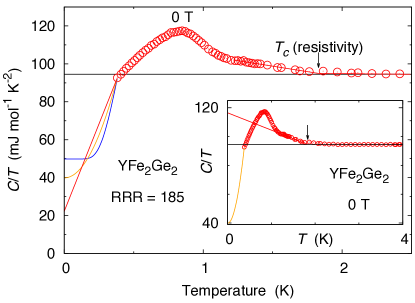
At temperatures below , the electrical resistivity of all samples of YFe2Ge2 displays an unconventional power-law temperature dependence of the form (Fig. 1). This suggests Fermi liquid breakdown similar to that observed in other transition metal compounds such as MnSi, ZrZn2 and NbFe2 near the threshold of magnetic order Pfleiderer et al. (2001); Takashima et al. (2007); Smith et al. (2008); Brando et al. (2008) and is reminiscent of the power-law temperature dependences reported in early studies of KFe2As2 Dong et al. (2010) and CsFe2As2 Hong et al. (2013). The dependence on residual resistivity of the resistivity exponent, which is reported to reach the Fermi liquid value of 2 in the cleanest samples of (K/Cs)Fe2As2 Hardy et al. (2013), might be attributed to the hot spot/cold spot scenario for scattering from nearly critical antiferromagnetic fluctuations Hlubina and Rice (1995); Rosch (1999).
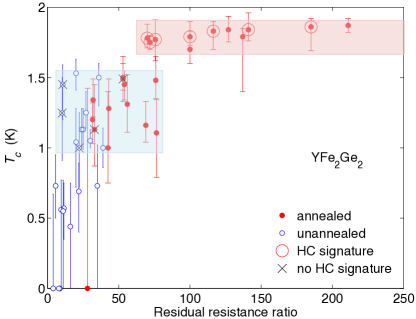
Although most samples show resistive superconducting transitions (Fig. 1), the midpoint transition temperature and the transition width depend strongly on growth conditions. The highest transition temperatures and narrowest transitions were observed in those samples which also have the highest residual resistance ratio, RRR (Fig. 2). Full resistive transitions are observed in most samples with RRR values exceeding 20, and the value of , which hovers around 1.3 K up to RRR values of about 70 (blue shaded region in Fig. 2), steps up to around 1.8 K for (red shaded region in Fig. 2). This analysis of our data does not yet take into account other underlying correlations which may affect RRR and , such as slight variations in nominal stoichiometry or the effect of annealing on microscopic inhomogeneity. It does, however, suggest that the samples most likely to display bulk superconductivity may be found towards the high RRR end of Fig. 2.
Neither flux-grown samples of YFe2Ge2 with nor our previous generation of induction furnace-grown samples have shown a superconducting heat capacity anomaly Kim et al. (2015); Zou et al. (2014). By contrast, our new generation of samples with RRR of the order of 100 or more display clear heat capacity anomalies (Fig. 3) below the resistive transition temperature . The Sommerfeld ratio, which is enhanced by an order of magnitude over the band structure value of Subedi (2014); Singh (2014), rises below , peaks at about above the normal state value and then decreases rapidly below .
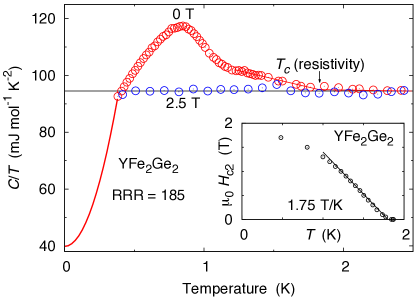
The superconducting heat capacity anomaly is suppressed in applied magnetic field, allowing a view of the underlying normal state. The high field data show a nearly constant Sommerfeld ratio. This suggests that the slow rise in shown in Zou et al. (2014) may actually have been the flank of a superconducting anomaly, broadened by sample inhomogeneity, although other possibilities, such as closer proximity of the earlier samples to a putative magnetic quantum critical point cannot as yet be ruled out. Using the normal state measured in applied field, we can employ an entropy-conserving equal area construction to extrapolate the current data to lower temperature. Depending on the low temperature form of the heat capacity, the residual Sommerfeld coefficient in the limit required by balancing the entropy reaches , or of the normal state value, respectively, for a linear (line-nodes), quadratic (point nodes) or BCS-like (isotropic gap) temperature dependence of Sup (2015). Similar or even larger residual fractions were found in early studies in the unconventional superconductor Sr2RuO4 NishiZaki et al. (1998); *nishizaki99, as well as in KFe2As2 Hardy et al. (2013) and CsFe2As2 Wang et al. (2013). SQUID magnetometry Zou et al. (2014) suggested superconducting volume fractions approaching even in samples of lower quality. It is likely that the present procedure still overestimates the residual Sommerfeld ratio. If the superconducting gap varies substantially on different sheets of the Fermi surface, as has been proposed for KFe2As2 Hardy et al. (2014), this can cause a marked further downturn of the heat capacity at temperatures well below , not captured in the current data.
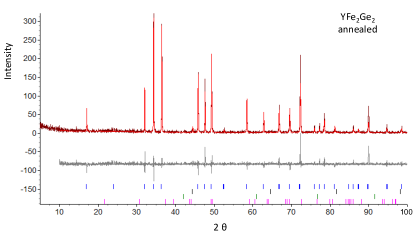
More detailed measurements to lower temperature will be necessary to distinguish between gap scenarios, but the present data already rule out alien phases as the origin of the superconducting heat capacity anomaly: powder x-ray diffraction limits alien phase content to less than even in the worst cases, of which the leading contribution is made by ferromagnetic Fe0.85Ge0.15 Sup (2015). To obtain an apparent superconducting fraction from a alien phase sample fraction would require the alien phase to display a colossal normal state Sommerfeld coefficient of the order of , which would in turn not be consistent with the observed critical field, the expected composition of any alien phase and the magnitude of . An anomaly of this magnitude can therefore not be consistent with the contribution of a conventional superconducting alien phase.
Further information about the superconducting state can be inferred from its response to applied magnetic field. In our new generation of samples, the initial slope of the resistive upper critical field is determined as (inset of Fig. 3). This corresponds to an extrapolated clean-limit weak-coupling orbital-limited critical field Helfand and Werthamer (1966), slightly below the value reported in Zou et al. (2014) for a sample with a lower . This discrepancy may be attributed to critical field anisotropy and preferential alignment within our polycrystals. The value for exceeds the observed critical field in the low temperature limit, suggesting that the low temperature critical field is Pauli limited. In the standard treatment (e.g. Tinkham (2004)), the extrapolated orbital-limited critical field corresponds to a superconducting coherence length , where is the quantum of flux. Such a short coherence length is roughly consistent with the enhanced quasiparticle mass and consequently low Fermi velocity indicated by the high Sommerfeld coefficient of the specific heat capacity: we estimate the BCS coherence length from Tinkham (2004); Orlando et al. (1979), where is the Fermi velocity and is the superconducting gap, taken to be . If the electronic structure of YFe2Ge2 (Fig. 4) is approximated as an ellipsoidal hole sheet around the Z point of diameter and height , its enclosed volume is , corresponding to 1.1 carriers per formula unit, and its surface area . The expression for given above can be rewritten in terms of as , where is the volume per primitive unit cell, is the molar gas constant and is the normal state Sommerfeld coefficient, giving , in rough agreement with the estimate for obtained above from the critical field measurement.
The mean free path in our samples can likewise be estimated (e.g. Orlando et al. (1979)) from the Drude theory result , where now includes the total Fermi surface area, which we estimate as . This gives a mean free path of for samples with residual resistivity (). The observation that correlates with the residual resistance ratio (Fig. 2) and that full transitions are observed in samples for which is consistent with unconventional superconductivity Mackenzie et al. (1998). Heat capacity anomalies were only observed in samples with , corresponding to . We attribute this primarily to the consequences of sample inhomogeneity: already the magnetisation measurements Zou et al. (2014) showed broad transitions in lower quality samples, suggesting that the resistive gives an upper bound on a distribution of transition temperatures inside the sample. This distribution could be caused by inhomogeneity in chemical composition or by inhomogeneity in purity, as measured by the RRR, and it would cause the heat capacity anomaly to be smeared out in all but the best samples. Our new heat capacity data, in which the main anomaly occurs at a temperature of about 1K, well below the resistive transition, shows that even in the highest quality samples there is still a significant width to the distribution of values, which would in the simplest picture follow the distribution of RRR values in the sample. Further complications could arise from multiband superconductivity.
| RFe2X2 | X-X | |||
|---|---|---|---|---|
| (Å) | (Å) | (Å) | ||
| YFe2Ge2 | ||||
| KFe2As2 () | ||||
| KFe2As2 () |
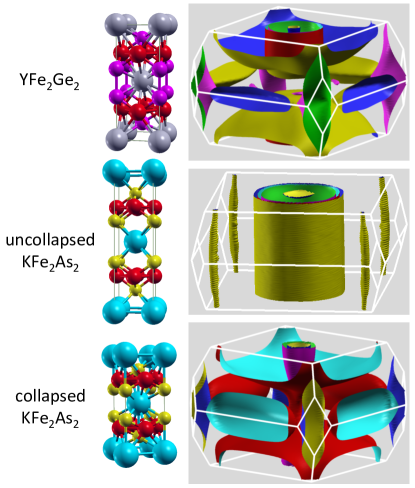
The present thermodynamic evidence establishes superconductivity in YFe2Ge2 as an intrinsic bulk phenomenon, motivating a more careful look at the likely pairing mechanism. Two theoretical studies Subedi (2014); Singh (2014) investigate the electronic structure of YFe2Ge2, its magnetic properties and the role these could play in determining its superconducting gap structure. Both studies arrive at a Fermi surface structure similar to that shown in Fig. 4. The Fermi surface is dominated by a large disk-shaped hole pocket enclosing the Z-point of the body-centred tetragonal Brillouin zone, as well as a cylindrical electron pocket in the corner of the zone. There are also several smaller hole pockets around the Z-point.
The calculated Fermi surface in YFe2Ge2 is very similar to that expected for KFe2As2 in the pressure induced collapsed tetragonal phase (Fig. 4) Nakajima et al. (2015); Guterding et al. (2015). This strongly suggests that YFe2Ge2 is an isoelectronic and isostructural reference compound to collapsed-tetragonal KFe2As2. The lattice collapse in 1-2-2 arsenides is linked to the formation of As-As bonds Hoffmann and Zheng (1985) and therefore is expected to have profound consequences for the electronic structure, changing the Fe oxidation state to that of YFe2Ge2, which features Ge-Ge bonds already at ambient pressure (Tab. 1). In view of the recent surprising discovery of superconductivity at enhanced transition temperatures exceeding in KFe2As2 within the collapsed-tetragonal phase Ying et al. (2015); Nakajima et al. (2015), the scenarios for superconductivity in YFe2Ge2 put forward by Subedi Subedi (2014) and Singh Singh (2014) assume a wider relevance. Whereas the former argues that the presence of an electron pocket at the zone corner and hole pockets near the zone centre favour antiferromagnetic spin fluctuations and an order parameter wave function, the latter puts forward a more radical proposal: noting that magnetism with ordering wavevector can be induced in YFe2Ge2 by alloying with isoelectronic Lu Fujiwara et al. (2007); Ran et al. (2011), and that this ordered state also represents the lowest energy spin state within DFT calculations, ferromagnetic (within the plane) correlations could induce a triplet superconducting state. The scenario resembles the proposal which has been advanced for high pressure KFe2As2 Guterding et al. (2015).
Our experimental results demonstrate that YFe2Ge2 undergoes a superconducting instability at out of a strongly correlated normal state with a high Sommerfeld ratio and a non-Fermi liquid form for the temperature dependence of the resistivity, . Together with the strong sensitivity to disorder of the resistive and of the heat capacity anomaly this suggests an unconventional pairing mechanism. Unconventional superconductivity is rare among transition metal compounds, and YFe2Ge2 stands out for its comparatively isotropic, 3D Fermi surface, when compared to the cuprates, iron pnictides and chalcogenides, or Sr2RuO4. The electronic structure of YFe2Ge2 resembles that of KFe2As2 in the collapsed tetragonal phase, which can be induced by applied hydrostatic pressure and in which superconductivity with transition temperatures of the order of have been reported Ying et al. (2015); Nakajima et al. (2015). This establishes YFe2Ge2 as a reference compound for investigating the origin of superconductivity in the collapsed tetragonal phase in alkali metal iron arsenides, which is otherwise only accessible at very high applied pressures.
I Acknowledgments
Acknowledgements.
We thank, in particular, S. Friedemann, M. Gamza, C. Geibel, P. Niklowitz and G. Lonzarich for helpful discussions, and J. Dann and P. Brown for assistance in aspects of sample preparation and low temperature measurement. The work was supported by the EPSRC of the UK and by Trinity College.References
- Kamihara et al. (2006) Y. Kamihara, H. Hiramatsu, M. Hirano, R. Kawamura, H. Yanagi, T. Kamiya, and H. Hosono, Journal of the American Chemical Society 128, 10012 (2006).
- Avila et al. (2004) M. Avila, S. Bud’ko, and P. Canfield, J. Magn. Magn. Mater. 270, 51 (2004).
- Zou et al. (2014) Y. Zou, Z. Feng, P. W. Logg, J. Chen, G. Lampronti, and F. M. Grosche, Physica Status Solidi - Rapid Research Letters 8, 928 (2014).
- Kim et al. (2015) H. Kim, S. Ran, E. D. Mun, H. Hodovanets, M. A. Tanatar, R. Prozorov, S. L. Bud’ko, and P. C. Canfield, Philosophical Magazine 95, 804 (2015).
- Subedi (2014) A. Subedi, Physical Review B - Condensed Matter and Materials Physics 89, 024504 (2014).
- Singh (2014) D. J. Singh, Physical Review B - Condensed Matter and Materials Physics 89, 024505 (2014).
- Ran et al. (2011) S. Ran, S. L. Bud’ko, and P. C. Canfield, Philosophical Magazine 91, 4388 (2011).
- Sirica et al. (2015) N. Sirica, F. Bondino, S. Nappini, I. Píš, L. Poudel, A. D. Christianson, D. Mandrus, D. J. Singh, and N. Mannella, Physical Review B 91, 121102 (2015).
- Felner et al. (2015) I. Felner, B. Lv, K. Zhao, and C. W. Chu, Journal of Superconductivity and Novel Magnetism 28, 1207 (2015).
- Sup (2015) See Supplemental Material at [URL] for details of the heat capacity analysis and of powder x-ray diffraction results.
- Perdew et al. (1996) J. P. Perdew, K. Burke, and M. Ernzerhof, Physical Review Letters 77, 3865 (1996).
- Blaha et al. (2001) P. Blaha, K. Schwarz, G. Madsen, D. Kvasnicka, and J. Luitz, (2001).
- Ying et al. (2015) J.-J. Ying, L.-Y. Tang, V. V. Struzhkin, H.-K. Mao, A. G. Gavriliuk, A.-F. Wang, X.-H. Chen, and X.-J. Chen, arXiv.org (2015), 1501.00330v1 .
- Pfleiderer et al. (2001) C. Pfleiderer, S. Julian, and G. Lonzarich, Nature 414, 427 (2001).
- Takashima et al. (2007) S. Takashima, M. Nohara, H. Ueda, N. Takeshita, C. Terakura, F. Sakai, and H. Takagi, Journal of the Physical Society of Japan 76, 043704 (2007).
- Smith et al. (2008) R. P. Smith, M. Sutherland, G. G. Lonzarich, S. S. Saxena, N. Kimura, S. Takashima, M. Nohara, and H. Takagi, Nature 455, 1220 (2008).
- Brando et al. (2008) M. Brando, W. J. Duncan, D. Moroni-Klementowicz, C. Albrecht, D. Gruener, R. Ballou, and F. M. Grosche, Physical Review Letters 101, 026401 (2008).
- Dong et al. (2010) J. K. Dong, S. Y. Zhou, T. Y. Guan, H. Zhang, Y. F. Dai, X. Qiu, X. F. Wang, Y. He, X. H. Chen, and S. Y. Li, Physical Review Letters 104, 087005 (2010).
- Hong et al. (2013) X. C. Hong, X. L. Li, B. Y. Pan, L. P. He, A. F. Wang, X. G. Luo, X. H. Chen, and S. Y. Li, Physical Review B 87, 144502 (2013).
- Hardy et al. (2013) F. Hardy, A. E. Böhmer, D. Aoki, P. Burger, T. Wolf, P. Schweiss, R. Heid, P. Adelmann, Y. X. Yao, G. Kotliar, J. Schmalian, and C. Meingast, Physical Review Letters 111, 027002 (2013).
- Hlubina and Rice (1995) R. Hlubina and T. M. Rice, Physical Review B 51, 9253 (1995).
- Rosch (1999) A. Rosch, Physical Review Letters 82, 4280 (1999).
- NishiZaki et al. (1998) S. NishiZaki, Y. Maeno, S. Farner, S. I. Ikeda, and T. Fujita, Journal of the Physical Society of Japan 67, 560 (1998).
- NishiZaki et al. (1999) S. NishiZaki, Y. Maeno, and Z. Mao, Journal of Low Temperature Physics 117, 1581 (1999).
- Wang et al. (2013) A. F. Wang, B. Y. Pan, X. G. Luo, F. Chen, Y. J. Yan, J. J. Ying, G. J. Ye, P. Cheng, X. C. Hong, S. Y. Li, and X. H. Chen, Physical Review B 87, 214509 (2013).
- Hardy et al. (2014) F. Hardy, R. Ederl, M. Jackson, D. Aoki, C. Paulsen, T. Wolf, P. Burger, A. Böhmer, P. Schweiss, P. Adelmann, R. A. Fisher, and C. Meingast, Journal of the Physical Society of Japan 83 (2014).
- Helfand and Werthamer (1966) E. Helfand and N. R. Werthamer, Physical Review 147, 288 (1966).
- Tinkham (2004) M. Tinkham, Introduction to Superconductivity, Vol. 1 (Dover Publications, 2004).
- Orlando et al. (1979) T. P. Orlando, E. J. McNiff, S. Foner, and M. R. Beasley, Physical Review B 19, 4545 (1979).
- Mackenzie et al. (1998) A. Mackenzie, R. Haselwimmer, A. Tyler, G. Lonzarich, Y. Mori, S. NishiZaki, and Y. Maeno, Physical Review Letters 80, 3890 (1998).
- Rozsa and Schuster (1981) S. Rozsa and H.-U. Schuster, Z. Naturforsch. 36b, 1668 (1981).
- Nakajima et al. (2015) Y. Nakajima, R. Wang, T. Metz, X. Wang, L. Wang, H. Cynn, S. T. Weir, J. R. Jeffries, and J. Paglione, Physical Review B 91, 060508 (2015).
- Guterding et al. (2015) D. Guterding, S. Backes, H. O. Jeschke, and R. Valentí, Physical Review B 91, 140503 (2015).
- Hoffmann and Zheng (1985) R. Hoffmann and C. Zheng, Journal of Physical Chemistry 89, 4175 (1985).
- Fujiwara et al. (2007) T. Fujiwara, N. Aso, H. Yamamoto, M. Hedo, Y. Saiga, M. Nishi, Y. Uwatoko, and K. Hirota, Journal of the Physical Society of Japan Supplement 76, 60 (2007).
Superconductivity in the layered iron germanide YFe2Ge2
Supplemental Material
II Analysis of heat capacity measurements
In order to extract estimates of the low temperature residual , and thereby of the non-superconducting fraction of the sample, we have extrapolated the data subject to an entropy balancing constraint commonly used in this situation: the normal state entropy just above has to match the entropy of the superconducting state just below . To obtain the normal state entropy, we integrate up the heat capacity in applied magnetic fields larger than the upper critical field,
which can be approximated as . Here, is the Sommerfeld coefficient in the field-induced normal state, which is taken as constant (Fig. 5).
The superconducting state entropy has a known contribution within the measured temperature range,
where is the lowest temperature measured. This integral is calculated from the measured data using the trapezoidal method. A further contribution, , then results from the extrapolation of the heat capacity data to lower temperature. It has to satisfy . Moreover, we constrain the extrapolation to join the measured data point at the lowest measured temperature : , where is the extrapolated heat capacity.
For an initial analysis, we have chosen three forms for the temperature dependence of :
-
1.
Linear, corresponding to line nodes in the gap function:
-
2.
Quadratic, corresponding to point nodes in the gap function:
-
3.
The BCS form for an isotropic gap , which approaches in the low temperature limit, where we retain the freedom to fix a different from the resistive :
Here, , and denote the non-superconducting fractions of the sample in the three cases. The constraints mentioned above, namely (i) matching of normal state entropy and superconducting state entropy at , and (ii) matching of extrapolation function heat capacity and measured heat capacity at the lowest measured temperature , make it possible to fix and in the forms (1) and (2), above, or and in the BCS form (3).
A comparison of the three extrapolation schemes is shown in Fig. 5. It demonstrates that independently of the details of the extrapolation scheme, the superconducting fraction is at least of order of the sample: (i) for the linear extrapolation of , ; (ii) for the quadratic extrapolation, and (iii) for the BCS form: . The BCS extrapolation required setting a superconducting transition temperature of , however, which is well below the peak in the heat capacity plot, casting doubt on its applicability.
The inset of Fig. 5 shows over a wider temperature range, illustrating the change in slope in vs. near the resistive . Whereas is nearly constant above , it rises slowly below (orange line on the inset in Fig. 5), before the main heat capacity anomaly is reached. The rise on cooling indicated by the orange line can be attributed to a significant fraction of the sample undergoing the superconducting transition before the main part of the sample, as would be expected from the discrepancy between the resistive and the temperature at which the main heat capacity anomaly takes place.
III Sample characterisation by powder x-ray diffraction
All data were collected in Bragg-Brentano geometry on a D8 Bruker diffractometer equipped with a primary Ge monochromator for Cu Kα1 and a Sol-X solid state detector to reduce the effects of Fe fluorescence (Fig. 6). Collection conditions were: in , step size, 10 seconds/step, divergence slits 0.1 mm, receiving slit 0.2 mm, sample spinning. Rietveld refinements were performed with the software Topas 4.1.
Crystal structures of all phases were retrieved from the inorganic crystal structure database: YFe2Ge2 (I4/mmm, ICSD reference code: 81745); Fe0.85Ge0.15 (Im-3m, 103493); Fe (Im-3m, 64795); FeGe2 (I4/mcm; 42519). A spherical harmonic model was applied to correct for preferred orientation of YFe2Ge2 within the powder. No structural parameter was refined when resolving the phase content. A shifted Chebyshev function with six parameters was used to fit the background. Peak shapes of all phases were modelled using Pseudo-Voigt functions.