A Kiloparsec-Scale Nuclear Stellar Disk in the Milky Way as a Possible Explanation of the High Velocity Peaks in the Galactic Bulge
Abstract
The Apache Point Observatory Galactic Evolution Experiment has measured the stellar velocities of red giant stars in the inner Milky Way. We confirm that the line of sight velocity distributions (LOSVDs) in the mid-plane exhibit a second peak at high velocities, whereas those at do not. We use a high resolution simulation of a barred galaxy, which crucially includes gas and star formation, to guide our interpretation of the LOSVDs. We show that the data are fully consistent with the presence of a thin, rapidly rotating, nuclear disk extending to . This nuclear disk is orientated perpendicular to the bar and is likely to be composed of stars on x2 orbits. The gas in the simulation is able to fall onto such orbits, leading to stars populating an orthogonal disk.
Subject headings:
Galaxy: bulge — Galaxy: evolution — Galaxy: formation — Galaxy: kinematics and dynamics — Galaxy: stellar content1. Introduction
Detections of high Galactic standard-of-rest velocity () peaks in the Apache Point Observatory Galactic Evolution Experiment (APOGEE) commissioning data were reported by Nidever et al. (2012) across all fields at and . Nidever et al. (2012) interpreted the high- peaks as being due to stars in the Galactic bar. However, the peaks are not statistically significant in a number of fields (Li et al., 2014) and no high- peaks were found at negative longitudes in the Bulge Radial Velocity Assay (BRAVA), at (Kunder et al., 2012). Additionally, no high- peaks can be found in pure -body models (Li et al., 2014). Molloy et al. (2015) demonstrated that resonant (2:1 and higher order) orbits, viewed on their own, were able to generate high- peaks. Aumer & Schönrich (2015) proposed that such resonant orbits are populated by young stars recently trapped by the bar; they argued that the APOGEE selection function is biased toward such young stars.
Bars have been implicated in building large gas reservoirs at the centers of galaxies, fuelling high star formation rates there. As in other barred galaxies, the Milky Way (MW)’s bar funnels gas inwards (Binney et al., 1991; Weiner & Sellwood, 1999; Fux, 1999). This gas gives rise to structures such as the Central Molecular Zone (CMZ), spanning . The CMZ contains of molecular gas (Bally et al., 1987; Güsten, 1989), driving a star formation rate of yr-1 (Wardle & Yusef-Zadeh, 2008). A molecular gas disk extends across and (Boyce & Cohen, 1994; Dame & Thaddeus, 1994). Liszt & Burton (1980) and Ferrière et al. (2007) interpreted the observed molecular, atomic and ionized gas outside the CMZ to Galactic longitude as a (tilted) disk with semi-major axis of radius with a hole at its center. In external galaxies, star formation in nuclear rings builds nuclear disks (Kormendy & Kennicutt, 2004). In this Letter we demonstrate that the high- peaks in the line of sight velocity distributions (LOSVDs) are consistent with the presence of a nuclear disk in the MW.
2. Simulation
Here we use a high resolution simulation, with gas and star formation, which develops a bar, driving gas to the center and forming a stellar nuclear disk (Cole et al., 2014), to derive the kinematic signatures of such a disk. We use these to guide our interpretation of the APOGEE Data Release 12 (Alam et al., 2015) stellar velocity data for the inner MW. While the simulation was not designed to match the MW, Cole et al. (2014) showed that the nuclear disk that it forms is qualitatively similar to those in external galaxies.
The simulation was evolved with the -bodysmoothed particle hydrodynamics code gasoline (Wadsley et al., 2004). The galaxy forms out of gas cooling off a hot corona in pressure equilibrium within a dark matter halo of virial mass . Both the dark matter halo and the initial gas corona are represented by particles. As the gas cools and reaches high density, star formation is triggered. Star particles then provide feedback via winds from massive stars, and types Ia and II supernovae (Stinson et al., 2006). Gas particles all have initial mass of and star particles are spawned from gas with of this mass. This high mass resolution allows us to use a high star formation threshold of 100 for the gas (Governato et al., 2010). By the end of the simulation the galaxy has a stellar mass of in particles. This large number of star particles provides a very fine sampling of the mass distribution at the center of the model. Further details of the simulation are provided in Cole et al. (2014)
The bar forms at around 4 Gyr. After 6 Gyr a prominent nuclear disk starts to form which, by 10 Gyr, has a semi-major axis of . The nuclear disk is perpendicular to the bar and its stellar streaming is perpendicular to the bar’s. At 10 Gyr the nuclear disk in the simulation is quite massive and is thus unlikely to match any nuclear disk in the MW. Therefore here we consider the model at two earlier times: at Gyr, before the nuclear disk forms, and at Gyr when a strong nuclear disk is established. Aside from the nuclear disk becoming more massive and the bar growing longer, the model at 10 Gyr is not qualitatively different from at .
2.1. Scaling to the MW and Viewing Perspective
In order to compare to the MW, we rescale the model in both size and velocity. Size rescaling is accomplished by matching the size of the bar to that of the MW. Between and the average size of the bar in the simulation, as measured from the radius at which the phase of the Fourier moment deviates from a constant by more than (Aguerri et al., 2003), is 2.1 kpc. Assuming that the MW’s bar has a semi-major axis of (Gerhard, 2002), we scale all coordinates by a factor of 1.67. (Scaling to the more up-to-date bar size of Wegg et al. (2015), , leads to a nuclear disk which is much too large; because we seek a closer nuclear disk size match, we scale to the older bar size, but this is not to imply that the real MW bar semi-major axis is closer to than .) The velocity scale factor is obtained by a least-squares fit to the line of sight velocity dispersion of the model to Abundances and Radial velocity Galactic Origins Survey (Ness et al., 2013) data for all stars within Galactocentric radius at = , and across . We obtain a velocity scaling factor of 0.48. While these scalings lead to a model of roughly the right size and rotational velocity we stress that the model still does not match the MW and we only use it to qualitatively predict the expected trends in the MW, not their magnitude or precise location.
We assume that the Sun is 8 from the Galactic Center, and place the observer at . We orient the bar at to the line of sight (Wegg & Gerhard, 2013). Since we compare our model with APOGEE (Alam et al., 2015) data, which targets bright red giant stars, we adopt a uniform selection function for star particles at , where is the distance from the Sun (Schultheis et al., 2014; Hayden et al., 2015). Reducing the maximum to 8 kpc does not significantly alter our conclusions. We use an opening angle of for each LOSVD, to match the size of the smallest APOGEE bulge fields. The (off-plane) line of sight with the least particles contains over 2800 star particles while the best sampled (mid-plane) field has over 57,000 star particles; thus the shapes of the model LOSVDs are well determined. The top row of Figure 1 shows the model’s surface density distribution.
2.2. Line of Sight Velocity Distributions
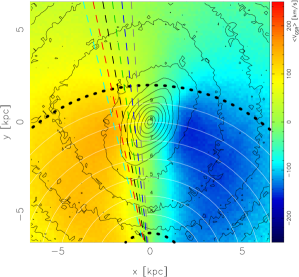
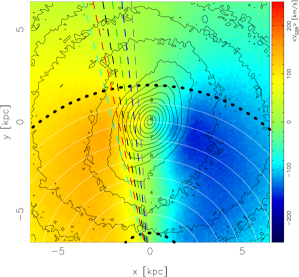
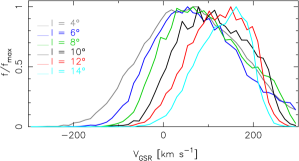
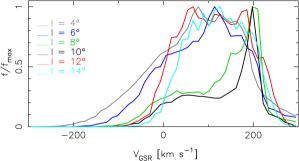
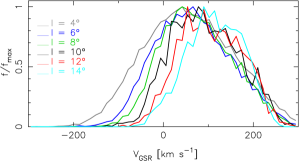
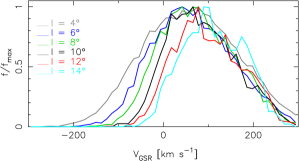
Viewing the model from the Solar perspective, we measure the distribution of line of sight velocities in the Galactocentric restframe, . Figure 1 shows the LOSVDs for various lines-of-sight (indicated in the top row) in the mid-plane (, second row) and off-plane (, third row). At each LOSVD at has a single peak, both in the mid-plane and off the plane. The LOSVDs have a shoulder to high , which Li et al. (2014) showed is produced by stars at large distances seen close to tangentially. The peak in moves to larger velocities with increasing , but remains well below the Galaxy’s circular velocity. By the LOSVDs at and have developed a second, high- peak. This peak is more prominent than the low- peak, due to the model’s very vigorous star formation in the nuclear disk, roughly ten times higher than in the MW for the corresponding region. This very high star formation rate quickly leads to a relatively massive nuclear disk; thus the relative amplitudes of the low- and high- peaks are not predictions of the model. Indeed if we reduce the weight of star particles younger than 1 by a factor of 5, to compensate for the high star formation rate of the model, then the high- peaks become smaller than the main peaks, as seen in Figure 1. The distribution around the high- peak is narrower (i.e. cooler) than that around the main peak and is skewed toward low . Interior to , the LOSVDs are broadened relative to those at , but no high- peak is evident. At no high- peak is present in the mid-plane, indicating that the structure responsible for the feature does not extend this far. The off-plane and mid-plane LOSVDs are not substantially different at , aside from the mid-plane hosting more stars at . At the high- peaks, which dominate the mid-plane, are entirely absent in the LOSVDs. Therefore the presence of a nuclear disk is only evident in the mid-plane. As in the MW, outside the nuclear disk, the off-plane LOSVDs at also contain a statistically significant high- peak/shoulder, but this is also present at , and is not related to the nuclear disk. Thus the kinematic signatures of a nuclear disk are (1) a second, high- peak at roughly the circular velocity, (2) which is absent a few degrees off the mid-plane, (3) is kinematically cooler than the low- peak, and (4) is skewed toward low .
2.3. LOSVD Stacking
The top row of Figure 1 shows color-coded maps of the average , ; the peak velocities at orbit tangent points manifest as the characteristic “winged” pattern of the fields. Although the two maps show the model before and after the nuclear disk forms, they are not very different, indicating that the formation of the nuclear disk does not lead to a wholesale change of the galaxy as much as populating new parts of its phase space. At the low longitudes of the nuclear disk, large occurs only close to the galactic center while at other radii is smaller.
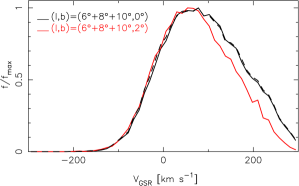
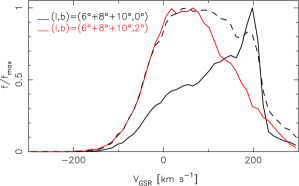
Even with a survey the size of APOGEE, the number of stars in individual fields is still relatively small, giving a low signal-to-noise ratio for any second peak in any one field (Li et al., 2014). In order to overcome this difficulty, we note that the of the second peak does not change significantly with longitude at . Therefore by stacking the LOSVDs we can enhance the signal-to-noise ratio of the high- peak. Because the main peak is dominated by stars streaming along the bar, and of these changes with , the main peak in a stacked LOSVD will be quite broad. If we include , then the exponentially higher density of disk and bar stars near the center masks out any features at high . In the bottom panels of Figure 1 we present a stack of the model’s LOSVDs at , and . As with the individual LOSVDs, a peak at high is evident at in the mid-plane but is absent at . Moreover this second peak is still cooler than the low- peak, and remains skewed toward it. Thus stacking LOSVDs preserves the kinematic signatures of a nuclear disk, and provides a reliable method for searching for a nuclear disk in the APOGEE data.
3. APOGEE data
3.1. Data Selection
We select APOGEE survey stars in the fields of interest, excluding stars with the STAR BAD flag (corresponding to poor stellar parameter fits) and those flagged as flux and telluric standards. Stars with a velocity scatter between different visits of more than are also removed. (The same analysis including also stars flagged as STAR BAD, which leads to 763 in the plane and 1401 out of the plane, gives results in agreement with the more conservative cut.)
The small numbers of stars in the APOGEE commissioning data resulted in peaks with low signal-to-noise ratio. We increase the statistical significance of a high- peak by stacking the APOGEE DR12 data in the longitude range for fields in the mid-plane and off-plane at (totalling 617 and 1114 stars, respectively). Table 1 lists the fields stacked together and the number of stars used from each field.
| Field | [∘] | [∘] | Stack | |
|---|---|---|---|---|
| 4336 | 6.0 | 0.0 | 471 | mid-plane |
| 4355 | 8.0 | 0.0 | 146 | mid-plane |
| 4365 | 5.7 | 2.0 | 387 | off-plane |
| 4366 | 5.7 | -2.0 | 424 | off-plane |
| 4373 | 7.8 | -2.0 | 154 | off-plane |
| 4377 | 7.7 | 2.0 | 149 | off-plane |
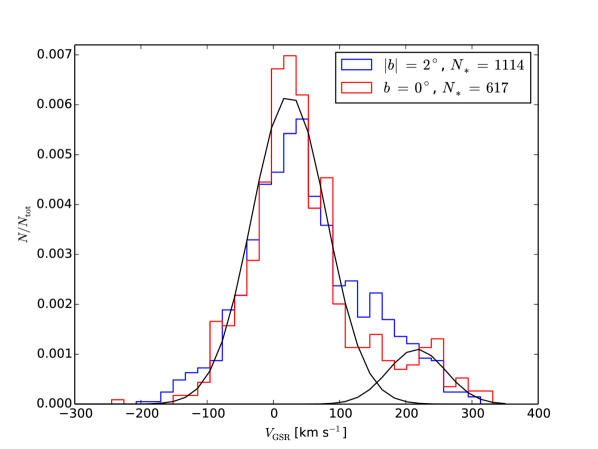
Figure 2 plots these two stacked APOGEE LOSVDs. The mid-plane stack has a clear second peak at , corresponding to roughly the circular velocity of the MW in the bulge region (Sofue et al., 2009). No comparable second peak is visible in the off-plane stacked LOSVD, which is non-Gaussian and skewed toward high , i.e. it has a shoulder to high (Li et al., 2014). A Kolmogorov-Smirnov test shows that the null hypothesis that the mid-plane and off-plane LOSVDs are drawn from the same distribution has a relatively low -value of .
We fit two Gaussians to the mid-plane stacked LOSVD in the range , constrained such that the smaller Gaussian contains less than of the stars (to avoid fitting just the skewed low- distribution with two Gaussians). We obtain a low- component having mean velocity and standard deviation , while the high- component has and , making it cooler than the low- component. These two Gaussians are also shown in Figure 2. The velocity distribution at hints at a skewness opposite to that of the main distribution, but the signal-to-noise ratio is still too low for a robust measurement.
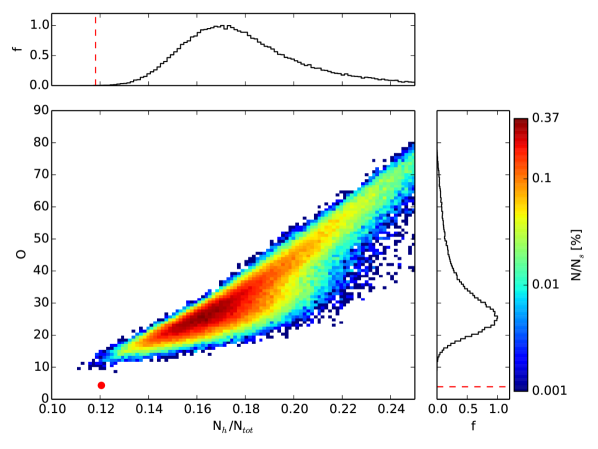
The high- Gaussian has a significant number of stars associated with it, and is significantly separated from the low- Gaussian. In order to test the likelihood of such a second peak arising purely from Poisson noise, we perform Monte-Carlo tests drawing 617 stars from the off-plane stacked LOSVD. Fitting two Gaussians as before to the resulting LOSVD, we label as and the low- and high- components, respectively. We repeat this procedure 100,000 times, and for each we compute , the ratio of stars in the high- component to the total number of stars, and the overlap of the two components, defined as
| (1) |
The results are presented in Figure 3; the observed mid-plane stacked LOSVD has and . Only of the Monte-Carlo samples have , while none of them have overlap , showing that the observed double-peaked mid-plane stacked LOSVD is highly unlikely to result from Poisson noise. The APOGEE data therefore show a statistically significant double-Gaussian LOSVD in the mid-plane, the properties of which agree with 3 of the 4 kinematic signatures of a nuclear disk from the simulation. While the signal-to-noise is too low to be sure if the high- peak is skewed to low , the data are suggestive that it is. Therefore a kiloparsec-scale nuclear disk can explain the high- peaks in the APOGEE data.
A simple estimate for the nuclear disk mass can be obtained from the fraction of stars in the high- component of the double-Gaussian fit to the mid-plane LOSVD. If we conservatively assume that the nuclear disk mass contained within and is of the total mass of the Besançon Galaxy model (Robin et al., 2012) within this volume we obtain a lower limit to the mass of the nuclear disk .
4. Discussion
Attempts to explain the high- peak directly via collisionless bar simulations fails (Nidever et al., 2012; Li et al., 2014). However Molloy et al. (2015) demonstrated that resonant, bar-supporting 2:1 x1 (with some mixture of higher order resonance) orbits by themselves can produce second peaks. Subsequently Aumer & Schönrich (2015) argued that the selection function of APOGEE favors young stars recently trapped into resonant orbits. Their interpretation requires that the stars in the high- peaks are younger. The other main 2:1 resonant orbit family of bars, the x2 family, is orientated perpendicular to the bar. This family is generally very poorly populated in the absence of gas (Sparke & Sellwood, 1987; Pfenniger & Friedli, 1991), but when gas is present it is driven inwards by the bar and settles into x2 orbits (Binney et al., 1991). The gas can then form stars and produce nuclear rings and disks. We propose that the high- peak corresponds to a kiloparsec-scale disk composed of stars on x2 orbits. These orbits are stable and therefore our model does not require that the stars in the high- peak are young.
Nuclear disks are known in many external galaxies (Scorza & van den Bosch, 1998; Zasov & Moiseev, 1999; Pizzella et al., 2002; Emsellem et al., 2004; Krajnović et al., 2008; Ledo et al., 2010); the presence of one in the MW is therefore not unusual. Nor is the kiloparsec scale unusual as a fraction of the bar size. For instance in NGC 3945 the ratio of semi-major axes of the nuclear disk to bar is (Erwin & Sparke, 1999; Cole et al., 2014), whereas for the MW this ratio is , if we adopt Wegg et al. (2015)’s bar. The gas ring in the simulation is larger than the MW’s CMZ, which is coincident with a stellar disk (Launhardt et al., 2002; Schönrich et al., 2015). The large size of the gas ring in the model is a consequence of the still low resolution () of our simulation (Li et al., 2015; Sormani et al., 2015). This difference implies that the nuclear disk in the MW is not currently forming stars across its full extent.
We anticipate that this proposal will inspire further detailed mapping of the central mid-plane of the MW. We will provide predictions from our model of a kiloparsec-scale nuclear disk elsewhere.
References
- Aguerri et al. (2003) Aguerri, J. A. L., Debattista, V. P., & Corsini, E. M. 2003, MNRAS, 338, 465
- Alam et al. (2015) Alam, S., et al. 2015, ArXiv e-prints
- Aumer & Schönrich (2015) Aumer, M., & Schönrich, R. 2015, ArXiv e-prints
- Bally et al. (1987) Bally, J., Stark, A. A., Wilson, R. W., & Henkel, C. 1987, ApJS, 65, 13
- Binney et al. (1991) Binney, J., Gerhard, O. E., Stark, A. A., Bally, J., & Uchida, K. I. 1991, MNRAS, 252, 210
- Boyce & Cohen (1994) Boyce, P. J., & Cohen, R. J. 1994, A&AS, 107, 563
- Cole et al. (2014) Cole, D. R., Debattista, V. P., Erwin, P., Earp, S. W. F., & Roškar, R. 2014, MNRAS, 445, 3352
- Dame & Thaddeus (1994) Dame, T. M., & Thaddeus, P. 1994, ApJ, 436, L173
- Emsellem et al. (2004) Emsellem, E., et al. 2004, MNRAS, 352, 721
- Erwin & Sparke (1999) Erwin, P., & Sparke, L. S. 1999, ApJ, 521, L37
- Ferrière et al. (2007) Ferrière, K., Gillard, W., & Jean, P. 2007, A&A, 467, 611
- Fux (1999) Fux, R. 1999, A&A, 345, 787
- Gerhard (2002) Gerhard, O. 2002, in ASP Conf. Ser. 273: The Dynamics, Structure & History of Galaxies: A Workshop in Honour of Professor Ken Freeman, 73
- Governato et al. (2010) Governato, F., et al. 2010, Nature, 463, 203
- Güsten (1989) Güsten, R. 1989, in IAU Symposium, Vol. 136, The Center of the Galaxy, ed. M. Morris, 89
- Hayden et al. (2015) Hayden, M. R., et al. 2015, ApJ, 808, 132
- Kormendy & Kennicutt (2004) Kormendy, J., & Kennicutt, R. C. 2004, ARAA, 42, 603
- Krajnović et al. (2008) Krajnović, D., et al. 2008, MNRAS, 390, 93
- Kunder et al. (2012) Kunder, A., et al. 2012, AJ, 143, 57
- Launhardt et al. (2002) Launhardt, R., Zylka, R., & Mezger, P. G. 2002, A&A, 384, 112
- Ledo et al. (2010) Ledo, H. R., Sarzi, M., Dotti, M., Khochfar, S., & Morelli, L. 2010, MNRAS, 407, 969
- Li et al. (2015) Li, Z., Shen, J., & Kim, W.-T. 2015, ApJ, 806, 150
- Li et al. (2014) Li, Z.-Y., Shen, J., Rich, R. M., Kunder, A., & Mao, S. 2014, ApJ, 785, L17
- Liszt & Burton (1980) Liszt, H. S., & Burton, W. B. 1980, ApJ, 236, 779
- Molloy et al. (2015) Molloy, M., Smith, M. C., Wyn Evans, N., & Shen, J. 2015, ArXiv e-prints
- Ness et al. (2013) Ness, M., et al. 2013, MNRAS, 432, 2092
- Nidever et al. (2012) Nidever, D. L., et al. 2012, ApJ, 755, L25
- Pfenniger & Friedli (1991) Pfenniger, D., & Friedli, D. 1991, A&A, 252, 75
- Pizzella et al. (2002) Pizzella, A., Corsini, E. M., Morelli, L., Sarzi, M., Scarlata, C., Stiavelli, M., & Bertola, F. 2002, ApJ, 573, 131
- Robin et al. (2012) Robin, A. C., Marshall, D. J., Schultheis, M., & Reylé, C. 2012, A&A, 538, A106
- Schönrich et al. (2015) Schönrich, R., Aumer, M., & Sale, S. E. 2015, ArXiv e-prints
- Schultheis et al. (2014) Schultheis, M., et al. 2014, AJ, 148, 24
- Scorza & van den Bosch (1998) Scorza, C., & van den Bosch, F. C. 1998, MNRAS, 300, 469
- Sofue et al. (2009) Sofue, Y., Honma, M., & Omodaka, T. 2009, PASJ, 61, 227
- Sormani et al. (2015) Sormani, M. C., Binney, J., & Magorrian, J. 2015, MNRAS, 449, 2421
- Sparke & Sellwood (1987) Sparke, L. S., & Sellwood, J. A. 1987, MNRAS, 225, 653
- Stinson et al. (2006) Stinson, G., Seth, A., Katz, N., Wadsley, J., Governato, F., & Quinn, T. 2006, MNRAS, 373, 1074
- Wadsley et al. (2004) Wadsley, J. W., Stadel, J., & Quinn, T. 2004, New Astronomy, 9, 137
- Wardle & Yusef-Zadeh (2008) Wardle, M., & Yusef-Zadeh, F. 2008, ApJ, 683, L37
- Wegg & Gerhard (2013) Wegg, C., & Gerhard, O. 2013, MNRAS, 435, 1874
- Wegg et al. (2015) Wegg, C., Gerhard, O., & Portail, M. 2015, MNRAS, 450, 4050
- Weiner & Sellwood (1999) Weiner, B. J., & Sellwood, J. A. 1999, ApJ, 524, 112
- Zasov & Moiseev (1999) Zasov, A. V., & Moiseev, A. V. 1999, in IAU Symposium, Vol. 194, Activity in Galaxies and Related Phenomena, ed. Y. Terzian, E. Khachikian, & D. Weedman, 279