Constraints on the substellar companions in wide orbits around
the Barnard’s Star from CanariCam mid-infrared imaging
Abstract
We have performed mid-infrared imaging of Barnard’s Star, one of the nearest stars to the Sun, using CanariCam on the 10.4 m Gran Telescopio Canarias. We aim to investigate an area within 1–10 arcsec separations, which for the 1.83 pc distance of the star translates to projected orbital separations of 1.8–18 au ( 12 yr), which have not been explored yet with astrometry or radial velocity programs. It is therefore an opportunity to enter the domain of distances where most giant planets are expected to form. We performed deep imaging in the -band window (Si-2 filter, 8.7 m) reaching a 3 detection limit of 0.85 0.18 mJy and angular resolution of 0.24 arcsec, close to the diffraction limit of the telescope at this wavelength. A total of 80 min on-source integration time data were collected and combined for the deepest image. We achieved a dynamical range of mag in the 8.7 m band, at angular separations from 2 to 10 arcsec and of 6–8 mag at 1–2 arcsec. No additional sources were found. Our detectability limits provide further constraints to the presence of substellar companions of the Barnard’s Star. According to solar metallicity evolutionary models, we can exclude companions of masses larger than 15 ( K), ages of a few Gyr, and located in 3.6–18 au orbits with a confidence level. This minimum mass is approximately 5 smaller than any previous imaging survey that explored the surroundings of Barnard’s Star could restrict.
keywords:
brown dwarfs – stars: imaging – stars: individual: Barnard’s Star – solar neighbourhood – infrared: planetary systems.1 Introduction
Optical and near-infrared high-contrast observations are of major importance in the study of substellar objects. Direct imaging searches for brown dwarfs and planets around stars explore a range of physical separations complementary to that of radial velocity or transit methods and provide key information on their formation processes. Benefit of detecting the direct light of planets is that it enables their extensive characterization. We can determine their ages, masses, radii, effective temperature and, in particular, through spectroscopy we can have insight into their complex atmospheres (Marley et al., 2012; Currie et al., 2013). Yet, reaching a sufficiently high-luminosity contrast at arcsecond level angular separations from the target star is still very challenging. As a result, in comparison with the transit method or precision radial velocity measurements, direct imaging brought only a few discoveries so far, e.g., Chauvin et al. (2004), Béjar et al. (2008), Marois et al. (2008); Marois et al. (2010), Lagrange et al. (2010), Rameau et al. (2013), Carson et al. (2013) and Gauza et al. (2015). Most of the planets found by imaging are massive (), young ( 500 Myr), and are located at relatively large projected physical separations (10–30 to 1000 au) around their host stars. Thus, each single discovery extending the known population of imaged planets has still an important impact on the field.
| OB | Observation | Start time | Savesets per | Nod | Saveset | On-source | Instrument | PWV | Readout |
|---|---|---|---|---|---|---|---|---|---|
| date | (UTC) | nod beam | cycles | time (s) | time (s) | PA (∘) | (mm) | mode | |
| 1 | 2012 July 29 | 23:13:18.7 | 8 | 10 | 6 | 3403.7 | 0 | 8.6–9.3 | S1R1_CR |
| 2 | 2012 July 30 | 00:20:01.6 | 8 | 10 | 6 | 3403.7 | 90 | 8.6–9.3 | S1R1_CR |
| 3 | 2013 June 09 | 03:40:42.2 | 29 | 12 | 1.5 | 3431.9 | 0 | 6.7 | S1R3 |
| 4 | 2013 June 10 | 04:18:36.2 | 29 | 10 | 1.5 | 3359.9 | 300 | 6.7 | S1R3 |
In the formation process, gravitational collapse energy is released and heats the interior of a planet but, as there is no internal source of energy, planet cools and fades down with age. Giant planets at ages younger than 500 Myr are more easily detectable since at that stage their self-luminosity is still significant. However, the vast majority of stars from the solar vicinity (2–10 pc) are relatively old, with ages similar to the age of the Sun. Any potential planet from a nearby system, unless orbiting at close separation from its host star, where it is strongly irradiated, is expected to have cooled down to effective temperature below 500–600 K. Its spectral energy distribution would peak in the mid-IR range. Moreover, a solar-type star will be relatively faint at these wavelengths, so that the contrast necessary to detect a planet or a brown dwarf companion will be lower. Currently, direct imaging of planets is feasible with the use of Hubble Space Telescope (HST) or the largest ground-based facilities equipped with adaptive optics systems, e.g. Gemini/NICI, Keck/NIRC2, VLT/NaCo, Subaru/HiCIAO, operating in the optical or near-IR regime. Searches require proper observing and data processing techniques which attempt to remove diffracted light like Lyot coronography (Sivaramakrishnan et al., 2001) or nulling interferometry (Hinz et al., 1998; Serabyn, 2000) and to suppress the speckle background (Angular Differential Imaging; Marois et al., 2006; Lafrenière et al., 2007). In this work, we explore the potential of ground-based imaging at mid-IR wavelengths to directly detect planetary-mass objects.
Barnard’s Star (GJ 699, V2500 Oph) is the fourth-closest individual star and the second-closest system to the Sun currently known, after the triple Centauri stellar system. It is also the closest star in the Northern hemisphere. It was classified as an M4.0V-type red dwarf (Reid et al., 1995), located at 1.8240.005 pc (van Leeuwen, 2007) and moving at the highest known proper motion arcsec per year. A slow rotation with a period of about 130 d (Benedict et al., 1998), low magnetic activity (Hünsch et al., 1999) and other age indicators suggest that it is probably older than the Sun. Since its large proper motion was measured by Barnard (1916), the star received much attention from astronomers. Its bolometric luminosity and effective temperature were found to be L⊙ and K (Dawson & De Robertis, 2004). From mass–luminosity relations for very low mass stars, Delfosse et al. (2000) determined the mass of GJ 699 to be 0.1580.013 M⊙. Particularly, extensive studies have been carried out refining the limits of possible planetary-mass companions (e.g., Benedict et al., 1999; Dieterich et al., 2012; Choi et al., 2013). Here, we present the results of mid-IR imaging of this star using CanariCam at the GTC. The following sections of the paper describe the performed observations, reduction and analysis of the collected data, determination of the sensitivity limits, its translation to the physical parameters (mass, separations) of detectable companions and comparison with the previous surveys.
2 CanariCam observations
Observations of the Barnard’s Star were carried out in queue mode, during the nights of 2012 July 29 and 2013 June 9 and 10 (UT). We used the mid-infrared camera CanariCam (Telesco et al., 2008) operating at the Nasmyth-A focal station of the 10.4 m Gran Telescopio Canarias (GTC) at the Roque de los Muchachos Observatory on the island of La Palma. CanariCam was designed to reach the diffraction limit of the GTC at mid-IR wavelengths (7.5–25 m). The instrument uses a Raytheon 320240 Si:As detector with a pixel scale of mas, which covers a field of view of arcsec on the sky. We imaged our target in the 10 micron window, using a medium-band silicate filter centred at (). The choice of this particular bandpass was a compromise between the instrument performance, in particular the filters transmissivity, and the sky background contribution significantly higher at the broad-band and other narrow-band filters than at the Si-2 filter. Si-2 is also favoured by a better spatial resolution, since the diffraction disc is larger at the available narrow-band filters at longer wavelengths.
Observations were performed with the standard chopping and nodding technique used in the mid-IR to remove the sky emission and radiative offset. Chopping consists of switching the telescope secondary mirror at a typical frequency of a few (2–5) Hz between the position of the source (on-source) and the nearby sky (off-source). This rapid movement of the secondary mirror allows subtraction of the sky background emission that is varying in time at frequencies below the chop frequency. Movement of the secondary mirror changes the optical configuration of the telescope, resulting in two different emission patterns seen by the camera and producing a spurious signal termed the radiative offset in the chop-differenced images. To remove the radiative offset, the telescope is moved between two nod positions to swap over on- and off-source positions. We used a ABBA nodding sequence and ‘on-chip’ chopping and nodding, with a chop-throw and nod offset of 8 arcsec, a chopping frequency of 1.93–2.01 Hz and a nod settle time of about 45 s. On chip method is recommended whenever the scientific target is point-like, since both on-source and off-source chop positions contain the signal of the target inside the detector field of view and can be aligned and combined. On-source integration time in each of the four observing blocks (OBs) was 20 min, divided into three data files composed of a set of images (savesets) at subsequent chopping and nodding positions. Individual frames of 26 and 19 ms exposures were co-added by CanariCam control software to savesets of 1.6 and 6 s for S1R3 and S1R1_CR readout modes, respectively. A detailed observing log is given in Table 1.
In total, we integrated the source for 80 min. Sky conditions during the observations were photometric. Precipitable water vapour (PWV) as measured by the Instituto de Astrofísica de Canarias real-time PWV monitor, was 8.6–9.3 and 6.7 mm for OB 1, 2 and OB 3, 4, respectively. We observed with a set of three different position angles of the instrument on the sky, 0∘, 90∘ and 300∘, and with two chop position angles of the secondary mirror, 0∘ and 90∘, to guarantee that the chop offset was done along the -axis. By that, we wanted to avoid the loss of potential objects in the regions overlapping with the negative images of the star from the off-source chop positions or in parts obscured by the horizontal cross-talk features that appear for bright sources (Okamoto et al., 2003). Also, we could discard eventual contaminants along the chop axis.
3 Data reduction and analysis
3.1 Image processing
The data were processed using standard routines within the iraf111iraf is distributed by the National Optical Astronomy Observatories, which are operated by the Association of Universities for Research in Astronomy, Inc., under cooperative agreement with the National Science Foundation. environment. CanariCam images are stored in the standard multi-extension fits files, with a structure of [320, 240, 2, M][N], where 320 and 240 are the image pixel dimensions, 2 is the number of chop positions, M of savesets and N of nod positions.
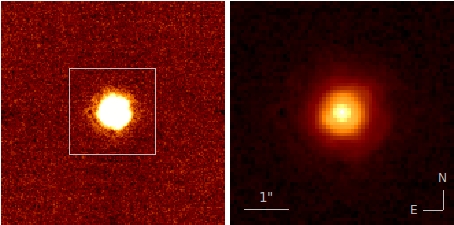
Off-source savesets, where the position of the secondary mirror is not aligned with the primary mirror, were subtracted from the corresponding on-source savesets, for respective nod beam position. These chop-/sky-subtracted frames, where the star is located at the centre of the detector, were then aligned to correct for very small misalignments (of less than 3 pixels), and each pair corresponding to the A and B nod positions were combined, to subtract the radiative offset. The sky-subtracted frames where multiplied by 1 to recover the negative contributions of the star (off-source position of the secondary mirror). Because the negatives in the A and B nod positions do not overlap, being at opposite sides and at 8 arcsec of the on-source central location, they were radiative-offset subtracted before they were aligned. Residual detector levels constant along single columns or lines but varying across these remained in both the positive and negative chop- and nod-subtracted frames; these were background fitted (masking the target) and subtracted. The alignment itself was applied at once, to all (positive and negative) images of consecutive repetitions of an OB, relative to a same reference image and so that the target has its centroid located on an integer pixel position. Before aligning, the images were copied into larger ones to avoid the trimming of outer data regions. Then the frames were average-combined per repetition or altogether, using a shallow sigma upper and lower clipping to discard occasional short transients and extreme pixel values. Each combination involved masking the negative counts of the target. OB 4 had cross-talk features that we had removed. OB 2 and 4 were acquired with position angles differing from the North-up East-left orientation. For OB 2, we transposed the stack to North-up East-left, whereas for OB 4, we resampled the stack. In total, the data of OB 1, 2 and 3 were thus resampled only once, whereas those of OB 4 twice. For the combination of the stacks of the different OBs, the stacks were flux-scaled according to their zero-point magnitude – as measured on the target – and weighted inversely proportional to the scaled variance of their background noise and the square of the full-width half-maximum (FWHM) of the target. The central part of the final reduced image, with total on-source time of 80 min is displayed in Fig. 1. An image mosaic of the whole covered area is displayed in Fig. 2. This all-epoch mosaic extends to distance of about 20 arcsec (37 au) to the target at the four cardinal directions.
3.2 Sensitivity and detection limits
The star point-spread function (PSF) on the final obtained images has an FWHM of 3.01 pixels corresponding to 0.24 arcsec, for the image including all-epoch data, and 2.89 pixels (0.23 arcsec) for the image including single epoch data from OB 3 and 4. It is close to the theoretical FWHM of the diffraction-limited PSF, which for GTC is 0.19 arcsec at 8.7 m.
To determine the Barnard’s Star magnitude in the Si-2 filter we used the photometry from the Two Micron All Sky Survey (2MASS; Skrutskie et al. 2006) and from the Wide-field Infrared Survey Explorer (WISE) All-Sky and AllWISE Source Catalogs (Wright et al. 2010). We converted the 2MASS and WISE magnitudes into fluxes using the corresponding Vega zero points and interpolated the values to obtain average flux at 8.7 m through a least-squares fit to a power function. WISE measurement was not used in the fit because of saturation, affecting sources brighter than approximately 6.7 mag in this band. The calculated Si-2 brightness of Barnard’s Star is mag, using the Vega system zero point determined for this CanariCam filter. This value is very close to the 3 magnitude of the star ( mag). For our deepest image, that is, the one combined from all OBs, the limiting magnitude is mag (0.85 0.18 mJy), estimated using the ratio of the peak counts of the star to 3 background noise.
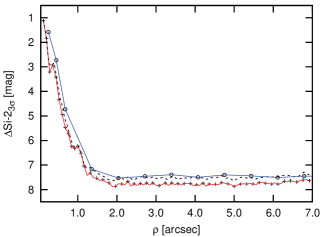
In Fig. 3, we present the 3 contrast curves for CanariCam image of Barnard’s Star. The two solid lines shown in the plot correspond to two different contrast calculation methods that have been used. In the first approach, we computed the background noise, , as a function of radial separation from the target star, by measuring the standard deviation in a 1 pixel wide concentric annuli around the star. The 3 noise counts were converted to contrast (delta magnitudes between the primary star and the measured quantity, noise in this case) by relating to the peak pixel value of the star PSF. The contrast curve obtained using this method is plotted in Fig. 3 with a red solid line with cross marks.
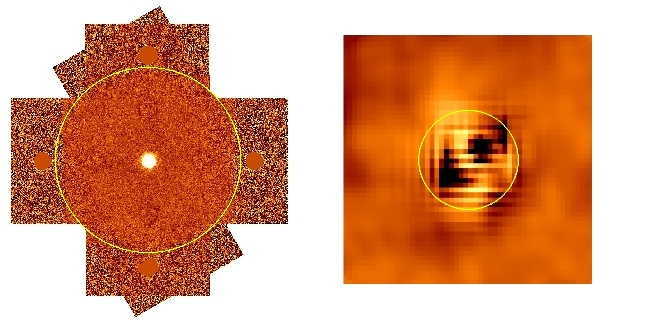
In the second method, we used artificial sources to estimate the detection limits and contrast as a function of radius. Artificial objects were produced using the PSF model of the primary and inserted on the diagonal axes, with intervals of FWHM ( arcsec) and decreasing steps in the inner parts of the image. We considered as a detection when the added object at a given magnitude and radial distance is detected through visual inspection in at least three of the four diagonal positions. A simulated source with its PSF retaining characteristic stellar shape and visible marginally above the background noise corresponds typically to a signal to noise of 3–5. To examine the inner area (within 1 arcsec) around the star, we performed target PSF subtraction on the images with inserted artificial sources by rotation or flipping along an axis, by previously measuring the centre and semi-major axis of the ellipse isophote closest to the level of the candidates (10) we expect to find in the PSF wings. Example images with simulated artificial objects are shown in Fig. 4. Results from this two methods, which were found consistent, yield that we reach a dynamical range in Si-2 of about 6 mag at arcsec separation from the target star and a maximum of 8 mag at separations arcsec. The second method systematically yields detection limit as a function of projected separation from the Barnard’s Star that is about 0.25 mag brighter than obtained with the first method.
At the range of projected orbital separations explored in this search, with roughly one year period separating the two observations, the orbital motion of a potential companion may not be negligible. We estimate that a planetary mass companion at a 18 au circular orbit orientated face-on would move 0.3 arcsec over one year baseline which is approximately the FWHM of our CanariCam images, and up to 0.8 arcsec at 3 au orbit (1.5 arcsec angular separation). At an edge-on orientation, the shift could be higher than 0.3 arcsec at separations closer than 5 au. Since for some range of parameter space the displacement would be higher than the spatial resolution of the images, we provide also the detection limit of single epoch data. The dashed line in Fig. 3 is the contrast curve determined on the image obtained using only first epoch images (OBs 3 and 4, Table 1). The achieved detection limit in this case, with a total of 40 min on-source time, is about 0.25 mag lower than that achieved with the use of both epochs observations.
4 Constraints on the presence of companions
4.1 Physical interpretation of detection limits
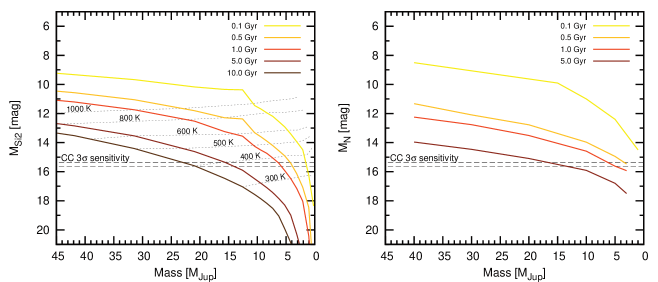
In the following we relate the detection limits of our search to the physical properties of brown dwarf and planetary companions, specifically to their masses, effective temperatures and luminosities. A complication inherent to objects in the substellar domain is the continuous cooling in the course of their evolution. It precludes the possibility to estimate the mass applying unique relations independent of age, such as the mass–luminosity relation for the main-sequence stars. In this case, we need to rely on theoretical models providing a grid of luminosities, temperatures, synthetic photometry as a function of masses and ages. In this work, we used the Ames-COND models (Allard et al. 2001; Baraffe et al. 2003; Allard et al. 2012) for solar metallicity and the models of giant planets and brown dwarfs by Burrows et al. (1997). Both the COND and the Burrows et al. (1997) models apply to K and extend down to 100 K. They include the formation of dust in the atmospheres of this objects, however they neglect its opacity, considering that the dust grains settle below the photosphere. To compute the synthetic magnitudes for the Si-2 8.7 m band we used the Phoenix Star, Brown Dwarf & Planet Simulator available online222http://phoenix.ens-lyon.fr/simulator/index.faces. We input the transmission file of the Si-2 filter and obtained the isochrones for a set of five different ages: 0.1, 0.5, 1, 5 and 10 Gyr.
At the relatively old ages (1 Gyr), substellar companions in the planetary-mass regime have cooled down to temperatures below 600 K, according to theoretical evolutionary models (Burrows et al., 1997; Chabrier et al., 2000). At these temperatures, brown dwarfs and giant planets are very faint in the near-IR and emit most of their flux in the mid-IR. As an example, while a 5 planet near-IR flux decrease from mag at 10 Myr to mag at 4.5 Gyr, the mid-IR emission only changes from 11.5 mag to 16 mag in the same interval of age.
In the left-hand panel of Fig. 5, we plot the Si-2 absolute magnitudes versus masses produced by the models, in comparison with the 3 detection limit of our CanariCam observations. For ages of 1 Gyr and younger, objects down to 5 would have been detected. At solar ages, we are sensitive to objects with masses higher than approximately 15 or with effective temperatures above 400 K and at projected separations from 3 to 18 au. At smaller separations, around 1 arcsec (2 au), we could have detected objects with masses above 20 .
Several indicators point that the Barnard’s Star belongs to the older population. The non-detection of lithium in the atmosphere imposes a minimum age of 20 Myr (Zuckerman & Song, 2004). The level of chromospheric activity suggest an age above 600–800 Myr (Rauscher & Marcy, 2006). It has a very low X-ray luminosity () indicating low level magnetic activity (Hünsch et al., 1999; Vaiana et al., 1981). Eggen (1996) estimated the age of GJ 699 at 10 Gyr based on the Ca ii index. Also its high space velocities (Leggett, 1992; Eggen, 1996), lower than solar metallicity [Fe/H]= (Gizis, 1997) and a probable long rotation period of approximately 130 days (Benedict et al., 1998) are all consistent with a relatively advanced age of 7–12 Gyr. At that age, our sensitivity limit enables us to detect companions more massive than approximately 20 with K.
For a comparison, we have checked the models by Burrows et al. (1997, right-hand panel of Fig. 5) that provide synthetic photometry in the N band (10 ) at ages of 0.1, 0.5, 1 and 5 Gyr for objects with masses below 40 . We find that the two models are in a fairly good agreement and give a similar mass and constraint using the same Si-2 sensitivity limit. We interpret that the slightly brighter magnitudes for the same masses yield by the -band isochrones result from a wider bandpass and longer central wavelength of this filter, at which the flux of very cool objects is expected to be larger, as well as from differences between the two models.
4.2 Comparison with previous searches and WISE data
First claim of planetary companions of Barnard’s Star were reported in the late 60s by van de Kamp (1969). Using astrometry, he detected perturbations in the proper motion of the star consistent with two planets comparable in mass with Jupiter. These planets however were definitively ruled out by the radial velocity studies. Choi et al. (2013) used Doppler measurements obtained from Lick and Keck Observatories with a precision of 2 m s-1 during an 8 yr monitoring to preclude planetary companions of masses above 2 Earth masses with periods below 10 days and above 10 Earth masses with periods up to 2 yr, save for face-on orbits. (area labelled ‘I’ in Fig. 6). This result is supported by the probability of 94.6–98.2% that the orbital inclination of putative companions is larger than 11∘–19∘. Various ground- and space-based imaging surveys dedicated to detect ultracool companions targeted the Barnard’s Star along the past two decades. In this section, we focus on the ones that reached the highest sensitivities up to date and compare them with our results.
Dieterich et al. (2012) carried out a large, volume-limited search for substellar companions to stars (mainly around M dwarfs) in the solar neighbourhood within 10 pc. The survey was performed with the HST NICMOS instrument, using four filters centred at 1.10, 1.80, 2.07 and 2.22 m, for snapshot high-resolution imaging of 255 individual stars. Physical separations accessible in this search correspond to mean semimajor axes between 5 and 70 au. The minimum detectable mass was estimated to be 42 at 3 Gyr or 52 at 5 Gyr. The masses were derived using the Chabrier et al. (2000) models. For the Barnard’s Star however, as it is one of the nearest stars from the sample, closer separations were probed. For the survey limits on this particular star, we used the information from the table 2 in Dieterich et al. (2012), which gives the sensitivities achieved for each target at various separations. The range of masses and separations of companions ruled out by this survey is marked as area II in Fig. 6.
Oppenheimer et al. (2001) observed northern stars from the 8 pc sample including GJ 699, in the optical (Gunn and filters) and near-infrared wavelengths ( filters). They used the Adaptive Optics Coronograph instrument on the Palomar 1.5 m telescope for the optical imaging and the Cassegrain Infrared Camera on the Palomar 5 m Hale Telescope, for the near-IR. For about 80% of the surveyed stars, companions more massive than 40 at 5 Gyr age would have been detected at separations between 40 and 120 au. The mass detection limits were determined using the Burrows et al. (1997) evolutionary models. The area marked as III in Fig. 6 shows the limits of the lowest mass detectable by the survey at the closest accessible separations, given in tables 11 and 12 in Oppenheimer et al. (2001).
Schroeder et al. (2000) searched for faint companions to 23 stars within 13 pc of the Sun using the HST Wide Field Planetary Camera 2. Barnard’s Star was imaged through , and filters using short and long exposures ranging from 1.6 to 600 s, to map different separations from the target star. According to the limits shown in fig. 13 in the paper, their survey was sensitive to objects of about at angular separations larger than 1.5 arcsec, at arcsec and beyond 3.5 arcsec, for an age of 5 Gyr. The authors also employed the Burrows et al. (1997) models to derive the limits of the survey in terms of companion masses. These limits are shown in Fig. 6 as area IV, which extends up to 30 au.
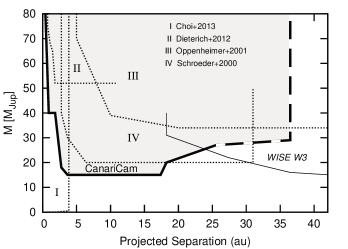
Fig. 6 summarizes in a simplified manner the detectability limits of the described surveys and of the CanariCam imaging search in terms of companion mass lower limits and projected physical separations. Additionally, we have included the detection limits of the search for companions we have carried using the WISE W3 band data at 12 m. We have retrieved Barnard’s Star’s image from the WISE All-Sky release using the IRSA Wise Image Service. To derive the sensitivity in the inner part, we have previously performed a PSF subtraction of the target using as a reference the PSF of a similar brightness star located close to the Barnard’s Star on the sky, after scaling their peak fluxes. We then obtained the 3 limit of sensitivity of using the same method as for the CanariCam data and compared to the Ames-COND models computed for this band. We estimated a sensitivity of = 9.7–9.8 mag at 14–15 arcsec separations, 10.5 mag at 20 arcsec and a limit of 11.5 mag (1.0 mJy) at 40 arcsec and beyond. According to models, a (solar age) companion of at least 15 located at separation 40 arcsec ( 73 au) would have been detected. The obtained detection limit in terms of sensitivity and of objects masses and effective temperatures is in agreement with the general documentation of the mission (Wright et al., 2010) and other studies that employed WISE data, e.g. Luhman (2014). This search for companions using WISE W3 data which extends to wider separations is complementary with our higher resolution CanariCam images and provides similar sensitivity.
Radial velocity and astrometry techniques exclude planetary companions of less than 1 with orbital periods up to 2 yr (Choi et al., 2013; Benedict et al., 1999). This detection limits are still far beyond the capabilities of any other method, whereas at wider orbits direct imaging provides the strongest constraints on the presence of companions. With CanariCam, we could have detected companions more massive than at projected separations from 3 to 18 au for an age of 5 Gyr. CanariCam observations have enabled us to set the strongest constraints on the presence of very low mass brown dwarfs in wide orbits (3.6–18 au) with a 99% confidence level. However, it should be noted that this statement is based on model evolution predictions. Were the models prove to be invalid for these least massive substellar objects, the obtained mass and temperature lower limits would have to be reviewed. In particular, the Ames-COND isochrones that were used, are available only for solar abundance. Given the slightly sub-solar metallicity of the Barnard’s Star, this may result in a difference of the derived mass.
5 Summary and final remarks
We performed a deep, high spatial resolution imaging of the Barnard’s Star at mid-IR Si-2 8.7 wavelength using CanariCam at the 10.4 m GTC telescope. No companion candidates were found on the obtained images. Our detectability limits provide further constraints on the presence of substellar companions. With 80 min on-source integration time we achieved sensitivity of 0.85 0.18 mJy allowing to detect massive planets and brown dwarf companions down to which corresponds to effective temperatures above 400 K, assuming a solar age. Our search covers a field of 1–10 arcsec radius around the target star (2–18 au for Barnard’s Star distance), which means that we can probe the domain of distances where most giant planets are expected to form (Chabrier et al., 2014).
This work demonstrates that the modern ground-based mid-IR imaging
instruments operating on 10-m class telescopes can reach angular
resolutions and sensitivity limits as good and, in certain cases
(e.g. nearby, relatively old stars) better than adaptive optics
systems in the optical or near-IR or space telescopes. This
technique presents a high potential to perform direct imaging
studies of brown dwarfs and exoplanets.
ACKNOWLEDGEMENTS
We are grateful to the GTC staff for performing the CanariCam observations.
This publication makes use of data products from the Wide-field Infrared
Survey Explorer, which is a joint project of the University of California,
Los Angeles, and the Jet Propulsion Laboratory/California Institute of
Technology, funded by the National Aeronautics and Space Administration.
Based on observations made with the Gran Telescopio Canarias (GTC), installed
in the Spanish Observatorio del Roque de los Muchachos of the Instituto de
Astrofísica de Canarias, in the island of La Palma.
This work is partially funded by the national program AYA2010-20535 funded
by the Spanish ministry of Economy and Competitiveness (MINECO).
References
- Allard et al. (2001) Allard F., Hauschildt P. H., Alexander D. R., Tamanai A., Schweitzer A., 2001, ApJ, 556, 357
- Allard et al. (2012) Allard F., Homeier D., Freytag B., 2012, Royal Society of London Philosophical Transactions Series A, 370, 2765
- Baraffe et al. (2003) Baraffe I., Chabrier G., Barman T. S., Allard F., Hauschildt P. H., 2003, A&A, 402, 701
- Barnard (1916) Barnard E. E., 1916, AJ, 29, 181
- Béjar et al. (2008) Béjar V. J. S., Zapatero Osorio M. R., Pérez-Garrido A., Álvarez C., Martín E. L., Rebolo R., Villó-Pérez I., Díaz-Sánchez A., 2008, ApJL, 673, L185
- Benedict et al. (1999) Benedict G. F., McArthur B., Chappell D. W., Nelan E., Jefferys W. H., van Altena W., Lee J., Cornell D., Shelus P. J., Hemenway P. D., Franz O. G., Wasserman L. H., Duncombe R. L., Story D., Whipple A. L., Fredrick L. W., 1999, AJ, 118, 1086
- Benedict et al. (1998) Benedict G. F., McArthur B., Nelan E., Story D., Whipple A. L., Shelus P. J., Jefferys W. H., Hemenway P. D., Franz O. G., Wasserman L. H., Duncombe R. L., van Altena W., Fredrick L. W., 1998, AJ, 116, 429
- Burrows et al. (1997) Burrows A., Marley M., Hubbard W. B., Lunine J. I., Guillot T., Saumon D., Freedman R., Sudarsky D., Sharp C., 1997, ApJ, 491, 856
- Carson et al. (2013) Carson J., Thalmann C., Janson M., Kozakis T., Bonnefoy M., Biller B., Schlieder J., Currie T., McElwain M., Goto M., Henning T., 2013, ApJL, 763, L32
- Chabrier et al. (2000) Chabrier G., Baraffe I., Allard F., Hauschildt P., 2000, ApJ, 542, 464
- Chabrier et al. (2014) Chabrier G., Johansen A., Janson M., Rafikov R., 2014, Protostars and Planets VI, pp 619–642
- Chauvin et al. (2004) Chauvin G., Lagrange A.-M., Dumas C., Zuckerman B., Mouillet D., Song I., Beuzit J.-L., Lowrance P., 2004, A&A, 425, L29
- Choi et al. (2013) Choi J., McCarthy C., Marcy G. W., Howard A. W., Fischer D. A., Johnson J. A., Isaacson H., Wright J. T., 2013, ApJ, 764, 131
- Currie et al. (2013) Currie T., Burrows A., Madhusudhan N., Fukagawa M., Girard J. H., Dawson R., Murray-Clay R., Kenyon S., Kuchner M., Matsumura S., Jayawardhana R., Chambers J., Bromley B., 2013, ApJ, 776, 15
- Dawson & De Robertis (2004) Dawson P. C., De Robertis M. M., 2004, AJ, 127, 2909
- Delfosse et al. (2000) Delfosse X., Forveille T., Ségransan D., Beuzit J.-L., Udry S., Perrier C., Mayor M., 2000, A&A, 364, 217
- Dieterich et al. (2012) Dieterich S. B., Henry T. J., Golimowski D. A., Krist J. E., Tanner A. M., 2012, AJ, 144, 64
- Eggen (1996) Eggen O. J., 1996, AJ, 111, 466
- Gauza et al. (2015) Gauza B., Béjar V. J. S., Pérez-Garrido A., Rosa Zapatero Osorio M., Lodieu N., Rebolo R., Pallé E., Nowak G., 2015, ApJ, 804, 96
- Gizis (1997) Gizis J. E., 1997, AJ, 113, 806
- Hinz et al. (1998) Hinz P. M., Angel J. R. P., Hoffmann W. F., McCarthy D. W., McGuire P. C., Cheselka M., Hora J. L., Woolf N. J., 1998, Nature, 395, 251
- Hünsch et al. (1999) Hünsch M., Schmitt J. H. M. M., Sterzik M. F., Voges W., 1999, A&AS, 135, 319
- Lafrenière et al. (2007) Lafrenière D., Marois C., Doyon R., Nadeau D., Artigau É., 2007, ApJ, 660, 770
- Lagrange et al. (2010) Lagrange A.-M., Bonnefoy M., Chauvin G., Apai D., Ehrenreich D., Boccaletti A., Gratadour D., Rouan D., Mouillet D., Lacour S., Kasper M., 2010, Science, 329, 57
- Leggett (1992) Leggett S. K., 1992, ApJs, 82, 351
- Luhman (2014) Luhman K. L., 2014, ApJL, 786, L18
- Marley et al. (2012) Marley M. S., Saumon D., Cushing M., Ackerman A. S., Fortney J. J., Freedman R., 2012, ApJ, 754, 135
- Marois et al. (2006) Marois C., Lafrenière D., Doyon R., Macintosh B., Nadeau D., 2006, ApJ, 641, 556
- Marois et al. (2008) Marois C., Macintosh B., Barman T., Zuckerman B., Song I., Patience J., Lafrenière D., Doyon R., 2008, Science, 322, 1348
- Marois et al. (2010) Marois C., Zuckerman B., Konopacky Q. M., Macintosh B., Barman T., 2010, Nature, 468, 1080
- Okamoto et al. (2003) Okamoto Y. K., Kataza H., Yamashita T., Miyata T., Sako S., Takubo S., Honda M., Onaka T., 2003 Vol. 4841 of Society of Photo-Optical Instrumentation Engineers (SPIE) Conference Series, . pp 169–180
- Oppenheimer et al. (2001) Oppenheimer B. R., Golimowski D. A., Kulkarni S. R., Matthews K., Nakajima T., Creech-Eakman M., Durrance S. T., 2001, AJ, 121, 2189
- Rameau et al. (2013) Rameau J., Chauvin G., Lagrange A.-M., Boccaletti A., Quanz S. P., Bonnefoy M., Girard J. H., Delorme P., Desidera S., Klahr H., Mordasini C., Dumas C., Bonavita M., 2013, ApJL, 772, L15
- Rauscher & Marcy (2006) Rauscher E., Marcy G. W., 2006, PASP, 118, 617
- Reid et al. (1995) Reid I. N., Hawley S. L., Gizis J. E., 1995, AJ, 110, 1838
- Schroeder et al. (2000) Schroeder D. J., Golimowski D. A., Brukardt R. A., Burrows C. J., Caldwell J. J., Fastie W. G., Ford H. C., Hesman B., Kletskin I., Krist J. E., Royle P., Zubrowski R. A., 2000, AJ, 119, 906
- Serabyn (2000) Serabyn E., 2000 Vol. 4006 of Society of Photo-Optical Instrumentation Engineers (SPIE) Conference Series, . pp 328–339
- Sivaramakrishnan et al. (2001) Sivaramakrishnan A., Koresko C. D., Makidon R. B., Berkefeld T., Kuchner M. J., 2001, ApJ, 552, 397
- Skrutskie et al. (2006) Skrutskie M. F., Cutri R. M., Stiening R., Weinberg M. D., Schneider S., Carpenter J. M., Beichman C., Capps R., 2006, AJ, 131, 1163
- Telesco et al. (2008) Telesco C. M., Packham C., Ftaclas C., Hough J. H., Moerchen M. M., Hanna K. T., Julian J. A., Varosi F., Julian R. E., Bennett G., Murphey C., Reyes F., Warner C., 2008, in Society of Photo-Optical Instrumentation Engineers (SPIE) Conference Series Vol. 7014 of Society of Photo-Optical Instrumentation Engineers (SPIE) Conference Series, Day-one science with CanariCam, the Gran Telescopio Canarias multi-mode mid-infrared camera. p. 0
- Vaiana et al. (1981) Vaiana G. S., Cassinelli J. P., Fabbiano G., Giacconi R., Golub L., Gorenstein P., Haisch B. M., Harnden Jr. F. R., Johnson H. M., Linsky J. L., Maxson C. W., Mewe R., Rosner R., Seward F., Topka K., Zwaan C., 1981, ApJ, 245, 163
- van de Kamp (1969) van de Kamp P., 1969, AJ, 74, 757
- van Leeuwen (2007) van Leeuwen F., 2007, A&A, 474, 653
- Wright et al. (2010) Wright E. L., Eisenhardt P. R. M., Mainzer A. K., Ressler M. E., Cutri R. M., Jarrett T., Kirkpatrick J. D., Padgett D., 2010, AJ, 140, 1868
- Zuckerman & Song (2004) Zuckerman B., Song I., 2004, ARA&A, 42, 685