Systematic variation of central mass density slope in early-type galaxies
Abstract
We study the total density distribution in the central regions ( effective radius, ) of early-type galaxies (ETGs), using data from the SPIDER survey (La Barbera et al. 2010). We model each galaxy with two components (dark matter halo + stars), exploring different assumptions for the dark matter (DM) halo profile, and leaving stellar mass-to-light () ratios as free fitting parameters to the data. For a Navarro et al. (1996) profile, the slope of the total mass profile is non-universal. For the most massive and largest ETGs, the profile is isothermal in the central regions (), while for the low-mass and smallest systems, the profile is steeper than isothermal, with slopes similar to those for a constant- profile. For a concentration-mass relation steeper than that expected from simulations, the correlation of density slope with mass tends to flatten. Our results clearly point to a “non-homology” in the total mass distribution of ETGs, which simulations of galaxy formation suggest may be related to a varying role of dissipation with galaxy mass.
We use a sample of local ETGs from the SPIDER survey (La Barbera et al. 2010) in the redshift range 0.05-0.1. Our analysis extends the range of galaxy stellar mass () probed by gravitational lensing, down to . We model the observed velocity dispersion of each individual galaxy using spherical isotropic Jeans equations. The stellar density is provided by a Sérsic fit of the photometric data from SDSS-DR6 and UKIDSS-LAS-DR4 (see La Barbera et al. 2010 for further details). DM mass is modelled with a suite of profiles. Further details are provided in Tortora et al. (2014).
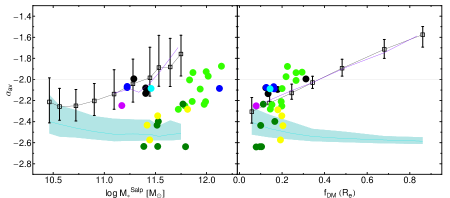
Independently of the DM halo adopted, we find that the Initial Mass Function (IMF) becomes bottom-heavier than a “standard” Chabrier (2001) distribution in high- relative to low-mass ETGs (La Barbera et al. 2013; Tortora et al. 2013, 2014). One of the most important results of our work is that total mass density slope in ETGs is not universal, assuming a NFW halo model (Navarro et al. 1996) with standard recipes for the virial to stellar mass relation (Moster et al. 2010) and – relation (Macciò et al. 2008). Our results suggest that total mass density slope gets shallower with galaxy mass, galaxy size and central DM fraction (see Fig. 1). In more detail, we find that low-mass (small) ETGs have slopes consistent with those for constant- profiles (see cyan shaded region in Fig. 1), while massive (large ) systems have a nearly isothermal density slope () or shallower, consistent with gravitational lensing results (Auger et al. 2010). The trends of mass density slope are consistent with independent results from the literature (Dutton & Treu 2014; Humphrey & Buote 2010). The trends of mass density slope are the same for NFW and contracted-NFW models, and do not change when assuming a fixed virial mass (and concentration) for all galaxies. When adopting a Burkert (1995) profile, the slope tends to be more constant as a function of all galaxy parameters explored. However, for the most massive ETGs, the “light” haloes described by Burkert models seem to be rejected by lensing results (Auger et al. 2010). Using – relation from observations (Leier et al. 2012) rather than simulations affects significantly some trends of density slope with galaxy parameters. In particular, while the slope keeps increasing with galaxy radius also for such “high-concentration” models, the trends with mass become flatter in this case.
Our results draw a picture whereby the total mass density profile in the central regions of ETGs is “non-homologous”, approaching a constant- distribution at low mass – where stars dominate the total mass budget in the ETGs center –, and an isothermal profile in the most massive ETGs, whose central regions are more DM dominated. To understand the implications of our findings in the framework of galaxy assembly, in Fig. 1 we have also compared our results with predictions from N-body simulations (Remus et al. 2013). We find that both observations and simulations predict an increase of the total mass density slope with galaxy mass. This comparison indicates that black hole growth and feedback are fundamental ingredients during the formation of ETGs, as only simulations including these processes are able to reproduce the mass density slopes, DM fractions, and stellar masses in the central regions of ETGs. We argue that this trend is because gas dissipation has been more important during the formation of low-, relative to high-, mass ETGs. Thus, a steep profile is due to the formation of new stars inwards, as the gas, dissipating its kinetic energy, falls into the galaxy central regions, while gas-poor mergers tend to make the slopes isothermal.
Acknowledgements.
CT has received funding from the European Union Seventh Framework Programme (FP7/2007-2013) under grant agreement n. 267251 “Astronomy Fellowships in Italy” (AstroFIt)References
- Auger et al. (2010) Auger M. W. et al. 2010, ApJ, 724, 511
- Burkert (1995) Burkert, A. 1995, ApJ, 447, L25
- Chabrier (2001) Chabrier G., 2001, ApJ, 554, 1274
- Dutton & Treu (2014) Dutton A. A., Treu T., 2014, MNRAS, 438, 3594
- Humphrey & Buote (2010) Humphrey P. J., Buote D. A., 2010, MNRAS, 403, 2143
- La Barbera et al. (2010) La Barbera F. et al. 2010, MNRAS, 408, 1313
- La Barbera et al. (2013) La Barbera F. et al. 2013, MNRAS, 433, 3017
- Leier et al. (2012) Leier D., Ferreras I., Saha P., 2012, MNRAS, 424, 104
- Macciò et al. (2008) Macciò A. V., Dutton A. A., van den Bosch F. C., 2008, MNRAS, 391, 1940
- Moster et al. (2010) Moster B. P. et al. 2010, ApJ, 710, 903
- Navarro et al. (1996) Navarro J. F., Frenk C. S., White S. D. M., 1996, ApJ, 462, 563
- Remus et al. (2013) Remus R.-S. et al. 2013, ApJ, 766, 71
- Salpeter (1955) Salpeter E. E., 1955, ApJ, 121, 161
- Tortora et al. (2014) Tortora C. et al. 2014, MNRAS, 445, 115
- Tortora et al. (2013) Tortora C., Romanowsky A. J., Napolitano N. R., 2013, ApJ, 765, 8