The host galaxies of micro-Jansky radio sources
Abstract
We combine a deep 0.5 deg2, 1.4 GHz deep radio survey in the Lockman Hole with infrared and optical data in the same field, including the SERVS and UKIDSS near-infrared surveys, to make the largest study to date of the host galaxies of radio sources with typical radio flux densities Jy. 87% (1274/1467) of radio sources have identifications in SERVS to at 3.6 or 4.5m, and 9% are blended with bright objects (mostly stars), leaving only 4% (59 objects) which are too faint to confidently identify in the near-infrared. We are able to estimate photometric redshifts for 68% of the radio sources. We use mid-infrared diagnostics to show that the source population consists of a mixture of star forming galaxies, rapidly accreting (cold mode) AGN and low accretion rate, hot mode AGN, with neither AGN nor starforming galaxies clearly dominating. We see the breakdown in the relation in faint radio source samples, and show that it is due to radio source populations becoming dominated by sources with radio luminosities . At these luminosities, both the star forming galaxies and the cold mode AGN have hosts with stellar luminosities about a factor of two lower than those of hot mode AGN, which continue to reside in only the most massive hosts. We show that out to at least , galaxies with stellar masses have a radio-loud fraction up to %. This is consistent with there being a sufficient number of radio sources that radio-mode feedback could play a role in galaxy evolution.
Subject headings:
galaxies: active – radio continuum: galaxies – galaxies:evolution1. Introduction
The radio source population at 1.4 GHz flux densities mJy contains a mixture of active galactic nuclei (AGNs), both radio-loud and radio-quiet, and star forming galaxies (Condon 1992, Afonso et al. 2005, Simpson et al. 2006). Radio-loud AGNs have, historically, been easier to study, being three to four orders of magnitude more luminous in the radio than starforming galaxies and dominating radio surveys at bright flux density levels. However, recent studies have shown that within populations with characteristic flux densities of tens to hundreds of microJanskys (hereafter the Jy population), the predominance of radio-loud AGNs gives way and the population begins to include significant numbers of radio-quiet AGNs and starforming galaxies (Jarvis & Rawlings 2004; Simpson et al. 2006; Huynh et al. 2008; Smolčić et al. 2008; Seymour et al. 2008; Strazzullo et al. 2010; Mao et al. 2012; White et al. 2012; Bonzini et al. 2013). Characterizing this mixed population is important for using radio surveys to study the star formation history of the Universe (Karim et al. 2011; Zwart et a. 2014), the cosmic history of AGN activity (Smolčić et al. 2015), and in order to use radio continuum surveys for cosmological purposes.
Multiwavelength observations of radio sources allow the study of the relative distributions and properties of the three dominant types of sources (radio-loud AGN, radio-quiet AGN, and starforming galaxies) among the various wavelengths. Previous studies have used this multiwavelength technique to examine radio source populations in several deep fields, but have reached differing results as to the contributions of the different galaxy types. Most studies suggest a significant fraction (Huynh et al. 2008; Simpson et al. 2006; Smolčić et al. 2008) or a majority (White et al. 2012; Seymour et al. 2008) of starforming and radio-quiet galaxies within the Jy population, although some authors argue a continuation of the dominance of radio-loud AGNs from the Jansky and milliJansky populations to sub-milliJansky levels (Mignano et al. 2008).
Deep radio surveys, combined with multiwavelength data, are essential for studying the nature of the host galaxies of the AGN-powered radio source population, and, as they are deep enough to contain a mixture of both radio-loud and radio-quiet objects, are helpful in our understanding of the origin of radio-loudness in AGN. At high 1.4 GHz radio luminosities () radio sources have long been known to be hosted by the most massive galaxies at all redshifts. Early work by Lilly & Longair (1984) and Lilly (1989) showed that the near-infrared -band magnitudes of radio galaxies formed a tight Hubble diagram. This so-called “ relation” has been found to be a very useful tool for estimating the redshifts of distant, luminous radio sources, and is only very weakly dependent on radio luminosity for radio sources with (Willott et al. 2003; McLure et al. 2004). The scatter in the relation towards fainter -magnitudes has long been predicted to increase as fainter radio samples are studied, however (e.g. Jarvis et al. 2001), when radio source populations become dominated by progressively lower radio-luminosity AGN and starforming galaxies. The first signs of this breakdown in the relation start to appear in -Jy radio surveys (Simpson et al. 2012), which we confirm with a larger sample of sources in this paper.
Understanding the mix of galaxies that host the Jy radio source population is essential for planning for future radio observatories such as the SKA, in particular for cosmological studies where different types of host galaxies cluster differently (e.g. Ferramacho et al. 2014). We therefore decided to use some of the best currently-available multiwavelength data to investigate the nature of the radio source host population. We base our multiwavelength catalog on the Spitzer Extragalactic Representative Volume Survey (SERVS), which uses deep Spitzer data to detect galaxies out to (Mauduit et al. 2012). All five fields chosen by this survey were selected specifically to be integrated into multi-wavelength observations. In particular, the Lockman Hole field has two deep radio surveys within it, the very deep survey of Owen et al. (2009) in the north of the field and the wider, but somewhat shallower survey of Ibar et al. (2009) in the east. In this paper, we match the SERVS data with the Ibar et al. radio survey, and other surveys in the Lockman Hole field at optical through infrared wavelengths to investigate the host galaxy properties of the Jy radio source population. These data are summarized in Section 2. Details of the catalogs and band-matching are given in Section 3, and Section 4 discusses the quality of the photometric redshifts. The methodology for discriminating between AGN and starforming galaxies is presented in Section 4. Section 6 presents the properties of the radio sources, and conclusions may be found in Section 7. A cosmological model of , and is assumed throughout the text.
2. Multiwavelength Observations
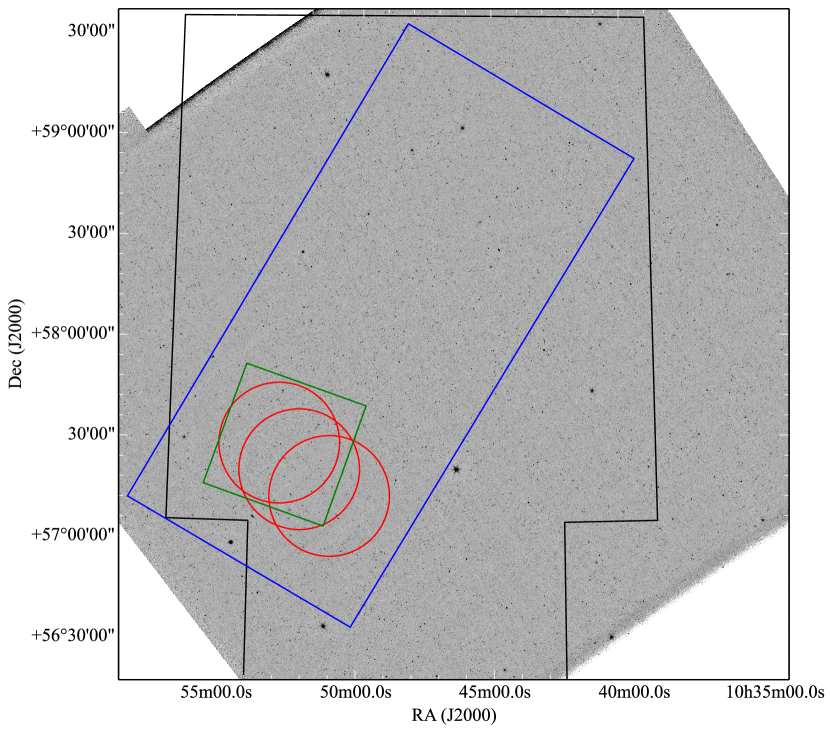
The Lockman Hole is a particularly appealing candidate for a multiwavelength study because there have been many observations made of it in a wide variety of wavelengths. These data can be combined to form a very thorough study encompassing objects with redshifts out as far as . We have assembled a multiwavength dataset, detailed below, with which to study the host galaxies of Jy radio sources in this field. Figure 1 shows the spatial overlap of the datasets described below.
2.1. SERVS data
SERVS uses deep Spitzer data taken during the postcryogenic Spitzer Space Telescope mission over the course of 1400 hours using the Infrared Array Camera (IRAC) at wavelengths of 3.6 and 4.5 m, and detects objects out to . The survey covers a total of 18 deg2 to a detection limit of Jy () in five fields, including 4 deg2 in the Lockman Hole. SERVS catalogs were produced using Sextractor (Bertin & Arnouts 1996) as detailed in Mauduit et al. (2012).
2.2. Optical data
González-Solares et al. (2011) observed the Lockman Hole with the Isaac Newton Telescope Wide Field Camera (INT WFC) in the and -bands, with magnitude limits of 23.9, 24.5, 24.0, 23.3, and 22.0, respectively. Supplementary observations were taken with the Mosaic 1 camera on the Mayall 4-m Telescope of the Kitt Peak National Observatory (KPNO) in the and -bands. Details of the source extraction are given in González-Solares et al. (2011).
2.3. Ground-based near-infrared data
The UKIRT Infrared Deep Sky Survey (UKIDSS) observed the Lockman Hole as part of its Deep Extragalactic Survey (DXS) using the Wide Field Camera (WFCAM) of the United Kingdom Infrared Telescope (UKIRT) at wavelengths 1.2 m and 2.2 m, corresponding to the and bands, respectively. The survey reaches AB magnitude depths of and . Lawrence et al. (2007) describe the survey and the production of the catalogs.
2.4. SWIRE data
The Spitzer Wide-area Infrared Extragalactic (SWIRE) survey observed the Lockman Hole during its cryogenic mission using the Infrared Array Camera (IRAC) and the Multiband Imaging Photometer for Spitzer (MIPS). IRAC observed the Lockman Hole using all four channels, 3.6 m, 4.5 m, 5.8 m, and 8.0 m; and MIPS observed the Lockman Hole with all three of its channels, 24 m, 70 m, and 160 m. The SWIRE catalogs reach depths of Jy () at 3.6 and 4.5 m. SWIRE detected galaxies out to (Lonsdale et al. 2003). Details of the data release used may be found in the SWIRE data release 2 document111http://irsa.ipac.caltech.edu/data/SPITZER/SWIRE/docs/delivery_doc_r2_v2.pdf.
2.5. Radio data
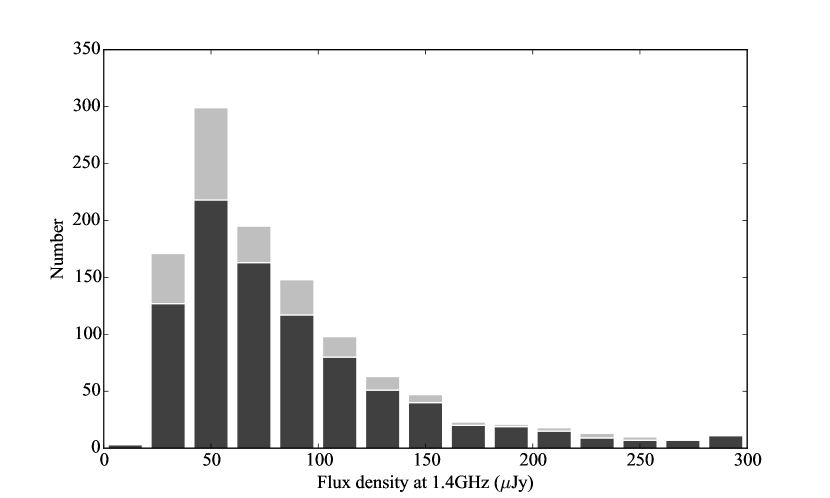
Part of the Lockman Hole was observed at frequencies of 610 MHz and 1.4 GHz using the Giant Metre-wave Radio Telescope (GMRT) and the Very Large Array (VLA), respectively by Ibar et al. (2009). Their survey covered deg2 in the Southern region of the Lockman Hole (centered on RA, Dec 163.0∘,57.35∘, generally called the “Lockman Hole East”) and contains 1452 radio sources detected at 1.4GHz, comprised of 1467 discrete components. The GMRT data reach an RMS noise of Jy/beam, and the VLA data an RMS of Jy/beam in the center of the surveys, where the sensitivity is highest, tapering off to Jy/beam at 1.4 GHz towards the edge of the survey region (see Figure 2 for the flux density distribution).The depth of the GMRT data is such that nearly all of the 1.4GHz sources have counterparts at 610MHz.
3. Catalog matching
Data from the optical through far-infrared surveys were combined into a SERVS “Data Fusion” catalog222http://mattiavaccari.net/df, using a matching radius of 1.0 to match them to the SERVS dual-band catalog. This catalog contained 951102 objects covering the full 4 deg2 of the SERVS Lockman area. Details of this catalog will be presented in Vaccari et al. (in preparation). This Fusion catalog was then matched to the 1467 individual component detections at 1.4 GHz (with peak-to-noise ratio ) in the Ibar et al. (2009) catalog. The radio sources were matched to the SERVS Fusion catalog using a selection radius of 1.2 arcseconds (compared to a 4 arcsecond beamsize), which resulted in 1245 matched objects - a 85% match rate down to the catalog limit. We then compared the remaining 222 unmatched radio components with the SERVS data manually, and matched an additional 29 radio components, six of which we believe are components of multi-component radio sources, and 23 of which were matched to faint SERVS sources below the catalog limit, resulting in a 87% match rate. Of the remaining unmatched objects, 134 (9% ) were confused by brighter objects (mostly stars and bright galaxies) in SERVS. Of the remainder, only 31 (2%) appeared to be completely blank fields, and a further 28 were most likely blank, but were within of faint objects in the field. These statistics emphasise the rarity of infrared-faint radio sources (Norris et al. 2011).
To evaluate the number of matches expected at random, we offset the positions of the radio sources by approximately 1-arcmin in RA and Dec, and redid the matching four times with different offsets. The mean number of random matches was 90, corresponding to 6% of the number of radio components, which we treat as negligible.
4. Photometric redshifts
4.1. Determination of Photometric Redshifts
Photometric redshifts of the objects observed in the SERVS study were obtained by Pforr et al. (in preparation) using the Hyper-z photometric redshift code (Bonzella, Miralles & Pello 2000). A correlation of the photometric redshifts with the spectroscopic redshifts of AGN in the field (see below) is described in the Appendix, and shows that % of the redshifts are accurate to within an RMS of , the remainder being outliers. Highly-luminous AGN at high redshifts, where the hot dust from the AGN in the IRAC 3.6 and 4.5m bands can affect the redshift estimate, may have poorer photo-zs, however.
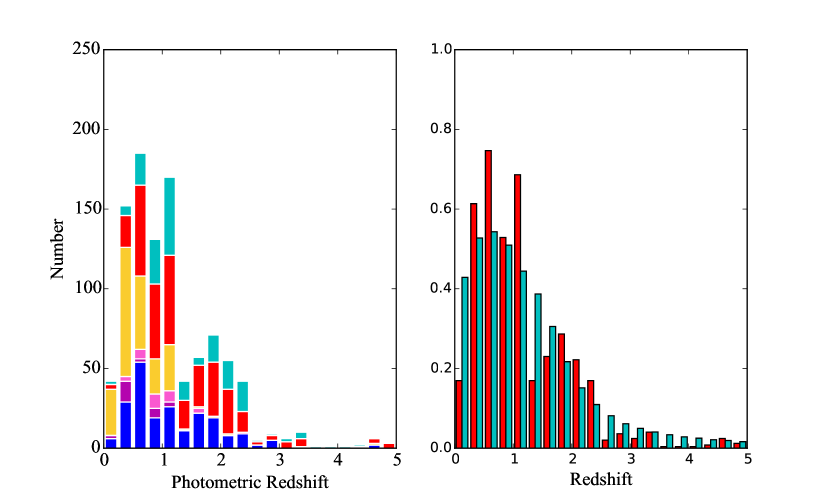
Of the photometric redshifts for the radio galaxies, 20 (1%) failed to find a solution. All of these failed solutions had only limits on their detection in either or both of the -band or -band. To ensure a good quality photometric redshift, we thus excluded the 254 objects (20% of the 1245 objects matched between the radio and SERVS) lacking a - or -band detection from any analysis that needed redshift information, ensuring that we had a minimum of four bands to estimate a redshift (, , [3.6] and [4.5]). In Figure 2 we show the 1.4 GHz flux density distribution of the survey for objects with and without photometric redshifts, indicating that there is not a very strong bias towards, for example, only the brighter radio sources having photometric redshift information. The photometric redshifts extend out to , as seen in Figure 3 (though some of the redshifts at use only the minimum four bands, and so may be unreliable). There is a dip in the redshift distribution at which has no clear origin. Two possible explanations are that it may be a degeneracy in the photometric redshifts in the region of the “redshift desert” where the optical bands in particular do not contain strong spectral features to constrain the redshifts, or that it may reflect real large-scale structure in the field. Spectroscopic redshifts were available for 62 of the AGN from Lacy et al. (2013) or the SDSS quasar survey (Ahn et al. 2014), including the normal type-1 AGN whose optical emission is dominated by quasar light. We have used these in preference to the photometric redshifts where applicable.
4.2. Predictions of Photometric Redshifts for Jy radio sources
We used the SKA Simulated Skies (S3) extragalactic model (Wilman et al. 2008) that uses measured luminosity functions combined with an underlying numerical dark matter simulation to obtain a predicted redshift distribution for Jy radio sources. This predicted redshift distribution is compared to our measured one in Figure 3. Both distributions peak at , though our measured distribution has fewer sources in the lowest redshift bin. This deficit is also seen in the smaller (but much more spectroscopically-complete) sample of Simpson et al. (2012), so is unlikely to be due to large-scale structure fluctuations, though we cannot rule out incompleteness at very low redshifts due to galaxies being resolved out in the radio survey. We see fewer sources in the bins than the predictions, this may be explained though by the 20% of faint sources we excluded due to missing - and/or -band detections. The median redshift we observe, 0.99, is very similar to the median redshift predicted by the simulations (1.04).
5. Object classification
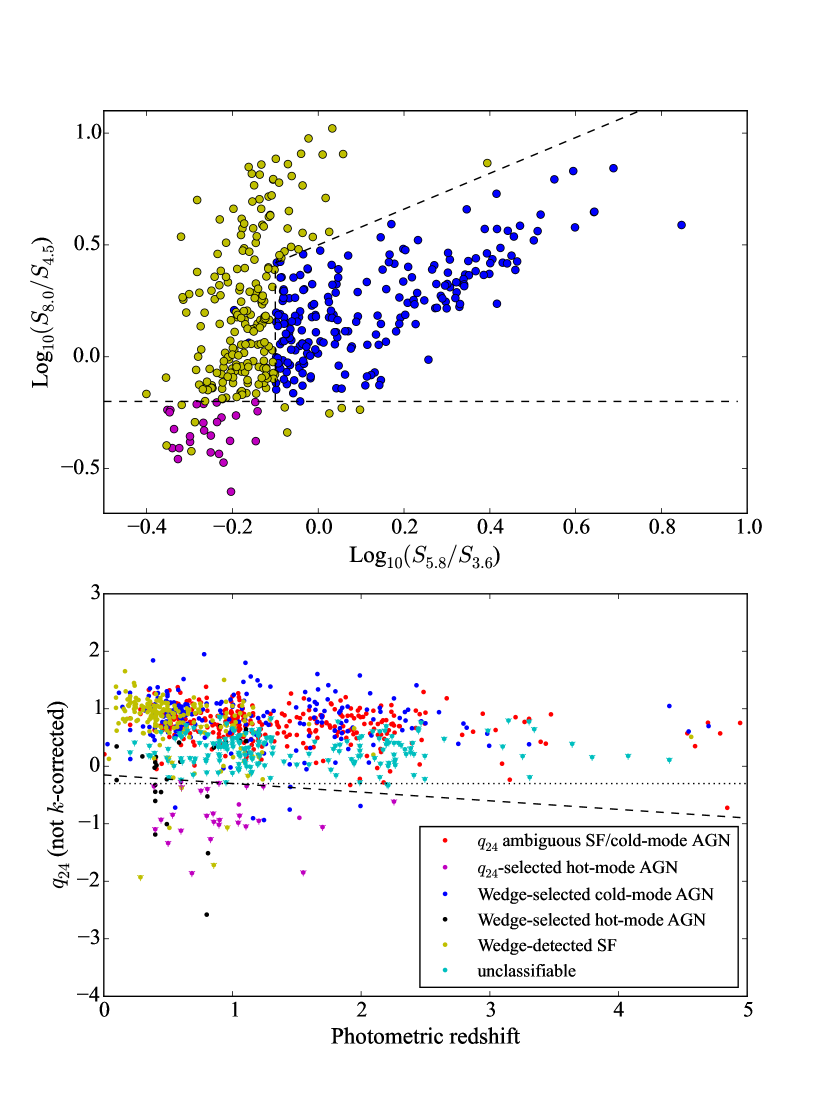
We used a combination of a mid-infrared color-color diagram and the radio to mid-infrared flux ratio to classify as many of the radio sources as possible into three overall classes, namely cold-mode AGN (high accretion rate objects with dynamically-cold accretion flows and Eddington Luminosities ), hot-mode AGN (low accretion rate objects accreting gas at about the galaxy virial temperature of K, with , and jets possibly powered by the spin of the black hole, e.g. Martínez-Sansigre & Rawlings [2011]) and star-forming galaxies. Mao et al. (2012) show that mid-infrared classifications are broadly consistent with those from spectrosopy.
5.1. Rapidly accreting, cold-mode AGN
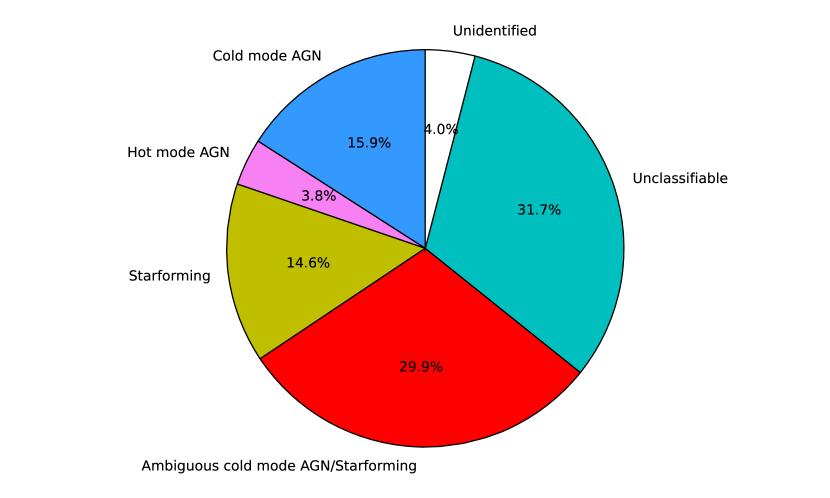
When looking for the relative contributions of AGN and starforming galaxies, bright AGN are simpler to isolate than starforming galaxies. For the 479 objects that were detected in all four of the 3.6, 4.5, 5.8 and 8.0m bands of the Infrared Array Camera (IRAC) in the SWIRE data, we were able to isolate rapidly-accreting, cold-mode AGN using the method proposed by Lacy et al. (2004, 2007), which selects AGN based on their color relative to starforming or quiescent galaxies. Cold-mode AGN have a characteristic red power-law in the mid-infrared that stands out well in a versus color-color plot, (Figure 4, left). We used and from SERVS and and from SWIRE. Three cuts were made: , , and , which produce the wedge-shaped area in the upper right corner of Figure 4. This area represents the objects likely to be cold-mode AGN. These 226 objects make up 15% of the radio sources in the Ibar et al. survey (Figure 5). Spectroscopic follow-up of AGN samples selected in this manner show that this particular “wedge” selection is reliable in the sense that 78% (527 out of 672) of objects for which spectroscopic redshifts and classifications could be obtained using optical or near-infrared spectra are confirmed as AGN (Lacy et al. 2013). (Many of the remainder may also be highly-obscured AGN, but cannot be confirmed as such from optical/near-infrared data alone.) Among the cold mode AGN there are a total of six type-1 quasars from the Sloan Digital Sky Survey Data Release 10 (Ahn et al. 2014) (five of which are in the Lacy et al. [2013] sample).
5.2. Low accretion rate, hot-mode radio AGN
Lacy et al. (2006), Afonso et al. (2011), Gurkan et al. (2014), and Singh et al. (2014) also find that some weak radio AGN appear outside the AGN or starforming galaxy selection region, with IRAC colors similar to quiescent galaxies. These galaxies are likely the low accretion rate, “hot mode” AGN, whose radio jets are highly efficient. These radio sources can be found in the area beneath the cut formed by the line in the left-hand panel of Figure 4.
We also use the value to classify objects without 4-band IRAC detections (e.g. Ibar et al. 2008). As the SWIRE 24m flux density limit, Jy, is five times of our faintest radio sources, and given that the typical value of for star forming galaxies is (Appleton et al. 2004; Ibar et al. 2008), we expect to detect the majority of star-forming galaxies and cold-mode AGN at 24 m. We indeed find that the fraction of radio sources detected at 24m is high (overall, 874/1245 (70%) of matched radio sources are detected at 24 m). Thus, the radio-bright objects not detected at 24m are likely to be hot-mode AGN. We place the dividing line between radio-loud and radio-quiet at at , then use the template -corrections shown in figure 1 of Ibar et al. (2008) to approximate the change in redshift of this dividing line as (the dashed line in Figure 1, right-hand panel). For those objects not detected at 24 m we assume a limit of 150 Jy to classify them. We separate the hot mode AGN selected using the wedge-based and -based methods in Figures 3 and 4, but thereafter include them all in a single class, that comprise about 4% of the total radio source population in this sample.
For the objects lacking photometric redshifts we approximated a classification by assuming a mean redshift of unity (dotted line in the right-hand panel of Figure 4). As can be seen, this should result in misclassifications.
5.3. Star-forming galaxies and 24 m detected objects with ambiguous classifications
The remainder of the objects in the infrared color-color diagram – the upper left corner in Figure 4 - correspond to starforming galaxies, and make up 15% of the radio sources. In addition, 30% of objects are detected at 24m with above the dashed (or dotted, in the case of objects lacking photometric redshifts) line in the right-hand panel of Figure 4, but not detected in all four IRAC bands. These most likely comprise a mix of cold-mode radio AGN and star-forming galaxies, and we henceforth classify them as “ambiguous AGN/SF”.
5.4. Unclassifiable objects
32% percent of the identified radio sources remain unclassifiable using either the infrared color-color diagram or , because they lack 4-band IRAC detections, are undetected at 24 m and their flux density limit at 24 m is insufficiently deep compared to their radio fluxes to classify them as radio-loud or radio-quiet.
5.5. Comparison of wedge and selection
For the most part our classification scheme is self-consistent between the wedge technique and the one. Amongst the objects with spectroscopic redshifts, however, 15/37 of the hot mode AGN that are classified as such by the wedge technique show up as radio-quiet in the plot. Furthermore, in eight cases, objects initially classified as hot-mode AGN are detected in Herschel HerMES (Oliver et al. 2012) images at 250 m and also have photometric redshifts . These are most likely mis-classified star-forming Ultraluminous Infrared Galaxies (ULIRGs), which, due to their high redshifts, no longer have the PAH features in the IRAC 8m band resulting in them falling out of the star formation region in Figure 4 (left). They have been reclassified as star-forming galaxies. There is also one low redshift () galaxy which appears to be a HerMES detection, we also reclassify it as a starburst. The remainder tend to plot in the radio-louder side of the infrared-radio correlation. They may have significant residual star formation, or 24m emission from their AGN (although hot-mode radio AGN tend to be faint in the mid-infrared, some do have significant mid-infrared emission, e.g. Ogle, Whysong & Antonucci [2005]). Similarly, there are 4/207 galaxies classified as star forming in the wedge selection that appear radio-loud in the one, these may be radio-loud AGN in starburst galaxies. Further, more accurate, classification could be attempted with full SED fitting, including Herschel data from the HerMES survey (Oliver et al. 2012), but we will defer this activity to a future paper.
Our classification results can be compared to the study of Bonzini et al. (2013), who used a survey of similar depth in the Extended Chandra Deep Field South to classify a sample of 883 radio sources as 19% radio-loud AGN, 24% radio-quiet AGN and 57% starforming galaxies. The main difference between our classification techniques and those used by Bonzini et al. is their use of a less conservative criterion for defining radio-loud AGN (called “hot mode” AGN in this paper), and also their X-ray data and deeper Spitzer data that allows them to resolve more ambiguities between cold-mode AGN and starforming galaxies.
6. Properties of radio sources
6.1. Radio luminosity and spectral index
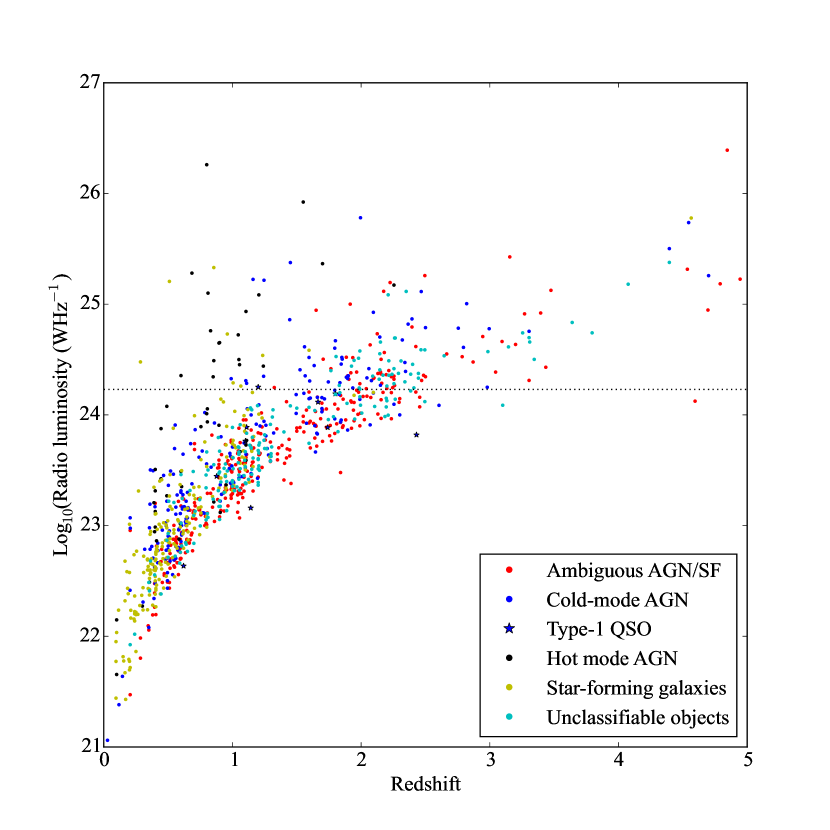
In Figure 6, we plot the radio luminosity versus the photometric redshifts of the radio sources. The radio luminosity was calculated for objects within the Jy population using the flux densities and spectral indices of the 1.4 GHz objects within the Ibar et al. (2009) survey. Most of our radio sources have , spanning the traditional boundary in luminosity between radio-loud and radio-quiet objects. With few exceptions (probably mis-classifications) all the star-forming galaxies selected via Figure 1 have , corresponding to star formation rates , assuming a Salpeter IMF.
The Ibar et al. catalog includes spectral indices between 610MHz and 1400MHz () for objects detected at both frequencies. The mean for the objects matched to SERVS is -0.78. The mean spectral indices for the cold-mode AGN and star forming galaxies are very similar to the overall mean (-0.77 and -0.79, respectively). That for the hot-mode AGN is significantly flatter, -0.44, indicating a large fraction of flat-spectrum AGN in that class.
6.2. K-band emission
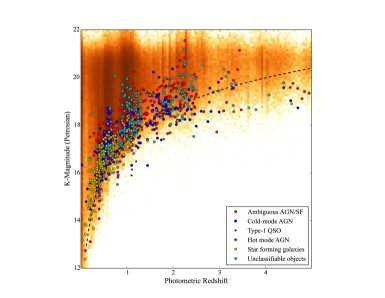
-band emission from radio galaxies tends to consist primarily of stellar light (Lacy et al. 1995; Best, Longair & Röttgering 1998; Simpson, Rawlings & Lacy 1999; Seymour et al. 2007), although in very luminous cold-mode AGN there can be significant contributions from reddened quasar continuum (Rawlings et al. 1995) or emission lines (Eales & Rawlings 1993). Previous results generally found that the relation corresponded to a curve representing a stellar population which formed its stars at very high redshifts () and passively evolved afterwards (e.g. Lacy, Bunker & Ridgway 2000; Jarvis et al. 2001; Willott et al. 2003). In Figure 7 we plot the -magnitudes against the logarithms of their photometric redshifts. The dashed curve in Figure 7, whose function is , was proposed by Willott et al. (2003) as the polynomial of best fit for luminous steep-spectrum radio galaxies within a standard 63.9kpc metric aperture. Willott et al. show that their relation fit closest to a model in which most stars formed in a single burst at redshifts of , and evolved passively afterwards. However, the scatter towards brighter magnitudes at apparent in both Willott et al. and in Figure 7 cannot eliminate a model in which many radio source hosts formed at a lower redshift, . This is discussed further in Section 6.3 below.
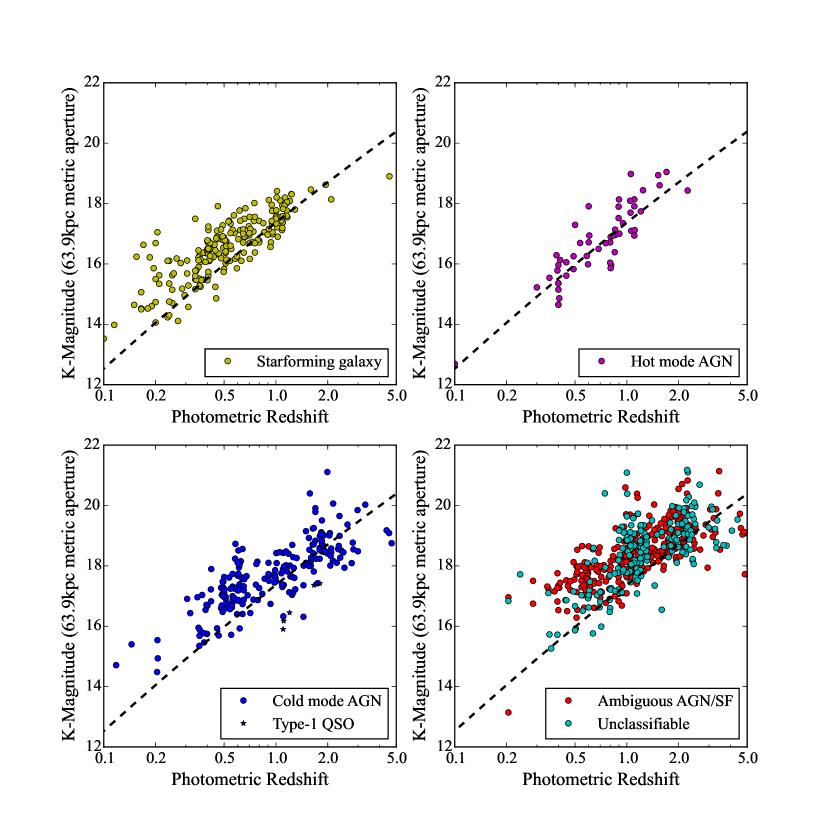
Figure 7 shows that most of the hosts of Jy radio sources are fainter in -band than the mean for the hosts of the much radio-brighter sources from the 3C, 6C and 7C samples (with typical radio flux densities at 1.4 GHz mJy) studied by Willott et al. (2003). This is perhaps not surprising for the starforming galaxy population, which has a very different physical mechanism for radio emission than the AGN populations that dominate the Willott et al. sample, but it also seems true for the cold-mode AGN population, at least at low redshifts/luminosities. In Figure 8 we plot the offset from the relation for different types of object (especially AGN) as a function of radio luminosity and redshift. In the lowest radio luminosity bin, , the mean and error in the mean of the offset is for cold-mode AGN (significant at 15), but insignificant () for hot-mode AGN. In the next bin, , the offsets is barely significant (0.22 for the cold-mode AGN and again insignficant 0.10 for the hot-mode AGN), and similarly we see no significant offsets in the highest luminosity bin ().
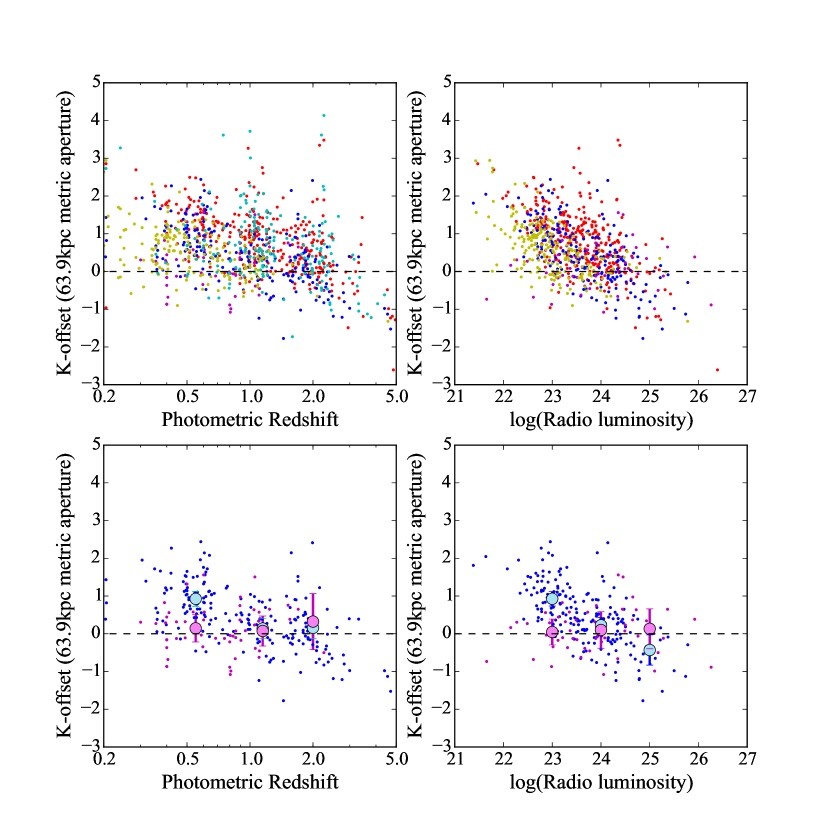
Figure 9 shows the Petrosian magnitudes 333Petrosian magnitudes include the light out to a radius where the surface brightness of the galaxy falls to 0.2 of its mean value within that aperture. of the radio sources overlaid on the distribution from the entirety of the SERVS Fusion catalog, including optical and infrared sources which were not matched to radio sources. Despite the offset from the relation for the most luminous radio galaxies that we observe, the radio matched objects are, at any given redshift, among the most luminous objects, and are generally much more luminous than the objects found only in the optical, infrared or ultraviolet surveys.
6.3. Stellar mass
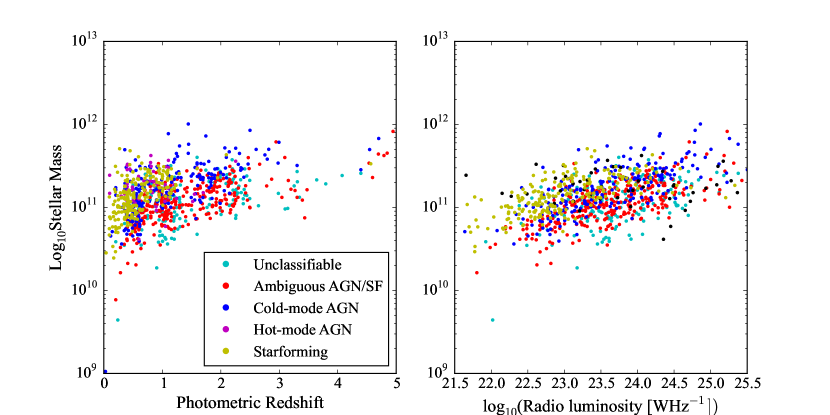
We estimated the approximate stellar masses of the Lockman Hole radio sources using the 3.6 m flux density and a 1.4 Gyr stellar population template from Bruzual & Charlot (2003) to calculate the rest-frame -band luminosity, . The 3.6m wavelength is a good compromise between being close to rest-frame -band at , while at the same time not usually containing significant contamination from hot dust emission from the AGN (Caputi 2013). The choice of stellar population template makes only a small difference to the -corrections in the near-infrared. We then used -band mass-to-light ratio estimates at from Drory et al. (2004) and at from Borys et al. (2005) to parameterize the evolution of the -band mass-to-light ratio in a typical massive galaxy as . The result is shown in Figure 10. Some of the largest indicated masses for the cold-mode accretion AGN are probably spurious, produced by contamination of the 3.6m flux density by AGN hot dust emission. For the remainder, we see a fairly well-defined cutoff at .
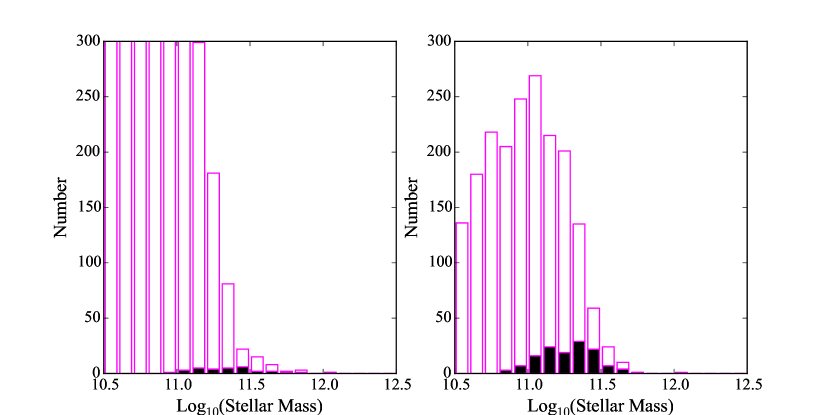
We further estimated the stellar masses of the optical and infrared sources which were not matched to radio sources, plotting the distribution of stellar masses of the radio-loud () and radio-quiet populations in Figure 9. This Figure shows that the radio-loud sources tend to be among the objects with the largest stellar masses at any redshift see also Bronzini et al. (2013), who find that the radio-loud AGN in their work are also in host galaxies significantly more massive than cold-mode AGN or star forming galaxies, though the distribution of masses of our “hot mode” AGN lacks the tail to low masses (below seen in figure 9 of Bronzini et al.. A high mean mass for the radio-loud population is expected, based on the work of Best et al. (2005) and Simpson et al. (2012).
Effective AGN feedback depends on a high duty cycle of activity (Croton et al. 2006), so a high fraction of radio-loud AGN is needed if radio-jet powered AGN feedback models are to be plausible. Among objects with stellar mass greater than or equal to with redshifts , we found 19/69, or 28%, of all massive galaxies are radio-loud (Figure 11), consistent with this requirement. At the space density of galaxies with masses is very low, (Duncan et al. 2014), and remains similar to the space density of radio sources. It is thus quite plausible that when a galaxy (and its black hole) reaches a certain critical mass it is able to switch on as a radio-loud object with a duty cycle of a few tens of percent. Better statistics are needed at high-, however, both on the radio source population and on the numbers of massive galaxies to understand the evolution of radio source hosts at the earliest epochs.
The star-forming galaxies also have relatively high stellar masses, . The likely explanation for this is that these star-forming galaxies are at the high end of the radio luminosity function for star-forming objects, with typical radio luminosities , forming stars at rates (Chabrier IMF; Karim et al. 2011). Karim et al. (2011) and Zwart et al. (2014) show that, at the redshifts at which these objects are mostly seen in our study (), these objects have a typical specific star formation rate Gyr-1. Although less massive objects tend to have higher , the trend is relatively weak, so less massive galaxies would be expected to have lower absolute star formation rates and thus be missing from the survey.
7. Conclusions
The results presented in this paper include one of the first estimates of the redshift distribution and relation for a survey with a large fraction of radio sources Jy. The redshift distribution we find features a median value of and a tail out to redshifts of . This is not entirely consistent with the predicted redshift distribution of Jy radio sources from the simulations, which suggests a larger fraction of sources at , although the median redshift is very similar, and issues of over-resolution in the radio may explain the apparent deficit of very low- sources.
The galaxies detected in the deep radio survey at Jy levels tend to be more luminous in -band than objects which were not detected in the radio survey. Nevertheless, we see evidence that the relation is breaking down, not only due to the increased fraction of star-forming galaxies, but also because the cold mode AGN radio sources with 1.4 GHz radio luminosities tend to exist in less luminous host galaxies. Thus lower luminosity radio sources are no longer found in only the most massive galaxies, and so, as Simpson et al. (2012) point out, the relation defined for powerful radio sources should not be used for estimating redshifts in Jy surveys. It is possible that the cold-mode AGN have a different mechanism for producing radio emission rather than AGN jets. Star formation (Kimball et al. 2011), or synchrotron emission powered by shocks in thermal outflows (Zakamska & Greene 2014) have been suggested as possible alternate mechanisms that dominate over jet powered radio emission at lower luminosities. Hot mode AGN, on the other hand, continue to be found in only the most massive galaxies at and most likely continue to be powered by jets. This picture is consistent with only the most massive galaxies containing black holes that are capable of producing the most powerful radio jets, and thus with a strong dependence of jet luminosity on black hole mass amongst AGN (e.g. Laor 2000; Lacy et al. 2001; Kratzer & Richards 2014). We show that the fraction of massive galaxies that are radio-loud continues to be high (up to %) out to , a prerequisite for models where feedback from radio jets is able to limit star formation in their host galaxies, extending the results of Best et al. (2005) and Simpson et al. (2012).
References
- (1) Ahn, C.P., Alexandroff, R., Prieto, C.A. et al. 2014, ApJS, 211, 17
- (2) Afonso, J., Georgakakis, A., Almeida, C., et al. 2005, ApJ, 624, 135
- (3) Afonso, J., Bizzocchi, L., Ibar, E. et al. 2011, ApJ, 743, 122
- (4) Appleton, P.N., Fadda, D.T., Marleau, F.R. et al. ApJS, 154, 147
- (5) Bertin, E. & Arnouts, S. 1996, A&AS, 117, 393
- (6) Best, P. N. et al. 2005 MRAS, 362, 25
- (7) Best, P. N., Longair, M. N., & Röttgering, H. J. A. 1998, MNRAS, 295, 549
- (8) Bonzella, M., Miralles, J.-M. & Pello, R. 2000, A&A, 363, 476
- (9) Bonzini, M., Padovani, P., Mainieri, V., et al. 2013, MNRAS, 436, 3759
- (10) Borys, C. et al. 2005 ApJ 635, 853
- (11) Bruzual, G. & Charlot, S. 2003, MNRAS, 344, 1000
- (12) Caputi, K.I. 2013, ApJ, 768, 103
- (13) Condon, J.J., 1992, ARA&A, 30, 575
- Croton et al. (2006) Croton, D. J., Springel, V., White, S. D. M., et al. 2006, MNRAS, 365, 11
- (15) Drory, N., Bender, R. & Hopp, U. 2004, ApJ, 616, L103
- Eales & Rawlings (1993) Eales, S. A., & Rawlings, S. 1993, ApJ, 411, 67
- (17) Ferramacho, L.D., Santos, M.G., Jarvis, M.J. & Camera, S. 2014, MNRAS, 442, 2511
- (18) González-Solares, E. A. et al. 2011 MNRAS, 416, 927
- (19) Gurkan, G., Hardcastle, M.J. & Jarvis, M.J. 2014, MNRAS, 438, 1149
- (20) Huynh, M. T. et al. 2008 AJ 135, 2470
- (21) Ibar, E., Cirasuolo, M., Ivison, R. et al. 2008, MNRAS, 386, 953
- (22) Ibar, E., Ivison, R.J., Biggs, A.D., Lal, D.V., Best, P.N. & Green, D.A. 2009 MNRAS 397, 281
- (23) Jarvis, M.J., Rawlings, S., Eales, S. et al. 2001, MNRAS, 326, 1585
- (24) Jarvis, M.J. & Rawlings, S. 2004, New Astronomy Reviews, 48, 1173
- (25) Karim, A., Schinnerer, E., Martínez-Sansigre, A. et al. 2011, ApJ, 730, 61
- (26) Karim, A., Swinbank, A.M., Hodge, J.A. et al. 2013, MNRAS, 432, 2
- (27) Kimball, A., Kellerman, K.I., Condon, J.J., Ivezić, Z. & Perley, R.A. 2011, ApJ, 739, L29
- (28) Kratzer, R. M. & Richards, G. T. 2014 AJ, submitted (arXiv 1405.2344)
- (29) Lawrence, A. et al. 2007 MNRAS 379, 1599
- (30) Lacy, M., Rawlings, S., Eales, S. & Dunlop, J.S. 1995
- (31) Lacy, M., Bunker, A. J., & Ridgway, S. E. 2000 AJ, 120, 68
- (32) Lacy, M., Laurent-Muehleisen, S.A., Ridgway, S.E. et al. 2001 ApJ 551, 17
- (33) Lacy, M., Storrie-Lombardi, L.J., Sajina, A. et al. 2004 ApJS, 154, 166
- (34) Lacy, M., Sajina, A., Gates, E.L. & XFLS Team 2006, AN, 327, 258
- (35) Lacy, M., Petric, A.O., Sajina, A. 2007 AJ 133, 186
- (36) Lacy, M., Ridgway, S.E., Gates, E.L. et al. 2013, ApJS, 208, 24
- (37) Laor, A. 2000, ApJ, 543, L111
- (38) Lilly, S.J. & Longair, M.S. 1984, MNRAS, 211, 833
- (39) Lilly, S.J. 1989, ApJ, 340, 77
- (40) Lonsdale, C., Smith, H.E., Rowan-Robinson, M. et al. 2003 PASP, 115, 897
- (41) Mao, M.Y., Sharp, R., Norris, R.P. et al. 2012, MNRAS, 426, 3334
- (42) Martínez-Sansigre, A. & Rawlings, S. 2011, MNRAS, 414, 1937
- (43) Mauduit, J.-C., Lacy, M., Farrah, D. et al. 2012 PASP 124, 1135
- (44) McLure, R.J., Willott, C.J., Jarvis, M.J. et al. 2004, MNRAS, 351, 347
- (45) Mignano, A. et al. 2008 A&A 477, 459
- (46) Miller, L., Peacock, J.A. & Mead, A.R.G. 1990, MNRAS, 244, 207
- (47) Norris, R.P., Afonso, J., Cava, A. et al. 2011, ApJ, 736, 55
- (48) Ogle, P., Whysong, D.. & Antonucci, R. 2005, ApJ, 647, 161
- (49) Oliver, S.J., Bock, J., Altieri, B. et al. 2012, MNRAS, 424, 1614
- (50) Owen, F. N., Morrison, G. E., Klimek, M. D., & Greisen, E. W. 2009, AJ, 137, 4846
- Rawlings et al. (1995) Rawlings, S., Lacy, M., Sivia, D. S., & Eales, S. A. 1995, MNRAS, 274, 428
- Seymour et al. (2007) Seymour, N., Stern, D., De Breuck, C., et al. 2007, ApJS, 171, 353
- (53) Simpson, C., Rawlings, S. & Lacy, M. 1999 MNRAS, 306, 828
- (54) Simpson, C., Martínez-Sansigre, A., Rawlings, S. et al. 2006, MNRAS 372, 741
- (55) Simpson, C., Rawlings, S., Ivison, R. et al. 2012, MNRAS, 421, 3060
- (56) Simpson, C., Westoby, P., Arumugam, V. et al. 2013, MNRAS, 433, 2647
- (57) Seymour, N. et al. 2008 MNRAS 386, 1695
- (58) Singh, V., Beelen, A., Wadadekar, Y. et al. 2014, A&A, in press
- (59) Smolčić, V., Schinnerer, E., Scodeggio, M. et al. 2008 ApJS 177, 14
- (60) Smolčić, V., Padovani, P., Delhaize, J. et al. to appear in ’Advancing Astrophysics with the SKA’, PoS, in press (arXiv:1501.04820)
- Strazzullo et al. (2010) Strazzullo, V., Pannella, M., Owen, F. N., et al. 2010, ApJ, 714, 1305
- (62) Taylor, M.B. 2005, Astronomical Data Analysis Software and Systems XIV, 347, 29
- (63) White, G. J. et al. 2012 MNRAS 427, 1830
- (64) Willott, C. J. et al. 2003 MNRAS 335, 1120
- (65) Wilman, R.J., Miller, L., Jarvis, M.J. et al. 2008, MNRAS, 388, 1335
- (66) Zakamska, N.L. & Greene, J.E. 2014, MNRAS, 442. 784
- Zwart et al. (2014) Zwart, J. T. L., Jarvis, M. J., Deane, R. P., et al. 2014, MNRAS, 439, 1459
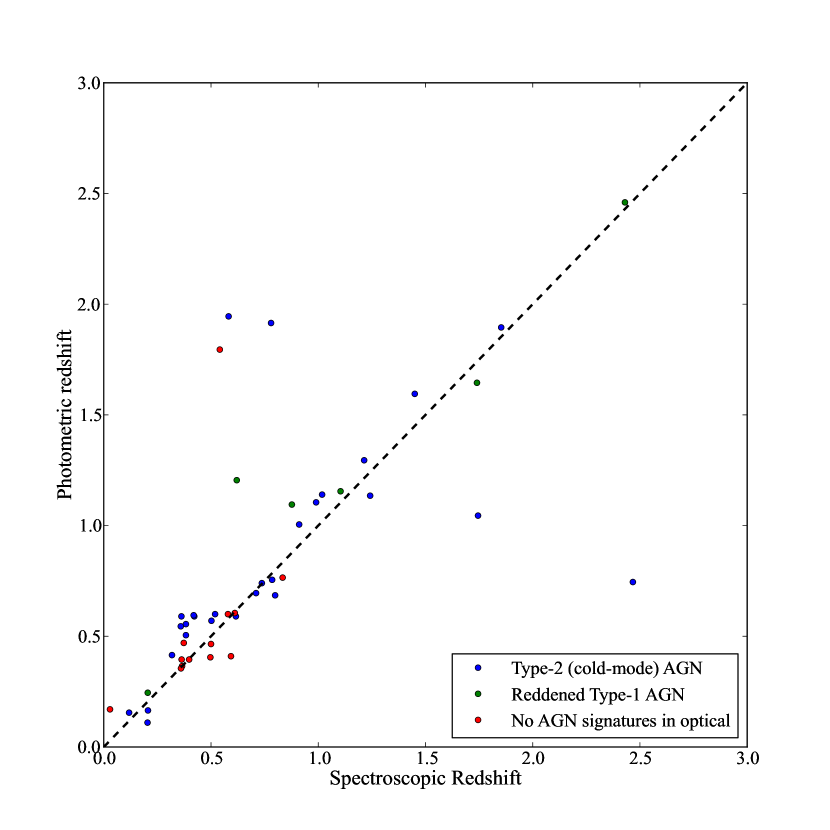
Appendix A Accuracy of the photometric redshifts
Spectroscopic redshifts for some of the AGN in this field were obtained by Lacy et al. (2013). We selected all 53 of the type-2, red type-1 (defined in Lacy et al. 2013 as having broad emission lines, but optical colors redder than normal quasars) and “non-AGN” objects (i.e. AGN candidates selected in the mid-infrared, but which showed no AGN signatures in their optical spectra) in common to the two samples, with spectroscopic redshift quality in Lacy et al. (2013). The plot of spectroscopic versus photometric redshift is shown in Figure 12. The two sets of redshifts agree well, though the increasing dominance of the AGN-component in the higher luminosity AGN above introduces more scatter at high redshifts, and may also be responsible for some of the catastropic outliers (15% of the matched objects). The scatter , though there is a small offset for the type-2 objects of around , probably due to emission line contamination of broad-band magnitudes. The type-2 objects in this plot are among the most infrared-luminous of the “cold-mode” AGN in this paper, so will be the most prone to contamination by AGN flux in the near-infrared.