SUPPLEMENTAL MATERIAL
Optical evidence for a Weyl semimetal state in pyrochlore Eu2Ir2O7
I Model of sum of Lorentzians
We begin our analysis with fitting the optical data with a model dielectric function of a sum of Lorentzians. By fitting experimental reflection and transmission spectra with this model, we can get separately temperature dependence of the spectral weight and scattering rate of the free carriers (Drude term), as well as resonance frequencies, spectral weight, and scattering rate for phonons and electronic transitions. For the present system, we use a Drude term, seven expected phonons, and five electronic transitions. Five Lorentzian oscillators were found sufficient to give a very good representation of the electronic response. Figure S1(a) shows the measured reflectivity and transmission spectra of Eu2Ir2O7 in the frequency range of phonons together with the model curves. These are the same spectra as in figure 1 of the paper but with linear frequency scale.
Figure S1(b) shows each Lorentzian term separately except for the phonons which are shown as one spectrum. The sum of these terms gives the net optical conductivity. It is clear that these components of the optical conductivity have different resonance frequencies and,especially, widths and that they do not interfere with each other in the fitting procedure. We note that the Drude term at 7 K (blue curve) is broad and it gives a small but finite dc conductivity. The fact that fact that Drude term (red curve) and the lowest electronic peak (magenta curve) have opposite slope allows the clean separation of their contributions by fitting the transmission spectra.
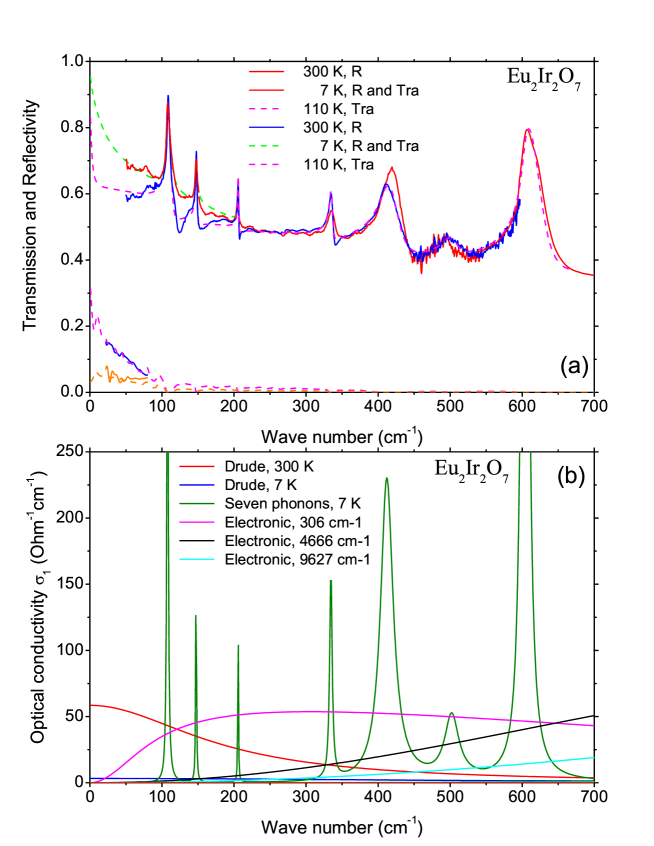
We first fit simultaneously the 7 K transmission and reflection spectra. At this temperature, the transmission is maximum at low frequencies and it is a clear signature of semimetallic optical conductivity. We found that allowing for a temperature dependence of the Drude and phonon parameters is sufficient to account for the observed temperature dependence. These fit results are shown in Fig. 3 of the paper as open circles. We then fit the reflectivity spectra only at temperatures at 70 K and higher where there is no transmission for the thinned crstal at these temperatures. Again, a variation of only the Drude and phonon parameters keeping all other parameters fixed is sufficient. Results of this fit are shown in Fig. 3 as solid squares.
II Model of the variational dielectric function (VDF)
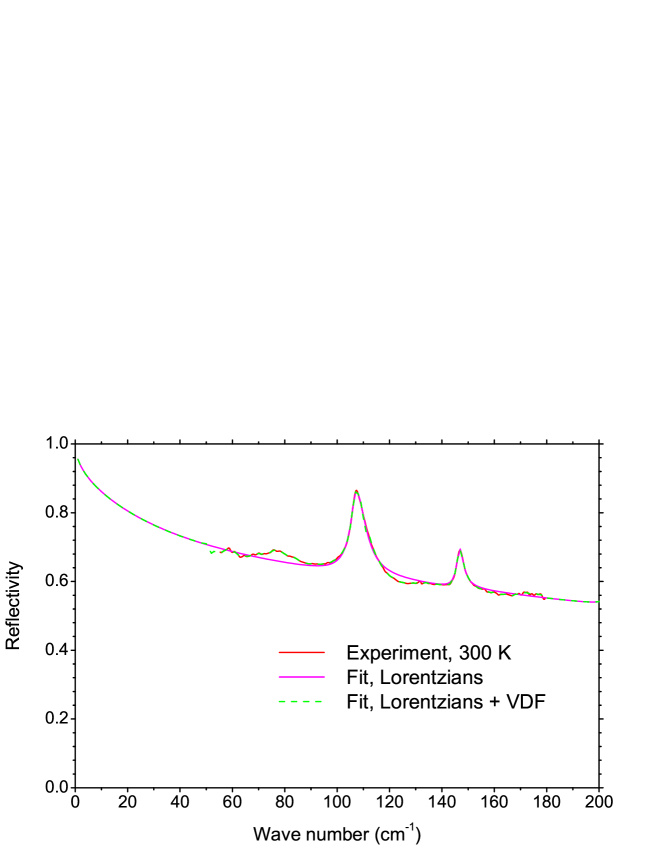
In the second method, we use the results of the first method as a starting spectrum and calculate the VDF [27]. This accounts for small deviations between Loretzian fit and experimental data. Figure S2 shows an example of the two types of fit. It is apparent from the figure that the model curve (blue) for VDF fit is practically indistinguishable from the experimental curve (red). The VDF fit is equivalent to the standard Kramers-Kronig transformation technique [27] and both rely on assumed extrapolation beyond the measured interval. The value of the VDF fit is that it reproduces all small features of the spectrum not included in the sum of Lorentzians.
III Spectral Weight
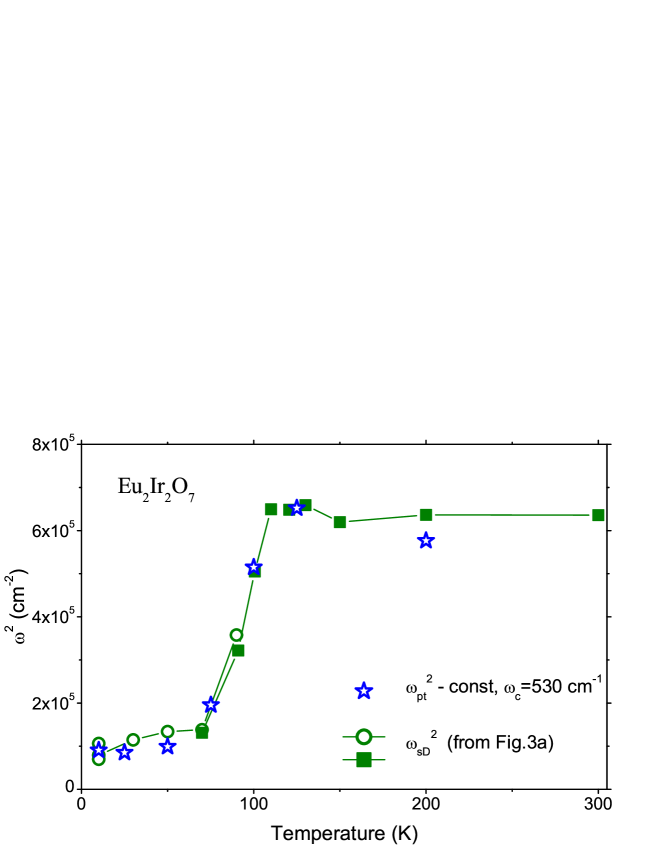
To check our conclusion that all temperature changes come only from the Drude and phonon terms, we use another standard spectroscopic tool — the analysis of the total spectral weight :
| (1) |
where is the optical conductivity in units of (Ohmcm)-1 and the effective (or total) plasma frequency includes all possible excitations. In Figure S3, we compare obtained by integration of the VDF optical conductivity up to the cutoff frequency =530 cm-1 with the Drude weight, where the data are the same as in Fig. 3(a) of the paper obtained from the sum of Lorentzians fit. Here, we have shifted the curve (blue stars) by an arbitrary constant to exclude all temperature independent excitations. We find that the agreement of all data is quite impressive considering that not only are they calculated differently but also they are based on different measured spectra: blue stars were obtained from the reflectivity measured with the 4 K bolometer in the frequency range 90–600 cm-1, open circles and solid squares come from the transmission and reflection measured with the 1.6 K bolometer in the frequency range 10–200 cm-1. From a comparison of the (total spectral weight) and the (Drude term), we conclude that only the Drude spectral weight depends on temperature. While the phonons do have temperature dependent widths their total spectral weight is practically independent of temperature compared to the Drude weight.