Hydrodynamic Properties of Gamma-Ray Burst Outflows Deduced From the Thermal Component
Abstract
We study the properties of a significant thermal emission component that was identified in 47 GRBs observed by different instruments. Within the framework of the “fireball” model, we deduce the values of the Lorentz factor , and the acceleration radius, , for these bursts. We find that all the values of in our sample are in the range , with . We find a very weak dependence of on the acceleration radius , with at the confidence level. The values of span a wide range, cm, with a mean value of cm. This is higher than the gravitational radius of a black hole by a factor . We argue that this result provides indirect evidence for jet propagation inside a massive star, and suggests the existence of recollimation shocks that take place close to this radius.
1. Introduction
One of the major developments in the study of gamma-ray bursts (GRBs) in recent years has been the realization that a thermal component may be a key spectral ingredient. While the shape of most GRB spectra do not resemble a “Planck” function, in a non-negligible minority of GRBs a careful spectral analysis reveals a spectral component that is consistent with having a black-body (“Planck”) shape, accompanied by an additional, non-thermal part. Following pioneering work by Ryde (2004, 2005), such a component was clearly identified in 56 GRBs detected by BATSE (Ryde & Pe’er, 2009) and is now identified in several Fermi GRBs as well. A few notable examples are GRB090902B (Ryde et al., 2010), GRB100507 (Ghirlanda et al., 2013), GRB100724B (Guiriec et al., 2011), GRB110721A (Axelsson et al., 2012; Iyyani et al., 2013), GRB120323A (Guiriec et al., 2013) and GRB101219B (Larsson et al., 2015).111A long lasting thermal component was identified in addition in several low luminosity GRBs, such as GRB060218 (Campana et al., 2006) and GRB100316D (Starling et al., 2011, 2012). As these GRBs may have a different origin than “classical” GRBs (Shcherbakov et al., 2013; Margutti et al., 2013), they are omitted from the analysis carried out here.
The existence of a thermal emission component may hold the key to understanding the prompt emission spectra. First, this component provides a physical explanation to at least part of the observed spectra. Furthermore, thermal photons serve as seed photons for inverse Compton (IC) scattering by energetic electrons, therefore these photons may play an important role in explaining the non-thermal part of the spectra as well. In fact, as it was recently shown by Axelsson & Borgonovo (2015); Yu et al. (2015b), while clear “Planck” spectra are only rarely observed, the narrowness of the spectral width of GRBs rules out a pure synchrotron origin in nearly 100% of the GRB spectra observed to date. Thus, it is possible that modified “Planck” spectra contribute to the observed emission in a very large fraction of GRBs.
Thermal photons decouple from the plasma at the photosphere, which is by definition the inner most region from which an electromagnetic signal can reach the observer. Therefore the properties of a Plank spectral component directly reveal the physical conditions at the photosphere, in those GRBs in which it can be directly identified. This feature is in contrast to the non-thermal spectral component, the origin of which is still uncertain. This is due to the fact that the radiative origin of the non-thermal component is still debatable, and its exact emission radius is very poorly constrained, both theoretically and observationally.
In the framework of the classical “fireball” model (Paczynski, 1986; Rees & Meszaros, 1992, 1994), the photospheric radius, depends only on two free model parameters: the luminosity, , and the Lorentz factor, at the photospheric radius222This statement holds under the assumption that the photospheric radius is larger than the saturation radius, , which is the radius at which all the available internal energy is converted to kinetic energy. (e.g., Paczynski, 1990; Abramowicz et al., 1991; Mészáros & Rees, 2000; Mészáros, 2006, and references therein). The observed temperature weakly depends, in addition, on a third parameter, , as . Here, is the acceleration radius, which is the radius where the acceleration of plasma to relativistic (kinetic) motion begins. Thus, by definition, at this radius the bulk Lorentz factor , while at larger radii increases at the expense of the internal energy. In the classical “fireball” model, where the outflow expands freely and magnetic fields are sub-dominant, the growth is linear, below the saturation radius , and above this radius, as all the available energy is already in kinetic form.
The simple dependences of the temperature and photospheric radius on the luminosity, and , have a strong implication. As was shown by Pe’er et al. (2007), one can use the measured values of the temperature and observed flux to directly measure and . Using the fireball model scaling laws, one can then infer the value of . Therefore, using only observational quantities one can deduce the entire (basic) dynamics of the earliest stages of the jet evolution within the framework of the “fireball” model. These dynamics, in turn, provide a strong tool in constraining models of GRB progenitors.
In order to perform these calculations, knowledge of the distance to the GRB is required, as the observed flux needs to be converted to luminosity. Moreover, reliable estimates of the dynamical parameters (, and ) rely on the assumption that the observed thermal component is not strongly distorted (e.g., by sub-photospheric dissipation; see Pe’er et al., 2006). Validating this last assumption is, nonetheless, relatively easy, as a significant thermal component that can be directly observed, necessitates that a strong distortion does not occur (see, however, Ahlgren et al., 2015).
Unfortunately, as of now, there are only very few GRBs which fulfill both requirements, namely, (1) a significant thermal component is clearly observed in their spectra, and (2) their luminosity distance is known. These observational constraints limited, so far, the ability to carry out a statistical study of the outflow properties derived from photospheric emission.
Nevertheless, in recent years the number of GRBs in which a thermal component could be clearly identified is rapidly increasing, and is now at a few dozens. Furthermore, as we point out in the present work, uncertainties in the redshift have, in fact, only a weak effect on the deduced value of . Consequentially, a good estimate of the value of can be achieved even for those GRBs for which the redshift is unknown. This enables the study of the hydrodynamical parameters in a reasonable sample of GRBs for which a thermal component was identified.
In this paper we analyze the existing data for those GRBs in which a distinct thermal component was clearly identified. Using the existing data, we deduce the values of the bulk Lorentz factor, , and the acceleration radius, . We find an average value of , which is similar to previous estimates, based on various methods. On the other hand, we find that cm, higher than the common assumption of cm. These larger than expected values may be due to propagation effects of the jet, such as recollimation shocks, mass entrainment, or a non conical structure, and may provide indirect evidence for the presence of a massive progenitor star.
2. Sample and Method of Analysis
Several authors have identified a thermal emission component in various GRBs (detected by both the BATSE instrument as well as by Fermi satellite), and studied their properties. As was shown by Pe’er et al. (2007), clear identification of both the temperature and flux in bursts with a known redshift (luminosity distance ), can be used to infer the properties of the outflow within the framework of the “fireball” model 333This model assumes that the acceleration is dominated by photon pressure, and that the magnetic fields are dynamically sub-dominant. For a general treatment of the dynamics in highly magnetized outflow, we refer the reader to Gao & Zhang (2015). via
| (1) |
and
| (2) |
Here, is Thomson’s cross section, , is the observed black body flux, is the temperature of the thermal component, and is Stefan-Boltzmann constant. The total (thermal + non-thermal) flux is denoted by , and is the ratio between the total energy released in the explosion producing the GRB and the energy observed in -rays (both thermal and non-thermal). Measurements of the exact value of are difficult to conduct, though estimates can be done using afterglow observations (Cenko et al., 2011; Pe’er et al., 2012; Wygoda et al., 2015).
A key difficulty in identifying a thermal component and conducting the calculations is the fact that the signal varies with time. Thus, a time dependent analysis is required. As was shown by Ryde (2004, 2005) and Ryde & Pe’er (2009), for bursts which show relatively smooth, long pulses, and in which a thermal component could be identified, both the temperature and the flux show a very typical behavior: a broken power law in time. Typically, before a few s, the temperature is roughly constant, while the thermal flux increases roughly as . At later times, both the temperature and the flux decay, and . Although the non-thermal and thermal fluxes are often correlated, the break time does not always coincide with the peak of the (non-thermal) flux. In many GRBs it is associated with the beginning of the rapid decay of the pulse (Ryde & Pe’er, 2009). 444We should emphasis the fact that a systematic study of the temporal behavior of GRB pulses was carried only for BATSE bursts. No such systematic study was carried so far for Fermi bursts.
The exact interpretation of the early and late temporal behavior is still not fully clear. An interesting finding is that during the rise phase of the pulses (the first few seconds), the temperature is roughly constant. This implies via Equation 1 that the Lorentz factor is roughly constant (assuming that the ratio does not vary much), though the total flux changes substantially. This no longer holds during the decay phase. A leading idea is that the late time behavior may be associated with a geometrical effect of (relativistic) “limb darkening” (Pe’er, 2008; Pe’er & Ryde, 2011; Lundman et al., 2013), though a non-spherical jet structure may be required (Deng & Zhang, 2014). If this is the correct interpretation, it implies that reliable estimation of the hydrodynamic parameters can be done only if the data are taken at the break time, or earlier. Fortunately, in recent years enough data are available to carry out these time-dependent calculations for a substantial number of GRBs.
In this work we collected the available data, and divided them into three categories. In category (I) we include seven GRBs that fulfill the entire set of conditions: (1) their redshifts are known; (2) a thermal component was reported in the literature; and (3) a time dependent analysis could be performed, and therefore the values of and were inferred. These GRBs were analyzed in recent years by various authors. Here, we collected the published data, and validated it. It case of multiple-pulsed GRB, we normally picked the first pulse. Two of these GRBs, GRB970828 and GRB990510, were detected by BATSE (Pe’er et al., 2007), and the other five were detected by Fermi. We summarize in Table 1 the derived values of the parameters, as well as the references from which they were taken.
In category (II) there are four GRBs detected by Fermi, that both: (1) show clear evidence of a significant thermal component, and (2) have a well defined temporal evolution, that enables a clear identification of the break time.555We omitted from our sample GRBs for which this temporal behavior could not be verified, such as, e.g., GRB100507 (Ghirlanda et al., 2013). However, as opposed to GRBs in our category (I) sample, the redshifts of these GRBs are unknown. The dynamical properties of these GRBs can therefore be deduced only up to the uncertainty in the redshift. The derived parameters of these GRBs, as given by the various authors are also shown in Table 1, with the assumed values taken for the redshifts by the different authors. In our analysis, we did not modify the assumed redshift, as it was taken as the mean redshift of GRBs detected by the relevant instrument (note that GRB120323 is a short GRB). As we show below, this uncertainty does not affect our conclusions.
Although the thermal component observed in the spectra of GRBs in our category (II) sample is statistically significant, it is relatively weak: in 3/4 GRBs, the flux in the thermal component is less than 10% of the total flux observed in -rays. This poses a challenge to the analysis method: as was shown by Zhang & Pe’er (2009); Hascoët et al. (2013); Gao & Zhang (2015), the photospheric component is suppressed if the flow is highly magnetized. Thus, weak thermal fluxes may be an indication for highly magnetized outflow, in which case the dynamical calculations presented in Equations 1 and 2 are modified (see Gao & Zhang, 2015, for a full treatment in this case). Nonetheless, the magnetization parameter is unknown, and a weak thermal component does not necessitate a high magnetization; it could result, e.g., from . We therefore decided to include these bursts in our sample. As will be shown below, the values obtained for both and for these bursts are similar to those obtained for the GRBs in the rest of our sample, which may indicate similar dynamics.
| Category | Burst | Reference | Comments | ||||||
|---|---|---|---|---|---|---|---|---|---|
| [keV] | [erg cm-2 s-1] | [cm] | |||||||
| I | 970828 | 0.9578 | 0.64 | 1 | a, b | ||||
| I | 990510 | 1.619 | 0.25 | 1 | b | ||||
| I | 080810 | 3.355 | 0.28 | 2 | c, d | ||||
| I | 090902B | 1.822 | 0.26 | 3 | |||||
| I | 090926B | 1.24 | 0.92 | 4 | e | ||||
| I | 101219B | 0.55 | 5 | ||||||
| I | 110731A | 2.83 | 0.47 | 6 | d | ||||
| II | 100724B | (1) | 0.04 | 7 | |||||
| II | 110721A | (2) | 0.09 | 8 | f | ||||
| II | 110920 | (2) | 0.3 | 9 | |||||
| II | 120323 | (0.5) | 0.05 | 10 | g | ||||
| footnotetext: 1 Pe’er et al. (2007); 2 Page et al. (2009); 3 Pe’er et al. (2012); 4 Serino et al. (2011); 5 Larsson et al. (2015); 6 Basha (2013); 7 Guiriec et al. (2011); 8 Iyyani et al. (2013); 9 McGlynn & Fermi GBM Collaboration (2012); Iyyani et al. (2015); 10 Guiriec et al. (2013). aafootnotetext: Data is based on published references. Some references omit data on , or . bbfootnotetext: GRBs 970828 and GRB990510 were detected by BATSE instruments. All other GRBs in this list were detected by Fermi-GBM. ccfootnotetext: Errors in , are estimated based on the data provided in the reference. ddfootnotetext: In addition to Fermi-GBM, this GRB was detected by the Swift-BAT. eefootnotetext: In addition to Fermi-GBM, this GRB was detected by MAXI. fffootnotetext: Errors represent uncertainty in redshift as well. ggfootnotetext: Short GRB; Errors estimated from data provided in table 4 of Guiriec et al. (2013). |
In category (III) we used 36 GRBs detected by BATSE, taken from the sample of Ryde & Pe’er (2009). This is the largest single sample of GRBs in which a temporal analysis was carried out and a thermal component was clearly identified. Out of 56 GRBs in the Ryde & Pe’er (2009) sample, we selected those GRBs in which a clear break time in the temporal behavior of both the temperature and flux was identified. Furthermore, the break times of the temperature and flux evolution were consistent with each other. Thus, although a break time was identified in all GRBs in our sample, the sub-sample of GRBs in this category is homogeneous as all GRBs are detected by the same instrument and identical selection criteria was used.
The sample of our category (III) GRBs is given in Table 2. The values of the temperature, thermal flux and ratio of thermal to total flux are given at the break time; the derived values of , and the photospheric radius, are under the assumption of .
| Burst | Trigger | ||||||
|---|---|---|---|---|---|---|---|
| [keV] | [erg cm-2 s-1] | [cm] | [cm] | ||||
| 910807 | 647 | 0.64 | |||||
| 910814 | 678 | 0.51 | |||||
| 911016 | 907 | 0.67 | |||||
| 911031 | 973 | 0.18 | |||||
| 920525 | 1625 | 0.43 | |||||
| 920718 | 1709 | 0.28 | |||||
| 921003 | 1974 | 0.59 | |||||
| 921123 | 2067 | 0.40 | |||||
| 921207 | 2083 | 0.61 | |||||
| 930112 | 2127 | 0.42 | |||||
| 930214 | 2193 | 0.81 | |||||
| 930612 | 2387 | 0.42 | |||||
| 940410 | 2919 | 0.11 | |||||
| 940708 | 3067 | 0.19 | |||||
| 941023 | 3256 | 0.61 | |||||
| 941026 | 3257 | 0.54 | |||||
| 941121 | 3290 | 0.34 | |||||
| 950403 | 3492 | 0.35 | |||||
| 950624 | 3648 | 0.38 | |||||
| 950701 | 3658 | 0.42 | |||||
| 951016 | 3870 | 0.10 | |||||
| 951102 | 3891 | 0.23 | |||||
| 951213 | 3954 | 0.22 | |||||
| 951228 | 4157 | 0.98 | |||||
| 960124 | 4556 | 0.22 | |||||
| 960530 | 5478 | 0.38 | |||||
| 960605 | 5486 | 0.54 | |||||
| 960804 | 5563 | 0.26 | |||||
| 960912 | 5601 | 0.33 | |||||
| 960924 | 5614 | 0.94 | |||||
| 961102 | 5654 | 0.35 | |||||
| 970223 | 6100 | 0.32 | |||||
| 970925 | 6397 | 0.33 | |||||
| 980306 | 6630 | 0.84 | |||||
| 990102 | 7293 | 0.58 | |||||
| 990102 | 7295 | 0.68 |
While the redshifts of all the GRBs in our categories (II) and (III) are unknown, we point out that the additional uncertainty in the estimate of due to the lack of a precise redshift is not very large. This is due to the fact that , and, for the range of redshifts typical for pre-Swift GRBs, , one finds . A similar calculation shows that the added uncertainty in the estimate of is , for .
We estimated the additional uncertainty of GRBs in our category (III) due to the unknown redshifts as follows.666We omitted the full calculation for the four GRBs in our category (II), as this sample is not homogeneous, and the additional error would not affect our final conclusion. For completeness, we do show in Figure 1 the values of and of these GRBs obtained for . We used the pre-Swift distribution of GRB redshifts given by Jakobsson et al. (2006). We performed a Monte-Carlo simulation, simulating GRBs drawn from this distribution, and calculated the ratios and of each GRB in our simulation, normalized to these values for . In our calculation, we assumed a standard cosmology (flat universe with and ). Based on the simulated results, we conclude that the average values of and are , and . The standard deviations due to the uncertain redshifts are and . These values are not surprising given the above analysis and the fact that the mean redshift in the sample of Jakobsson et al. (2006) is .
The values of and presented in tables 1, 2 are derived under the assumption of . This is in order to be consistent with the results presented in the various references from which the data is adopted. However, in presenting the results in the figures below, we adopt a somewhat higher value of . As explained above, the exact value of is very difficult to measure. Measurements based on afterglow observations reveal mixed results. Some works found very high efficiency in -ray production, implying a few (Cenko et al., 2011; Pe’er et al., 2012). On the other hand, several works found inefficient radiation, implying larger values of (Santana et al., 2014; Wang et al., 2015). A large value of would increase the measured value of the Lorentz factor by tens of %, as , while decreasing by a factor of a few, as . As the highest values of we obtain are , while the lowest value of is cm (see below), we deduce that the value of cannot be much greater than unity. In the analysis below, we therefore take as a fiducial value .
3. Results
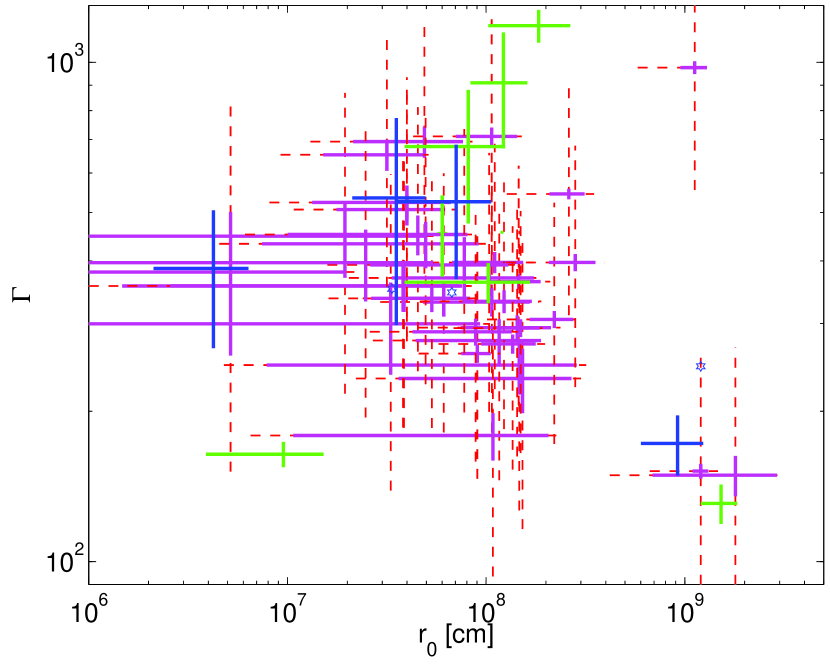
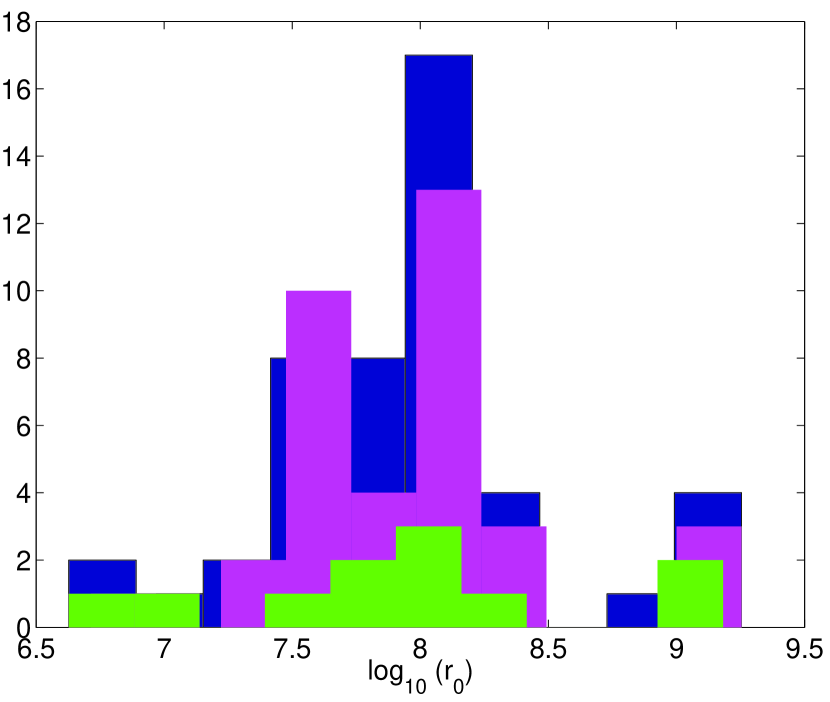
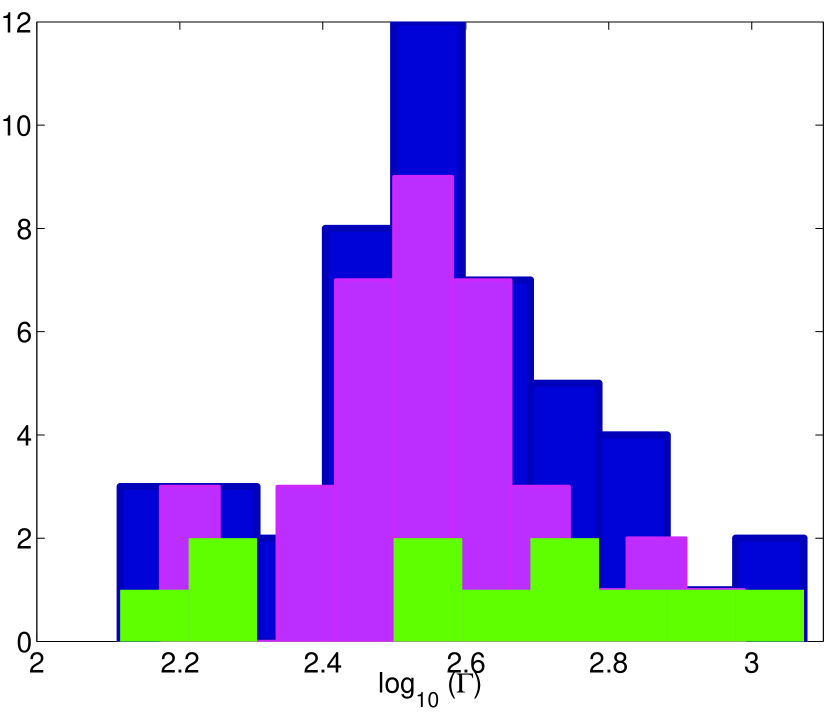
The inferred values of the Lorentz factor and the acceleration radius from our sample are presented in Figure 1. The green points represent GRBs with known redshift (our category I GRBs), GRBs in our category (II) are presented by the blue points, and category (III) GRBs are shown by the magenta points. The error bars represent statistical errors; additional errors due to the uncertain redshifts are shown by the dashed (red) dots. The blue stars represent the values of the parameters of GRBs in our category (II), with assumed redshift . As GRBs in this category form a small fraction of our sample, the uncertainty in the redshift of these GRBs does not affect any of our conclusions. In the plot, we assume a fixed value of . We further show in Figure 2 histograms of the values of and .
The most interesting result from these plots is the range of parameter values. We find that the range of values of the Lorentz factor stretches between 130 and 1200 (with 1- errors inclusive), with an average value of , or and standard deviation of . These results are similar to the values of inferred for bright GRBs by other methods which are in wide use, such as opacity arguments (Krolik & Pier, 1991; Woods & Loeb, 1995; Lithwick & Sari, 2001), the deceleration time of the emission from the forward shock (Sari & Piran, 1999); see also Racusin et al. (2011), or the onset of the afterglow (Liang et al., 2010). Furthermore, the results of Figure 2 indicate that the distribution of is fairly well fitted by a Gaussian, suggesting that selection biases are not playing a major role (see further discussion below).
The initial acceleration radius, , ranges between cm. The average value is cm, or and standard deviation of . Similarly to the distribution of , the distribution of is also close to a Gaussian (see Figure 2).777We note that as about 75% of the GRBs in our sample are in category (III), they have the dominant effect on the distributions. The average value found corresponds to minimum variability time of s, and is about 30 times the gravitational radius of 10 black hole. While this value is fully consistent with our data, as all the GRBs in our sample are long, and their variability time is much longer than 10 ms, this value is different from the commonly assumed value of the acceleration radius, gravitational radii (e.g., Mészáros, 2006; Kumar & Zhang, 2014, and references therein).
A priori, we do not expect any correlation between the values of and of , as these are two independent parameters of the fireball model. Nonetheless, it is interesting to search for such a correlation, since if it exists it could put interesting constraints on the nature of the progenitor. This is due to the fact that if indeed is related to the gravitational radius, than , where is the mass of the central object, while , where is the mass ejection rate.
Linear fitting (with points weighted by the errors in both directions) reveals best fitted values of , with and . The correlation is thus very weak, with intrinsic scatter (Spearman rank -0.31 with significance of 0.035, equivalent to ). While this analysis is done on a non-homogeneous sample, a similar analysis carried out on GRBs in our category (III) only, which do form a homogeneous sample, is not significantly different. We can conclude that our data does not points to any correlation between the values of and .
4. Discussion
4.1. Possible selection bias ?
The derived values of span about one order of magnitude, between . This range is similar to the typical values of inferred from other methods, as discussed above. The values of span a wider range of roughly two orders of magnitude, between cm. These values are higher than the typically assumed value of cm.
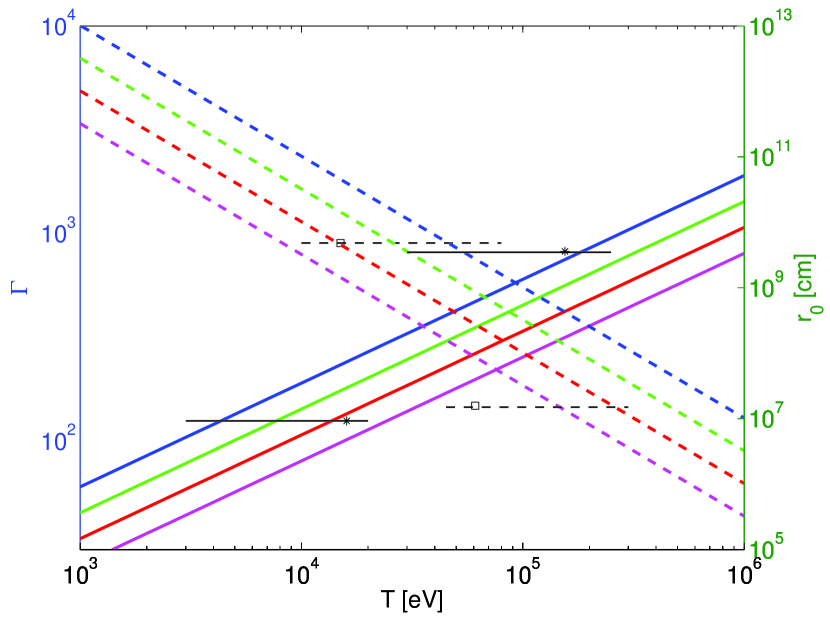
The values of and are derived from the identified values of the observed temperature, as well as the fluxes and . Typical values of the observed GRB fluxes are in the range of (Kaneko et al., 2006; Gruber et al., 2014; von Kienlin et al., 2014, see also Tables 1, 2). The ratio of thermal to total flux cannot be less than a few % (typically, it is of the order of 50 %, see Table 2), otherwise the thermal component could not have been clearly identified. Furthermore, the BATSE detector is sensitive at the range 20 keV - 2 MeV, while the GBM detector has even broader sensitivity range, 8 keV - 40 MeV. Thus, a thermal peak could be identified for the BATSE bursts at temperatures eV. Using these observational constraints, we plot in Figure 3 the range of and that could have been derived from observations of temperature and fluxes in this range using Equations 1, 2, under the assumption of .
Clearly, the possible range of values of both and are much greater than the observed ones. Values of are possible in the range , and those of could span a much broader range, cm (see Figure 3). The addition of uncertainty in the redshift would imply that, in principle, an even broader range of parameter values could be obtained. However, this is not observed: the inferred values of and span only a small part of the range allowed by the detector’s capabilities. Combined with the fact that the histograms of both and are close to Gaussian, we thus conclude that selection effects are likely to be ruled out.
Our sample is not homogeneous, as we use data obtained by two different instruments (Fermi and BATSE detector). Furthermore, for the GRBs in our category (I) and (II) we rely on analysis carried by various authors. Thus, there is a risk of bias in the results. This risk does not exist for GRBs in our category (III), as all the data is taken from the BATSE instruments, and all the analysis was carried by us. Our category (III) GRBs constitute the largest fraction of GRBs in our sample (). When conducting a separate analysis to the data in our category (III) GRBs only, we obtain similar results to those obtained when analyzing the data in categories (I) and (II) (see Figures 1 and 2), indicating that selection bias, if any, do not significantly affect the results.
An additional source of uncertainty is the unknown value of , the ratio between energy released in the explosion and the energy observed in -rays. As discussed above, the value we chose here, , is a realistic approximation, based on (1) estimates from the literature; (2) the fact that the values of obtained using this value are consistent with measurements based on other methods; and (3) the fact that a higher value would imply, in some cases, values of lower than the gravitational radius, which is unphysical. Nonetheless, we stress that as the derived values of both and depend on they are obviously sensitive to the uncertainty in the value of this parameter.
4.2. How ubiquitous is thermal emission in GRBs ?
The size of the sample considered in this work, 47 GRBs, is a small fraction of the total number of GRBs observed to date. All GRBs in our sample are characterized by a clearly detected, significant thermal (Planck-like) component, which shows a well defined, repetitive temporal behavior. We point out that a necessary condition for performing this analysis is the ability to carry out a time-resolved spectral analysis. This limits the number of GRBs in which this analysis could be executed to only those that show relatively long, smooth pulses, and, in addition, are bright. Furthermore, we point out that the traditional use of a “Band” function on its own in fitting the data, excludes the possibility of identifying a thermal component on top of a non-thermal one, as the “Band” function is simply not capable of capturing a thermal peak, where it exists. Thus, in order to obtain a reliable estimate of the fraction of GRBs with a thermal component, a re-analysis of the entire sample is needed. Recent works (Burgess et al., 2014; Guiriec et al., 2015b) in which re-analysis of the data was done, indicate that tens of % of bright GRBs may show evidence for the existence of a distinct thermal component. As shown in Table 1, GRBs which do show evidence for a thermal component span a wide range of properties in terms of fluxes, redshifts and light curves, further supporting the idea that they are ubiquitous.
The existence of a thermal component can be further deduced indirectly, in those GRBs in which a clear “Planck” spectrum is not observed. This is done by analyzing the low energy spectral slopes obtained using the “Band” fits. As was shown already in 1998 (Preece et al., 1998, 2002; Ghirlanda et al., 2003), the low energy spectral slopes of over 85% of the GRBs are too hard to be consistent with the (optically thin) synchrotron emission. A more recent analysis (Axelsson & Borgonovo, 2015; Yu et al., 2015b) reveals that the spectral width of nearly 100% of GRB pulses are inconsistent with having a synchrotron origin, unless additional assumptions are made, such as variation of the magnetic field with radius (Pe’er & Zhang, 2006; Uhm & Zhang, 2014; Zhang et al., 2015).
One possible solution that can explain the observed spectra of those GRBs that do not show clear evidence of a distinct thermal component (which are the vast majority) is that they do in fact originate from a thermal component, that is modified due to sub-photospheric energy dissipation (Pe’er et al., 2005, 2006; Giannios, 2008, 2012; Vurm et al., 2013; Lazzati et al., 2013; Deng & Zhang, 2014; Keren & Levinson, 2014; Gao & Zhang, 2015; Chhotray & Lazzati, 2015; Vurm & Beloborodov, 2015; Ahlgren et al., 2015). If this hypothesis is correct, then the origin of the “Band” peak is Comptonization of the thermal component. A similar mechanism may be responsible for the non-thermal part of the spectra in those GRBs in which a thermal component is pronounced, though an alternative synchrotron model for the non-thermal part is also a possibility in these bursts (Burgess et al., 2011, 2014; Yu et al., 2015a). Thus, in this model, the key difference between GRBs in our sample (in which a thermal component is identified) and other GRBs, is that for GRBs in our sample the “Planck” part of the spectrum suffers only relatively weak distortion. This could be due to the lack of significant dissipation at small (sub-photospheric) radii. We point out that in the classical fireball model, where internal shocks may be the main source of energy dissipation, there is only a low limit constraint on the location of the internal shocks, , where is the variability time. Thus, for smooth bursts, for which is relatively long, internal shocks occur far above the photosphere (Rees & Mészáros, 2005). As a result, if indeed internal shocks are the main cause of kinetic energy dissipation, one naturally expects a pure photospheric component to be more pronounced in smooth bursts. We stress, though, that so far no systematic study of possible correlation between the smoothness of lightcurves and the existence and properties of a thermal component was carried.
An alternative possibility of explaining the various spectra is due to difference in magnetization (Zhang & Pe’er, 2009; Zhang & Yan, 2011; Beniamini & Piran, 2014; Gao & Zhang, 2015; Bégué & Pe’er, 2015). In highly magnetized outflows (characterized by , where is the energy stored in the magnetic field and is the kinetic energy), photospheric emission is both suppressed (e.g., Zhang & Pe’er, 2009) and is further shifted to higher energies due to suppression of photon production below the photosphere. Thus, according to this model, the difference between the GRBs in our sample and other GRBs is that the outflow of the GRBs in our sample happen to have a weaker magnetization, . However, Currently, there is no clear way to determine the magnetization of GRB outflows without additional assumptions. On the other hand, we point out that an additional assumptions, e.g., about the value of can be used to interpret the data in the framework of the magnetized outflow model, and use this interpretation to infer the value of the magnetization parameter (see Gao & Zhang, 2015, for details).
Finally, we point out that the larger part of our sample (our category III) are GRBs detected by BATSE. This is mainly due to the fact that a systematic analysis in search for a thermal component was carried out, so far, only on BATSE data, but not on data obtained by Fermi. It is therefore not clear yet what fraction of GRBs detected by Fermi show clear evidence for the existence of a thermal component. A recent analysis (Guiriec et al., 2015a) indicates that the fraction of thermal component in Fermi bursts may be similar to those observed in BATSE bursts, though further analysis is still needed.
4.3. Possible evidence of a massive progenitor
Within the framework of the “collapsar” model (Woosley, 1993), the jet drills its way through the collapsing star. For a freely expanding outflow, it is typically assumed that the initial acceleration radius, is close to the gravitational radius of the newly-formed black hole, namely cm. However, the results presented here indicate a rather different value of cm, namely, about a factor 10 higher.
We should stress that the idea that should be few gravitational radii is of theoretical origin, and is correct in the classical (low magnetization) “fireball” model, in the limit of free outflow. A small acceleration radius is associated, via light crossing time argument, with short variability timescales, as . However, the minimum observed variability time in GRBs is ms, with an average value of ms (Golkhou & Butler, 2014). Variability timescales of 10 ms correspond to cm. Thus, in fact, there is no observational evidence supporting values of much smaller than this value.
Adopting the basic framework of the “collapsar” model, the collimated outflow within the collapsing star cannot be described as a free outflow. As the jet propagates through the star, it forms a hot “cocoon” made of hot stellar material heated by the jet itself that surrounds the jet. Furthermore, as the jet drills a funnel through the stellar material, it is confined by the funnel walls. The jet thermal pressure decreases with distance from the origin. Thus, if the external pressure decreases slower than the jet pressure, a recollimation shock must form. The shape of this recollimation shock depends on the balance between the external pressure and the jet ram pressure, and can be calculated analytically (Komissarov & Falle, 1997; Nalewajko & Sikora, 2009).
This recollimation shock is very efficient in dissipating the kinetic energy (Nalewajko & Sikora, 2009; Nalewajko, 2012). Thus, while the Lorentz factor increases up to the recollimation shock radius, there is a sharp drop in the outflow velocity as it encounters the recollimation shock to , before the outflow re-accelerates above this radius. This is clearly seen in various numerical models of jet propagation inside stellar cores (e.g., Aloy et al., 2002; Morsony et al., 2007; Mizuta & Aloy, 2009), as well as in analytical modeling (Bromberg et al., 2011). The radii of the recollimation shocks are typically seen at cm (Mizuta & Aloy, 2009; Mizuta & Ioka, 2013; López-Cámara et al., 2013), though in some of the simulations, recollimation shocks can be identified only above cm due to lack of numerical resolution at smaller radii.
Once the jet completes its crossing of the stellar core, both the jet and the cocoon expand into the stellar envelope and into the interstellar medium (ISM). At this stage, the external pressure rapidly drops, and the radius of the recollimation shock gradually increases, until the shocks eventually disappear and the flow becomes free. However, this stage lasts typically for a duration of ten seconds (at least several sound crossing times); (e.g., Morsony et al., 2007; Mizuta & Aloy, 2009; López-Cámara et al., 2013). During this epoch, the recollimation shock is roughly at its initial location. It can be shown that the presence of a recollimation shock does change the length scale of the jet () in certain conditions, especially if the jet is brought back to causal contact by the collimation. In that case, the measured value of would not correspond to the size of the acceleration region nor to the radius at which the shocks happen, but to , where is the Lorentz factor of the shocked jet. In our case, a Lorenz factor of would be able to reconcile the observations with the theoretical prediction of a small acceleration region of cm. While simulations show that typically (see, e.g., Morsony et al., 2007; López-Cámara et al., 2013), they do also show that shocks cause mass entrainment on the jet and that the jet propagation is non-conical at least for a few tens of seconds (Morsony et al., 2007). Both these effect contribute also to causing a measured value of that is larger than the size of the acceleration region (Lazzati, Pe’er, Ryde, et al in preparation).
We may thus conclude that the results obtained here, of cm (despite all the uncertainties discussed above) are consistent with the picture that emerges from the numerical simulations, and that they provide indirect evidence that even the brightest long duration bursts at cosmological redshifts can be produced by the core-collapse of massive stars. Furthermore, this implies that if indeed the progenitors of short GRBs are merger of binaries rather than collapses of massive stars, then the values of are expected to be much smaller in these bursts. While one of the bursts with a high value of in our sample (GRB120323) is categorized as short, we note that the discrimination between “long” and “short” is statistical in nature, and thus it is possible that this burst may originate from a collapse of a massive star, similar to classical long GRBs (see Zhang et al., 2009).
5. Summary and conclusions
In this work, we analyzed a sample of 47 GRBs which show significant thermal emission component. We split our sample into three categories: (I) 7 GRBs with known redshifts; (II) 4 GRBs detected by Fermi, in which the redshifts are unknown; and (III) 36 GRBs detected by BATSE, selected from the sample of Ryde & Pe’er (2009) based on clear identification of the break time. We analyzed the dynamical properties of these GRBs based on standard “fireball” model assumptions using the method derived in Pe’er et al. (2007). We found a mean Lorentz factor of , consistent with values obtained by different methods. However, we further found that the acceleration radius ranges between cm, with mean value cm. This is one orders of magnitude above the commonly assumed value of cm. We found only a very weak correlation between the values of and , that cannot be used to put further constraints on the properties of the progenitor. We showed that the derived values of are only weakly sensitive to the uncertainty in the redshifts.
We showed in §4.1 that selection biases are unlikely to affect our obtained results. We further argued (§4.2) that despite the fact that GRBs with a pure thermal emission component are relatively rare, the existence of such a component is likely to be very ubiquitous, and possibly it exists in nearly all GRBs, albeit in most of them it is distorted. We claimed that within the context of the standard fireball model, it is more likely to detect a pure thermal component in long, smooth GRBs, that are less variable, and as a result internal shocks occur above the photosphere. Finally, we argued in §4.3, that the most likely interpretation of the values of are propagation effects in massive progenitor stars, such as collimation shocks, mass entrainment, or non-conical expansion.
An alternative scenario that can explain the relatively large values of is that the acceleration in fact begins at radii much greater than the gravitational radius of the newly formed black hole. This could be due to initially large jet opening angle, followed by a strong poloidal recollimation at that accelerates the jet. Some evidence for a similar scenario exists in a different object, the active galaxy M87 (Junor et al., 1999). This scenario requires very strong poloidal magnetic fields, whose existence in a GRB environment is uncertain.
The calculation of and in Equations 1, 2 were done under the assumption of the “classical” (weakly magnetized) “fireball” model. The values of that we found are consistent with the values found using other methods, that are independent of some of the underlying “fireball” model assumptions, such as afterglow measurements (e.g., Racusin et al., 2011). These values are more than an order of magnitude higher than the values of inferred in active galactic nuclei (AGNs) and X-ray binaries. Thus, while magnetic acceleration (e.g., via the Blandford & Znajek, 1977, process) is likely to occur in XRBs and AGNs, currently there is no evidence that a similar mechanism is at work in GRBs as well.
In addition to the GRBs considered in this work, thermal emission was found recently in several GRBs in the X-ray band, extending well into the afterglow phase. These include both low luminosity GRBs such as GRB060218 (Campana et al., 2006; Shcherbakov et al., 2013) or GRB100316D (Starling et al., 2011) but also many GRBs with typical luminosities (e.g., Page et al., 2011; Starling et al., 2012; Sparre & Starling, 2012; Friis & Watson, 2013; Bellm et al., 2014; Schulze et al., 2014; Piro et al., 2014). Common to all GRBs in this category are (1) the fact that the thermal component is observed well into the afterglow phase; and (2) the inferred values of the Lorentz factors are at least an order of magnitude lower than that of GRBs in our sample: few tens, and in some cases much lower, . These results indicate that most likely the physical origin of the thermal component in bursts in this sample is different than bursts in our sample, the leading models being supernovae shock breakout and emission from the emerging cocoon. Given this different origin, we excluded these bursts from the analysis carried out here.
Finally, we stress that as the calculations here are carried under the standard assumptions of the classical “fireball” model, any inconsistency that may be found in the future between the values of derived by our method and those derived in alternative ways (e.g., via variability time argument) would question the validity of the entire “fireball” model.
References
- Abramowicz et al. (1991) Abramowicz, M. A., Novikov, I. D., & Paczynski, B. 1991, ApJ, 369, 175
- Ahlgren et al. (2015) Ahlgren, B., Larsson, J., Nymark, T., Ryde, F., & Pe’er, A. 2015, MNRAS, 454, L31
- Aloy et al. (2002) Aloy, M.-A., Ibáñez, J.-M., Miralles, J.-A., & Urpin, V. 2002, A&A, 396, 693
- Axelsson et al. (2012) Axelsson, M., Baldini, L., Barbiellini, G., et. al. 2012, ApJ, 757, L31
- Axelsson & Borgonovo (2015) Axelsson, M. & Borgonovo, L. 2015, MNRAS, 447, 3150
- Basha (2013) Basha, M. A. F. 2013, Ap&SS, 343, 107
- Bégué & Pe’er (2015) Bégué, D. & Pe’er, A. 2015, ApJ, 802, 134
- Bellm et al. (2014) Bellm, E. C., Barrière, N. M., Bhalerao, V., et. al., 2014, ApJ, 784, L19
- Beniamini & Piran (2014) Beniamini, P. & Piran, T. 2014, MNRAS, 445, 3892
- Blandford & Znajek (1977) Blandford, R. D. & Znajek, R. L. 1977, MNRAS, 179, 433
- Bromberg et al. (2011) Bromberg, O., Nakar, E., Piran, T., & Sari, R. 2011, ApJ, 740, 100
- Burgess et al. (2011) Burgess, J. M., Preece, R. D., Baring, M. G., et. al. 2011, ApJ, 741, 24
- Burgess et al. (2014) Burgess, J. M., Preece, R. D., Connaughton, V., et. al. 2014, ApJ, 784, 17
- Campana et al. (2006) Campana, S., Mangano, V., Blustin, A. J., et. al. 2006, Nature, 442, 1008
- Cenko et al. (2011) Cenko, S. B., Frail, D. A., Harrison, F. A., et. al. 2011, ApJ, 732, 29
- Chhotray & Lazzati (2015) Chhotray, A. & Lazzati, D. 2015, ApJ, 802, 132
- Deng & Zhang (2014) Deng, W. & Zhang, B. 2014, ApJ, 785, 112
- Friis & Watson (2013) Friis, M. & Watson, D. 2013, ApJ, 771, 15
- Gao & Zhang (2015) Gao, H. & Zhang, B. 2015, ApJ, 801, 103
- Ghirlanda et al. (2003) Ghirlanda, G., Celotti, A., & Ghisellini, G. 2003, A&A, 406, 879
- Ghirlanda et al. (2013) Ghirlanda, G., Pescalli, A., & Ghisellini, G. 2013, MNRAS, 432, 3237
- Giannios (2008) Giannios, D. 2008, A&A, 480, 305
- Giannios (2012) —. 2012, MNRAS, 422, 3092
- Golkhou & Butler (2014) Golkhou, V. Z. & Butler, N. R. 2014, ApJ, 787, 90
- Gruber et al. (2014) Gruber, D., Goldstein, A., Weller von Ahlefeld, V., et. al. 2014, ApJS, 211, 12
- Guiriec et al. (2011) Guiriec, S., Connaughton, V., Briggs, M. S., et. al. 2011, ApJ, 727, L33
- Guiriec et al. (2013) Guiriec, S., Daigne, F., Hascoët, R., et. al. 2013, ApJ, 770, 32
- Guiriec et al. (2015a) Guiriec, S., Gonzalez, M. M., Sacahui, J. R., Kouveliotou, C., Gehrels, N., & McEnery, J. 2015a, ArXiv e-prints
- Guiriec et al. (2015b) Guiriec, S., Kouveliotou, C., Daigne, F., et. al. 2015b, ApJ, 807, 148
- Hascoët et al. (2013) Hascoët, R., Daigne, F., & Mochkovitch, R. 2013, A&A, 551, A124
- Iyyani et al. (2015) Iyyani, S., Ryde, F., Ahlgren, B., et. al. 2015, MNRAS, 450, 1651
- Iyyani et al. (2013) Iyyani, S., Ryde, F., Axelsson, M., et. al. 2013, MNRAS, 433, 2739
- Jakobsson et al. (2006) Jakobsson, P., Levan, A., Fynbo, J. P. U., et. al. 2006, A&A, 447, 897
- Junor et al. (1999) Junor, W., Biretta, J. A., & Livio, M. 1999, Nature, 401, 891
- Kaneko et al. (2006) Kaneko, Y., Preece, R. D., Briggs, M. S., Paciesas, W. S., Meegan, C. A., & Band, D. L. 2006, ApJS, 166, 298
- Keren & Levinson (2014) Keren, S. & Levinson, A. 2014, ApJ, 789, 128
- Komissarov & Falle (1997) Komissarov, S. S. & Falle, S. A. E. G. 1997, MNRAS, 288, 833
- Krolik & Pier (1991) Krolik, J. H. & Pier, E. A. 1991, ApJ, 373, 277
- Kumar & Zhang (2014) Kumar, P. & Zhang, B. 2014, Phys. Rep., 561, 1
- Larsson et al. (2015) Larsson, J., Racusin, J. L., & Burgess, J. M. 2015, ApJ, 800, L34
- Lazzati et al. (2013) Lazzati, D., Morsony, B. J., Margutti, R., & Begelman, M. C. 2013, ApJ, 765, 103
- Liang et al. (2010) Liang, E.-W., Yi, S.-X., Zhang, J., Lü, H.-J., Zhang, B.-B., & Zhang, B. 2010, ApJ, 725, 2209
- Lithwick & Sari (2001) Lithwick, Y. & Sari, R. 2001, ApJ, 555, 540
- López-Cámara et al. (2013) López-Cámara, D., Morsony, B. J., Begelman, M. C., & Lazzati, D. 2013, ApJ, 767, 19
- Lundman et al. (2013) Lundman, C., Pe’er, A., & Ryde, F. 2013, MNRAS, 428, 2430
- Margutti et al. (2013) Margutti, R., Soderberg, A. M., Wieringa, M. H., et. al. 2013, ApJ, 778, 18
- McGlynn & Fermi GBM Collaboration (2012) McGlynn, S. & Fermi GBM Collaboration. 2012, in -Ray Bursts 2012 Conference (GRB 2012), 12
- Mészáros (2006) Mészáros, P. 2006, Reports on Progress in Physics, 69, 2259
- Mészáros & Rees (2000) Mészáros, P. & Rees, M. J. 2000, ApJ, 530, 292
- Mizuta & Aloy (2009) Mizuta, A. & Aloy, M. A. 2009, ApJ, 699, 1261
- Mizuta & Ioka (2013) Mizuta, A. & Ioka, K. 2013, ApJ, 777, 162
- Morsony et al. (2007) Morsony, B. J., Lazzati, D., & Begelman, M. C. 2007, ApJ, 665, 569
- Nalewajko (2012) Nalewajko, K. 2012, MNRAS, 420, L48
- Nalewajko & Sikora (2009) Nalewajko, K. & Sikora, M. 2009, MNRAS, 392, 1205
- Paczynski (1986) Paczynski, B. 1986, ApJ, 308, L43
- Paczynski (1990) —. 1990, ApJ, 363, 218
- Page et al. (2011) Page, K. L., Starling, R. L. C., Fitzpatrick, G., et. al. 2011, MNRAS, 416, 2078
- Page et al. (2009) Page, K. L., Willingale, R., Bissaldi, E., et. al. 2009, MNRAS, 400, 134
- Pe’er (2008) Pe’er, A. 2008, ApJ, 682, 463
- Pe’er et al. (2005) Pe’er, A., Mészáros, P., & Rees, M. J. 2005, ApJ, 635, 476
- Pe’er et al. (2006) —. 2006, ApJ, 642, 995
- Pe’er & Ryde (2011) Pe’er, A. & Ryde, F. 2011, ApJ, 732, 49
- Pe’er et al. (2007) Pe’er, A., Ryde, F., Wijers, R. A. M. J., Mészáros, P., & Rees, M. J. 2007, ApJ, 664, L1
- Pe’er & Zhang (2006) Pe’er, A. & Zhang, B. 2006, ApJ, 653, 454
- Pe’er et al. (2012) Pe’er, A., Zhang, B.-B., Ryde, F., McGlynn, S., Zhang, B., Preece, R. D., & Kouveliotou, C. 2012, MNRAS, 420, 468
- Piro et al. (2014) Piro, L., Troja, E., Gendre, B., et. al. 2014, ApJ, 790, L15
- Preece et al. (2002) Preece, R. D., Briggs, M. S., Giblin, T. W., Mallozzi, R. S., Pendleton, G. N., Paciesas, W. S., & Band, D. L. 2002, ApJ, 581, 1248
- Preece et al. (1998) Preece, R. D., Briggs, M. S., Mallozzi, R. S., Pendleton, G. N., Paciesas, W. S., & Band, D. L. 1998, ApJ, 506, L23
- Racusin et al. (2011) Racusin, J. L., Oates, S. R., Schady, P., et. al. 2011, ApJ, 738, 138
- Rees & Meszaros (1992) Rees, M. J. & Meszaros, P. 1992, MNRAS, 258, 41P
- Rees & Meszaros (1994) —. 1994, ApJ, 430, L93
- Rees & Mészáros (2005) Rees, M. J. & Mészáros, P. 2005, ApJ, 628, 847
- Ryde (2004) Ryde, F. 2004, ApJ, 614, 827
- Ryde (2005) —. 2005, ApJ, 625, L95
- Ryde et al. (2010) Ryde, F., Axelsson, M., Zhang, B. B., et. al. 2010, ApJ, 709, L172
- Ryde & Pe’er (2009) Ryde, F. & Pe’er, A. 2009, ApJ, 702, 1211
- Santana et al. (2014) Santana, R., Barniol Duran, R., & Kumar, P. 2014, ApJ, 785, 29
- Sari & Piran (1999) Sari, R. & Piran, T. 1999, ApJ, 517, L109
- Schulze et al. (2014) Schulze, S., Malesani, D., Cucchiara, A., et. al. 2014, A&A, 566, A102
- Serino et al. (2011) Serino, M., Yoshida, A., Kawai, N., et. al. 2011, PASJ, 63, 1035
- Shcherbakov et al. (2013) Shcherbakov, R. V., Pe’er, A., Reynolds, C. S., Haas, R., Bode, T., & Laguna, P. 2013, ApJ, 769, 85
- Sparre & Starling (2012) Sparre, M. & Starling, R. L. C. 2012, MNRAS, 427, 2965
- Starling et al. (2012) Starling, R. L. C., Page, K. L., Pe’er, A., Beardmore, A. P., & Osborne, J. P. 2012, MNRAS, 427, 2950
- Starling et al. (2011) Starling, R. L. C., Wiersema, K., Levan, A. J., et. al. 2011, MNRAS, 411, 2792
- Uhm & Zhang (2014) Uhm, Z. L. & Zhang, B. 2014, Nature Physics, 10, 351
- von Kienlin et al. (2014) von Kienlin, A., Meegan, C. A., Paciesas, W. S., et. al. 2014, ApJS, 211, 13
- Vurm & Beloborodov (2015) Vurm, I. & Beloborodov, A. M. 2015, ArXiv e-prints
- Vurm et al. (2013) Vurm, I., Lyubarsky, Y., & Piran, T. 2013, ApJ, 764, 143
- Wang et al. (2015) Wang, X.-G., Zhang, B., Liang, E.-W., et. al. 2015, ApJS, 219, 9
- Woods & Loeb (1995) Woods, E. & Loeb, A. 1995, ApJ, 453, 583
- Woosley (1993) Woosley, S. E. 1993, ApJ, 405, 273
- Wygoda et al. (2015) Wygoda, N., Guetta, D., Mandich, M.-A., & Waxman, E. 2015, ArXiv e-prints
- Yu et al. (2015a) Yu, H.-F., Greiner, J., van Eerten, H., et. al. 2015a, A&A, 573, A81
- Yu et al. (2015b) Yu, H.-F., van Eerten, H. J., Greiner, J., Sari, R., Narayana Bhat, P., von Kienlin, A., Paciesas, W. S., & Preece, R. D. 2015b, ArXiv e-prints
- Zhang & Pe’er (2009) Zhang, B. & Pe’er, A. 2009, ApJ, 700, L65
- Zhang & Yan (2011) Zhang, B. & Yan, H. 2011, ApJ, 726, 90
- Zhang et al. (2009) Zhang, B., Zhang, B.-B., Virgili, F. J., et. al. 2009, ApJ, 703, 1696
- Zhang et al. (2015) Zhang, B.-B., Uhm, Z. L., Connaughton, V., Briggs, M. S., & Zhang, B. 2015, ArXiv e-prints