The broad-band radio spectrum of LS I +61∘303 in outburst
Abstract
Aims. Our aim is to explore the broad-band radio continuum spectrum of LS I +61∘303 during its outbursts by employing the available set of secondary focus receivers of the Effelsberg 100 m telescope.
Methods. The clear periodicity of the system LS I +61∘303 allowed observations to be scheduled covering the large radio outburst in March-April 2012. We observed LS I +61∘303 on 14 consecutive days at 2.6, 4.85, 8.35, 10.45, 14.3, 23, and 32 GHz with a cadence of about 12 hours followed by two additional observations several days later. Based on these observations we obtained a total of 24 quasi-simultaneous broad-band radio spectra.
Results. During onset, the main flare shows an almost flat broad-band spectrum, most prominently seen on March 27, 2012, where – for the first time – a flat spectrum (, ) is observed up to 32 GHz (9 mm wavelength). The flare decay phase shows superimposed “sub-flares” with the spectral index oscillating between 0.4 and 0.1 in a quasi-regular fashion. Finally, the spectral index steepens during the decay phase, showing optically thin emission with values 0.5 to 0.7.
Conclusions. The radio characteristics of LS I +61∘303 compare well with those of the microquasars XTE J1752-223 and Cygnus X-3. In these systems the flaring phase is actually also composed of a sequence of outbursts with clearly different spectral characteristics: a first outburst with a flat/inverted spectrum followed by a bursting phase of optically thin emission.
Key Words.:
Radio continuum: stars - Galaxies: jets - X-rays: binaries - X-rays: individual (LS I +61∘303 ) - Gamma-rays: stars1 Introduction
The periodical radio emitting stellar system LS I +61∘303 consists of a fast rotating Be star and a compact object of unclear nature. One hypothesis is that the compact object is a radio pulsar and that the relativistic electrons responsible for the radio outburst are produced through an interaction between the relativistic wind of the pulsar and the wind of the Be star (Maraschi & Treves, 1981; Dhawan et al., 2006; Dubus, 2006), i.e. similar to the system PSR B125963. This system is formed by a O9.5Ve star and a compact object with well-detected radio pulses, i.e. a radio pulsar. The radio outburst of PSR B125963 occurring around periastron passage is explained by electrons accelerated at the shock front between the two winds (Chernyakova et al., 2014, and references therein). For the compact object in LS I +61∘303 with the radio outburst towards apastron, however, an alternative hypothesis suggests an accreting object, i.e. a black hole or a neutron star (e.g. Taylor et al., 1992; Romero et al., 2007; Massi & Kaufman Bernadó, 2009). In this case, the radio emitting electrons belong to a jet typical of microquasars. The Bondi & Hoyle (1944) accretion theory for the eccentric orbit of LS I +61∘303 with an orbital period 26.496 days (phase ) then predicts two accretion maxima and therefore two ejections of relativistic electrons (Taylor et al., 1992; Marti & Paredes, 1995; Bosch-Ramon et al., 2006; Romero et al., 2007). During the first ejection near periastron (, Casares et al., 2005) relativistic electrons suffer severe inverse-Compton (IC) losses due to the proximity to the Be star. Consequently, a high energy outburst is expected, as indeed confirmed by Fermi/LAT observations (Abdo et al., 2009), but no or only negligible radio emission (Bosch-Ramon et al., 2006). For the second accretion peak near apastron it has been demonstrated by Bosch-Ramon et al. (2006) that the larger distance between the compact object and the Be star results in lower IC losses (i.e. a smaller high energy outburst) and the relativistic electrons can propagate out of the orbital plane into a radio jet. Recent Fermi/LAT observations also confirmed this second, smaller high energy outburst (Jaron & Massi, 2014).
Synchrotron radiation emitted from one relativistic electron population with density gyrating along a magnetic field produces a power-law radio spectrum () with spectral slope above a critical frequency that depends on and . Below this critical frequency self-absorption effects become important and the emission becomes optically thick with a spectral slope (e.g. Kaiser, 2006). For instance, the spectrum of the radio outburst in the pulsar system PSR B125963 has a spectral index , which is consistent with optically thin synchrotron emission (Fig. 3 in Connors et al., 2002). In contrast, the jets of microquasars often show flat/inverted radio spectra as demonstrated by Fender (2001). Plasma and magnetic field variations along the jet in fact may create regions with different and values resulting in spectral components with different turn-over frequencies . The overlap of the optically thin part of one spectral component with the self-absorbed part of the adjacent one will result in a flat spectrum when observed with a spatial resolution insufficient to resolve the jet (Kaiser, 2006). In the microquasar Cygnus X-1, radio emission has been measured with a flat spectrum, i.e. and (Fender et al., 2000). In Cygnus X-1 the black hole is powered by accretion of the stellar wind of its supergiant companion star. Since the companion is close to filling its Roche lobe, the wind is not symmetric but strongly focused towards the black hole (Miškovičová et al., 2011, and references therein). In contrast, as discussed above in the context of an accretion scenario, accretion in LS I +61∘303 occurs in two particular orbital phases due to the eccentric orbit around the Be star. Is the accretion phase and subsequent ejection in LS I +61∘303 able to develop a microquasar jet with a flat spectrum? As shown by Corbel et al. (2013), in the early phase of jet formation the low density particles in the jet produce an optically thin synchrotron power-law spectrum at GHz frequencies. Only when the density of the jet plasma increases, a transition to higher optical depth occurs resulting in flat/inverted radio spectra (). In LS I +61∘303 strong evidence for a flat radio spectrum does exist. Early VLA observations at four epochs revealed a flat spectrum between 1.5 and 22 GHz (Gregory et al., 1979). Furthermore, Strickman et al. (1998) carried out multi-frequency VLA observations sparsely covering one orbit and found deviations in the radio spectrum from a simple power law during the outburst. Finally, Massi & Kaufman Bernadó (2009) measured even inverted, optically thick spectra between 2.2 GHz and 8.3 GHz. The primary aim of the current work is to extend previous radio observations of LS I +61∘303 and systematically study – for the first time – broad-band cm/mm (2.6–32 GHz) radio spectra and their evolution during a complete outburst. The densely sampled observations of LS I +61∘303 were performed over a period of about three weeks (a total of 24 days) using the Effelsberg 100 m telescope at a total of seven frequency bands. The paper is structured as follows. In Sect. 2 we briefly present the observations and data reduction procedures. In Sect. 3 we present the results. Section 4 provides a short discussion and our conclusions.


.
2 Observations and data reduction
The multi-frequency flux density measurements of the periodical (Jaron & Massi, 2013) radio outburst of LS I +61∘303 were performed approximately every 12 hours over 14 consecutive days between 2012 March 27, orbital phase , and 2012 April 8, (Zimmermann, 2013). The orbital phase is equal to the fractional part of ( d, Gregory, 2002). Two additional measurements were obtained on 2012 April 12 () and 19 () bringing the total observing period to 24 days. At each observing session lasting for about 2 hours, LS I +61∘303 was observed together with primary calibrators consecutively at seven frequencies, namely 2.64, 4.85, 8.35, 10.45, 14.60, 23.02, and 32.00 GHz (110, 60, 36, 28, 20, 13, and 9 mm wavelengths) using the secondary focus receivers of the Effelsberg 100 m telescope. Flux density measurements were performed using the cross-scan technique, i.e. progressively slewing over the source position in azimuthal and elevation direction with the number of sub-scans matching the source brightness at a given frequency. The data reduction from raw telescope data to calibrated flux densities/spectra was done in the standard manner as described in Fuhrmann et al. (2008). The overall, final measurement uncertainties are of the order of 1% and 5% at lower and higher frequencies, respectively.
3 Results
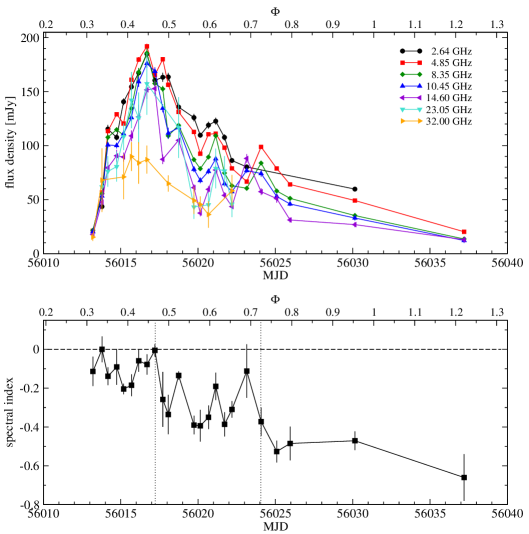
The total flux density evolution at all frequencies is shown in Fig. 1 (top). At MJD 56013.2 (=0.29), the flux density rises steeply from around 20 mJy to 100 mJy within 24 hours (until MJD 56014.2) and remains approximately at that level. After another 24 hours (MJD 56015.7), it rises yet again to the highest flux density level (around 200 mJy at the lowest frequencies) at MJD 56016.7, i.e. the outburst reaches its peak within about 3.5 days after onset. We further note that the peak of the outburst at frequencies 10.45 GHz is reached at the same epoch, i.e. no significant delay is obvious within our time sampling of 12 hours. At higher frequencies the situation is less clear given the lower data sampling and larger measurement uncertainties. Subsequently, the slow decay of the outburst takes place (MJD 56017.2) though intersected by several superimposed events. These sub-flares occur with rise/decay times of 12 to 24 hours and with amplitudes of a few 10 mJy. We note that during the last sub-flare (around MJD 56024), the peak at higher frequencies (here: 10.45 and 14.60 GHz) appears to occur 24 hours earlier. In Fig. 2, the broad-band radio spectra of all epochs are shown. In order to quantify the spectral behaviour of LS I +61∘303, broad-band spectral indices () were obtained by performing a power-law fit to all available multi-frequency flux densities of a given epoch and the resulting fits are superimposed in Fig. 2. The spectral index evolution with time is shown in Fig. 1 (bottom: vs. MJD) and is characterized by an overall long-term decreasing trend with (i) the flattest spectral indices occurring during the early raise/peak of the outburst and (ii) increasingly steeper values during the outburst decay with the steepest values reached towards the end ( 0.5 to 0.7). A linear fit to the spectral indices reveals that on average a spectral steepening of = 0.03 per day takes place over the total observing period of 24 days. Examining the spectral index behaviour in more detail we basically identify three stages (vertical dotted lines in Fig. 1, bottom). During the rise until shortly after the main peak, i.e. from MJD 56013.2 to MJD 56017.2, the broad-band spectrum remains almost flat (average spectral index 0.100.02) and an even inverted spectrum is observed at high frequencies during some epochs (i.e. 0.6, 0.4, and 0.6 at MJD 56013.8, MJD 56015.2, and MJD56015.7, respectively). Subsequently, a stage covering the decay phase follows with the superimposed sub-flares lasting until MJD 56023.1 and with spectral indices dropping to values as low as 0.39 (mean value: 0.290.03). Here, however, appears to oscillate between 0.4 and 0.1 in a quasi-regular fashion, whereas the local peaks in spectral index roughly coincide with the peaks of the sub-flares seen in the total intensity light curves (Fig. 1, top). We further note that also during the decay stage several epochs show an inverted spectrum at high frequencies. During the last stage of the decay (MJD 56025 to MJD 56037), the spectral index finally drops to the steepest observed values ranging between 0.5 and 0.7, i.e. clearly optically thin, with an average of during this period.
4 Discussion and conclusions
During our Effelsberg campaign in 2012 March-April, LS I +61∘303 was monitored at seven frequencies between 2.6 and 32 GHz over a total period of 24 days with a cadence of about 12 hours (over the first 12 days). Our observations reveal the following results:
-
1.
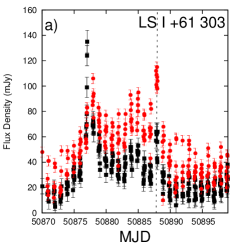
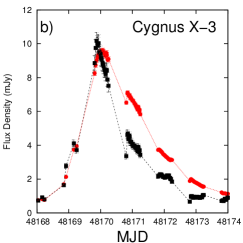
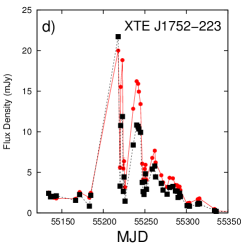
The broad-band data show a main peak with nearly flat spectra followed by a sequence of small amplitude, optically thin events. This sequence of outbursts with different spectral characteristics is also found in Cygnus X-3: Fig. 3b shows GBI observations of Cygnus X-3 (Waltman et al., 1995), where a first outburst with almost flat spectrum () is seen, followed by a minor optically thin flare. Figure 3c displays a first outburst exhibiting an inverted spectrum () followed by a bursting phase of optically thin emission, as also seen for LS I +61∘303 in the GBI observations of Fig. 3a. Clearly both sources, LS I +61∘303 and Cygnus X-3, show the same sequence of events: a first outburst with flat/inverted spectrum is followed by one or more optically thin flares. A third microquasar with the same complex outburst behaviour is XTE J1752-223 (Brocksopp et al., 2013). In Fig. 3d we show one outburst at 5.5/9 GHz (see also Fig. 1 in Brocksopp et al., 2013), where the first peak with is clearly distinguished from the subsequent optically thin flares. Brocksopp et al. (2013) associate the first flare with the compact XTE J1752-223 jet and the sequence of optically thin flares with discrete ejections or shocks.
-
2.
During the sequence of LS I +61∘303 sub-flares presented in Fig. 1, appears to oscillate in a quasi-regular fashion. Such spectral variability has so far only been discussed in the microquasar GRS 1915+105 (see Fig. 2 in Fender et al., 2002). As apparent from the inset of Fig. 3c (2.2/8.3 GHz spectral index vs. time), Cygnus X-3 also shows similar spectral index oscillations during the three, minor sub-flares occurring between MJD 48470 and MJD 48480.
The dashed line in Fig. 3a indicates the epoch where Paredes et al. (2000) obtained a steep LS I +61∘303 cm/mm spectrum up to 250 GHz (1998 March 15) during one of the optically thin sub-flares following the main flare. As a follow-up of our work, it is certainly of interest to observe the main outburst of LS I +61∘303 also at higher radio frequencies. Indeed, flat/inverted spectra in microquasars have also been established at short millimeter wavelengths (Fender et al., 2000; Fender, 2001) and it will be important to clarify if the short accretion phase in the eccentric orbit of LS I +61∘303 is able to maintain a flat spectrum up to such high frequencies.

Acknowledgements.
This research is based on observations with the 100 m telescope of the MPIfR (Max-Planck-Institut für Radioastronomie) at Effelsberg. We thank Frédéric Jaron and Jürgen Neidhofer for several interesting discussions and the anonymous referee for useful comments. The work is partly supported by the German Excellence Initiative via the Bonn Cologne Graduate School and the International Max Planck Research School for Astronomy and Astrophysics.References
- Abdo et al. (2009) Abdo, A. A., et al. 2009, ApJ, 701, L123
- Bondi & Hoyle (1944) Bondi, H., & Hoyle, F. 1944, MNRAS, 104, 273
- Bosch-Ramon et al. (2006) Bosch-Ramon, V., Paredes, J. M., Romero, G. E., & Ribó, M. 2006, A&A, 459, L25
- Brocksopp et al. (2013) Brocksopp, C., Corbel, S., Tzioumis, A., et al. 2013, MNRAS, 432, 931
- Casares et al. (2005) Casares, J. et al. 2005, MNRAS, 360, 1105
- Chernyakova et al. (2014) Chernyakova, M., Abdo, A. A., Neronov, A., et al. 2014, MNRAS, 439, 432
- Connors et al. (2002) Connors, T. W. et al. 2002, MNRAS, 336, 1201
- Corbel et al. (2013) Corbel, S., Aussel, H., Broderick, J. W., et al. 2013, MNRAS, 431, L107
- Dhawan et al. (2006) Dhawan, V., Mioduszewski, A., & Rupen, M. 2006, Proceedings of the VI Microquasar Workshop, p. 52.1
- Dubus (2006) Dubus, G. 2006, A&A, 456, 801
- Fender et al. (2000) Fender, R. P., Pooley, G. G., Durouchoux, P., Tilanus, R. P. J., & Brocksopp, C. 2000, MNRAS, 312, 853
- Fender (2001) Fender, R. P. 2001, MNRAS, 322, 31
- Fender et al. (2002) Fender, R. P., Rayner, D., Trushkin, S. A., et al. 2002, MNRAS, 330, 212
- Fuhrmann et al. (2008) Fuhrmann, L., Krichbaum, T. P., Witzel, A., et al. 2008, A&A, 490, 1019
- Gregory et al. (1979) Gregory, P. C., Taylor, A. R., Crampton, D., et al. 1979, AJ, 84, 1030
- Gregory (2002) Gregory, P. C. 2002, ApJ, 575, 427
- Jaron & Massi (2013) Jaron, F., & Massi, M. 2013, A&A, 559, AA129
- Jaron & Massi (2014) Jaron, F., & Massi, M. 2014, A&A, 572, AA105
- Kaiser (2006) Kaiser, C. R. 2006, MNRAS, 367, 1083
- Maraschi & Treves (1981) Maraschi, L., Treves, A. 1981, MNRAS, 194, 1P
- Marti & Paredes (1995) Marti, J., & Paredes, J. M. 1995, A&A, 298, 151
- Massi & Kaufman Bernadó (2009) Massi, M., & Kaufman Bernadó, M. 2009, ApJ, 702, 1179
- Massi & Jaron (2013) Massi, M., & Jaron, F. 2013, A&A, 554, A105
- Massi & Torricelli-Ciamponi (2014) Massi, M., & Torricelli-Ciamponi, G. 2014, A&A, 564, A23
- Massi (2015) Massi, M. 2015, arXiv:1502.07543, PoS(EVN 2014)062
- Miškovičová et al. (2011) Miškovičová, I., Hanke, M., Wilms, J., et al. 2011, Acta Polytechnica, 51, 85
- Paredes et al. (2000) Paredes, J. M., Martí, J., Peracaula, M., Pooley, G., & Mirabel, I. F. 2000, A&A, 357, 507
- Romero et al. (2007) Romero, G. E. et al. 2007, A&A, 474, 15
- Strickman et al. (1998) Strickman, M. S., Tavani, M., Coe, M. J., et al. 1998, ApJ, 497, 419
- Taylor et al. (1992) Taylor, A. R., Kenny, H. T., Spencer, R. E., & Tzioumis, A. 1992, ApJ, 395, 268
- Waltman et al. (1995) Waltman, E. B., Ghigo, F. D., Johnston, K. J., et al. 1995, AJ, 110, 290
- Zimmermann (2013) Zimmermann, L.: Variability of radio and TeV emitting X-ray binary systems The case of LS I +61∘303. Bonn, Univ., Diss., 2013 URN:urn:nbn:de:hbz:5n-33175