Magnetic anisotropy energy in disordered Ge1-xMnxTe
Abstract
We theoretically analyze the influence of chemical disorder on magnetic anisotropy in Ge1-xMnxTe semiconductor layers known to exhibit carrier-induced ferromagnetism and ferroelectric distortion of rhombohedral crystal lattice. Using DFT method we determine the local changes in the crystal structure due to Mn ions substitution for Ge and due to the presence in Ge1-xMnxTe of very high concentration of cation vacancies. We calculate the effect of this structural and chemical disorder on single ion magnetic anisotropy mechanism and show that its contribution is order of magnitude smaller as compared to magnetic anisotropy mechanism originating from the spin polarization induced by Mn ions into neighboring Te and Ge ions. We also discuss magnetic anisotropy effects due to pairs of Mn ions differently allocated in the lattice. The spatial averaging over chemical disorder strongly reduces the strength of this magnetic anisotropy mechanism and restores the global rhombohedral symmetry of magnetic system.
keywords:
ferromagnetic semiconductors, magnetic anisotropy1 Introduction
GeTe belongs to the IV-VI family of narrow gap semiconductors. At temperatures
below = 670 K its crystal structure has rhombohedral symmetry
which can be characterized by three parameters: the lattice constant
Å, the rhombohedral angle and
the relative displacement of Te and Ge sublattices along [111]
crystallographic direction. This displacement which is equal to
, where , causes GeTe to be ferroelectric.
Manganese ions Mn2+ introduce in Ge1-xMnxTe local magnetic moments and this
IV-VI
diluted magnetic (semimagnetic) semiconductor (DMS) exhibits ferromagnetic
transition with the
Curie
temperature up to 190 K [1, 2]. Due to
simultaneous ferroelectric and ferromagnetic ordering Ge1-xMnxTe belongs to the
class of multiferroic materials, which may become very interesting for
possible future applications.
Our previous theoretical analysis of the physical mechanisms of magnetic anisotropy in Ge1-xMnxTe [3], hereafter referred as paper I, was inspired by recent, unexpected results of magnetization and ferromagnetic resonance experiments which clearly showed that the easy axis of magnetization in thin layers of Ge1-xMnxTe, for the manganese content of about 10 at. %, is perpendicular to the layer [2, 4, 5, 6, 7, 8]. In ferromagnetic thin layers the shape anisotropy usually dominates with easy magnetization axis located in the layer plane. This is indeed observed in Ge1-xMnxTe layers for higher content of manganese, above 20 at. %. For these layers the X-ray diffraction analysis (XRD) shows that the increase of Mn content results in transition from rhombohedral to cubic (rock-salt) crystal structure.
In the paper I we performed extensive ab initio density functional theory (DFT) calculations of magnetic anisotropy energy (MAE) in Ge1-xMnxTe. The aim was to elucidate microscopic mechanisms responsible for the magnetic anisotropy. We concluded that the main contribution to MAE is given by the spin polarization induced in Te and Ge neighbors of Mn, and not by the Mn ions themselves. The Mn spin polarizes its neighborhood, the spins of Ge ions are approximately parallel and the spins of Te ions approximately antiparallel to the direction of the Mn spin. The degree and the spatial range of spin polarization is relatively small in insulating crystal but it strongly grows with the increasing concentration of holes. Because of spin-orbit (S-O) interaction, the directions of Te and Ge spins forced by the direction of Mn spin do not, in general, correspond to minimum of the total energy of the system. This forcing of Ge and Te polarizations by the Mn spin is the principal reason why variations of the directions of Mn spins result in changes of the total energy. Apart from the identification of the main physical mechanism responsible for magnetic anisotropy we also showed that MAE is determined by the hole concentration, macroscopic crystal structure, and the local configuration of Mn.
The paper I was devoted almost exclusively to the situations where there was only one Mn ion in rhombohedral supercell containing 64 atoms. In all cases, the angular dependence of MAE on the Mn spin direction characterized by the angle was well approximated by the formula
| (1) |
Here is the angle measured in the (-110) plane from the [111] direction. Thus, for and , the Mn spin is parallel to [111] and to the [11-2] crystallographic directions, respectively. The same definition of is used in the present paper.
One should keep in mind that a supercell containing one Mn ion simulates perfect, translationally invariant crystal with rhombohedral symmetry. In actual random substitutional alloys, this symmetry is locally destroyed.
Although macroscopic structural, mechanical, electrical or magnetic properties can have the global rhombohedral symmetry as confirmed by XRD, at the unit cell scale this symmetry is destroyed. This is due to the randomness of the occupancies of lattice sites in the chemically mixed cation sublattice (which is sometimes called chemical disorder), and to the presence of native defects, in our case the cation vacancies. The random positions of manganese ions together with different ionic radii of Ge and Mn lead to local deformation of the lattice. The local deformations are also caused by the germanium vacancies. Each cation vacancy, like in other IV-VI semiconductors, delivers two holes, thus in real sample with the hole concentration of the order cm-3 we expect cm-3 of vacancies. For comparison, the Mn concentration corresponds to about of Mn ions per cubic centimeter.
The influence of the chemical disorder on the magnetic anisotropy in Ge1-xMnxTe is the topic of the present paper. The paper is organized as follows.
In Section 2 we analyze the single ion magnetic anisotropy (SIMA) in Ge1-xMnxTe. In the paper I we explicitly showed that SIMA in the conducting Ge1-xMnxTe, is of minor importance compared to the anisotropy caused by spin polarized free carriers. However, the calculations were performed for systems with manganese ion’s neighbourhood of perfect rhombohedral symmetry. On the other hand it is well known from numerous electron paramagnetic resonance experiments (EPR) that the ground state splittings and consequently magnetic anisotropy properties of Mn2+ ion strongly depend on the symmetry of its surrounding. Previous calculations performed for Pb1-xMnxTe and Sn1-x-yPbyMnxTe show that the ground state splitting of Mn2+ ion in disordered environment may be of the order of 1 Kelvin. Because the difference in ionic radii of Ge and Mn is much smaller than that of Pb and Mn, the local lattice distortions (which strongly influence the magnetic properties of Mn) are also smaller. Thus, we do not expect that SIMA driven by the microscopic lattice distortions are dominant in Ge1-xMnxTe. On the other hand, the band structure of GeTe is significantly different from those of other IV-VI semiconductors due to ferroelectric properties of the crystal. That is why direct calculations of SIMA in Ge1-xMnxTe are necessary.
In Section 2 we briefly describe mechanism responsible for SIMA and the method of calculations. The obtained results confirm that even in the presence of disorder, in conducting Ge1-xMnxTe SIMA is of secondary importance.
Section 3 presents results of ab initio calculations of MAE of pairs of Mn ions in Ge1-xMnxTe. All nonequivalent positions of two Mn in the supercell are taken into account. We also show a few results for three Mn ions in the supercell. In the calculations the spins of Mn ions are always parallel. This is justified, because according to the results of Section II the energies connected with local magnetic anisotropy easy axes are small, and in the first approximation the possible noncollinearity of Mn spins can be neglected. We explicitly show that the direction of easy axis of magnetization strongly depends on the relative position of Mn ions, and MAE is not described by Eq. (1). For chosen two configurations of two manganese ions we analyze contributions of kinetic, electrostatic and exchange-correlation energies to MAE. It is shown that the Mn ions introduced to GeTe causes significant perturbation in spatial distribution of electron charge and, consequently, significant change of electrostatic potential which, via the S-O interaction, influences MAE.
In Section 4 we summarize the main conclusions of the paper.
2 Single ion magnetic anisotropy
2.1 Theory
According to the Hund’s rule, the ground state of Mn2+ ion is , with the orbital momentum and spin . As the orbital singlet, it does not interact with the crystal environment, and its ground state without external magnetic field is six-fold degenerate. This model of Mn2+ ion explains a number of phenomena, e.g., the results of magnetization measurements in diluted magnetic semiconductors. However, if we consider problems in which very small excitation energies are of importance, this model is no longer valid. An example of such a problem is the splitting of the ground state of Mn ion in a crystal field measured in EPR experiments. In the theoretical analysis for zero magnetic field, the Mn2+ ion is described by a matrix, , which plays a role of effective spin Hamiltonian [9]. The subscripts denote the projections of Mn spin on the quantization axis. For example, for a perfect cubic symmetry of Mn surrounding
| (2) |
The lowest excitation energies of the ion (i.e., the eigenvalues of )
strongly depend on the symmetry of its
neighborhood, and are in the range K.
If the Hamiltonian is not diagonal, it leads not only to the ground
state
splitting but also to the magnetic anisotropy of the
ion [9, 10].
Density functional theory, which is one of the basic theoretical
methods used to study condensed matter properties, is not suitable for this
problem
because DFT calculations determine the electron density in the ground state, and
provide no direct information about the excited states of the system,
particularly in situations where the energies of the excited states are very
small. In this case one should use methods based on perturbation theory.
There are two mechanisms known in the literature which lead to the ground state splitting: interaction with excited states of configuration, and hybridization between and orbitals of the surrounding ions. In the first mechanism [11] the internal manganese S-O interaction couples with the excited states, due to which the ground state of Mn is no longer a pure state with total angular momentum . Consequently, the interaction with the crystal environment becomes possible. As a result, ground state splitting and nondiagonal effective Hamiltonian are finite.
In DMS, the second mechanism, i.e., the hybridization between (Mn) orbitals and the orbitals of the neighboring ions, plays a more important role. In this case, a system consisting of (Mn) electrons and valence band carriers is considered. In the ground state of this system, which is six-fold degenerate due to manganese spin , there are five electrons on the shell and the host bands are filled up to the Fermi energy. In the excited state, one electron is transferred from the host band to the shell (or from the shell to the band) resulting in one additional hole (or electron) in the host bands, respectively. Such virtual transfers of electron were used earlier in theories of exchange interaction in semiconductors [12, 13, 14]. As a consequence of this shell - band states hybridization, the ground state of the system is no longer six fold degenerate, and the resulting low energy excitation spectrum and the anisotropic properties of the ion take place, in accord with experimental observations. This mechanism was described in Ref. [15] and successfully applied to EPR results for PbTe:Mn layers grown on BaF2 and KCl substrates [15], to the single ion anisotropy in Sn1-x-yPbyMnxTe mixed crystals [16] and to the analysis of magnetic specific heat in Pb1-xMnxTe [17]. This method is also used in the present paper for calculations of effective spin Hamiltonian. Here, we do not repeat detailed description of the method and formulas contained in Ref. [15] but sketch only the main idea of calculations.
We consider GeTe crystal at the temperature with one germanium atom replaced by manganese atom. It is assumed that this replacement does not change appreciably neither the band structure nor the spatial electron distribution. The only difference comparing to the pure GeTe is the presence of additional shell on one of the cation places with five electrons on it. If we neglect hybridization between orbitals and the orbitals of the neighbouring atoms, in the ground state of such a system there are five electrons on shell, and free electrons fill the band states up to the Fermi energy. This ground state is sixfold degenerate due to the total spin of the shell. In the excited states of the system one electron is transferred from shell to an unoccupied band state, or one electron from the band is transferred to the shell. Such transfers require excitation energy denoted by , which will be the only fitting parameter for comparison of MAE given by the effective Hamiltonian with the DFT results.
In the excited states there are four or six electrons on the shell, and according to the Hund’s rule their total angular momentum and the total spin . Due to nonzero total angular momentum, in the excited states the internal Mn spin-orbit coupling should be taken into account. The inclusion of the internal S-O coupling is crucial for the splitting of the ground state and magnetic anisotropy properties of the ion, otherwise the ground state is not split, independently whether the band spin-orbit coupling is present or not.
In the Hamiltonian of the system the ground and excited states are connected by hybridization between (Mn) orbitals and orbitals of neighbouring Te ions. The effective spin Hamiltonian for the ground state is calculated within the framework of the second order perturbation theory for degenerate spectra with respect to hybridization.
The main differences between the present calculations and those presented in Ref. [15] for Pb1-xMnxTe are related to the tight binding model of the band structure and to the hybridization parameters between states of Mn ion and the orbitals of neighboring Te ions used in calculations. In Ref. [15] we considered Mn ion in PbTe using the tight binding model that takes into account nearest cation - anion neighbors and nearest and next nearest cation - cation and anion - anion neighbors. The model was parametrized according to Ref. [18]. The integrals describing hybridization Mn -Te orbitals were taken from Ref. [19]. Here, the tight binding model takes into account integrals up to the third neighbour, and their values were taken from DFT calculations for GeTe as the matrix elements of Kohn – Sham Hamiltonian between pseudoatomic orbitals of Ge and Te. Using ab initio OpenMX package [20] we performed calculations for both fully relativistic and scalar relativistic pseudopotentials. Thus, we can compare effective spin Hamiltonian obtained for situations with and without the band spin-orbit interaction.
From DFT calculations performed for supercell containing 64 atoms with one Ge replaced by Mn atom we obtain hybridization parameters between (Mn) states and and orbitals of the nearest Te ions.
In calculations, like in the paper I, the crystal structure parameters were assumed Å, and .
Having the effective spin Hamiltonian we obtain , i. e., the dependence of single ion anisotropy energy on the direction of Mn spin defined by the angles and . To this aim we introduce a matrix
| (3) |
where and are rotation matrices for spin around the and the axis, respectively. Now, we denote by a state of the Mn spin for which the projection on the quantization axis is , i.e., in this state the Mn spin points in the direction. Then denotes the state in which the spin points in the direction defined by the angles and . We define
| (4) |
as the angular dependence of the single ion anisotropy energy on the spin’s direction. For example, for the Mn ion in perfect cubic environment the effective spin Hamiltonian, Eq. (2), leads to
| (5) |
which is identical to that obtained by Yosida and Tachiki using a different approach [10].
2.2 Determination of transfer energy
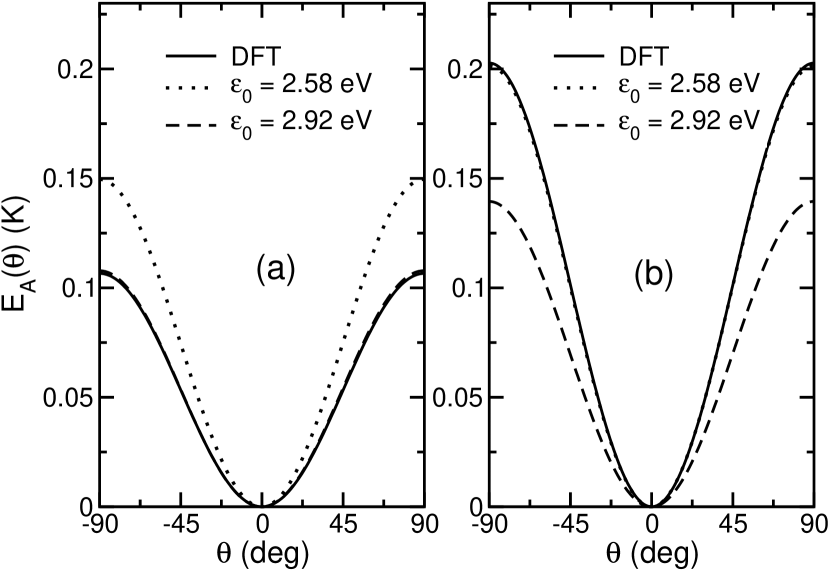
To determine the energy , i. e. the energy necessary to transfer an electron between the shell and the top of the valence band, we performed scalar relativistic calculations for GeTe. Next, using the tight binding parameters from the obtained Kohn - Sham Hamiltonian we calculated the effective spin Hamiltonian and the angular dependence of MAE, , for for hole concentrations and cm-3 for different values of . The results were compared to MAE obtained from DFT calculations for 64-atom supercell containing one Mn ion for vanishing S-O coupling for Ge and Te atoms. Such a comparison makes sense only when the band spin-orbit interaction is neglected because, as we know from paper I, only in such a case MAE is due to Mn ion and does not depend on the direction of spin polarization of Ge and Te ions. From DFT calculations we obtain K and K for insulating and conducting cases, respectively. To obtain these values by the effective Hamiltonian method we must assume =2.92 eV for the insulating, and =2.58 eV for the conducting cases, respectively, see the Fig. 1. Because in the following we consider the conducting case, we assume =2.58 eV. The value of obtained from fitting of the present model to DFT ab initio calculations are quite reasonable, and comparable with the values used previously in the literature for PbTe. In Ref. [15] was considered in the interval from 1.6 eV to 3.5 eV, in Ref. [13] value 3.5 eV was assumed.
2.3 Dependence of magnetization easy axis direction on disorder
To simulate microscopic disorder in Ge1-xMnxTe we start from the perfect GeTe lattice characterized by Å, , with one Ge replaced by Mn. The directions and lengths of six bonds connecting Mn with its nearest Te neighbours are specified by , . We assume that the microscopic disorder leads to small changes in ,
| (6) | |||
where , , are homogeneously distributed random numbers from the interval (-0.5, 0.5). In calculations it is assumed that Mn-Te hybridization parameters change with the bond’s length as [21].
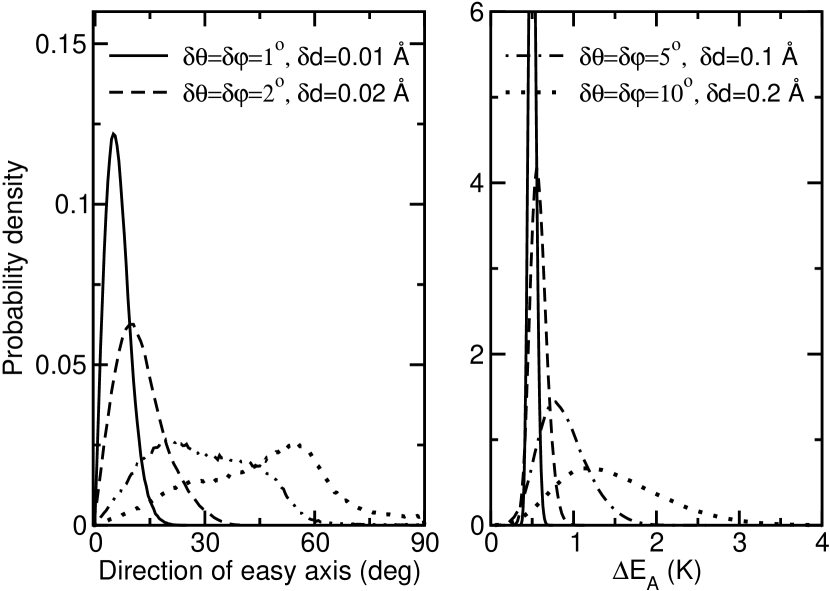
For a given configuration of Mn surrounding we calculate effective spin Hamiltonian, and using Eq. (4) we find . Having this functional dependence we obtain direction of the easy axis of magnetization and , the difference between maximal and minimal values of . In Fig. 2 we present normalized to unity histograms (probability densities) of directions of the easy axis of magnetization with respect to [111] crystallographic direction, Fig. 2a, and of , Fig. 2b. These histograms result from random configurations.
To obtain typical deflections of directions and lengths of Mn-Te bonds from those for the ideal lattice we performed, using OpenMX package [20], geometry optimization for the 64-atom supercell. We repeated the optimization for three different cases: 1) with one Mn ion, 2) with two Mn ions placed at nearest neighbours positions and 3) with two Mn ions placed at the two diagonal vertices of the elementary cell and with one Ge vacancy on the face of the elementary cell.
Comparing the directions and lengths of Mn-Te bonds between cases 2) and 3) with those in 1) we find that the the deflections are very small. The highest deflections are of the order of and changes of bond lengths are of the order of 0.01 Å. We see that even for very small deflections of directions and lengths of bonds from the ideal values, the influence on the distribution of the directions of the easy axes is quite substantial. However, the probability distribution for for such small , and remains well centered around the mean value, which is of the order of 0.5 K with the variance less than 0.1 K.
We have also calculated the averaged over disorder the magnetic field dependent magnetizations of Mn ion with magnetic field along [111] and perpendicular to [111] direction in different temperatures. The differences are noticeable, however in very small magnetic fields and extremely low temperatures only. The differences which might be compared to those experimentally observed are only for unphysically high level of disorder, see Fig. 2.
We conclude therefore that the single ion anisotropy does not play a decisive role in magnetic anisotropy energy in Ge1-xMnxTe. The present calculations further confirm the conclusion of the paper I that MAE in Ge1-xMnxTe is mainly due to polarization of valence band carriers.
3 Supercells containing more than one Mn ion
In the present Section we analyze magnetic anisotropy for all possible configurations of two Mn ions in the supercell, for the case of three Mn ions we show only results for a few randomly chosen configurations. Technical details of calculations were presented in the paper I. We used OpenMX package [20]. In all calculations of MAE the number of integration points in the Brillouin zone were 512 and 2744 for insulating and conducting cases, respectively. As was shown in the paper I such numbers give convergent results. In the conducting case, the calculations were performed for hole concentration cm-3, which is typical for samples studied experimentally. For geometry optimization, the number of integration points in the Brillouin zone reduced to 64 give convergent results. The force criterion for geometry optimization was equal to Hartree/Bohr.
In order to describe possible configurations, first, we introduce notation
describing positions of Mn ions in the supercell.
Let us
consider three vectors , and , parallel to the [100], [010] and [001] crystallographic directions,
respectively. The lengths of the vectors are the same, .
The symbol {ijk} describes the position of an atom in the supercell
where , , are integer numbers.
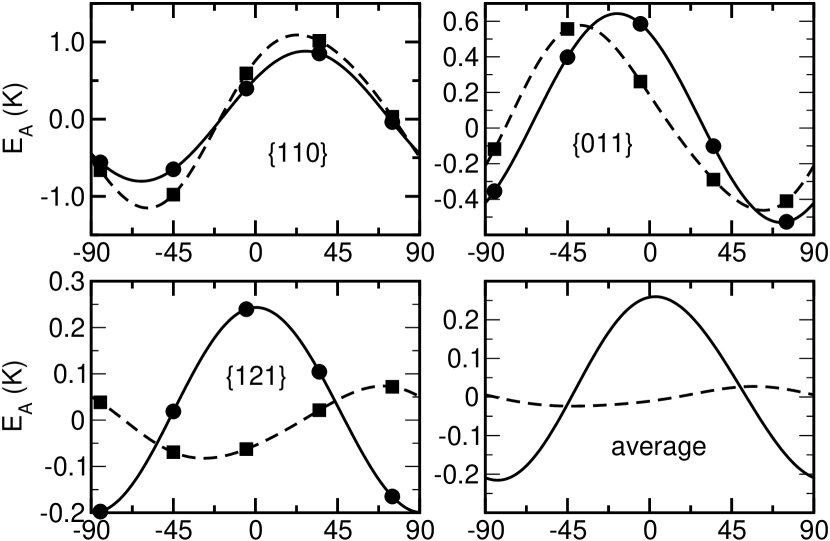
The first Mn atom is always placed at {000}. The supercell contain 32 different cation positions, thus the second Mn atom may be placed at 31 remaining positions. However, some of the resulting 31 configurations are equivalent because of the periodic boundary conditions; for example configurations {110} and {330} are equivalent. Actually, there are 21 nonequivalent configurations. We stress that due to nonzero Mn spin this number is larger then the number resulting from purely geometrical symmetry considerations for a rhombohedral lattice. Consider, for example, three nearest neighbor pair configurations for which the second Mn atom is placed at {110}, {011} and {101}, respectively. For vanishing spin, those three configurations are equivalent from the purely geometrical point of view, being related by the rotation along [111] axis by the angle . However, for finite , they are nonequivalent if we consider magnetic properties of the crystal, what is explicitly shown in the following in Fig. 3.
In the calculations, the Mn spin vectors are placed in the (-110) plane. Due to reflection symmetry with respect to this plane, the configurations {011} and {101} give identical results for the angular dependence of , thus it is enough to perform calculations for one of them, but for arbitrary direction of manganese spins it is necessary to calculate MAE for both.
| nonrelaxed | relaxed | ||||
|---|---|---|---|---|---|
| configuration | |||||
| {110} | 1 | 0.49 | 0.69 | 0.62 | 0.92 |
| {011} | 2 | 0.48 | -0.34 | 0.20 | -0.47 |
| {002} | 1 | -0.12 | -1.13 | -0.84 | -1.56 |
| {112} | 1 | 0.24 | -0.01 | -0.11 | -0.10 |
| {013} | 2 | -0.33 | -0.42 | -0.72 | -0.36 |
| {020} | 2 | 0.31 | 0.57 | 0.42 | 0.80 |
| {130} | 2 | 0.04 | 0.96 | 0.05 | 0.71 |
| {121} | 2 | 0.22 | 0.01 | -0.05 | 0.06 |
| {022} | 2 | 0.32 | -0.16 | -0.10 | -0.27 |
| {132} | 2 | 0.36 | -0.22 | -0.05 | -0.21 |
| {123} | 2 | 0.38 | 0.11 | 0.15 | 0.11 |
| {220} | 1 | 0.26 | 0.29 | 0.15 | 0.50 |
| {222} | 1 | 0.48 | -0.01 | 0.20 | 0.00 |
| average | 0.23 | 0.04 | -0.01 | 0.02 | |
| nonrelaxed | relaxed | ||||
|---|---|---|---|---|---|
| configuration | |||||
| {110} | 1 | -3.91 | 4.6 | 1.88 | 1.03 |
| {011} | 2 | -6.93 | -2.51 | -3.02 | -0.61 |
| {002} | 1 | -3.81 | 0.68 | -1.55 | 2.14 |
| {112} | 1 | -7.31 | -1.92 | -6.39 | -1.12 |
| {013} | 2 | -3.02 | -1.84 | -4.22 | -2.96 |
| {020} | 2 | -3.13 | -0.46 | 1.27 | -1.02 |
| {130} | 2 | -0.29 | 3.74 | -0.42 | 5.92 |
| {121} | 2 | -7.16 | 1.09 | -7.16 | 0.98 |
| {022} | 2 | -7.47 | -3.22 | -6.56 | -3.96 |
| {132} | 2 | -6.51 | -2.35 | -4.08 | -2.16 |
| {123} | 2 | -5.67 | 1.06 | -2.42 | 1.53 |
| {220} | 1 | -4.87 | 6.39 | -2.84 | 8.11 |
| {222} | 1 | -3.36 | 0.11 | -1.48 | 0.48 |
| average | -4.93 | 0.04 | -3.03 | 0.29 | |
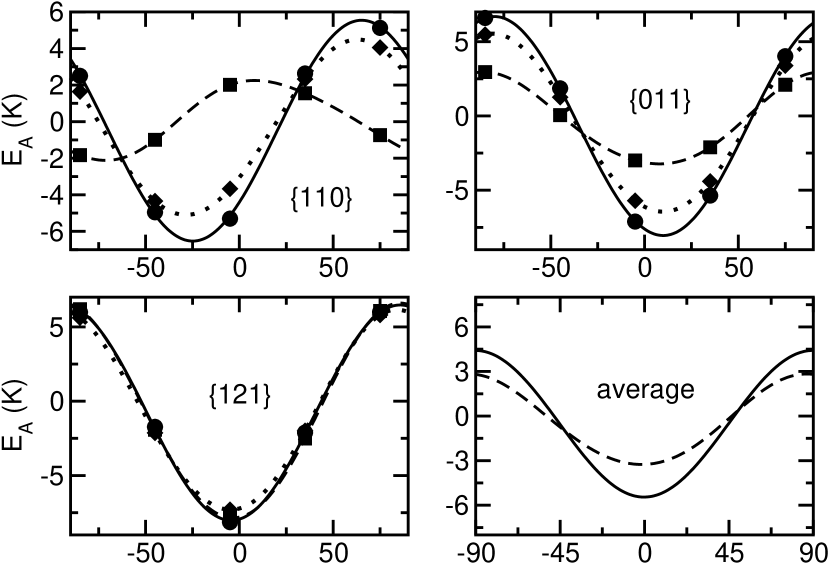
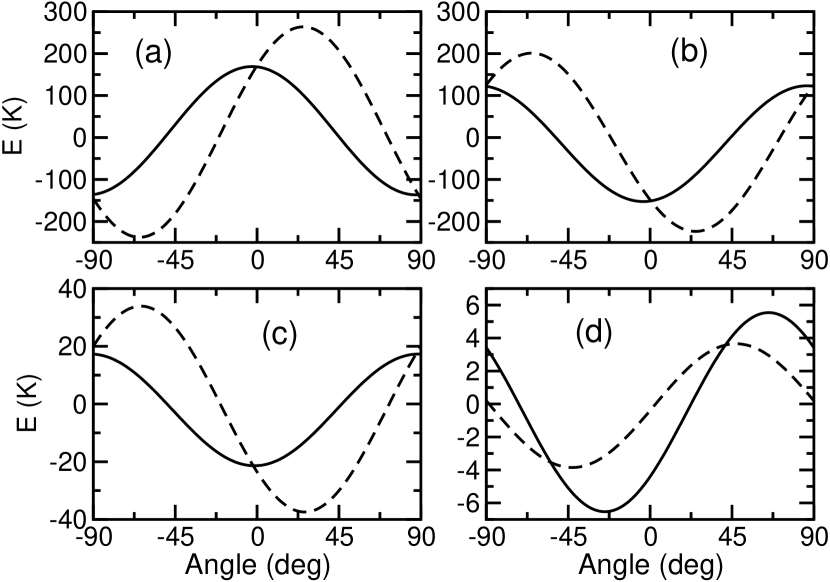
In Figs. 3 and 4 we present the results for the chosen example configurations for insulating and conducting cases, respectively. Also we show arithmetical averages over all nonequivalent configurations. Let us notice, however, that the results presented in the paper I indicate that even in the insulating case the pair of Mn ions in the supercell cannot be treated as isolated. Thus, strictly speaking, these arithmetical averages cannot be treated as the averages over the quenched disorder. Nevertheless, they give some information about behavior of MAE in macroscopic crystal where the magnetic ions are placed randomly.
In Figs. 3 and 4 we compare also MAE for nonrelaxed (continuous lines) and relaxed (broken lines) supercells. As in the case of single Mn ion in the supercell, the relaxation of the lattice leads to significant changes in MAE. For comparison, by the dotted lines we show MAE for nonrelaxed lattice with slightly different lattice parameters: Å, , . Like in paper I, for single Mn ion in the supercell, such changes result in changes of MAE.
The results for all configurations are summarized in Tables 1 and 2. The first column of each table gives configurations, in the second column there are corresponding weight factors . The factor is for a configuration which remains the same when reflected in the (-110) plane, and if there exist two nonequivalent configurations related by reflection in the (-110) plane. The coefficients and describe curves used to fitting the calculated points:
| (7) |
It turns out that inclusion of terms proportional to and to the fitting formula does not improve quality of the fit, because the coefficients describing these terms are more than order of magnitude smaller than and .
From the presented results we draw two main conclusions.
First, for a given pair configuration the direction of the easy axis of
magnetization, in general, is very different from [111] crystallographic
direction or the direction perpendicular to [111]. However, after the assumed
averaging procedure the average of the coefficient is very small, it
means that the average MAE possesses rhombohedral symmetry of the macroscopic
crystal. Similar behavior was previously observed in calculations of single ion
magnetic anisotropy in Sn1-xMnxTe [16] in which disorder effects were
taken into account.
Second, in most of cases the values of for pair
configurations are significantly larger than the average of coefficient
. This fact is also connected with varying directions
of the
easy axes of magnetization for different pair configurations.
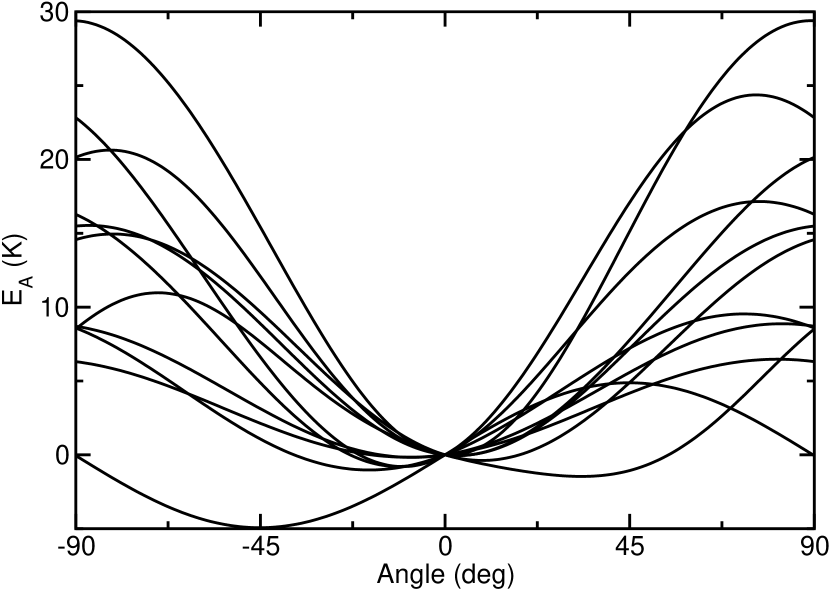
In Fig. 5 we show results for several randomly chosen configurations of three Mn ions in supercell. We are not able to perform calculations for all possible configurations because in this case the number of configurations is too large, however one may notice that the qualitative results are similar to the case of two Mn ions in the supercell.
Angular dependencies for the kinetic, electrostatic and exchange-correlation components of MAE are shown in Fig. 6. Their nonconstant angular dependencies prove that the spatial charge distribution varies with the Mn spin’s direction.
Two features may be noticed. First, the changes of kinetic, electrostatic and exchange-correlation energies with the direction of manganese spins are much larger than the changes of their sum, the magnetic anisotropy energy. However this is usual in DFT calculations - the dependence of components of the total energy on external parameters is much stronger than the dependence of the total energy itself. The other feature is more interesting. Let us notice that the maxima and minima of components are placed in different positions than the maxima and minima of MAE. This was not the case for single manganese ion in a supercell considered in the paper I where the maxima or minima for all curves were at the same positions. This shows, even more expressively than in the paper I, the close relationship between spin direction of manganese ions and the spatial distribution of electron charge. The changes of spatial charge density are caused by the spin-orbit interaction.
4 Conclusions
In this work, we theoretically analyzed the influence of chemical disorder on magnetic anisotropy in ferromagnetic Ge1-xMnxTe semiconductor layers known to undergo ferroelectric structural distortion of rhombohedral crystal lattice and exhibit perpendicular magnetic anisotropy. Using DFT method we determined the local crystal structure in Ge1-xMnxTe substitutional solid solution and calculated the single ion contribution to magnetic anisotropy energy. Our calculation revealed that the single ion contribution is order of magnitude smaller than the contribution originating from spin polarization induced by Mn ions into neighboring Te and Ge ions. This effect results from the hybridization of magnetic orbitals of Mn ions and valence band states of GeTe subject to spin-orbit interactions [3].
We also discussed magnetic anisotropy effects due to pairs of Mn ions differently allocated in the supercell and showed that the spatial averaging over the chemical disorder strongly reduces the strength of this magnetic anisotropy mechanism and restores the global rhombohedral symmetry of magnetic system.
Finally, the calculations show also that although in principle ab initio numerical methods may be applied to the calculations of MAE, in order to take into account disorder and make a direct quantitative comparison with experiment, much larger systems must be considered.
Acknowledgement
The authors acknowledge the support from NCN (Poland) research project no. UMO-2011/01/B/ST3/02486. This research was supported in part by PL-Grid Infrastructure.
References
- [1] R. T. Lechner, G. Springholz, M. Hassan, H. Groiss, R. Kirchschlager, J. Stangl, N. Hrauda, and G. Bauer, Appl. Phys. Lett. 97, 023101 (2010)
- [2] Y. Fukuma, T. Murakami, H. Asada, T. Koyanagi, Physica E 10, 273 (2001).
- [3] A. Łusakowski, P. Bogusławski, and T. Story, J. Phys. Condens. Matter 27, 226002 (2015)
- [4] W. Knoff, P. Dziawa, V. Osinniy, B. Taliashvili, V. Domukhovski, E. Łusakowska, K. Świątek, and T. Story, Mat. Sci. Poland 25, 295 (2007).
- [5] W. Knoff, K. Świątek, T. Andrearczyk, V. Domukhovski, P. Dziawa, L. Kowalczyk, E. Łusakowska, A. Siusys, B. Taliashvili, J. Wróbel, and T. Story, Phys. Stat. Sol. B 248, 1605 (2011).
- [6] Y. Fukuma, H. Asada, S. Miyawaki, T. Koyanagi, S. Senba, K. Goto, and H. Sato, Appl. Phys. Lett. 93, 252502 (2008).
- [7] H. Przybylińska, G. Springholz, R. T. Lechner, M. Hassan, M. Wegscheider, W. Jantsch, and G. Bauer, Phys. Rev. Lett. 112, 047202 (2014).
- [8] W. Knoff, A. Łusakowski, A. Wołoś, and T. Story, Acta Phys. Pol. A 127, 404 (2015)
- [9] A. Abragam and B. Bleaney Electron Paramagnetic Resonance of Transition Ions (Clarendon Press, Oxford 1970).
- [10] K. Yosida, and M. Tachiki, Progr. Theor. Phys. 17, 331 (1957).
- [11] R. R. Sharma, T. P. Das, and R. Orbach, Phys. Rev. 149, 257 (1966)
- [12] B. E. Larson, K. C. Hass, H. Ehrenreich, and A. E. Carlsson, Phys. Rev. B 37, 4137 (1988).
- [13] T. Dietl, C. Śliwa, G. Bauer, and H. Pascher, Phys. Rev. B 49, R2230 (1994).
- [14] P. Kacman, Semicond. Sci. Technol. 16, R25 (2001).
- [15] A. Łusakowski, and V. K. Dugaev, Phys. Rev. B 71, 014422 (2005).
- [16] A. Łusakowski, Solid State Comm. 137, 107 (2006).
- [17] A. Łusakowski, A. Jędrzejczak, M. Górska, V. Osinniy, M. Arciszewska, W. Dobrowolski, V. Domukhovski, B. Witkowska, T. Story, and R. R. Gałązka, Phys. Rev. B 65, 165206 (2002).
- [18] M. Kriechbaum, P. Kocevar, H. Pascher, and G. Bauer, IEEE J. Quantum Electron. 24, 1727 (1998).
- [19] J. Mašek, B. Velický, and V. Janiš, J. Phys. C 20, 59 (1987).
- [20] see http://www.openmx-square.org
- [21] W. A. Harrison, Electronic Structure and the Properties of Solids (San Francisco, CA: Freeman, 1980)