Study of X-ray emission from the old open cluster, M67
Abstract
We present an X-ray analysis of a 4 Gyr old open cluster, M67, using archival XMM-Newton data. The aim of this study was to find new X-ray members of M67, and to use the updated member list for studying X-ray variability, and derive the X-ray luminosity functions (XLFs) of different stellar types and compare them with other star clusters of similar age. We report the detection of X-ray emission from 25 members of M67, with membership based primarily on their proper motion, of which one X-ray source is a new member. Supplementing this study with previous ROSAT and Chandra studies of M67, and using the most recent proper motion study by Vereshchagin et al., we have compiled a revised list of X-ray emitting members of M67 consisting of 43 stars. Sixteen of these are known RS CVn type binaries having orbital periods 10 days, and near-circular orbits, 5 are contact binaries with orbital periods 6 hours, 5 are yellow and blue stragglers, 2 are Algol-type binaries, and one source is a cataclysmic variable. Fourteen members do not have any orbital information and cannot be classified. Fourteen of the X-ray sources detected do not have any optical counterpart down to a magnitude of , and their membership is uncertain. Finally, we report the X-ray luminosity functions of RS CVn type and other types of stars in M67 and compare them with other open clusters of intermediate-to-old age.
keywords:
stars : activity – binaries : general – stars : blue stragglers – open clusters and associations: individual: M67 – X-rays : binaries1 INTRODUCTION
Open clusters are useful for studying coeval and comoving populations of stars within the Galactic disk. X-ray studies of stars in open clusters offer an insight into their coronal activity and/or accretion phenomena. As clusters age, the spin down of stars causes X-ray emission to diminish in general, and thus, in the X-rays, revealing active coronae primarily from stars spun-up in binary systems (the age-rotation-activity correlation; e.g. Pallavicini, 1989; Randich, 1997; Gudel et al., 2004) or from systems undergoing accretion. Accordingly, X-rays from old (a few Gyr or older) open clusters are unique probes of magnetically active (RS CVn, BY Dra, W UMa, FK Com, Algol) and mass-transfer (CVs, L/HMXBs) binary systems within the Galactic disk (Belloni et al., 1998; Verbunt, 1999; van den Berg, 2013).
Past studies of old open clusters, NGC 6791 (8 Gyr; van den Berg et al., 2013), NGC 188 (6 Gyr; Belloni et al., 1998), and M67 (Belloni et al., 1993, 1998; van den Berg et al., 2004), reveal that RS CVns, CVs, and sub-giant stars dominate the X-ray emission, while peculiar objects such as blue and yellow stragglers are rare and thus do not contribute much.
M67 is a 4.20.6 Gyr-old open cluster at 85030 pc having a small reddening value (E) (Sarajedini et al., 1999; Yadav et al., 2008). On account of the extensive optical data available for M67, this cluster is well suited for study in X-rays. Proper-motion studies of M67 to establish cluster membership have been carried out by several groups (Sanders, 1977; Girard et al., 1989; Zhao et al., 1993; Yadav et al., 2008; Vereshchagin et al., 2014). In this paper we use cluster membership information from Vereshchagin et al. (2014), a revised version of the Yadav et al. (2008) catalog reaching down to V22 mag, containing 659 members. Two published X-rays studies of M67 exist. Belloni et al. (1993, 1998) presented ROSAT PSPC observations covering 0.5 deg2 of the M67 field, while van den Berg et al. (2004) analyzed Chandra ACIS observations covering 0.1 deg2 but with a limiting flux of about 40 times lower than the ROSAT observations.
Here, we present the results of two XMM-Newton observations of M67 having fields of view and limiting flux intermediate to that afforded by the ROSAT and Chandra observations. The paper is organised as follows. In Section 2, we discuss the X-ray data and processing. The optical, ROSAT and Chandra counterparts of our X-ray sources are given in Section 3. The spectral hardness and variability analysis is in Section 4. Section 5 gives notes on individual classes of X-ray sources, and we conclude with a discussion in Section 6.
2 ARCHIVAL DATA AND DATA PROCESSING
2.1 X-ray Data
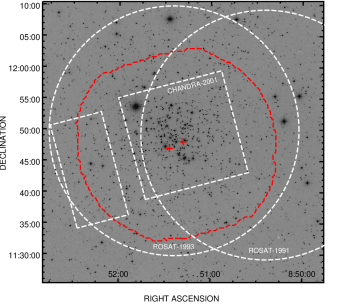
We used archival data from two observations of M67 from the XMM-Newton Science Archive (XSA). Observation with ID 0109461001 was carried out in 2001 and ID 0212080601 in 2005. For both the observations, we used the European Photon Imaging Camera (EPIC, consisting of two MOS and one PN CCD arrays; Jansen, 2001; Strüder et al., 2001; Turner et al., 2001). The first observation used the thin filter while the second observation used the thick filter. Data were acquired in the full frame mode in both the cases. The observation details are given in Table 1. The merged XMM-Newton footprint for the two M67 observations is shown in Figure 1. The footprints of the previously published ROSAT and Chandra observations of M67 are also shown. Although the 3XMM pipeline products (Watson et al. 2014, in prep) are available, we manually reduced and inspected the data to use the latest calibration files and a better control over the filtering, reduction and source selection process. We downloaded Observation data files (ODFs) from the XSA for further processing.
| Obs ID | 0109461001 | 0212080601 |
|---|---|---|
| Coordinates | 08:51:26.99 11:46: 58.0 | 08:51:18.00 11:48:02.6 |
| Start time (UT) | 20 Nov 2001 23:56:16 | 08 May 2005 18:23:17 |
| Stop time (UT) | 21 Nov 2001 02:43:07 | 08 May 2005 22:23:28 |
| Usable time (MOS1,MOS2,PN; ks) | 9.42,9.42,6.80 | 5.70,5.70,5.70 |
| Fiter, EPIC mode | Thin, Full frame | Medium, Full frame |
2.2 Data Processing
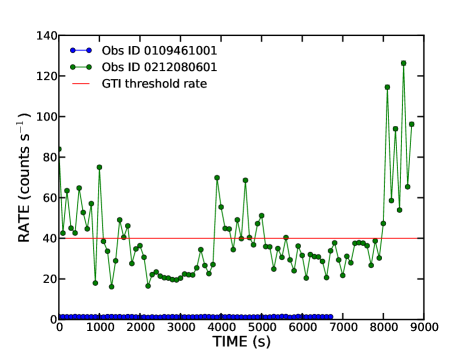
The raw data were processed with the SAS 13.5.0 and HEASoft 15.1 packages using the procedure outlined in the XMM ABC and XMM SAS guidebooks. In brief, we (i) generated the calibration information file using cifbuild task and downloaded the relevant calibration files from the XMM calibration archive, (ii) ran odfingest to compile housekeeping information on the ODFs, (iii) applied the calibration with the emchain and epchain tasks, (iv) filtered the MOS and PN event lists by selecting only the good events ( and respectively). We then inspected the PN light curve for photons with energies 10 keV and found no evidence for soft-proton flaring in the ID 0109461001, but ID 0212080601 was contaminated by a significant flaring. To mitigate the flaring background in ID 0212080601, we chose a good time interval (GTI) where the PN countrate for energies 10 keV was more than 40 counts s-1. The 10 keV PN light curves for ID 0109461001 and ID 0212080601 along with the GTI countrate threshold for the latter are shown in Figure 2. Using the GTI removes a large fraction of the major flaring events and reduces the background in the image by a factor of four. Note that the countrate threshold chosen for GTI is much larger than the standard 0.4 counts s-1, but is acceptable for the detection of point sources.
2.3 X-ray Images
We produced images in three energy bands, a soft () band (0.2 – 0.5 keV), a medium () band (0.5 – 2.0 keV) and a hard () band (2.0 – 7.0 keV) band, for all three EPIC detectors using the evselect and emosaic tasks with the filtered MOS and PN event lists from §2.2 as input. Total energy band (0.2 – 7.0 keV) images for each detector were also produced. Although XMM-Newton is sensitive up to 10 keV, we restricted our images to 7 keV in order to enable easy comparison with the Chandra observation of M67 (van den Berg et al., 2004). During the imaging process, only events with (i) the keyword set to zero, (ii) keyword less than or equal to 4 for PN and (iii) keyword equal to zero for PN in the soft band were selected. The motivation for the latter is mainly the rejection of noise at the extremities of the PN detector along the detector Y-direction. This stricter requirement for for PN in the soft band is also implemented in the 2XMM catalog (Watson et al., 2009), for example. Image binning was so chosen as to produce 600600 pixel 4.35″pix-1 images.
2.4 SOURCE DETECTION
We used the edetect_chain script to simultaneously search for sources in the nine images (3 bands 3 detectors) for each observation. The subroutine edetect_chain calls a series of tasks sequentially: (i) expmap to the calculate the exposure map for the input images using the attitude, vignetting, exposure, bad pixel information, (ii) emask produced a detector mask based on the exposure, (iii) eboxdetect was used in local mode to search for sources above a maximum likelihood (ML) of 5 simultaneously in all the input images in 55 pix boxes (pixels surrounding the boxes are used for background estimation), (iv) esplinemap removed the sources detected by eboxdetect from the input images to produce smoothed background maps through spline fits to the residual images, (v) eboxdetect was used in the map mode to find sources similar to the earlier eboxdetect call, except this time the background map was used, (vi) emldetect used the source locations from map mode eboxdetect to perform simultaneous ML point-spread function fits (Cruddace et al., 1988) to all input images and determine source parameters such as total counts, countrate, hardness ratios, etc. For emldetect we specified a ML detection threshold of six (similar to the 2XMM catalog; this corresponds to a 0.2% probability for Poissonian noise fluctuation to have caused the observed source counts). The hardness ratios (discussed in detail in §4.1) were calculated for the detected sources based on their countrate in different bands, and these are especially useful for characterising weak sources for which spectral analysis was not possible.
We combined the single-band and single-detector images into a single mosaic image using the emosaic task, for each observation. We inspected the mosaics by eye and further used the hardness ratios of detected sources as well as the knowledge of their optical counterparts to reject one false positive in ID 0109461001 from the emldetect source list. Seventy two (72) sources are thus detected in ID 0109461001 and 32 in ID 0212080601. Twenty nine sources are common between the two observations and three are unique detections in ID 0212080601. The conversion of count rates to fluxes is described in §4. The minimum 0.2–7 keV flux of detected sources in the two observations is and erg cm-2 s-1 respectively. These correspond to X-ray luminosities of and erg s-1 respectively at the assumed distance of 850 pc to M67. The images in the total energy band were subjected to esensmap to find the median count rate corresponding to likelihood threshold of six. Converting these to fluxes we get the median flux detection thresholds of and erg cm-2 s-1 in the 0.2–7.0 keV energy range for ID 0109461001 and ID 0212080601 respectively. Our final X-ray source catalog is given in Table 2, which gives source parameters for the PN detector with count rates and total counts in the 0.2 – 7.0 keV band. The 1 source position uncertainties range between 0.5″and 4.0″, the median uncertainty being 1.5″.
| (1) | (2) | (3) | (4) | (5) | (6) | (7) | (8) | (9) | (10) | (11) | (12) | (13) | (14) | |
| NX | counts | ctr | HR | RX | CX | V | Mem | Identification | ||||||
| (h,m,s) | (∘,′,″) | (c ks-1) | HR1 | HR2 | (mag) | (mag) | (″) | |||||||
| Sources Detected in Obs ID 0109461001 | ||||||||||||||
| 1 | 08:51:23.22 | +11:48:25.9 | 0.4 | 291(19) | 51(3) | 11 | 5 | 14.32 | 0.71 | 1.6 | Y | E1740 | ||
| 2 | 08:51:38.40 | +11:49:05.4 | 0.5 | 286(18) | 53(3) | 2 | 20.79 | 0.15 | 1.2 | n | E510; Gal,z0.6 | |||
| 3 | 08:50:57.09 | +11:46:07.6 | 0.5 | 208(19) | 94(8) | 15 | 4 | 23.27 | 1.36 | 0.2 | n | SDSSJ0850.95; AGN2,z0.5 | ||
| 4 | 08:51:13.30 | +11:51:39.5 | 0.6 | 169(14) | 37(3) | 8 | 1 | 13.57 | 1.01 | 1.6 | Y | E1708 | ||
| 5 | 08:51:23.78 | +11:49:49.3 | 0.5 | 151(13) | 28(2) | 10 | 6 | 11.44 | 0.90 | 0.1 | Y | Y1289 | ||
| 6a | 08:51:18.64 | +11:47:02.5 | 0.6 | 125(12) | 14(1) | 13 | 9 | 12.67 | 0.74 | 1.1 | Y | E1726 | ||
| 7 | 08:51:28.30 | +11:41:27.4 | 0.7 | 123(12) | 26(2) | 12 | 22.40 | 0.12 | 1.6 | N | E2024 | |||
| 8 | 08:51:07.21 | +11:53:02.0 | 0.6 | 118(16) | 53(7) | 7 | 10 | 12.68 | 0.69 | 0.7 | Y | E1687 | ||
| 9 | 08:51:51.35 | +11:35:47.5 | 0.8 | 72(10) | 28(3) | 59 | 20.99 | 0.66 | 2.0 | n | E1907; QSO1 | |||
| 10 | 08:51:37.79 | +11:50:56.6 | 0.8 | 68(9) | 13(1) | 40 | 16 | 13.64 | 0.45 | 1.4 | y | E1791; AH Cnc (F7V) | ||
| 11 | 08:51:49.93 | +11:49:52.0 | 0.9 | 67(9) | 14(2) | 43 | 20 | 20.98 | -0.05 | 0.9 | N | E2757 | ||
| 12 | 08:50:52.70 | +11:47:44.4 | 1.1 | 62(9) | 19(2) | 49 | 21 | 21.86 | 0.27 | 1.4 | n | E2183; AGN2 | ||
| 13 | 08:51:33.02 | +11:34:11.9 | 1.3 | 62(9) | 26(4) | 60 | 21.03 | 0.56 | 1.7 | n | E2593; Gal | |||
| 14 | 08:51:04.52 | +11:55:28.1 | 0.8 | 61(9) | 20(3) | 34 | 14 | 21.99 | 0.81 | 3.1 | n | E2823; Gal | ||
| 15 | 08:50:37.97 | +11:47:09.3 | 1.2 | 54(9) | 24(3) | 12 | 22.94 | 2.01 | 2.3 | n | SDSSJ0850.63; AGN2 | |||
| 16 | 08:51:21.63 | +11:52:37.5 | 0.9 | 52(8) | 11(1) | 37 | 24 | 11.26 | 0.66 | 1.9 | Y | Y1476 | ||
| 17 | 08:52:16.79 | +11:48:31.0 | 1.1 | 50(8) | 20(3) | 47 | 7 | 14.44 | 0.80 | 1.3 | Y | E1857 | ||
| 18 | 08:51:03.86 | +11:46:29.4 | 1.6 | 50(11) | 20(4) | 14 | 13 | 21.21 | 0.36 | 1.0 | N | E2153 | ||
| 19a | 08:51:37.27 | +11:59:02.5 | 1.1 | 49(8) | 12(2) | 31 | 11.62 | 0.06 | 1.3 | N | E1787 | |||
| 20 | 08:51:28.12 | +11:49:26.6 | 0.9 | 48(8) | 8(1) | 45 | 19 | 12.84 | 0.41 | 1.4 | Y | E1756 | ||
| 21 | 08:51:04.76 | +11:45:56.3 | 1.1 | 47(8) | 12(2) | 23 | 13.58 | 0.51 | 1.6 | Y | E1569 | |||
| 22 | 08:51:17.71 | +11:44:30.4 | 1.4 | 43(7) | 8(1) | 17 | 15 | 15.49 | 0.84 | 0.8 | Y | E1175 | ||
| 23 | 08:51:46.08 | +11:49:49.9 | 0.9 | 42(7) | 9(1) | 22 | 22.12 | 1.20 | 1.3 | n | E2756; Gal | |||
| 24 | 08:51:50.15 | +11:46:05.9 | 1.4 | 41(7) | 8(1) | 52 | 47 | 10.70 | 0.96 | 1.3 | N! | Y892 | ||
| 25 | 08:52:13.52 | +11:46:21.1 | 1.7 | 39(8) | 13(2) | 51 | 21.95 | 0.50 | 1.2 | N | E2147 | |||
| 26 | 08:51:46.56 | +11:52:01.7 | 1.2 | 36(7) | 8(1) | 33 | 20.74 | 0.18 | 1.4 | N | E600 | |||
| 27 | 08:51:07.92 | +11:49:54.4 | 1.2 | 33(7) | 7(1) | 42 | 17 | 15.68 | 0.86 | 2.5 | Y | E2759 | ||
| 28 | 08:52:10.42 | +11:47:12.7 | 1.6 | 33(7) | 10(2) | 22.08 | 0.10 | 2.4 | n | E2722; Gal | ||||
| 29 | 08:51:19.59 | +11:52:10.5 | 1.2 | 32(10) | 12(3) | 38 | 48 | 14.00 | 0.60 | 2.0 | y | E1732; HX Cnc (G1V) | ||
| 30 | 08:50:54.97 | +11:56:50.3 | 1.5 | 28(6) | 11(2) | 58 | 15.90 | 1.04 | 0.7 | Y | E763 | |||
| 31 | 08:52:07.40 | +11:52:07.1 | 1.4 | 27(6) | 8(2) | 21.30 | 0.77 | 0.6 | n | E2952; Fore* (M7V) | ||||
| 32 | 08:51:35.76 | +11:47:59.7 | 1.1 | 25(6) | 4(1) | 48 | 31 | 22.38 | 0.34 | 1.7 | n | E2190; Gal | ||
| 33 | 08:51:36.03 | +11:46:31.9 | 1.4 | 25(6) | 4(1) | 50 | 49 | 12.79 | 0.63 | 2.0 | Y | E1784 | ||
| 34 | 08:50:58.74 | +11:51:36.3 | 1.4 | 25(6) | 7(1) | 39 | 32 | 20.07 | 0.23 | 3.1 | N | E1268 | ||
| 35 | 08:51:30.61 | +11:50:45.6 | 1.7 | 24(6) | 4(1) | 29 | ||||||||
| 36 | 08:51:31.43 | +11:45:50.8 | 1.6 | 24(11) | 10(5) | 53 | 36 | 12.74 | 0.50 | 2.4 | Y | E1581 | ||
| 37 | 08:51:20.83 | +11:53:27.2 | 1.7 | 24(9) | 13(5) | 4 | 3 | 0.8 | N! | E3205 | ||||
| 38 | 08:51:52.93 | +11:36:54.7 | 1.5 | 24(6) | 8(2) | 21.91 | 0.85 | 2.0 | N | E1929 | ||||
| 39 | 08:52:07.44 | +11:41:13.2 | 1.2 | 24(6) | 8(2) | 55 | 21.52 | 0.15 | 1.8 | N | E2018 | |||
| 40 | 08:51:11.60 | +11:50:29.5 | 1.5 | 23(6) | 5(1) | |||||||||
| 41 | 08:51:30.47 | +11:33:39.8 | 1.8 | 23(6) | 10(2) | 22.07 | 0.00 | 2.4 | n | E1866; AGN1 | ||||
| 42 | 08:51:27.27 | +11:46:55.1 | 1.5 | 23(6) | 3(1) | 16 | 57 | 21.75 | 0.18 | 2.3 | N! | E2164, EU Cnc | ||
| 43 | 08:51:04.66 | +11:42:19.3 | 2.2 | 22(6) | 6(1) | |||||||||
| 44 | 08:51:27.13 | +11:45:02.4 | 1.3 | 22(7) | 5(1) | 22.83 | 3.9 | n | E3674; Gal | |||||
| 45 | 08:51:24.69 | +11:48:59.8 | 2.4 | 22(7) | 3(1) | 46 | 13.24 | 0.60 | 3.9 | Y | Y1212 | |||
| 46 | 08:51:16.99 | +11:48:22.8 | 2.2 | 20(6) | 3(1) | |||||||||
| 47 | 08:50:32.58 | +11:53:54.3 | 3.1 | 20(6) | 10(3) | |||||||||
| 48 | 08:50:57.55 | +11:52:55.2 | 1.8 | 19(5) | 6(1) | 36 | ||||||||
| 49 | 08:51:09.00 | +11:50:44.4 | 1.6 | 19(5) | 4(1) | 39 | 20.62 | 1.40 | 1.6 | n | SDSSJ0851.14; Gal,z0.4 | |||
| 50 | 08:51:06.38 | +11:37:53.5 | 1.4 | 19(6) | 19(7) | 20.36 | 0.27 | 2.3 | N | E111 | ||||
| 51 | 08:51:57.78 | +11:45:46.1 | 1.8 | 18(5) | 4(1) | 15.59 | 0.71 | 1.6 | N | E1189 | ||||
| 52 | 08:50:53.19 | +11:59:24.6 | 2.6 | 17(5) | 9(3) | 22.17 | 0.00 | 2.6 | n | E2436; QSO1,z1 | ||||
| 53 | 08:51:26.71 | +11:56:10.5 | 1.8 | 16(5) | 5(1) | 61 | 15.90 | 1.07 | 2.0 | N! | E742 | |||
| 54 | 08:51:27.02 | +11:55:23.9 | 1.5 | 15(5) | 4(1) | 32 | 8 | 23.46 | 2.36 | 1.2 | n | SDSSJ0851.45; AGN2,z0.8 | ||
| 55 | 08:51:44.01 | +11:48:49.7 | 1.8 | 15(5) | 3(1) | 70 | 22.79 | 0.03 | 0.9 | n | E2208; Gal | |||
| 56 | 08:51:36.30 | +11:44:43.8 | 2.3 | 15(5) | 3(1) | 40 | ||||||||
| 57 | 08:52:05.18 | +11:50:42.9 | 2.4 | 14(5) | 4(1) | |||||||||
| 58 | 08:51:38.40 | +11:54:13.8 | 2.2 | 14(5) | 3(1) | 71,149 | 21.42 | 0.57 | 0.9 | N | E2807 | |||
| 59 | 08:50:56.41 | +11:37:31.2 | 1.4 | 14(5) | 6(2) | 22.31 | 2.3 | n | E3586; QSO2,z0.7 | |||||
| 60 | 08:51:47.73 | +11:39:54.6 | 3.3 | 14(5) | 4(1) | |||||||||
| 61 | 08:51:38.72 | +11:58:21.3 | 2.3 | 13(4) | 4(1) | |||||||||
| 62 | 08:51:04.43 | +11:41:51.6 | 1.9 | 12(4) | 3(1) | 54 | 19.36 | 1.66 | 2.5 | Y | E1498 | |||
| 63 | 08:51:01.48 | +11:49:26.9 | 2.1 | 12(4) | 3(1) | 44 | 68 | 14.82 | 0.72 | 1.9 | N | E520 | ||
| 64 | 08:51:18.20 | +11:50:15.3 | 2.5 | 11(4) | 2(1) | 41 | 104 | 14.41 | 0.61 | 4.8 | Y | E1723 | ||
| 65 | 08:51:42.75 | +11:34:08.8 | 2.5 | 10(4) | 5(2) | 1.6 | n | E3280; AGN2,z0.3 | ||||||
| 66a | 08:52:10.06 | +11:55:28.1 | 1.6 | 10(5) | 8(4) | 33 | 17.24 | 1.73 | 1.1 | n | E721; Fore* (M7V) | |||
| 67 | 08:51:25.87 | +11:59:33.2 | 1.7 | 9(4) | 5(2) | n | AGN2? | |||||||
| 68 | 08:51:25.06 | +11:57:48.4 | 4.2 | 9(4) | 3(2) | |||||||||
| 69a | 08:51:26.29 | +11:37:06.3 | 2.6 | 9(3) | 1(0) | |||||||||
| 70a | 08:50:56.52 | +11:45:21.9 | 2.8 | 7(4) | 1(0) | 24 | 53 | 20.27 | 0.34 | 1.1 | N | E362 | ||
| 71 | 08:52:06.51 | +11:53:24.4 | 2.9 | 4(3) | 1(1) | |||||||||
| 72a | 08:52:17.03 | +11:41:11.3 | 2.9 | 4(3) | 1(1) | 56 | 16.85 | 1.81 | 2.1 | N | E207 | |||
| New Sources Detected in Obs ID 0212080601 | ||||||||||||||
| 73 | 08:50:36.96 | +11:54:05.8 | 1.6 | 31(9) | 19(6) | 35 | 14.49 | 0.78 | 1.2 | Y | E1475 | |||
| 74a | 08:51:28.80 | +11:48:07.9 | 1.7 | 22(7) | 4(1) | 41 | ||||||||
| 75 | 08:50:58.56 | +11:48:05.0 | 1.9 | 17(9) | 4(2) | 15.81 | 0.80 | 2.2 | Y | E4630 | ||||
3 IDENTIFICATION OF X-RAY SOURCES
In order to identify the X-ray sources found in both XMM-Newton observations of M67 with known classes of astronomical sources, we searched for optical and previously known X-ray counterparts. Information from SIMBAD and infrared data from WISE were used as necessary in order to accurately classify sources (especially in case of AGN or foreground stars). All identifications were checked by eye. Counterparts from Yadav et al. (2008) were used to establish membership probabilities. Below, we describe the identification process, and give simple estimates of chance identification and expected background X-ray sources.
3.1 X-ray Counterparts from ROSAT and Chandra
Previous observations with ROSAT (Belloni et al., 1993, 1998) and Chandra (van den Berg et al., 2004) were with flux detection thresholds of and respectively (see Figure 1 for coverage). A comparison of our X-ray sources with those in the published catalogs, shows that, out of 61 X-ray sources detected by Belloni et al. (1998) with the ROSAT PSPC, 44 are in the XMM field of view (fov), of which, 40 have one XMM counterpart within the positional error. van den Berg et al. (2004) detected 158 X-ray sources using the Chandra ACIS-I and ACIS-S detectors, of which 153 Chandra sources lie within the XMM fov, and 41 of these have a probable XMM counterpart. The X-ray counterparts are listed in column (8) and (9) of Table 2.
3.2 Optical Counterparts
The most comprehensive and sensitive survey of M67 is the ESO Imaging Survey Pre-FLAMES (EIS; Momany et al., 2001), which contains objects with V. We cross-matched our X-ray source list with the EIS catalog to find optical counterparts. The error in the optical source positions was taken to be , and this was added in quadrature to the X-ray source ’ position uncertainties. This procedure gave unique EIS counterparts for 50 XMM sources. For sources absent in EIS, we searched for matches in the SDSS and Yadav et al. (2008) catalogs, thus finding 6 additional sources with optical counterparts. In this paper we refer to the EIS and Yadav et al. sources with the prefixes ’E’ and ’Y’ respectively, e.g. the optical counterparts of NX1 and NX5 are E1740 and Y1289 respectively. The optical counterparts, their V magnitudes, colors and the distance between the X-ray source and the optical counterparts are listed in columns (14), (10), (11), and (12) of Table 2 respectively. Optical magnitudes and/or colors unavailable in the EIS or Yadav et al. catalogs were estimated from other catalogs in VizieR Catalog Service111http://vizier.u-strasbg.fr/, wherever applicable. For SDSS counterparts, we converted u,g,r magnitudes to magnitudes and colors using the transformations for stars from Jester (2005)222http://www.sdss.org/dr4/algorithms/sdssUBVRITransform.html. Fourteen of our X-ray sources do not have an optical counterpart.
3.3 Members of M67 and Source Classification
There are several published proper motion membership studies for M67. Sanders (1977); Girard et al. (1989); Zhao et al. (1993) used photographic plates and are limited to stars with V16. Yadav et al. (2008) calculated the proper motion membership probabilities for 2400 stars towards M67 having V22.5. Recently, Vereshchagin et al. (2014) presented a revised list of M67 members among Yadav et al. sources using the convergent point method. We cross-matched our X-ray sources with Yadav et al. catalog and found 38 matches. For these sources, we obtained the membership information from Vereshchagin et al., thus finding 19 members and 19 non-members. Among the sources lacking a counterpart in Yadav et al., we searched for membership information in Girard et al. to get two additional members. Note that for sources present in both, Yadav et al. and Girard et al., we give precedence to the former. For sources listed as non-members in Vereshchagin et al. (2014) that have % probability in both, Yadav et al. and Girard et al. catalogs, we used the binarity and photometric information of the optical counterparts to argue membership, wherever applicable. Two X-ray sources, NX24 (Y892) and NX42 (EU Cnc), found to be non-members in Vereshchagin et al. (2014) and Yadav et al., have been reclassified as members of M67 based on archival photometric information and evidence from literature. In total, we have detected 25 X-ray members of M67.
We classified the remaining 35 sources as AGN, quasar, galaxy, or foreground/background stars based on multiwavelength spectral energy distributions using photometry from the SDSS, WISE, 2MASS and NOMAD catalogs. The membership information for sources having an optical counterpart is given in column (13) of Table 2.
Since the membership of X-ray sources found by Belloni et al. (1998) and van den Berg et al. (2004) was based primarily on the work by Girard et al. (1989), we considered cross-matching their X-ray catalogs with Yadav et al. (2008), and looking at the membership of the corresponding source as given by Vereshchagin et al. (2014). Among the X-ray sources from Belloni et al. stated as non-members or sources without membership probability, we accept four (RX47=NX17=CX7; RX17=NX22=CX15; RX42=CX17; RX35=NX73) as members, and among their proposed members, we reject four (RX43=NX11=CX20; RX44=NX63=CX68 is a galaxy; RX49=NX12=CX21 is a type-2 AGN; RX19). Note that CX20 (quasar) and CX68 were already classified as non-members by van den Berg et al. (2004). One source having unknown membership probability (RX54=NX62) in Belloni et al., has been classified as a member based on new proper motion information. Similarly, RX23 is found to be a non-member.
Among the Chandra X-ray sources (van den Berg et al., 2004) classified as probable non-members, we accept the following three as members based on their proper motion: 1. CX7=NX17=RX47 listed as a W UMa-type binary in SIMBAD; 2. CX15=NX22=RX17 is a known binary with circularised 1.2-day orbit; and 3. the unclassified source CX17=NX27=RX42). Twelve sources close to the M67 main sequence were accepted as probable members by van den Berg et al.. Among these, we accept eight sources as true members of M67. These are: (1) CX58=NX30 is listed as RS CVn in SIMBAD, and a known binary with a 3.6-day period, (2) CX61=NX53 with 75% proper motion membership probability in Yadav et al. (2008), and listed as a non-member in Vereshchagin et al. (2014), is a W UMa-type binary with period 0.27 days, has a photometric parallax distance of 820 pc, and lies along the M67 main sequence, (3–5) CX62, CX77, and CX82 are members in Yadav et al. and Vereshchagin et al. with a high probability, (6–7) CX73, an M3V star, and CX76, a K7V star have estimated distances of 950 pc based on SDSS and WISE photometry. CX73 has a counterpart in Yadav et al., where it has a proper motion membership probability of 48%, but it is listed as a non-member in Vereshchagin et al. (2014). However, the hardness ratios of this source in the Chandra source catalog (Evans et al., 2010) are consistent with that of an active star. CX76 has no counterpart in Yadav et al., (8) CX80 is a member of M67 in Yadav et al. and Vereshchagin et al.. Compared to the typical uncertainty in the Chandra X-ray source positions, the optical counterparts of CX73 and CX80 are quite far away (4″). This could be attributed to the large off-axis distance of the location where these sources were detected on the ACIS CCD. We reject the membership of the remaining four sources (CX117, CX129, CX141, and CX153) due to their very small membership probabilities in Yadav et al., and their classification as non-members in Vereshchagin et al..
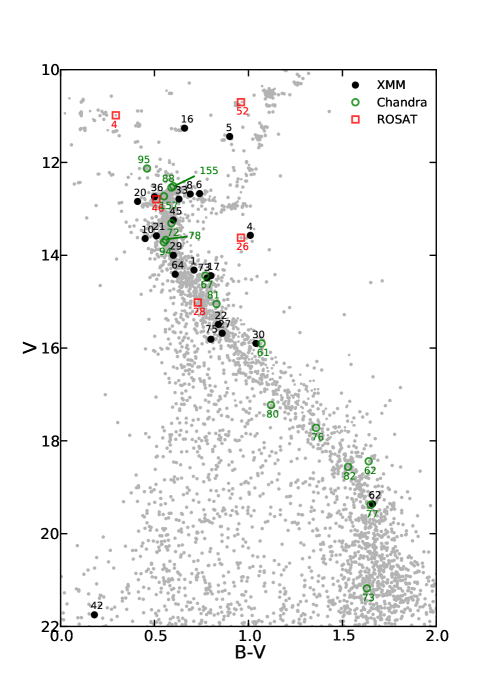
A compilation of the spectral and orbital parameters and X-ray luminosities for all the 43 members of M67 detected as X-ray sources to date is given in Table 3. Here, we list the optical counterparts, the spectral types (from SIMBAD, VizieR, van den Berg et al., 2000, or estimated from archival multiwavelength photometry), X-ray luminosity from our work or van den Berg et al. (2004) or Belloni et al. (1998) (in that order of preference), the orbital periods and ellipticities (from van den Berg et al. (2000, 2004) or VizieR), and the source types (from van den Berg et al. (2004) or SIMBAD). Note that the luminosities for sources detected in the XMM-Newton observations are quoted for the 0.2–7 keV energy band, and those from van den Berg et al. are for the 0.3–7 keV energy band, while luminosities of Belloni et al. sources were calculated using the ROSAT PSPC count rate converted to flux in the 0.2–7 keV energy band assuming an APEC 1.5 keV plasma model. The orbital periods and eccentricities have been reproduced from van den Berg et al. (2000, 2004). For all known X-ray members of M67, we plot the color-magnitude diagram in Figure 3.
| (1) | (2) | (3) | (4) | (5) | (6) | (7) | (8) | (9) |
| NX | RX | CX | opt | SpT | /1030 | comments | ||
| (erg s-1) | (d) | |||||||
| Members from This Work | ||||||||
| 1 | 11 | 5 | E1740 | G0V | 1.36 | 0 | RS CVn | |
| 4 | 8 | 1 | HU Cnc | G8IV | 18.40 | 0.21 | SGB,RS CVn | |
| 5 | 10 | 6 | Y1289 | G4III | 42.83 | 0 | III+WD,YS | |
| 6 | 13 | 9 | HW Cnc | G4V | 10.06 | 0 | RS CVn | |
| 8 | 7 | 10 | HT Cnc | F9V | 1.36 | 0.10 | RS CVn | |
| 10 | 40 | 16 | AH Cnc | F7V | 0.36 | Ecl W UMa | ||
| 16 | 37 | 24 | Y1476 | G3III-IV | 1495 | 0.32 | SB,YS | |
| 17 | 47 | 7 | LN Cnc | 0.54 | Ecl W UMa | |||
| 20 | 45 | 19 | EV Cnc | F3 | 0.44 | W UMa | ||
| 21 | 23 | HS Cnc | F9V | 0.36 | W UMa | |||
| 22 | 17 | 15 | E1175 | G9V | 1.17 | 0 | RS CVn | |
| 27 | 42 | 17 | E2759 | G6V | RS CVn? | |||
| 29 | 38 | 48 | HX Cnc | G1V | 2.66 | 0 | RS CVn | |
| 30 | 58 | HR Cnc | 3.58 | RS CVn | ||||
| 33 | 50 | 49 | E1784 | G1V | 31.78 | 0.66 | SB | |
| 36 | 53 | 36 | E1581 | F9V | 4.36 | 0.0 | RS CVn,triple | |
| 42 | 16 | 57 | EU Cnc | M5V | 0.09 | 0 | CV, AM Her-type | |
| 45 | 46 | Y1212 | G0V | |||||
| 62 | 54 | E1498 | ||||||
| 64 | 41 | 104 | E1723 | F9V | var | RS CVn? | ||
| 73 | 35 | E1475 | G8V | CV? | ||||
| 75 | E4630 | K5V | ||||||
| Members from Belloni et al. (1998) | ||||||||
| 37 | 4 | 3 | ES Cnc | F5IV | 1.07 | Algol | ||
| 26 | AG Cnc | 6.1 | 2.82 | 0 | RS CVn | |||
| 28 | HY Cnc | G6V | 2.1 | 2.65 | RS CVn | |||
| 46 | 111 | E1589 | F7IV | 0.08 | 7.16 | 0 | RS CVn | |
| 24 | 52 | 47 | Y892 | G8III-IV | 698 | 0.11 | RGB,YS | |
| Members from van den Berg et al. (2004) | ||||||||
| 53 | 61 | ET Cnc | G4V | 0.27 | WU | |||
| 62 | E683 | 0.40 | ||||||
| 67 | E1781 | G4V | 0.36 | binary | ||||
| 72 | E1677 | G0V | 0.16 | 5.7 | RS CVn | |||
| 73 | E2650 | M3V | 0.46 | |||||
| 76 | E1720 | K7V | 0.21 | binary | ||||
| 77 | E394 | 0.23 | binary | |||||
| 78 | E1730 | F9V | 0.30 | 5.95 | 0 | RS CVn | ||
| 80 | E2650 | M3V | 0.20 | |||||
| 81 | E429 | G5V | 0.12 | 6.7 | RS CVn | |||
| 82 | E1208 | 0.16 | ||||||
| 88 | E1729 | 0.09 | 7.65 | 0 | RS CVn | |||
| 94 | E1777 | F8V | 0.16 | binary | ||||
| 95 | E1590 | F6V | 0.12 | 4913 | 0.34 | BS | ||
| 155 | E2983 | F7V | 0.04 | 11.02 | 0.26 | SB,RS CVn | ||
| 157 | HV Cnc | F0V+M1V | 0.02 | 10.34 | 0 | Ecl Algol,triple | ||
| Notes: (a) The countrates and hence the luminosity values from Belloni et al. (1998) and van den Berg et al. (2004) do not have associated uncertainties. (b) Some of the known binaries but do not have an orbital / period solution. (c) The orbital parameters are from Mathieu (1990), Latham et al. (1992), van den Berg et al. (2000), and from unpublished work by D. Latham, R. Mathieu et al. | ||||||||
3.4 Chance Identification
We estimated the probability of identifying an XMM–Newton source with an optical counterpart by chance using a procedure similar to the one adopted by van den Berg et al. (2004). This chance identification probability is a function of the positional uncertainty of the X-ray sources () and the surface density of optical sources in the M67 field. We calculated the mean positional uncertainty of the XMM–Newton sources, ″, and the number of EIS sources inside the fov, N3035. We used a circle with radius equal to the quadratic sum of and the error in the optical positions, 1″, to calculate the search area around an X-ray source. Therefore, the probability that a randomly placed error circle includes an EIS-source is . Here, the area of the fov (red curve in Figure 1) is denoted as approximated by a circle with radius 16′. Thus, for the 75 X-ray sources that we have considered here (Table 2), the probability of 0, 1 or 2 chance identifications with EIS-sources is 42%, 37% and, 16% respectively. Similarly, we calculated the probability for the chance identification of our X-ray sources with M67 proper motion members to be 87%, 12%, and 1% respectively. We therefore conclude that one or two XMM–Newton sources have been falsely identified with optical counterparts while our M67 X-ray members are all likely to be genuine. Another way of finding the chance identification probability is to note that among the 50 sources in van den Berg et al. (2004) having X-ray fluxes greater than the flux threshold of the XMM observations (610-15 erg cm-2 s-1, corresponding to a Chandra count rate of 1 count ks-1), about 40 have an optical counterpart. We can then ask the question: given the probability of finding an optical source counterpart for an X-ray source as 0.8, what is the probability of finding counterparts to 62 XMM sources out of 75? Considering binomial distribution for the fraction of optical counterparts among X-ray sources, we get the answer as 10%. The most-likely value is 60 counterparts with a probability of 11.5%.
We also estimated the probability for chance identification of XMM–Newton sources with ROSAT and Chandra sources. There are 47 ROSAT sources in the XMM–Newton fov, having an average error radius (90% probability) as 12.25″, so the chance identification of 0, 1, and 2 counterparts is 56%, 33%, and 9% respectively. For the Chandra sources we calculated the average error in RA and Dec separately, combined them with the corresponding average 1 positional error for XMM–Newton sources, and then used twice the resultant errors in RA and Dec as the sides of the error box. Thus, considering the 154 Chandra sources in XMM–Newton fov we obtain the probability for 0, 1, and 2 chance identification as 97%, 3%, and 0% respectively. Accordingly, the probability of identifying XMM-Newton X-ray members with ROSAT and Chandra sources by chance is 1%.
3.5 Background sources
We used the soft AGN number counts from Gilli et al. (2007) to estimate the expected background sources in our observations. Using the flux limit of erg cm-2 s-1, we find from Figure 9 of Gilli et al. (2007) that there are 230 AGN per deg2 in the 0.5–2 keV band. Then, among the 75 unique sources in the XMM fov (16′radius circle), we expect 50 AGN. Among the 75 unique sources in our X-ray source list given in Table 2, 24 are probable M67 members (Table 3), two are foreground stars. Four other non-members have V band magnitudes less than 17, and are probably foreground stars. The remaining 45 sources have V20 or have no optical counterpart down to 22nd magnitude. These are all very likely to be AGN. In fact, we have confirmed that 18 of these are either galaxies (AGN status unknown) or AGN (see column 14 of Table 2).
4 SPECTRAL AND TIMING ANALYSIS
4.1 Spectral Fitting and Luminosities
We extracted PN background and source spectra for eight sources (NX1–8) (Table 2) having total counts 100. The spectrum for one of the sources (NX6) had to be extracted from the MOS1 detector since it is located in the PN CCD gap. To find the appropriate regions for the extraction of background and source spectra, we used DS9. Spectral information was extracted from within a circle having 30″radius centred on the X-ray source. Background spectra were extracted from annuli with inner radii between 35″–45″and widths between 60″–75″centred on the X-ray sources, taking care to avoid contamination from nearby sources. For those X-ray sources where the annulus would spill over to the neighboring CCD, the region of choice for background spectral extraction was a circle close to and having a similar RAWY as for the source extraction region, and with radius between 40″–50″. We used the SAS task especget to perform the extraction of source and background spectra for NX1–8. We grouped the spectral (PHA) channels using the specgroup task such that each grouped PHA channel had 16 counts, sufficient for the assumption of Gaussian distribution of uncertainties. This task also performs the subtraction of background spectrum from the source spectrum.
| (1) | (2) | (3) | (4) | (5) | (6) | (7) | (8) | (9) | (10) | (11) |
|---|---|---|---|---|---|---|---|---|---|---|
| NX | model | kT1 | kT2 | EM1/EM2 | kT | NH | F/10-14 | ECF/1011 | (dof) | |
| (keV) | (keV) | (keV) | ( cm-2) | (erg cm-2 s-1) | (cts cm2 erg-1) | |||||
| 1 | 2T | 2.2 | 6.6 | 0.82(14) | ||||||
| 2 | P+B | 3.3 | 4.9 | 0.81(14) | ||||||
| 3 | P | 3.2 | 4.7 | 0.69(8) | ||||||
| 4 | 2T | 2.2 | 5.7 | 0.95(8) | ||||||
| 5 | 2T | 2.2 | 6.2 | 0.63(5) | ||||||
| 6 | 2T | 2.2 | 1.8 | 1.08(3) | ||||||
| 7 | P | 3.3 | 4.1 | 0.91(7) | ||||||
| 8 | T | 2.2 | 6.9 | 0.94(7) |
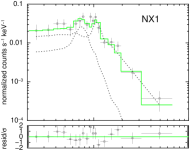
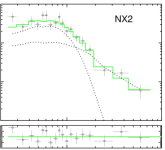
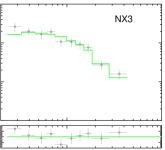
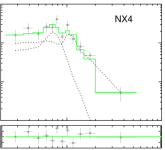
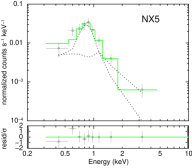
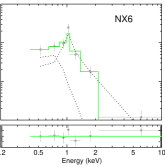
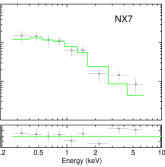
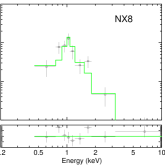
The spectral fitting was done using the XSPEC package. We ignored spectral groups containing channels with energies 0.2 keV and 12 keV. X-ray spectra for the M67 members were fitted using an absorber model (phabs) multiplied to a model of collisionally-ionised plasma (apec with one or two characteristic plasma temperatures and and both having default elemental abundances). The column density NH for the absorber was fixed at 2.21020 cm-2 (converted from EB-V=0.04 using RV=3.1). Note that the choice of two apec components instead of a single one was decided based on the reduced of the fit and manual inspection of the fitted spectrum and residuals. For all the other X-ray sources, a photo-electrically absorbed power law with or without a blackbody component, as expected for AGN, was used for spectral fitting. In this case, the NH was estimated using the nh task. For NX1–8, the fitted model, their best-fit parameters with 90% uncertainties given by XSPEC, and the NH used are shown in columns 2–8 in Table 4, and the resulting reduced and degrees of freedom (dof) are in column 11. Figure 4 shows the spectra for the eight sources considered for fitting, of which five are members of M67.
The fluxes of NX1–8 in the 0.2–7 keV energy band were calculated using the best fit parameters in the flux task in XSPEC. The resulting fluxes along with their 90% uncertainties are given in column 9 of Table 4. The energy conversion factors (ECF=Rate/Flux) are tabulated in column 10. For members of M67 among sources in Table 4, we find that the mean ECF is 6.30.4 counts cm2 erg-1 (uncertainty in the count rate not folded in). We used this factor to calculate the X-ray fluxes in the 0.2–7 keV band for all the M67 members detected in the XMM observations. Similarly we determined the ECFs for the 0.3–7 keV and 0.1–2.4 keV bands. The former band is used by van den Berg et al. (2004) for Chandra observations of M67 while the latter is relevant for ROSAT. For coronal sources, we used the ECFs to calculate the multiplicative factors for converting from the Chandra and ROSAT bands to the 0.2–7 keV band as 1.00.1 and 0.80.1 respectively. X-ray luminosities in the 0.2 – 7.0 keV energy band of XMM for all the members of M67 calculated assuming a mean distance of 850 pc are given in Table 3. For Obs ID 0212080601, we fitted the spectra for four bright members of M67 (NX4–6,NX8) using the parameters listed in Table 4 as initial values, and calculated the ECFs. The mean ECF was found to be counts cm2 erg-1. We used this ECF to convert the count rates of NX73–75 to their corresponding fluxes.
4.2 Hardness Ratios
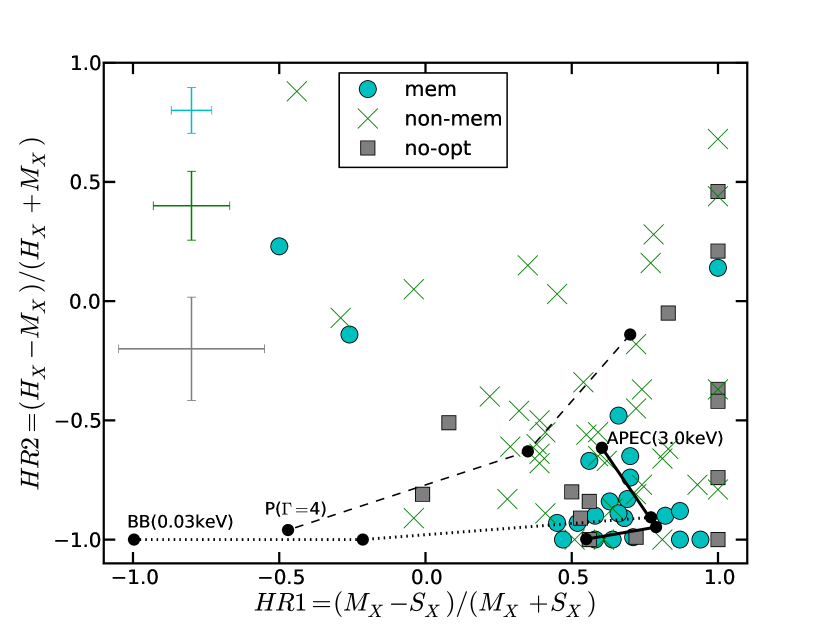
Spectral information for weak X-ray sources can be obtained by comparing the countrates in coarse spectral bins after applying the correction for exposure, vignetting, and background. Taking advantage of the wide bandpass of XMM, we defined two hardness ratios, and , as given in equation 1.
| (1) |
where , and denote the exposure-corrected counts in the soft band (0.2 – 0.5 keV), the medium band (0.5 – 2.0 keV) and the hard band (2.0 – 7.0 keV), respectively. For each X-ray source detected, HR1 and HR2 are calculated within the best-fit source position, using the best-fit count rates in all the bands by the source-finding algorithm emldetect. They are tabulated in column 7 of Table 2 for the PN detector (unless noted as MOS1). Sources with very soft spectra will have HR10 and those with hard spectra will have HR20. In Figure 5 we plot HR2 against HR1 for all of our 75 unique sources. Apart from NX36 and NX75, whose hardness ratios are imprecise, and the cataclysmic variable NX42=EU Cnc, all members of M67 lie in the region HR10.5, HR20.5. AGN and other non-members also tend to lie in this region, but their scatter is much larger. Hardness ratios expected from power-law (P), blackbody (BB) and collisionally ionised plasma (APEC) are also shown. These were calculated using WebPIMMS using Galactic hydrogen column density of 2.21020 cm-2. Note that the uncertainties of the source hardness ratios depend on the count rate and for our XMM sources they have a large scatter. Only the weighted mean uncertainties are shown as guidance in Figure 5 for each class of object.
4.3 X-ray Variability
The X-ray light curves were extracted from the same regions as for the spectra from the filtered PN (MOS1 for NX6) event list in the 0.2–10 keV band with tasks evselect and epiclccorr. The time bin size was set to 300 s (NX1) or 450 s (NX2–8) to get adequate signal-to-noise ratio in each bin. For PN we selected only those events with keyword less than or equal to 4. The light curves for NX1–8 are shown in Figure 6. The background-subtracted light curves are in blue and the background-only light curves are in grey.
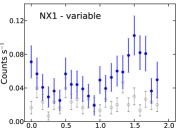
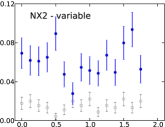
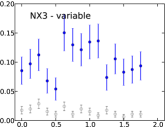
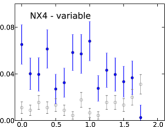
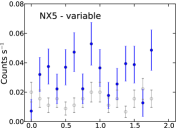
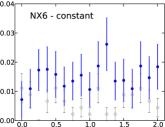
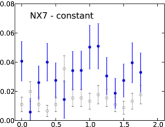
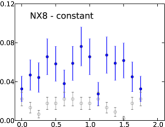
We used the test to check for the departure from white noise in the light curves, and selected sources having probability 25% as significant variables. Sources NX1 to NX5 are thus found to be variable, while the variability in NX6–8 is not significant. Members of M67 showing a significant variability are NX1, NX4 and NX5, which also exhibit short-term autocorrelation. For the RS CVn binary, NX1, the autocorrelation function shows a significant correlated structure for lag time k2 implying variability timescale of 10 min.
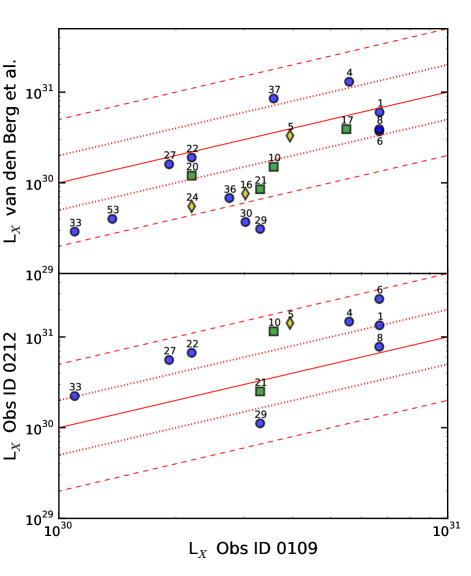
We also compared the X-ray luminosities of M67 members detected in the XMM observation ID 0109461001 with those in the Chandra observation from van den Berg et al. (2004) separated by five months, and between ID 0109461001 and ID 0212080601 to find the variability over two observations spaced by 4 years. The comparison plots are shown in Figure 7.
The RS CVn-type systems, NX1, NX6, NX22, and XN27, have relatively stable X-ray emission between ID 0109461001 and van den Berg et al., but are variable by more than a factor of two between ID 0109461001 and ID 0212080601, while NX8 appears stable between all three observations. NX4, NX16, NX33, NX36, NX37, and NX53 are variable by more than a factor of two between any of the two observations. NX29 and NX30 are variable by more than a factor of five over the observations spaced by five months. The W UMa-type system, NX21, varied by a factor of four between ID 0109461001 and Chandra observations. NX10 is variable by more than a factor of two over the observations separated by months as well as years. Both types of systems, RS CVn-type and W UMa-type, are known to be highly variable due to recurrent flaring activity. The snapshot observations, which are not very long, could have caught them in different phases of their activity. Three yellow stragglers, which are present in the multi-epoch data, also display average change in luminosity by a factor . Figure 7 suggests that, the variability amplitudes of RS CVn-type sources, W UMa-type systems, and yellow stragglers are similar.
5 NOTES ON INDIVIDUAL CLASSES OF STELLAR X-RAY SOURCES AND THEIR X-RAY LUMINOSITY FUNCTIONS
In Table 5, we provide notes on the individual classes of stellar X-ray sources in M67. We have used the orbital parameters for X-ray members from van den Berg et al. (2004), who have in turn compiled them from Mathieu (1990), Latham et al. (1992), van den Berg et al. (2000), and from unpublished work by D. Latham, R. Mathieu et al. For the names of the sources and their parameters, please see Table 3.
| Class / Type | Source(s) | Notes | |
| RS CVna | 1) | NX6, NX8, NX36 | Lie along subgiant branch. d, . |
| 2) | NX1, NX22, NC29, RX26, RX46, CX78, CX88 | Proposed as RS CVn systems by van den Berg et al. (2004) and Belloni et al. (1998) based on the presence of Ca H & K emission lines, X-ray spectrum, orbital period and circularisation. Lie along subgiant branch. d, . | |
| 3) | NX27, NX64, RX28 | Candidate RS CVn-type systems or their main-sequence analogs. Complete orbital solution not available. | |
| Algol | 1) | NX37 | Previously known Algol system. d. |
| 2) | CX157 | Candidate Algol-type system. Consists of an eclipsing system containing an F0-type and an early M-type main sequence star (Gökay et al., 2013). | |
| Contact binaries | NX10, NX17, NX20, NX21, NX53=CX61 | All are W UMa-type systems. d. NX10 and NX17 are eclipsing binaries. NX61 had been assigned unknown membership probability by van den Berg et al. (2004), and we confirm its M67 membership in this work. NX10, NX17, NX21, and NX53 are on the main sequence. NX20 is close to the main-sequence turnoff. | |
| CV | 1) | RX35=NX73 | Belloni et al. (1998) use from Sanders (1977) and hardness of the X-ray spectrum to claim that this could be an accreting white dwarf system. Orbital parameters are unknown. However, EIS has , and our hardness ratios are , . The position in the HR diagram and absence of soft and hard X-ray components therefore argue against the CV hypothesis for this source. |
| 2) | NX42 | AM Her-type CV, EU Cnc. ROSAT detection is only below 0.4 keV (Belloni et al., 1998), but van den Berg et al. (2004) find a relatively high hardness ratio. In this work we have and , consistent with the high hardness ratios typical of magnetic CVs. | |
| Blue Stragglers | 1) | NX37 | 1.1 d orbit for the inner binary of a possible triple system (Goranskij et al., 1992; van den Berg et al., 2001). van den Berg et al. (2000) find the spectral type to be F5IV, and van den Berg et al. (2001) suggest that the X-ray emission could be due to magnetic activity in the rapidly rotating subgiant. |
| 2) | CX94b | Noted as a blue straggler in Sandquist & Shetrone (2003), but with the EIS color, it is very close to main-sequence turnoff. van den Berg et al. (2004) noted that CX94 shows no radial-velocity variations over six observations spanning 3923 days. | |
| 3) | CX95b | d and . The primary has spectral type F6V and a projected rotation speed, v sin()20 km s-1 (Latham & Milone, 1996; Liu et al., 2008). van den Berg et al. postulate that CX95 could have an undetected close binary, hence explaining the X-ray emission. | |
| Yellow Stragglers | 1) | NX5 | Binary system with a G4 giant and a cool white dwarf, with a circular orbit having . Ca II H,K emission lines are present Pasquini & Belloni (1998). Circularized orbit suggests strong tidal forces between the two components of the system, but the cool temperature of the white dwarf precludes mass transfer. |
| 2) | NX16, NX24 | d and 698 d, and and 0.11 respectively. Tidal interaction therefore not strong enough to explain their X-ray emission, . | |
| Peculiar System | NX4 | Lies about one mag below the sub giant and giant branches in the diagram (Figure 3). The X-ray spectrum and variability suggest that the X-ray emission is coronal. | |
| New M67 Member | NX75 | Associated with the V15 mag optical counterpart, E4630. Orbital parameters and hardness ratios are not well constrained. We estimate the spectral type of this source as K4V and a distance of 860 pc based on archival multiwavelength photometry, and thus suggest that it may be an RS CVn type. Further optical spectroscopy and radial velocity measurements are needed for understanding its chromospheric activity and for deriving its orbital parameters. | |
| Other Members with unknown class | 1) | NX45, CX67, CX94 | Lie along the F/G/K main sequence and are known binaries with undetermined orbital solutions. NX45 has a spectral type G0V and is close to the main-sequence turnoff. |
| 2) | NX62, CX62, CX73, CX77, CX80, CX82 | Lie along the M dwarf part of the main sequence of M67. These members are possibly spun-up binaries with active chromospheres where both members are main sequence stars. | |
| (a) Sources with d are expected to have near-circularized orbits (e.g. Latham, 2007). (b) CX94 and CX95 are within the fov of the XMM-Newton observations, but below the detection threshold. | |||
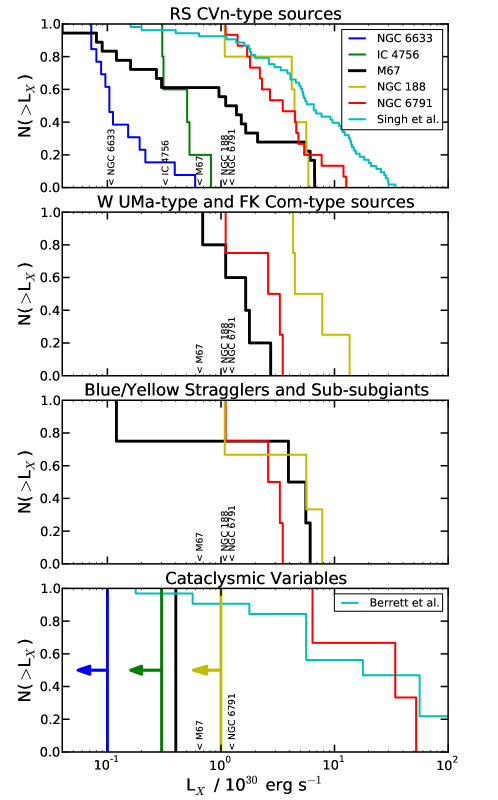
In Figure 8 we plot the X-ray luminosity functions (XLFs) of various stellar types in M67 and compare compare them with the XLFs of other open star clusters of intermediate-to-old age. The star clusters used for comparison with M67 (4 Gyr; Table 3) are: NGC 6633, IC 4756 (0.7 Gyr; Briggs et al., 2000), NGC 6791 (8 Gyr; van den Berg et al., 2013), and NGC 188 (7 Gyr; Belloni et al., 1998; Gondoin, 2005). The clusters in general have different median values for the X-ray luminosity for different stellar types. The XLF of the RSCVns in M67 is shown in the top panel of Figure 8 along with that in the other clusters. The XLF of field RS CVn binaries from Singh et al. (1996) is also shown for guidance. In general, RS CVn-type systems are more numerous at the low luminosity end, and there exist very few systems above erg s-1. It is evident that the highest luminosity of RS CVn-type systems seen in the clusters is a function of the age of the clusters. Older clusters appear to have larger number of brighter luminosity systems. In other words, the XLFs indicate that the RS CVn-type systems get brighter as they age. It is also evident from Figure 8 that the RS CVn XLFs of M67 and the Singh et al. sample have a much shallower slope than those of the other clusters, which may be due to two distinct distributions of RS CVn-type systems in open clusters333We could have also missed a population of low luminosity RS CVns due to the limit of our sensitivity, but this would only partly explain the shallow slope.. This is suggestive of the intuitive notion that, as the clusters age, more active binary systems and active stars are produced (see also Verbunt, 1999; van den Berg, 2013). This picture is consistent with younger systems having lower luminosity and older ones being more luminous. The shallower slope of and the presence of several erg s-1 systems among the field population advocate that these are old systems which may have been kicked out of their parent clusters.
The second panel from the top of Figure 8 shows the XLFs of WU UMa-type and FK Com-type systems in M67, NGC 188, and NGC 6791. Down to the sensitivity of X-ray surveys in NGC 6633 and IC 4756, these clusters do not have any definite detections of contact or coalesced binaries. From Figure 8 we see that the slopes of the contact binary XLFs are steep, and there are several systems having X-ray luminosities greater than erg s-1. The WU UMa-type and FK Com-type systems in NGC 188 are more luminous ( erg s-1) compared to those in M67 and NGC 6791. This is surprising given that NGC 188 is neither the most massive (in fact, it is the least massive among the old clusters) nor the oldest cluster among the sample.
The third panel from the top of Figure 8 shows the XLFs of stragglers and peculiar systems. The brightest ends of the XLFs of M67, NGC 188, and NGC 6791 are steep. Majority of the straggler and peculiar systems known in these clusters span a narrow range in X-ray luminosity, to erg s-1. This could indicate a fine-tuning of X-ray emission for the brightest systems, which needs further investigation. At the low luminosity end, incompleteness due to survey sensitivities is apparent. As such, among the old clusters, the XLFs appear to be independent of the cluster age.
The bottom panel of Figure 8 shows the XLFs of cataclysmic variables. The XLF of a mixed sample of polars from a variety of binaries from Barrett et al. (1999) is also shown for guidance. NGC 6633, IC 4756, which are 0.7 Gyr old, do not have any CVs. M67 (4 Gyr old) has only one CV, the polar in quiescence EU Cnc, which has 0.2–7 keV X-ray luminosity of erg s-1, while the older cluster NGC 6791 contains three CVs with erg s-1. NGC 188, although an old cluster of age 7 Gyr, does not have any CVs brighter than 1030 erg s-1. Given this information, the production of bright CVs appears to be correlated with the mass of the cluster. NGC 6791 is about 10 times more massive than M67, and M67 is about twice as massive as NGC 188 (Pandey et al., 1987; van den Berg et al., 2013, and references therein). van den Berg et al. (2013) find that the number of CVs per unit mass is consistent with the field, and conclude that the three CVs which are confirmed members of NGC 6791 are primordial. Unlike RS CVn systems, in the case of CVs we cannot ascertain the evolution of the XLF with age. However, the mass of the parent cluster has to play an important role. More CVs are produced as clusters age, and it is plausible that these systems also get brighter with age. In this picture, the Barrett et al. (1999) sample, which contains numerous polars at high luminosity ( erg s-1), could be very old systems. The shallow slope of the Barrett et al. XLF is likely due to the bimodal distribution of polars in X-ray luminosity as noted by Barrett et al., which may be related to age of the systems.
6 SUMMARY
Our analysis of two XMM-Newton observations of the old open cluster, M67 has led to the detection of 25 members of M67, of which 24 have been detected in previous observations with Chandra (van den Berg et al., 2004) and ROSAT (Belloni et al., 1993, 1998). One X-ray source is a newly-detected member. Based on present and older observations we have compiled an updated list of 43 X-ray members of M67 (Table 3), 16 of which are likely to be RS CVn or related binaries with circularised or near-circularised orbits having periods Porb 10 d. We also detected five contact binaries with P0.5 d. X-ray emission from three yellow stragglers and two blue stragglers detected here is not well understood. Another peculiar source, HU Cnc, lies below the intersection of the sub-giant and red giant branches in the HR diagram (Figure 3), and may be a coronal emitter. The only cataclysmic variable known in M67, the AM Her-type system EU Cnc, is detected in the XMM-Newton observations considered in this work. Fourteen X-ray members do not have any definitive classification; some of these are known binaries with undetermined orbital solutions. Spectroscopic follow up observations and radial velocity monitoring in the optical and at other wavelengths is required for elucidating the nature of these sources. M67 lies within the field of Kepler’s K2 observing campaign444http://keplerscience.arc.nasa.gov/K2/, and the optical light curves from this campaign will be useful for calculating orbital parameters of at least some of these systems. We already have an existing program to study the ultraviolet emission from M67 members and to compare it with their X-ray emission (Subramaniam et al., in prep). We found X-ray variability among M67 members on a five-month timescale and a 4-year timescale by comparing the XMM-Newton observations and Chandra observations from van den Berg et al. (2004). The fractional variability of RS CVn-type sources, W UMa-type systems, and yellow stragglers are found to be quite similar, factor of 3 on months and years timescales. Finally, we have studied the X-ray luminosity function of RS CVn-type (and other types) members in M67. A comparison with that of other intermediate-to-old open clusters (Figure 8) shows an increased number of higher luminosity stars in the older clusters, thus suggesting that more active binary systems and active stars are likely produced with the aging of clusters. Deeper and more sensitive X-ray and optical observations of intermediate-to-old star clusters are encouraged in order to find fainter sources and thus extend the luminosity functions of the different classes of X-ray sources to the faint end.
ACKNOWLEDGMENTS
KM would like to thank Himali Bhatt and Dom Walton for useful discussions and guidance on X-ray data processing. We thank the anonymous referee for the valuable suggestions which greatly improved the manuscript. This research has made extensive use of Vizier, SIMBAD, and SDSS.
References
- Baldi et al. (2002) Baldi A., Molendi S., Comastri A., et al. 2002, ApJ, 564, 190
- Belloni et al. (1993) Belloni T., Verbunt F., Schmitt J. H. M. M. 1993,A&A, 269, 175
- Belloni et al. (1998) Belloni T., Verbunt F., Mathieu R.D. 1998, A&A, 339, 431
- Barrett et al. (1999) Barrett, P., Singh, K. P. & Mitchell, A. 1999, ASPC, 157, 180
- Pandey et al. (1987) Pandey, A. K., Bhatt, B. C. & Mahra, H. S. 1987, Astrophysics and Space Science, 129, 293
- Briggs et al. (2000) Briggs, K. R., Pye, J. P., Jeffries, R. D. & Totten E. J. 2000, MNRAS, 319, 826
- Cruddace et al. (1988) Cruddace R., Hasinger G., Schmitt J. 1988, in F. Murtagh, A. Heck (eds.), Astronomy from large databases, p. 177
- Charles & Seward (1995) Charles P. & Seward F. 1995, Exploring the X-ray Universe (Cambridge University Press), p.
- Evans et al. (2010) Evans, I. N., Primini, F. A., Glotfelty, K. J. et al 2010 ApJS, 189, 37
- Fan et al. (1996) Fan X., Burstein D., Chen J. S., Zhu J. et al. 1996, AJ, 112, 628
- Feigelson & Babu (2012) Feigelson, E. .D. & Babu, J. B. 2012 Modern Statistical Methods for Astronomy, Cambridge University Press
- Friel (1995) Friel E. D. 1995, ARA&A, 33, 381
- Gilli et al. (2007) Gilli, R., Comastri, A. & Hasinger, G. 2007, A&A, 463, 79
- Girard et al. (1989) Girard, T. M., Grundy, W. M., Lopez, C. E., et al. 1989, AJ, 98, 227
- Gondoin (2005) Gondoin, P. 2005, A&A, 438, 291
- Gökay et al. (2013) Gökay, G., Gürol, B. & Derman, E., 2013, AJ, 146, 123
- Goranskij et al. (1992) Goranskij, V. P., Kusakin, A. V., Mironov, A. V., et al. 1992, A&AT, 2, 201
- Gudel et al. (2004) Gudel M. 2004, A&A, 12, 71
- Jansen (2001) Jansen F., Lumb D., Altieri B., Clavel J., Ehle M., Erd C., Gabriel C., Guainazzi M. et al. 2001, A&A, 365, 1
- Jester (2005) Jester, S., Schneider, D., Richards, G. et al. 2005, arXiv:astro-ph/0506022
- Johnson (1966) Johnson, H. 1966, ARA&A, 4, 193
- Kuulkers et al. (2006) Kuulkers, E., Norton, A., Schwope, A., et al. 2006, in Compact stellar X-ray sources, 39, 421
- Latham et al. (1992) Latham, D. W., Mathieu, R. D., Milone, A. A. E. et al. 1992, Proceedings of the IAU Symposium 1991, 151, 471
- Latham & Milone (1996) Latham, D. W. & Milone, A. A. E. 1996, ASPC, 90, 385
- Latham (2007) Latham, D., Highlights of Astronomy, 14, 444
- Liu et al. (2008) Liu, G. Q., Deng L. & Chavez M. 2008, MNRAS, 390, 665
- Mathieu (1990) Mathieu, R. D., Latham, D. W., Griffin, R. F. et al. 1990, AJ, 100, 1859
- Momany et al. (2001) Momany Y., Vandame B., Zaggia S., Mignani, R. P. et al. 2001, A&A, 379, 436
- Montgomery et al. (1993) Montgomery K. A., Marschall L. A., Janes K. A. 1993, AJ, 106, 181
- Pallavicini (1989) Pallavicini, R. 1989, A&ARv, 1, 177
- Pasquini & Belloni (1998) Pasquini, L. & Belloni, T., 1998, A&A, 336, 902
- Randich (1997) Randich S. 1997, in Cool stars in clusters and associations: magnetic activity and age indicators, ed. G. Micela, R. Pallavicini, S. Sciortino Vol. 68, 971
- Sanders (1977) Sanders W. L. 1977, A&AS, 27, 89
- Sandquist & Shetrone (2003) Sandquist, E. L. & Shetrone, M. D. 2003, AJ, 125, 2173
- Sarajedini et al. (1999) Sarajedini, A., von Hippel, T., Kozhurina-Platais, V., et al. 1999, AJ, 118, 2894
- Singh et al. (1996) Singh, K. P., Drake, S. A. & White, N. E. 1996, AJ, 111, 2415
- Strüder et al. (2001) Strüder L., Briel U., Dennerl K., Hartmann R., Kendziorra E., Meidinger N., Pfeffermann E., Reppin C., 2001, A&A, 365, 18
- Stryker (1993) Stryker, L. L. 1993, PASP, 105, 1081
- Turner et al. (2001) Turner M. J. L., Abbey A., Arnaud M., Balasini M., Barbera M., Belsole E., Bennie P. J., Bernard J. P. et al., 2001, A&A, 365, 27
- van den Berg et al. (2000) van den Berg M., Verbunt, F., & Mathieu, R. D., et al. 2000, ASP Conference Series, 198, 503
- van den Berg et al. (2001) van den Berg M., Orosz, J., Verbunt, F. & Stassun, K. 2001, A&A, 375, 375
- van den Berg et al. (2004) van den Berg M., Tagliaferri G., Belloni T., Verbunt F. 2004, A&A, 418, 509
- van den Berg et al. (2013) van den Berg M., Verbunt, F., Tagliaferri, G., et al. 2013, ApJ, 770, 98
- van den Berg (2013) van den Berg M. 2013, ASP Conference Series, Vol. 470. San Francisco: Astronomical Society of the Pacific
- Verbunt (1999) Verbunt F., 1999, Highlights in X-ray astronomy, ed. Bernd Aschenbach & Michael J. Freyberg, Garching
- Vereshchagin et al. (2014) Vereshchagin S. V., Chupina N. V., Sariya D. P., et al. 2014, arXiv:1403.2532
- Watson et al. (2009) Watson M. G., Schröder A. C., Fyfe D., et al. 2009, A&A, 493, 339
- Yadav et al. (2008) Yadav R.K.S., Bedin L.R., Piotto G., Anderson J., Cassisi S., Villanova S., Platais I., Pasquini L., Momany Y., Sagar R. 2008, A&A, 484, 609
- Zamorani et al. (1999) Zamorani G., Mignoli M., Hasinger G. et al. 1999, A&A, 346, 731
- Zhao et al. (1993) Zhao J. L., Tian K. P., Pan R.S., He Y. P., Shi H. M. 1993, A&AS, 100, 243