e-mail: ]ivlev@mpe.mpg.de
Interstellar dust charging in dense molecular clouds: Cosmic ray effects
Abstract
The local cosmic-ray (CR) spectra are calculated for typical characteristic regions of a cold dense molecular cloud, to investigate two so far neglected mechanisms of dust charging: collection of suprathermal CR electrons and protons by grains, and photoelectric emission from grains due to the UV radiation generated by CRs. The two mechanisms add to the conventional charging by ambient plasma, produced in the cloud by CRs. We show that the CR-induced photoemission can dramatically modify the charge distribution function for submicron grains. We demonstrate the importance of the obtained results for dust coagulation: While the charging by ambient plasma alone leads to a strong Coulomb repulsion between grains and inhibits their further coagulation, the combination with the photoemission provides optimum conditions for the growth of large dust aggregates in a certain region of the cloud, corresponding to the densities between cm-3 and cm-3. The charging effect of CR is of generic nature, and therefore is expected to operate not only in dense molecular clouds but also in the upper layers and the outer parts of protoplanetary discs.
Subject headings:
ISM: dust – ISM: clouds – ISM: cosmic raysI. Introduction
Interstellar dust grains in dense molecular clouds are subject to several electric charging processes (e.g., Draine & Salpeter, 1979; Draine & Sutin, 1987; Weingartner & Draine, 2001b). The resulting net electric charge carried by micron or sub-micron size grains has important consequences for the chemical and dynamical evolution of molecular clouds: it affects the process of dust coagulation (Okuzumi, 2009; Dominik et al., 2007), the rate of grain-catalyzed electron-ion recombination (Mestel & Spitzer, 1956; Watson, 1974), the amount of gas-phase elemental depletion (Spitzer, 1941), and the electrical resistivity of the cloud’s plasma (Elmegreen, 1979; Wardle & Ng, 1999). The resistivity, in turn, controls the coupling between the neutral gas and the interstellar magnetic field, and eventually the dynamics of gravitational collapse of molecular clouds and the formation of stars (e.g., Nakano et al., 2002; Shu et al., 2006).
Collisions of dust grains with the plasma of thermal electrons and ions from the gas (hereafter, cold plasma charging) represent an important dust charging process in molecular clouds (e.g., Draine & Sutin, 1987; Draine, 2011). Since electrons of mass have a thermal speed which is much larger than that of ions of mass (by the factor ), grains acquire by this process a (predominantly) negative charge. The photoelectric effect (also called photoemission), on the other hand, results in positive charging of dust grains, and is set by the radiation field in the cloud at energies above a few eV. Photoemission is an important charging process for diffuse gas with visual extinction (e.g., Bakes & Tielens, 1994; Weingartner & Draine, 2001b). As the interstellar radiation field is exponentially attenuated with increasing , photoemission is usually neglected to compute the charge distribution of grains in the dense gas of molecular cloud cores (e.g., Umebayashi & Nakano, 1980; Nishi et al., 1991).
Cold plasma charging and photoemission are usually assumed to be the dominant grain charging mechanisms in the cold interstellar medium. In this paper we study the effects of cosmic rays (CRs) on the charging of submicron dust grains in molecular clouds. We focus on two charging processes that contribute in addition to the cold-plasma charging, but have been neglected so far. By calculating the local CR spectra for typical cloud regions, we investigate the effects of (i) collection of suprathermal CR electrons and protons by grains (Shchekinov, 2007) and (ii) photoelectric emission from grains due to the UV radiation generated by CRs. Using the cold-plasma collection as the “reference case”, we show that the photoelectric emission can dramatically modify the charge distribution function for dust in almost the entire cloud, and discuss important implications of the obtained results. In particular, we point out that while the cold-plasma charging alone leads to a strong Coulomb repulsion between grains and inhibits their further coagulation, the combination with the CR-induced photoemission provides optimum conditions for the growth of large dust aggregates in a certain region of the cloud.
II. CR properties relevant to dust charging
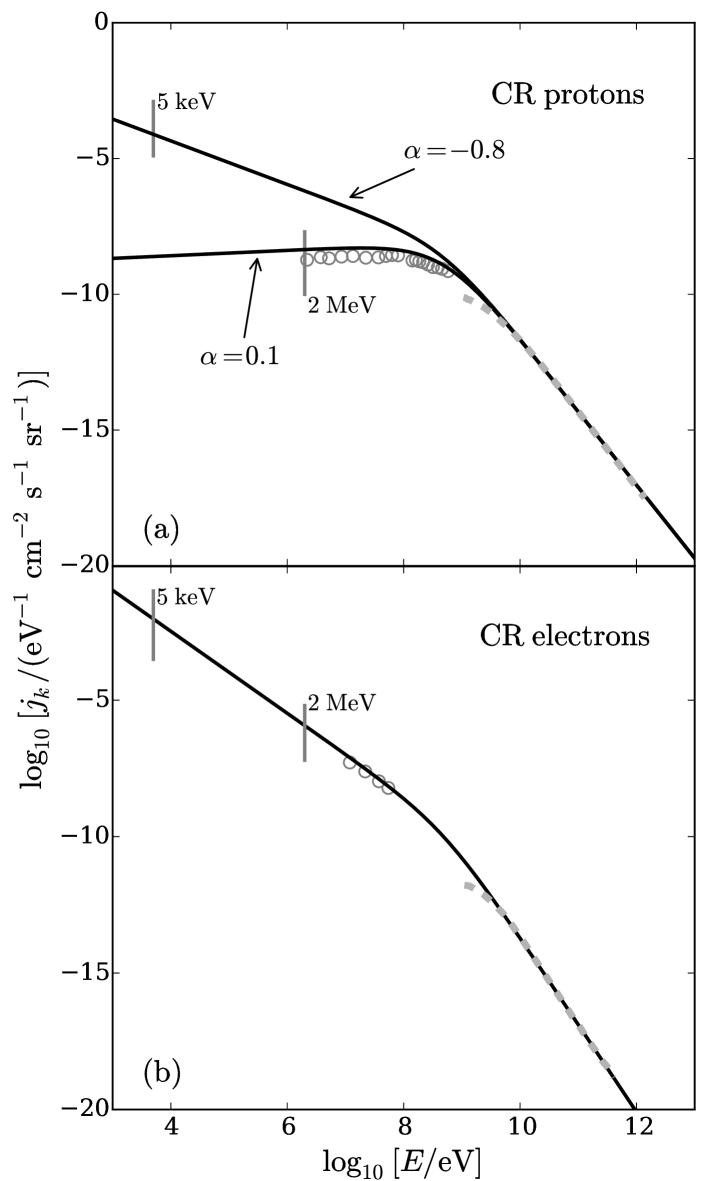
The specific intensities (or spectra) of CR protons and electrons inside a dense molecular cloud are determined by the interstellar CR spectra. In order to constrain the trend of the interstellar spectra at high energies ( MeV), we use the latest results of the Alpha Magnetic Spectrometer (AMS-02), mounted on the International Space Station (Aguilar et al., 2014, 2015). The high-energy spectrum slope is for electrons, while for protons it is .
At lower energies, the shape of the interstellar CR spectrum is highly uncertain due to the effect of Solar modulation (see, e.g., Putze et al., 2011). Data collected by the Voyager 1 spacecraft from a region beyond the Solar termination shock are extremely useful in this context (Webber, 1998), as they provide a lower limit to the CR spectrum in the energy range from MeV to MeV that should be not too different from the actual interstellar value (Stone et al., 2013). However, two caveats should be kept in mind. First, Voyager 1 has not yet entered interstellar space, as the magnetic field detected by magnetometers on board the spacecraft still retains some characteristics of the Solar wind magnetic field (Burlaga & Ness, 2014). Therefore, the measured proton fluxes may still contain a fraction of anomalous CRs from inside the heliosphere (Scherer et al., 2008). Second, even if Voyager 1 were in the interstellar space, there is no guarantee that the measured spectra of CR protons and electrons are representative of the average Galactic spectra, because the contribution of local sources (i.e. within parsecs from the Sun) is difficult to quantify. Nevertheless, the Voyager 1 data provide the only direct observational constraint presently available on the low-energy spectra of CRs, and therefore they cannot be discarded. In particular, we use the results of Stone et al. (2013), obtained from data collected by Voyager 1 since August 2012, when the spacecraft was at an heliocentric distance of 122 AU.
We model the low-energy behavior of the proton and electron spectra with power-law dependencies. To describe a crossover to the high-energy scalings, we employ the simple analytical expression
| (1) |
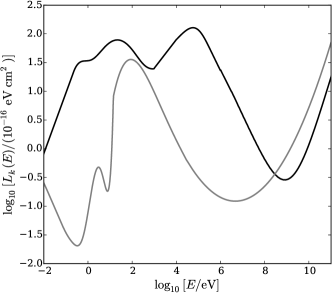
where and the crossover energy MeV is the same for both species. Following Stone et al. (2013), for CR electrons we adopt a low-energy spectrum slope of , while for protons we explore two extreme cases with and . The resulting interstellar spectra are presented in Fig. 1, other parameters for Eq. (1) are listed in Table 1. Combinations of the two proton spectra with the electron spectrum are termed below as the model (“High”, ) and model (“Low”, ).
| species () | ||||
|---|---|---|---|---|
| electrons | ||||
| protons (model ) | ||||
| protons (model ) |
The number densities for the CR species are given by , where is the velocity for the energy . In order to preserve charge neutrality of CRs, we set , which yields the lower energy cutoff keV and MeV for the models and , respectively. The corresponding energy densities are defined by . The total energy density, , is dominated by protons and varies between eV cm-3 (model ) and eV cm-3 (model ).
We note that our choice of a single interstellar spectrum for CR electrons and two possible spectra for CR protons is arbitrary. As discussed above, we adopt the view that the Voyager 1 data represent lower limits to the actual spectra, due to residual modulation of the interstellar fluxes at the current position of the spacecraft. For simplicity, this remaining uncertainty is attributed to the protons only: We select the “minimum” proton spectrum () compatible with the data, and the “maximum” spectrum () providing the upper bound for the available observational data on the CR ionization rate (see Sec. II.1).
II.1. Local CR spectra
In order to concentrate on the charging effects induced by CRs, we adopt an idealized 1D (slab) model of a dense core embedded in a molecular cloud (for details, see Padovani et al., 2009). We assume that CRs propagate normally to the surface in straight lines, with a half of the interstellar CR flux incident on each side of the cloud.111More advanced models should take into account the fact that molecular clouds are magnetized and CRs gyrate along magnetic field lines, in addition of being scattered by magnetic fluctuations on the scale of the particle gyroradius. For detailed treatment of these effects, see Padovani & Galli (2011), Padovani et al. (2013, 2014), and Morlino & Gabici (2015). This simple model, neglecting integration over the incidence angles, yields the local spectra that approach the exact results in the inner core region, while in the outer region the fluxes are only slightly overestimated (by less than 30%, details will be presented elsewhere).
For the core we use the density profile of a Bonnor-Ebert sphere (Bonnor, 1956; Ebert, 1955), which typically well reproduces observations of starless cores (e.g., Alves et al., 2001; Keto & Caselli, 2008; André et al., 2014). In particular, we consider a centrally concentrated core, such as L1544, where the volume density within the central 500 AU is cm-3, one of the largest known for starless cores (Keto & Caselli, 2010). The molecular core has a radius of about 0.1 pc, beyond which the density drops below cm-3 and photoprocesses becomes important (Keto & Caselli, 2010). We further assume that the core is embedded in an envelope of lower density, to simulate the location of the dense core in a molecular cloud such as Taurus. Such envelope extends up to a distance of pc from the core center, and the average density within a radius of 4.4 pc is cm-3. With these properties, the cloud has a mass column density of M⊙ pc-2, which is typical of molecular clouds (Roman-Duval et al., 2010).
To demonstrate the extent to which the dust charges in dense molecular clouds are expected to be affected by CRs, we consider three characteristic regions of the embedded core: the outer boundary [ cm-3, cm-2], the inner core [ cm-3, cm-2], and also the core center [ cm-3, cm-2]. We shall refer to these regions as “outer” (), “inner” (), and “center” (), respectively.
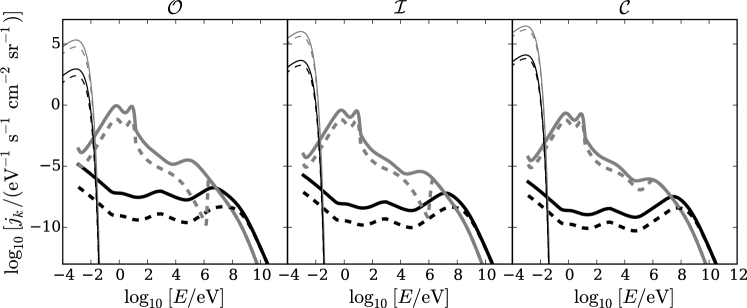
The CR protons and electrons penetrating the cloud ionize the neutral gas, i.e., produce a local plasma environment whose properties are determined by the value of . On the other hand, the ionization yields a major contribution to the energy loss of CRs (see Appendix A), thus modifying the interstellar spectra to the local form (Padovani et al., 2009). The low-energy CR species as well as the multiple generations of electrons and ions formed in the ionization avalanche (see Appendix B) rapidly lose their energy: the characteristic energy loss timescale , given by Eq. (B2), is always much shorter than the timescale of recombination. Therefore, the steady-state energy distribution of electrons and ions in a dense cloud can be viewed as a superposition of two distinct parts: a cold Maxwellian peak where electrons and ions accumulate and eventually recombine – that dominates the total plasma density, and a suprathermal tail representing the modified (propagated) CR spectrum – that determines the ionization rate.
The local steady-state equilibrium is determined by the balance between the CR ionization of H2 and various recombination processes (see, e.g., Oppenheimer & Dalgarno, 1974; McKee, 1989). A competition between the dissociative recombination with molecular ions and the radiative recombination with heavy metal ions (in the presence of charge-transfer reactions), occurring in different core regions, can significantly alter the magnitude of the electron fraction , in particular modify the dependence on . For the L1544 core, we employ the following interpolation formula (Caselli et al., 2002, their model 3):
| (2) |
where is the CR ionization rate.222We note that the results presented in Sec. III practically do not depend on the precise form of the formula for . In the following, we assume that the electron density is equal to the density of all ion species formed in the ionization avalanche (i.e., the contribution of charged grains into the charge neutrality is negligible, see Sec. III).
Figure 2 shows the combination of the propagated spectra and the cold Maxwellian background. The energy at which the intersection between the two curves occurs is practically the same for all considered cases, eV.
| model | model | |
|---|---|---|
| model | model |
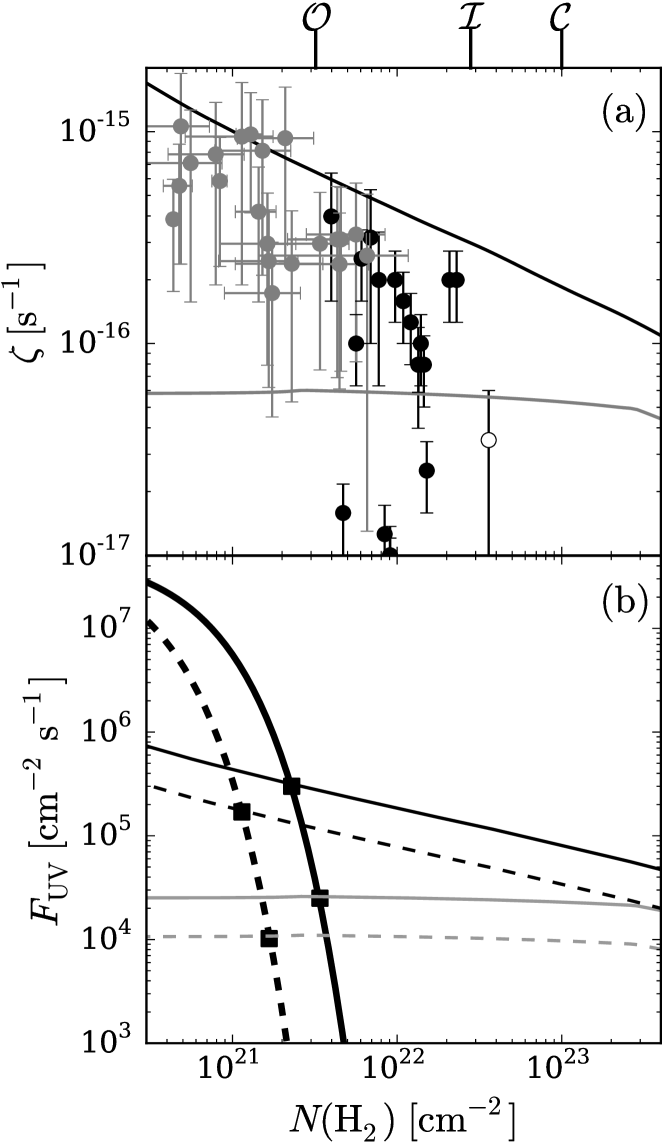
Figure 3a shows the ionization rate as a function of the molecular H2 column density for the two CR models. The characteristic values of and the corresponding are summarized in Table 2. For comparison, the values of obtained by integrating the Voyager 1 fluxes down to the lowest measured energy, without any extrapolation, are s-1 and s-1 for protons and electrons, respectively. These should be considered as lower limits to the interstellar value of . Notice that the contribution of CR electrons to the average interstellar CR ionization rate, often neglected in the past, could be significant (although in general it is smaller than that of protons and heavier nuclei).
We point out that the main positive charge carrier changes across the cloud, because the molecular freeze-out becomes more efficient toward the core center (see, e.g., Tafalla et al., 2002). In this paper we do not discuss a complex plasma chemistry, but instead consider two extreme cases when the dominant ions are either H+ (for the strongly depleted inner dense regions) or HCO+ (for the outer regions). In Sec. III.3 we demonstrate that the plasma composition has only a minor effect on the obtained results.
II.2. Local radiation field
The local radiation is generated by CRs via the following three (prime) mechanisms: The CR electron bremsstrahlung, the decay, and the fluorescence.
We calculate the bremsstrahlung spectrum following Blumenthal & Gould (1970). For all three characteristic core regions, the resulting photoemission flux from a grain is much smaller than the collection flux of the surrounding cold-plasma ions, which indicates that the CR bremsstrahlung cannot contribute to dust charging (see Sec. III.2). For the photon spectrum due to decay, we follow Kamae et al. (2006). This yields the photoemission flux which is even smaller than that due to bremsstrahlung and, hence, is negligible, too. Note that for energies larger than the pion production threshold (280 MeV), both our CR proton spectra coincide and remain unmodified up to cm-2.
Finally, following Eq. (21) in Cecchi-Pestellini & Aiello (1992), we compute the fluorescence generated by CRs in the Lyman and Werner bands. The resulting flux of UV photons (in the energy range between 11.2 and 13.6 eV) can be approximately calculated assuming that the band excitation rates, being normalized by , do not depend on the shape of the CR spectrum:333In fact, the excitation and ionization cross sections have somewhat different dependencies on energy. For this reason, the normalized excitation rate by CR electrons, obtained with the spectra shown in Fig. 2, is about 2.2–2.8 times larger than that reported in Cecchi-Pestellini & Aiello (1992). However, we were not able to find a reliable expression for the excitation cross section by protons, and therefore employ the approximate Eq. (3).
| (3) | |||
Here, is the dust albedo at ultraviolet wavelengths, and is a measure of the slope of the extinction at visible wavelengths (e.g., Draine, 2011). Assuming and (Cecchi-Pestellini & Aiello, 1992),444According to Gordon (2004), in dense cores with the dust albedo may be closer to . and substituting the typical gas-to-extinction ratio of we get . In Sec. III it is shown that the resulting photoelectric emission from dust grains can significantly exceed the cold-ion collection. Thus, the strongest radiation field generated by CRs is due to the fluorescence.
The interstellar radiation field is exponentially attenuated in the cloud. The specific intensity at the frequency decreases as , where is the intensity of the interstellar radiation field according to Draine (2011) and is the optical depth. By integrating over (at lower frequencies, the photoelectric yield from dust grains rapidly falls off, so the radiation does not contribute to the photoemission), we derive the interstellar photon flux as a function of . The latter is plotted in Fig. 3b and compared with vs. calculated for the models and . We see that the photon flux generated by CRs only slightly decreases (model ) or remains practically constant (model ) in the shown range of ; even for the maximum value of , the interstellar flux becomes negligible at cm-2. We conclude that for all three core regions the radiation field is solely due to CRs.
III. Charge distribution function of dust
The discrete charge distribution for dust grains of a given size is normalized to the total differential dust density at that size, i.e., . The charge distribution is derived from the detailed equilibrium of the charging master equation (Draine & Sutin, 1987),
| (4) |
Here, is the electron/ion collection flux, which has the contributions from cold Maxwellian plasma background (first term) and from suprathermal low-energy part of the CR spectra (second term), and is the photoemission flux due to the local radiation field.
We introduce the floating potential of a particle with the charge . The collection fluxes of cold electrons and ions are obtained from the so-called “orbital motion limited” (OML) approximation (Whipple, 1981; Fortov et al., 2005):
| (5) |
and
| (6) |
where are the thermal velocity scales. Note that for the sake of clarity the (minor) effect of the polarization interaction, omitted in these equations, is discussed later.
The relation between the electron and ion densities is determined from the charge neutrality condition,
where is the charge number density carried by dust. In starless dense molecular clouds studied in this paper, the dust contribution is negligible as long as the ratio is below a certain value – e.g., for single-size grains of m the neutral density should be less than cm-3 (Umebayashi & Nakano, 1990), for the MRN distribution (Mathis et al., 1977) the approach works at cm-3 (Nakano et al., 2002). Therefore, for the calculations below we set for all three cloud regions, which implies that our results are independent of details of the grain size distribution and demonstrate the generic CR effects on dust charging.
We note that in situations where the dust contribution to the charge neutrality is not negligible, e.g., at higher , the distribution of grain charges is determined by the particular form of which is quite uncertain inside dense molecular clouds (see, e.g., Weingartner & Draine, 2001a; Kim et al., 1994). Some insights into possible forms of the size distribution in such environments can be gained from numerical simulations (see, e.g., Ormel et al., 2009). The role of dust becomes particularly important in dense cores containing protostellar sources, where small grains (the main carriers of negative charge) are abundantly produced due to shock shattering (Guillet et al., 2011).
III.1. “Reference case”: Cold-plasma charging
In the usual approach, the dust charging in cold molecular clouds is caused by collection of electrons and ions from a cold plasma background. The charge distribution in this case is readily obtained by substituting Eqs. (5) and (6) in Eq. (4):
| (7) | |||||
The distribution depends on two dimensionless numbers: The normalized floating potential of the unit charge (or the inverse normalized temperature) , and the effective ion-to-electron mass ratio (or the effective atomic mass number ) determined by the partial contributions of all ions:
where is in units of m, is in units of 10 K, and is the atomic mass number of the th ion species. Both numbers are large: for K and the largest grains of the MRN distribution (m), while for a hydrogen plasma. This implies that (i) the abundance of the state is exponentially small, and (ii) one can neglect unity in the denominators of Eq. (7), so the ratios have a simple universal dependence on temperature and dust size. Furthermore, since , the negatively charged state is at least three orders of magnitude more abundant than the positive one.
Thus, submicron grains in a cold plasma are either neutral or singly negatively charged. For a given temperature, most of the dust smaller than is neutral, while larger grains are mostly negatively charged (for a hydrogen plasma at K, the transition occurs at Å). This simple scaling holds as long as , i.e., for . Larger grains/aggregates (in the micron-size range, or if the temperature increases) become multiply negatively charged; the charge distribution remains narrow, with the average charge about a few .
III.2. Effect of CRs
Figure 2 demonstrates that the CR proton spectrum at lower energies is by many orders of magnitude lower than the electron spectrum. Therefore, the former gives a negligibly small contribution to the collection flux, as compared to the flux of CR electrons. Following the approach by Draine & Salpeter (1979), we calculates the electron collection flux as
| (8) |
where is the sticking coefficient (probability) for impinging CR electrons and is the yield of the secondary electrons (see details in Appendix C). The lower limit of integration is equal to the intersection energy eV, at which the CR electron spectra in Fig. 2 cross the Maxwellian curves.
Note that in Eq. (8), under the integral we omitted the OML factor (see, e.g., Horanyi et al., 1988), which determines the charge dependence of the flux (and leads to Eq. (5) for the Maxwellian spectrum). As shown below, the charge distribution is usually concentrated within ; since the magnitude of the floating potential is meV, while the energy of CR electrons contributing to the charging is eV, the OML correction can be safely neglected and hence does not depend on .
The photoelectric emission flux from a grain is determined by the total specific intensity of the local radiation field, and depends on the photoemission yield (Weingartner et al., 2006) and the absorption efficiency (Draine & Hao, 2002; Draine, 2011). As shown in Fig. 3b, the interstellar UV field (integrated over the frequency range of ) is exponentially attenuated with , and so for all three core regions the local radiation is solely due to the fluorescence generated by CRs. The resulting photoemission flux can be approximately calculated as
where is given by Eq. (3) and is averaged over the Lyman and Werner bands. The latter value may vary for different materials (Weingartner et al., 2006), but this variation is not very significant; for the calculations below we set , which corresponds to a carbonaceous grain of m. Here, the dependence of on is neglected too, since photoelectrons have a broad energy distribution (roughly limited from above by the energy of the UV photons minus the work function, see, e.g., Draine, 1978) and, hence, the floating potential cannot noticeably affect the photoemission flux.
Thus, the CR effect on the charge distribution is determined by the collection flux of CR electrons and the photoemission flux . These fluxes compete, respectively, with the electron and ion fluxes of a cold plasma background and, hence, their relative magnitude can be conveniently quantified by the dimensionless numbers and :
Both numbers do not depend explicitly on [a weak implicit dependence on dust size is via and for and via for ]. From Eqs. (5) and (6) it follows that and , and so the relations to the plasma parameters and the UV flux are given by
| (9) |
The abundances of the singly charged states are straightforwardly derived from Eq. (4),
| (10) | |||||
| (11) |
for the multiply charged states the following recurrent relations are obtained:
| (12) | |||||
| (13) |
Following the estimates in Sec. III.1, the unity was neglected with respect to in these equations (as one can see by comparing with Eq. (7)); for the multiply charged states, we also omitted the exponentially small terms, assuming that .
The charge distribution is slightly modified when the polarization interactions are taken into account (see, e.g., Eqs. (3.3) and (3.4) in Draine & Sutin, 1987): In Eqs. (10) and (11), one has to add the term to the unity in the numerator, and multiply in the denominator with 2. For the multiply charged states (both positive and negative), one needs to replace in the denominator of Eqs. (12) and (13) with the product .
One could also take into account the fact that CR electrons (contribution to the collection flux ) have some finite effective temperature . In this case, the collection flux for and, hence, the r.h.s. of Eq. (13) has to be multiplied with the OML factor , where . As we pointed out above, the energy of CR electrons contributing to the charging is of the order of 10 eV, so is very small ( for the parameters used above) and the resulting effect is indeed negligible.
| model | model | |
|---|---|---|
| model | model |
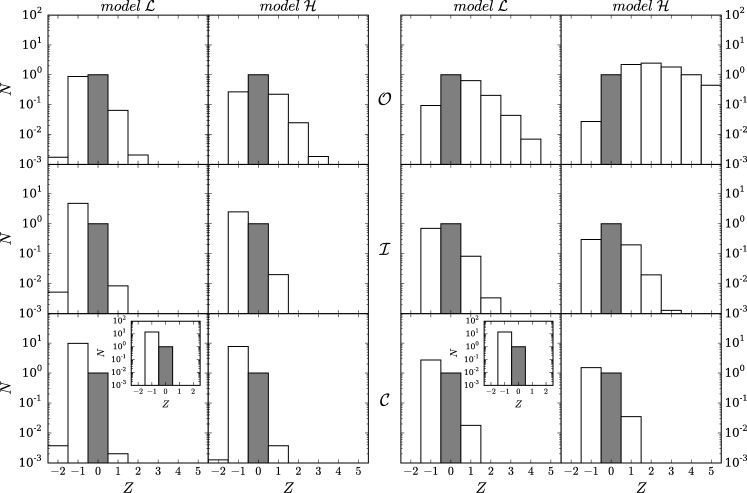
Figure 4 illustrates the CR effect on the charge distribution in different regions of the cloud. The left panel shows calculated for typical plasma density [from Eq. (2)] and parameters determining the magnitude of the CR-generated UV flux [Eq. (3) with and ]. However, both and are known only approximately: The ionization fraction might be a factor of 2–3 lower than that given by Eq. (2) (see, for example, model 1 of Caselli et al., 2002), while the UV flux is approximately doubled for (typical for dark dense clouds, see also Footnote 4). Furthermore, as pointed out in Footnote 3, can exceed the value given by Eq. (3) due to the difference between the ionization and excitation cross sections. As one can see from Eq. (9), a combination of all these uncertainly factors may easily increase the value of by an order of magnitude. Therefore, in the right panel we show for multiplied by 10 (and otherwise the same parameters). The role of CRs in dust charging becomes particularly evident when the obtained results are compared with the “reference” charge distribution depicted in the insets, where the CR effects are neglected.
From Eqs. (12) and (13) we infer that, generally, the asymptotic form of at large is a Poisson distribution : For positive charges, it operates at and is determined by the Poisson parameter (and, analogously, for negative charges).
Table 3 shows that the collection numbers are very small for all considered cases (at least times smaller than ). Therefore, from Eqs. (10) and (12) we conclude that positive charges are not affected by CR collection and have a Poisson distribution for all ; the corresponding Poisson parameter in the region can be as large as and for the models and , respectively (right panel of Fig. 4; for the regions and , ). On the contrary, the photoemission numbers are usually large (, except for the densest case) and the distribution of negative charges is completely dominated by the state , whose abundance is given by Eq. (11); for it abruptly decreases as , with .
We conclude that in all regions of the cloud, the equilibrium charge distribution is governed by a competition between the cold-plasma collection (providing negative charging) and the photoemission due to CR-generated UV field (which leads to positive charging). The effect of photoemission is dominant in the region , quite significant in the region (particularly, in the right panel of Fig. 4), and still noticeable in the densest region . The direct effect of CRs on dust charging – the collection of suprathermal CR electrons – is negligible for all considered situations.
III.3. Dependence on the ion mass and grain size
The results, shown in Fig. 4 for HCO+ ions, remain practically unchanged also for other ions: From Eq. (9) it follows that , and therefore the charge distribution for [Eqs. (10) and (12)] does not depend on as long as , i.e., for all considered cases. For [Eqs. (11) and (13)], the distribution is unchanged when . From Table 3 we see that this condition is only violated in the densest region with the “typical” parameters (left panel of Fig. 4), where .
Using the same consideration, one can also obtain the dependence of on the grain size: From Eqs. (10) and (12) we see that, as long as , the relative abundance of the positively charged states varies as . Similar to the dependence on , the distribution of negative charges depends on only in the region , where ; in the regions and , the size dependence sets in when the term , neglected in Eq. (13) [see last Eq. (7)], becomes comparable to . The latter occurs for sizes which are larger than the upper cutoff of the MRN distribution.
By employing these simple scaling relations and using the examples presented in Fig. 4, one can easily deduce the form of for arbitrary plasma composition and grain size.
III.4. Implications
Knowing the charge distribution on dust grains in dense molecular clouds is important for several reasons: The charges modify the cross sections of the ion accretion on dust, thus critically changing the surface chemistry, influencing the formation of grain mantles, etc. For the same reason, the charges change the total energy balance of grains and, hence, may alter the equilibrium temperature. However, the most profound effect can be on the rate of dust coagulation (Dominik et al., 2007). Let us briefly elaborate on this important point.
Using the derived charge distributions, one can identify the “optimum” balance between the positive and negative charges, for which the rate of dust coagulation is maximized. Conditions for such balance is particularly easy to obtain when the distribution of positive charges monotonously decreases with (i.e., when ). The coagulation rate in this case is maximized when . For and (see Table 3), from Eqs. (10) and (11) we obtain the “optimum” relation: .
Remarkably, the optimum relation becomes size-independent at late stages of dust coagulation: When the resulting clusters grow well beyond the upper cutoff size of the MRN distribution, so that , one has to replace with unity [neglected in Eqs. (10) and (11)]. This yields
Furthermore, since , the coagulation optimum does not depend on the plasma composition either and, hence, is universal. As one can see from Table 3, the optimum is attained somewhere between the regions and , which corresponds to the densities between cm-3 and cm-3.
The existence of the coagulation optimum is in striking contrast with the case of pure plasma charging, where growing negative charges on clusters inhibit their further coagulation (Okuzumi, 2009). Thus, CRs can provide ideal conditions for a rapid dust coagulation in cold dense molecular clouds. We will discuss this important effect in a separate paper.
IV. Conclusions
The aim of this paper is to demonstrate that CRs strongly affect charging of dust grains in cold dense molecular clouds.
We calculated the local (propagated) CR spectra for three characteristic regions of a dense core, and investigated the two mechanisms of dust charging that have been ignored so far: collection of suprathermal CR electrons and protons by grains (adding to the cold Maxwellian plasma collection), and photoelectric emission from grains due to the CR-generated UV field. While the former mechanism turns out to be always negligible, the photoemission is shown to dramatically modify the charge distribution for submicron grains in the almost entire cloud (as compared to the “reference case” of cold-plasma charging). The competition between the cold-plasma collection (producing, primarily, singly charged negative grains) and the photoemission (resulting in positive charging) significantly broadens the charge distribution.
The relative magnitude of the CR-induced photoemission is quantified by the dimensionless number . This number depends on several physical parameters, some of them being only approximately known. The mains sources of uncertainty are the values of the ionization fraction and the CR-induced UV flux : As we pointed out in Sec. III.2, the uncertainty in is mainly due to competition between different recombination processes, while , in turn, is determined by (approximately known) dust albedo, extinction slope, and photoemission yield, as well as by (partially unknown) excitation rates. To take all these factors into account, in Fig. 4 we presented two sets of plots showing the dust charge distribution: The left and right panels correspond to the expected “typical” and “maximum” values of and, thus, demonstrate the extent to which the integral effect of uncertainties may affect the final results.
Our results have several important implications. The shown modification of the grain charge distribution considerably changes the rates of ion accretion on dust, which in turn can critically change the surface chemistry, alter the total energy balance of grains, influence the formation of icy mantles, etc. These CR effects are particularly strong in the outer regions of the core, where the charge distribution is dominated by positive grains and, hence, the accretion of negatively charged ions should be drastically reduced.
The most profound effect of CRs is expected to occur for the rate of dust coagulation: When the cold-plasma collection is the only charging mechanism operating in a cloud, the average (negative) dust charge increases proportionally to the size. Therefore, the growing Coulomb repulsion inhibits coagulation of larger (m) aggregates. Here we showed that the competition between the cold-plasma collection and photoemission can create approximately equal abundance of positively and negatively charged dust, providing “optimum” conditions for coagulations. The derived optimum is size-independent for large dust, which enables the growth of big aggregates.
The presented results are obtained assuming that charged dust does not affect the overall charge neutrality in a cloud. Although this assumption can be violated for sufficiently dense regions, our approach can be straightforwardly extended to this case as well, provided the dust size distribution is known. Furthermore, the described effects of CRs are of generic nature, and are expected to operate not only in dense molecular clouds but also in the upper layers and the outer parts of protoplanetary discs, where mutual sticking of dust aggregates is the essential process toward planetesimal formation.
The authors would like to thank the referee A. Jones for providing helpful and constructive comments and suggestions. The authors also acknowledge Malcolm Walmsley for critical reading of the manuscript and helpful comments. MP acknowledges the support of the OCEVU Labex (ANR-11-LABX-0060) and the A*MIDEX project (ANR-11-IDEX-0001-02) funded by the “Investissements d’Avenir” French government programme managed by the ANR. MP and DG also acknowledge the support of the CNRS-INAF PICS project “Pulsar wind nebulae, supernova remnants and the origin of cosmic rays”. PC acknowledges support from the European Research Council (ERC, project PALs 320620).
Appendix A Appendix A
Coulomb loss functions
In order to combine the propagated CR spectra obtained in Padovani et al. (2009) with the cold Maxwellian plasma background, the energy loss functions (plotted in Fig. 7 of Padovani et al., 2009) have to be extended to lower energies (down to about 1 meV), to include Coulomb losses that dominate in this energy range. The Coulomb loss term, , is parameterized for protons by Schlickeiser (2002) as
where is the ionization fraction, the proton energy (in eV) is supposed to exceed . For Coulomb electron losses, we used the analytic fit by Swartz et al. (1971),
Dense cores have typical temperatures of about 10 K, so eV. Figure 5 shows the energy loss functions from Padovani et al. (2009) with the Coulomb terms included, assuming an average ionization fraction of .
Appendix B Appendix B
Specific intensity of secondary electrons
After crossing a column density in medium of density , an electron of energy and velocity has lost an energy , where is the energy loss function of electrons,
| (B1) |
(and similarly for protons). The column density required to stop an electron of the initial energy ,
has a constant value cm-2 up to keV (see Fig. 8 in Padovani et al., 2009), and then increases weakly with energy. This short range of secondary electrons, in comparison with typical column densities of molecular clouds ( cm-2) justifies a local treatment of ionization. In this “on-the-spot” approximation, the stopping time of secondary electrons is
| (B2) |
and their stopping range is .
Assuming isotropy, the number of first-generation secondary electrons of energy (per unit energy, volume and time) is calculated as
where eV is the ionization potential of H2, is the intensity of primary species , and is the corresponding differential ionization cross section. The number of secondary electrons produced per unit energy and volume is then
This quantity is related to the specific intensity of secondary electrons (number of electrons per unit energy, area, time and solid angle) by , which finally yields
| (B3) |
Equation (B3) is iterated, to compute intensities for the next generations of secondary electrons.
Appendix C Appendix C
Electron sticking probability and secondary emission yield
Following Draine & Salpeter (1979), we set the sticking probability equal to unity if the electron stopping range (in the dust material) is smaller than , otherwise . The transition energy varies with dust size as ; for sub-micron grains, m, the transition occurs at keV. The electron trapping by small (PAH) grains was calculated by Micelotta et al. (2010).
The secondary emission yield is obtained by averaging over the velocity distributions of the emitted electrons, which are believed to be broad (non-Maxwellian), decaying as at large energies (Draine & Salpeter, 1979). For a positively charged dust the explicit dependence on is approximated by , where eV. This factor can be neglected using the same reasoning as for the OML correction factor omitted in Eq. (8). For the dependence on we employ the Sternglass formula (Horanyi et al., 1988),
where the value of is typically between 1.5 and 2.5, and keV (Draine & Salpeter, 1979). Note that has a finite-size correction at large , which increases the yield by a factor of .
References
- Aguilar et al. (2014) Aguilar, M., Aisa, D., Alvino, A., et al. 2014, Physical Review Letters, 113, 121102
- Aguilar et al. (2015) Aguilar, M., Aisa, D., Alpat, B., et al. 2015, Physical Review Letters, 114, 171103
- Alves et al. (2001) Alves, J. F., Lada, C. J., & Lada, E. A. 2001, Nature, 409, 159
- André et al. (2014) André, P., Di Francesco, J., Ward-Thompson, D., et al. 2014, Protostars and Planets VI, 27
- Bakes & Tielens (1994) Bakes, E. L. O., & Tielens, A. G. G. M. 1994, ApJ, 427, 822
- Blumenthal & Gould (1970) Blumenthal, G. R., & Gould, R. J. 1970, Reviews of Modern Physics, 42, 237
- Bonnor (1956) Bonnor, W. B. 1956, MNRAS, 116, 351
- Burlaga & Ness (2014) Burlaga, L. F., & Ness, N. F. 2014, ApJ, 795, L19
- Caselli et al. (1998) Caselli, P., Walmsley, C. M., Terzieva, R., & Herbst, E. 1998, ApJ, 499, 234
- Caselli et al. (2002) Caselli, P., Walmsley, C. M., Zucconi, A., et al. 2002, ApJ, 565, 344
- Cecchi-Pestellini & Aiello (1992) Cecchi-Pestellini, C., & Aiello, S. 1992, MNRAS, 258, 125
- Dominik et al. (2007) Dominik, C., Blum, J., Cuzzi, J. N., & Wurm, G. 2007, Protostars and Planets V, 783
- Draine (1978) Draine, B. T. 1978, ApJS, 36, 595
- Draine (2011) —. 2011, Physics of the Interstellar and Intergalactic Medium (Princeton University Press)
- Draine & Hao (2002) Draine, B. T., & Hao, L. 2002, ApJ, 569, 780
- Draine & Salpeter (1979) Draine, B. T., & Salpeter, E. E. 1979, ApJ, 231, 77
- Draine & Sutin (1987) Draine, B. T., & Sutin, B. 1987, ApJ, 320, 803
- Ebert (1955) Ebert, R. 1955, ZAp, 37, 217
- Elmegreen (1979) Elmegreen, B. G. 1979, ApJ, 232, 729
- Fortov et al. (2005) Fortov, V. E., Ivlev, A. V., Khrapak, S. A., Khrapak, A. G., & Morfill, G. E. 2005, Phys. Rep., 421, 1
- Gordon (2004) Gordon, K. D. 2004, in Astronomical Society of the Pacific Conference Series, Vol. 309, Astrophysics of Dust, ed. A. N. Witt, G. C. Clayton, & B. T. Draine, 77
- Guillet et al. (2011) Guillet, V., Pineau Des Forêts, G., & Jones, A. P. 2011, A&A, 527, A123
- Horanyi et al. (1988) Horanyi, M., Houpis, H. L. F., & Mendis, D. A. 1988, Ap&SS, 144, 215
- Indriolo & McCall (2012) Indriolo, N., & McCall, B. J. 2012, ApJ, 745, 91
- Kamae et al. (2006) Kamae, T., Karlsson, N., Mizuno, T., Abe, T., & Koi, T. 2006, ApJ, 647, 692
- Keto & Caselli (2008) Keto, E., & Caselli, P. 2008, ApJ, 683, 238
- Keto & Caselli (2010) —. 2010, MNRAS, 402, 1625
- Kim et al. (1994) Kim, S.-H., Martin, P. G., & Hendry, P. D. 1994, ApJ, 422, 164
- Maret & Bergin (2007) Maret, S., & Bergin, E. A. 2007, ApJ, 664, 956
- Mathis et al. (1977) Mathis, J. S., Rumpl, W., & Nordsieck, K. H. 1977, ApJ, 217, 425
- McKee (1989) McKee, C. F. 1989, ApJ, 345, 782
- Mestel & Spitzer (1956) Mestel, L., & Spitzer, Jr., L. 1956, MNRAS, 116, 503
- Micelotta et al. (2010) Micelotta, E. R., Jones, A. P., & Tielens, A. G. G. M. 2010, A&A, 510, A37
- Morlino & Gabici (2015) Morlino, G., & Gabici, S. 2015, MNRAS, 451, L100
- Nakano et al. (2002) Nakano, T., Nishi, R., & Umebayashi, T. 2002, ApJ, 573, 199
- Nishi et al. (1991) Nishi, R., Nakano, T., & Umebayashi, T. 1991, ApJ, 368, 181
- Okuzumi (2009) Okuzumi, S. 2009, ApJ, 698, 1122
- Oppenheimer & Dalgarno (1974) Oppenheimer, M., & Dalgarno, A. 1974, ApJ, 192, 29
- Ormel et al. (2009) Ormel, C. W., Paszun, D., Dominik, C., & Tielens, A. G. G. M. 2009, A&A, 502, 845
- Padovani & Galli (2011) Padovani, M., & Galli, D. 2011, A&A, 530, A109
- Padovani et al. (2009) Padovani, M., Galli, D., & Glassgold, A. E. 2009, A&A, 501, 619
- Padovani et al. (2014) Padovani, M., Galli, D., Hennebelle, P., Commerçon, B., & Joos, M. 2014, A&A, 571, A33
- Padovani et al. (2013) Padovani, M., Hennebelle, P., & Galli, D. 2013, A&A, 560, A114
- Putze et al. (2011) Putze, A., Maurin, D., & Donato, F. 2011, A&A, 526, A101
- Roman-Duval et al. (2010) Roman-Duval, J., Jackson, J. M., Heyer, M., Rathborne, J., & Simon, R. 2010, ApJ, 723, 492
- Scherer et al. (2008) Scherer, K., Fichtner, H., Ferreira, S. E. S., Büsching, I., & Potgieter, M. S. 2008, ApJ, 680, L105
- Schlickeiser (2002) Schlickeiser, R. 2002, Cosmic Ray Astrophysics (Berlin: Springer)
- Shchekinov (2007) Shchekinov, Y. 2007, Astronomical and Astrophysical Transactions, 26, 227
- Shu et al. (2006) Shu, F. H., Galli, D., Lizano, S., & Cai, M. 2006, ApJ, 647, 382
- Spitzer (1941) Spitzer, Jr., L. 1941, ApJ, 93, 369
- Stone et al. (2013) Stone, E. C., Cummings, A. C., McDonald, F. B., et al. 2013, Science, 341, 150
- Swartz et al. (1971) Swartz, W. E., Nisbet, J. S., & Green, A. E. S. 1971, J. Geophys. Res., 76, 8425
- Tafalla et al. (2002) Tafalla, M., Myers, P. C., Caselli, P., Walmsley, C. M., & Comito, C. 2002, ApJ, 569, 815
- Umebayashi & Nakano (1980) Umebayashi, T., & Nakano, T. 1980, PASJ, 32, 405
- Umebayashi & Nakano (1990) —. 1990, MNRAS, 243, 103
- Wardle & Ng (1999) Wardle, M., & Ng, C. 1999, MNRAS, 303, 239
- Watson (1974) Watson, W. D. 1974, ApJ, 188, 35
- Webber (1998) Webber, W. R. 1998, ApJ, 506, 329
- Weingartner & Draine (2001a) Weingartner, J. C., & Draine, B. T. 2001a, ApJ, 548, 296
- Weingartner & Draine (2001b) —. 2001b, ApJS, 134, 263
- Weingartner et al. (2006) Weingartner, J. C., Draine, B. T., & Barr, D. K. 2006, ApJ, 645, 1188
- Whipple (1981) Whipple, E. C. 1981, Reports on Progress in Physics, 44, 1197