Ellerman bombs at high resolution III. Simultaneous observations with IRIS and SST
Abstract
Ellerman bombs are transient brightenings of the extended wings of the solar Balmer lines in emerging active regions. We describe their properties in the ultraviolet lines sampled by the Interface Region Imaging Spectrograph (IRIS), using simultaneous imaging spectroscopy in H with the Swedish 1-m Solar Telescope (SST) and ultraviolet images from the Solar Dynamics Observatory for Ellerman bomb detection and identification. We select multiple co-observed Ellerman bombs for detailed analysis. The IRIS spectra strengthen the view that Ellerman bombs mark reconnection between bipolar kilogauss fluxtubes with the reconnection and the resulting bi-directional jet located within the solar photosphere and shielded by overlying chromospheric fibrils in the cores of strong lines. The spectra suggest that the reconnecting photospheric gas underneath is heated sufficiently to momentarily reach stages of ionization normally assigned to the transition region and the corona. We also analyze similar outburst phenomena that we classify as small flaring arch filaments and ascribe to higher-located reconnection. They have different morphology and produce hot arches in million-Kelvin diagnostics.
Subject headings:
Sun: activity – Sun: atmosphere – Sun: magnetic fields1. Introduction
Ellerman (1917) discovered intense short-lived brightenings of the extended wings of the Balmer H line at 6563 Å that he called “solar hydrogen bombs”. They are called Ellerman bombs (henceforth EB) since McMath et al. (1960). For more detail we refer to the excellent summary by Georgoulis et al. (2002) and our more recent review of the extensive \HyColor@XZeroOneThreeFour\pc@goptd@color\pc@hyenc@colorpdfcommentcolor\HyColor@XZeroOneThreeFour\pc@goptd@fontcolor\pc@hyenc@fontcolorpdfcommentcolor\HyColor@XZeroOneThreeFour\pc@goptd@icolor\pc@hyenc@icolorpdfcommentcolor\pdfmark[EB]pdfmark=/ANN,Subtype=/Widget,Raw=/TU (Ellerman bomb\textCR(\pc@goptd@deadline)) /T (tooltip zref@0) /C [ ] /FT/Btn /F 768 /Ff 65536 /H/N /BS ¡¡ /W 0 ¿¿ literature in Rutten et al. (2013).
We discuss the subsequent \HyColor@XZeroOneThreeFour\pc@goptd@color\pc@hyenc@colorpdfcommentcolor\HyColor@XZeroOneThreeFour\pc@goptd@fontcolor\pc@hyenc@fontcolorpdfcommentcolor\HyColor@XZeroOneThreeFour\pc@goptd@icolor\pc@hyenc@icolorpdfcommentcolor\pdfmark[EB]pdfmark=/ANN,Subtype=/Widget,Raw=/TU (Ellerman bomb\textCR(\pc@goptd@deadline)) /T (tooltip zref@1) /C [ ] /FT/Btn /F 768 /Ff 65536 /H/N /BS ¡¡ /W 0 ¿¿ literature below, but here point out the recent discovery by Peter et al. (2014) of very hot “bombs” in ultraviolet spectra from the Interface Region Imaging Spectrograph (IRIS, De Pontieu et al. 2014). The present paper addresses their suggestion that these bombs might have been \HyColor@XZeroOneThreeFour\pc@goptd@color\pc@hyenc@colorpdfcommentcolor\HyColor@XZeroOneThreeFour\pc@goptd@fontcolor\pc@hyenc@fontcolorpdfcommentcolor\HyColor@XZeroOneThreeFour\pc@goptd@icolor\pc@hyenc@icolorpdfcommentcolor\pdfmark[EB]pdfmark=/ANN,Subtype=/Widget,Raw=/TU (Ellerman bomb\textCR(\pc@goptd@deadline)) /T (tooltip zref@2) /C [ ] /FT/Btn /F 768 /Ff 65536 /H/N /BS ¡¡ /W 0 ¿¿ s or similar to \HyColor@XZeroOneThreeFour\pc@goptd@color\pc@hyenc@colorpdfcommentcolor\HyColor@XZeroOneThreeFour\pc@goptd@fontcolor\pc@hyenc@fontcolorpdfcommentcolor\HyColor@XZeroOneThreeFour\pc@goptd@icolor\pc@hyenc@icolorpdfcommentcolor\pdfmark[EB]pdfmark=/ANN,Subtype=/Widget,Raw=/TU (Ellerman bomb\textCR(\pc@goptd@deadline)) /T (tooltip zref@3) /C [ ] /FT/Btn /F 768 /Ff 65536 /H/N /BS ¡¡ /W 0 ¿¿ s.
A major motivation to study \HyColor@XZeroOneThreeFour\pc@goptd@color\pc@hyenc@colorpdfcommentcolor\HyColor@XZeroOneThreeFour\pc@goptd@fontcolor\pc@hyenc@fontcolorpdfcommentcolor\HyColor@XZeroOneThreeFour\pc@goptd@icolor\pc@hyenc@icolorpdfcommentcolor\pdfmark[EB]pdfmark=/ANN,Subtype=/Widget,Raw=/TU (Ellerman bomb\textCR(\pc@goptd@deadline)) /T (tooltip zref@4) /C [ ] /FT/Btn /F 768 /Ff 65536 /H/N /BS ¡¡ /W 0 ¿¿ s is that they supposedly mark locations of serpentine flux rope emergence in newly emerging active regions (e.g., Bernasconi et al. 2002; Pariat et al. 2004; Isobe et al. 2007; Archontis & Hood 2009; Pariat et al. 2009). Understanding their nature may therefore present a way to measure active region evolution, in particular the reconnective field topography evolution that eventually produces much larger solar outbursts. In this context, \HyColor@XZeroOneThreeFour\pc@goptd@color\pc@hyenc@colorpdfcommentcolor\HyColor@XZeroOneThreeFour\pc@goptd@fontcolor\pc@hyenc@fontcolorpdfcommentcolor\HyColor@XZeroOneThreeFour\pc@goptd@icolor\pc@hyenc@icolorpdfcommentcolor\pdfmark[EB]pdfmark=/ANN,Subtype=/Widget,Raw=/TU (Ellerman bomb\textCR(\pc@goptd@deadline)) /T (tooltip zref@5) /C [ ] /FT/Btn /F 768 /Ff 65536 /H/N /BS ¡¡ /W 0 ¿¿ s should become useful as telltales of strong-field reconnection when well understood.
In addition, the complex physics and spectrum formation of the \HyColor@XZeroOneThreeFour\pc@goptd@color\pc@hyenc@colorpdfcommentcolor\HyColor@XZeroOneThreeFour\pc@goptd@fontcolor\pc@hyenc@fontcolorpdfcommentcolor\HyColor@XZeroOneThreeFour\pc@goptd@icolor\pc@hyenc@icolorpdfcommentcolor\pdfmark[EB]pdfmark=/ANN,Subtype=/Widget,Raw=/TU (Ellerman bomb\textCR(\pc@goptd@deadline)) /T (tooltip zref@6) /C [ ] /FT/Btn /F 768 /Ff 65536 /H/N /BS ¡¡ /W 0 ¿¿ phenomenon are of interest per sé since \HyColor@XZeroOneThreeFour\pc@goptd@color\pc@hyenc@colorpdfcommentcolor\HyColor@XZeroOneThreeFour\pc@goptd@fontcolor\pc@hyenc@fontcolorpdfcommentcolor\HyColor@XZeroOneThreeFour\pc@goptd@icolor\pc@hyenc@icolorpdfcommentcolor\pdfmark[EB]pdfmark=/ANN,Subtype=/Widget,Raw=/TU (Ellerman bomb\textCR(\pc@goptd@deadline)) /T (tooltip zref@7) /C [ ] /FT/Btn /F 768 /Ff 65536 /H/N /BS ¡¡ /W 0 ¿¿ s appear to be pockets of hot gas within the photosphere. The discovery of extremely hot \HyColor@XZeroOneThreeFour\pc@goptd@color\pc@hyenc@colorpdfcommentcolor\HyColor@XZeroOneThreeFour\pc@goptd@fontcolor\pc@hyenc@fontcolorpdfcommentcolor\HyColor@XZeroOneThreeFour\pc@goptd@icolor\pc@hyenc@icolorpdfcommentcolor\pdfmark[IRIS]pdfmark=/ANN,Subtype=/Widget,Raw=/TU (Interface Region Imaging Spectrograph\textCR(\pc@goptd@deadline)) /T (tooltip zref@8) /C [ ] /FT/Btn /F 768 /Ff 65536 /H/N /BS ¡¡ /W 0 ¿¿ bombs by Peter et al. (2014) that also appear to be photospheric enhances this interest. In our present series of \HyColor@XZeroOneThreeFour\pc@goptd@color\pc@hyenc@colorpdfcommentcolor\HyColor@XZeroOneThreeFour\pc@goptd@fontcolor\pc@hyenc@fontcolorpdfcommentcolor\HyColor@XZeroOneThreeFour\pc@goptd@icolor\pc@hyenc@icolorpdfcommentcolor\pdfmark[EB]pdfmark=/ANN,Subtype=/Widget,Raw=/TU (Ellerman bomb\textCR(\pc@goptd@deadline)) /T (tooltip zref@9) /C [ ] /FT/Btn /F 768 /Ff 65536 /H/N /BS ¡¡ /W 0 ¿¿ analyses we employ high-quality imaging spectroscopy with the Swedish 1-m Solar Telescope (SST; Scharmer et al. 2003) to study \HyColor@XZeroOneThreeFour\pc@goptd@color\pc@hyenc@colorpdfcommentcolor\HyColor@XZeroOneThreeFour\pc@goptd@fontcolor\pc@hyenc@fontcolorpdfcommentcolor\HyColor@XZeroOneThreeFour\pc@goptd@icolor\pc@hyenc@icolorpdfcommentcolor\pdfmark[EB]pdfmark=/ANN,Subtype=/Widget,Raw=/TU (Ellerman bomb\textCR(\pc@goptd@deadline)) /T (tooltip zref@10) /C [ ] /FT/Btn /F 768 /Ff 65536 /H/N /BS ¡¡ /W 0 ¿¿ s at unprecedented spatial, spectral, and temporal resolution. Paper I (Watanabe et al. 2011) established that \HyColor@XZeroOneThreeFour\pc@goptd@color\pc@hyenc@colorpdfcommentcolor\HyColor@XZeroOneThreeFour\pc@goptd@fontcolor\pc@hyenc@fontcolorpdfcommentcolor\HyColor@XZeroOneThreeFour\pc@goptd@icolor\pc@hyenc@icolorpdfcommentcolor\pdfmark[EB]pdfmark=/ANN,Subtype=/Widget,Raw=/TU (Ellerman bomb\textCR(\pc@goptd@deadline)) /T (tooltip zref@11) /C [ ] /FT/Btn /F 768 /Ff 65536 /H/N /BS ¡¡ /W 0 ¿¿ s are a purely photospheric phenomenon.
Paper II (Vissers et al. 2013) added evidence that \HyColor@XZeroOneThreeFour\pc@goptd@color\pc@hyenc@colorpdfcommentcolor\HyColor@XZeroOneThreeFour\pc@goptd@fontcolor\pc@hyenc@fontcolorpdfcommentcolor\HyColor@XZeroOneThreeFour\pc@goptd@icolor\pc@hyenc@icolorpdfcommentcolor\pdfmark[EB]pdfmark=/ANN,Subtype=/Widget,Raw=/TU (Ellerman bomb\textCR(\pc@goptd@deadline)) /T (tooltip zref@12) /C [ ] /FT/Btn /F 768 /Ff 65536 /H/N /BS ¡¡ /W 0 ¿¿ s mark magnetic reconnection of strong opposite-polarity field concentrations in the low photosphere and discussed their appearance in 1700 Å images from the Atmospheric Imaging Assembly (AIA; Lemen et al. 2012) of the Solar Dynamics Observatory (SDO).
Let us morphologically define the three bomb-like phenomena that we discuss below, based on our inspections of dozens of such features in \HyColor@XZeroOneThreeFour\pc@goptd@color\pc@hyenc@colorpdfcommentcolor\HyColor@XZeroOneThreeFour\pc@goptd@fontcolor\pc@hyenc@fontcolorpdfcommentcolor\HyColor@XZeroOneThreeFour\pc@goptd@icolor\pc@hyenc@icolorpdfcommentcolor\pdfmark[SST]pdfmark=/ANN,Subtype=/Widget,Raw=/TU (Swedish 1-m Solar Telescope\textCR(\pc@goptd@deadline)) /T (tooltip zref@13) /C [ ] /FT/Btn /F 768 /Ff 65536 /H/N /BS ¡¡ /W 0 ¿¿ , \HyColor@XZeroOneThreeFour\pc@goptd@color\pc@hyenc@colorpdfcommentcolor\HyColor@XZeroOneThreeFour\pc@goptd@fontcolor\pc@hyenc@fontcolorpdfcommentcolor\HyColor@XZeroOneThreeFour\pc@goptd@icolor\pc@hyenc@icolorpdfcommentcolor\pdfmark[SDO]pdfmark=/ANN,Subtype=/Widget,Raw=/TU (Solar Dynamics Observatory\textCR(\pc@goptd@deadline)) /T (tooltip zref@14) /C [ ] /FT/Btn /F 768 /Ff 65536 /H/N /BS ¡¡ /W 0 ¿¿ , and \HyColor@XZeroOneThreeFour\pc@goptd@color\pc@hyenc@colorpdfcommentcolor\HyColor@XZeroOneThreeFour\pc@goptd@fontcolor\pc@hyenc@fontcolorpdfcommentcolor\HyColor@XZeroOneThreeFour\pc@goptd@icolor\pc@hyenc@icolorpdfcommentcolor\pdfmark[IRIS]pdfmark=/ANN,Subtype=/Widget,Raw=/TU (Interface Region Imaging Spectrograph\textCR(\pc@goptd@deadline)) /T (tooltip zref@15) /C [ ] /FT/Btn /F 768 /Ff 65536 /H/N /BS ¡¡ /W 0 ¿¿ data. More detail on their recognition is given in Sect. 2.
We define “Ellerman bombs” (EB) as substantial brightenings of the extended wings of H without core brightening that, at sufficient angular and temporal resolution, show definite rapid-flame morphology when viewed from aside as described in Paper I. \HyColor@XZeroOneThreeFour\pc@goptd@color\pc@hyenc@colorpdfcommentcolor\HyColor@XZeroOneThreeFour\pc@goptd@fontcolor\pc@hyenc@fontcolorpdfcommentcolor\HyColor@XZeroOneThreeFour\pc@goptd@icolor\pc@hyenc@icolorpdfcommentcolor\pdfmark[EB]pdfmark=/ANN,Subtype=/Widget,Raw=/TU (Ellerman bomb\textCR(\pc@goptd@deadline)) /T (tooltip zref@16) /C [ ] /FT/Btn /F 768 /Ff 65536 /H/N /BS ¡¡ /W 0 ¿¿ H wing brightenings exceed those from much more ubiquitous magnetic concentrations that happen to also appear bright in the H wings (“pseudo-EBs”, Rutten et al. 2013).
Next, we define “flaring arch filaments” (henceforth FAFs) as sudden fierce brightenings in \HyColor@XZeroOneThreeFour\pc@goptd@color\pc@hyenc@colorpdfcommentcolor\HyColor@XZeroOneThreeFour\pc@goptd@fontcolor\pc@hyenc@fontcolorpdfcommentcolor\HyColor@XZeroOneThreeFour\pc@goptd@icolor\pc@hyenc@icolorpdfcommentcolor\pdfmark[AIA]pdfmark=/ANN,Subtype=/Widget,Raw=/TU (Atmospheric Imaging Assembly\textCR(\pc@goptd@deadline)) /T (tooltip zref@17) /C [ ] /FT/Btn /F 768 /Ff 65536 /H/N /BS ¡¡ /W 0 ¿¿ 1600 Å image sequences that differ from the \HyColor@XZeroOneThreeFour\pc@goptd@color\pc@hyenc@colorpdfcommentcolor\HyColor@XZeroOneThreeFour\pc@goptd@fontcolor\pc@hyenc@fontcolorpdfcommentcolor\HyColor@XZeroOneThreeFour\pc@goptd@icolor\pc@hyenc@icolorpdfcommentcolor\pdfmark[EB]pdfmark=/ANN,Subtype=/Widget,Raw=/TU (Ellerman bomb\textCR(\pc@goptd@deadline)) /T (tooltip zref@18) /C [ ] /FT/Btn /F 768 /Ff 65536 /H/N /BS ¡¡ /W 0 ¿¿ brightenings also seen in this \HyColor@XZeroOneThreeFour\pc@goptd@color\pc@hyenc@colorpdfcommentcolor\HyColor@XZeroOneThreeFour\pc@goptd@fontcolor\pc@hyenc@fontcolorpdfcommentcolor\HyColor@XZeroOneThreeFour\pc@goptd@icolor\pc@hyenc@icolorpdfcommentcolor\pdfmark[AIA]pdfmark=/ANN,Subtype=/Widget,Raw=/TU (Atmospheric Imaging Assembly\textCR(\pc@goptd@deadline)) /T (tooltip zref@19) /C [ ] /FT/Btn /F 768 /Ff 65536 /H/N /BS ¡¡ /W 0 ¿¿ channel by appearing with shorter duration and more abrupt changes, having elongated morphology, and showing fast apparent brightness motion along filamentary strands. Because they are usually much less evident in \HyColor@XZeroOneThreeFour\pc@goptd@color\pc@hyenc@colorpdfcommentcolor\HyColor@XZeroOneThreeFour\pc@goptd@fontcolor\pc@hyenc@fontcolorpdfcommentcolor\HyColor@XZeroOneThreeFour\pc@goptd@icolor\pc@hyenc@icolorpdfcommentcolor\pdfmark[AIA]pdfmark=/ANN,Subtype=/Widget,Raw=/TU (Atmospheric Imaging Assembly\textCR(\pc@goptd@deadline)) /T (tooltip zref@20) /C [ ] /FT/Btn /F 768 /Ff 65536 /H/N /BS ¡¡ /W 0 ¿¿ 1700 Å images, their 1600 Å appearance is likely due to brightening of the C iv doublet at 1548 and 1550 Å in \HyColor@XZeroOneThreeFour\pc@goptd@color\pc@hyenc@colorpdfcommentcolor\HyColor@XZeroOneThreeFour\pc@goptd@fontcolor\pc@hyenc@fontcolorpdfcommentcolor\HyColor@XZeroOneThreeFour\pc@goptd@icolor\pc@hyenc@icolorpdfcommentcolor\pdfmark[AIA]pdfmark=/ANN,Subtype=/Widget,Raw=/TU (Atmospheric Imaging Assembly\textCR(\pc@goptd@deadline)) /T (tooltip zref@21) /C [ ] /FT/Btn /F 768 /Ff 65536 /H/N /BS ¡¡ /W 0 ¿¿ ’s 1600 Å passband. Their filamentary morphology and rapid evolution suggest that these are heating events, likely reconnection, that take place along the fibrilar canopy seen e.g., at H line center, or eject heated matter along chromospheric field lines.
Finally, we define “IRIS bombs” (henceforth IBs) following Peter et al. (2014) as ultraviolet brightenings with substantial emission in the Si iv lines observed by \HyColor@XZeroOneThreeFour\pc@goptd@color\pc@hyenc@colorpdfcommentcolor\HyColor@XZeroOneThreeFour\pc@goptd@fontcolor\pc@hyenc@fontcolorpdfcommentcolor\HyColor@XZeroOneThreeFour\pc@goptd@icolor\pc@hyenc@icolorpdfcommentcolor\pdfmark[IRIS]pdfmark=/ANN,Subtype=/Widget,Raw=/TU (Interface Region Imaging Spectrograph\textCR(\pc@goptd@deadline)) /T (tooltip zref@22) /C [ ] /FT/Btn /F 768 /Ff 65536 /H/N /BS ¡¡ /W 0 ¿¿ , and showing these with very wide and complex non-Gaussian profiles on which deep absorption blends of lower metal ionization stages are superimposed.
The visibility of \HyColor@XZeroOneThreeFour\pc@goptd@color\pc@hyenc@colorpdfcommentcolor\HyColor@XZeroOneThreeFour\pc@goptd@fontcolor\pc@hyenc@fontcolorpdfcommentcolor\HyColor@XZeroOneThreeFour\pc@goptd@icolor\pc@hyenc@icolorpdfcommentcolor\pdfmark[EB]pdfmark=/ANN,Subtype=/Widget,Raw=/TU (Ellerman bomb\textCR(\pc@goptd@deadline)) /T (tooltip zref@23) /C [ ] /FT/Btn /F 768 /Ff 65536 /H/N /BS ¡¡ /W 0 ¿¿ s in \HyColor@XZeroOneThreeFour\pc@goptd@color\pc@hyenc@colorpdfcommentcolor\HyColor@XZeroOneThreeFour\pc@goptd@fontcolor\pc@hyenc@fontcolorpdfcommentcolor\HyColor@XZeroOneThreeFour\pc@goptd@icolor\pc@hyenc@icolorpdfcommentcolor\pdfmark[AIA]pdfmark=/ANN,Subtype=/Widget,Raw=/TU (Atmospheric Imaging Assembly\textCR(\pc@goptd@deadline)) /T (tooltip zref@24) /C [ ] /FT/Btn /F 768 /Ff 65536 /H/N /BS ¡¡ /W 0 ¿¿ ’s 1700 Å images and the wonderful full-time full-disk availability of \HyColor@XZeroOneThreeFour\pc@goptd@color\pc@hyenc@colorpdfcommentcolor\HyColor@XZeroOneThreeFour\pc@goptd@fontcolor\pc@hyenc@fontcolorpdfcommentcolor\HyColor@XZeroOneThreeFour\pc@goptd@icolor\pc@hyenc@icolorpdfcommentcolor\pdfmark[SDO]pdfmark=/ANN,Subtype=/Widget,Raw=/TU (Solar Dynamics Observatory\textCR(\pc@goptd@deadline)) /T (tooltip zref@25) /C [ ] /FT/Btn /F 768 /Ff 65536 /H/N /BS ¡¡ /W 0 ¿¿ data enables one to check any new observational \HyColor@XZeroOneThreeFour\pc@goptd@color\pc@hyenc@colorpdfcommentcolor\HyColor@XZeroOneThreeFour\pc@goptd@fontcolor\pc@hyenc@fontcolorpdfcommentcolor\HyColor@XZeroOneThreeFour\pc@goptd@icolor\pc@hyenc@icolorpdfcommentcolor\pdfmark[EB]pdfmark=/ANN,Subtype=/Widget,Raw=/TU (Ellerman bomb\textCR(\pc@goptd@deadline)) /T (tooltip zref@26) /C [ ] /FT/Btn /F 768 /Ff 65536 /H/N /BS ¡¡ /W 0 ¿¿ study to ascertain that it does not instead address pseudo-EBs or \HyColor@XZeroOneThreeFour\pc@goptd@color\pc@hyenc@colorpdfcommentcolor\HyColor@XZeroOneThreeFour\pc@goptd@fontcolor\pc@hyenc@fontcolorpdfcommentcolor\HyColor@XZeroOneThreeFour\pc@goptd@icolor\pc@hyenc@icolorpdfcommentcolor\pdfmark[FAF]pdfmark=/ANN,Subtype=/Widget,Raw=/TU (flaring arch filament\textCR(\pc@goptd@deadline)) /T (tooltip zref@27) /C [ ] /FT/Btn /F 768 /Ff 65536 /H/N /BS ¡¡ /W 0 ¿¿ s. We did so for the \HyColor@XZeroOneThreeFour\pc@goptd@color\pc@hyenc@colorpdfcommentcolor\HyColor@XZeroOneThreeFour\pc@goptd@fontcolor\pc@hyenc@fontcolorpdfcommentcolor\HyColor@XZeroOneThreeFour\pc@goptd@icolor\pc@hyenc@icolorpdfcommentcolor\pdfmark[EB]pdfmark=/ANN,Subtype=/Widget,Raw=/TU (Ellerman bomb\textCR(\pc@goptd@deadline)) /T (tooltip zref@28) /C [ ] /FT/Btn /F 768 /Ff 65536 /H/N /BS ¡¡ /W 0 ¿¿ literature since Paper I and briefly comment on our scrutiny here.
We judge that the 3570 \HyColor@XZeroOneThreeFour\pc@goptd@color\pc@hyenc@colorpdfcommentcolor\HyColor@XZeroOneThreeFour\pc@goptd@fontcolor\pc@hyenc@fontcolorpdfcommentcolor\HyColor@XZeroOneThreeFour\pc@goptd@icolor\pc@hyenc@icolorpdfcommentcolor\pdfmark[EB]pdfmark=/ANN,Subtype=/Widget,Raw=/TU (Ellerman bomb\textCR(\pc@goptd@deadline)) /T (tooltip zref@29) /C [ ] /FT/Btn /F 768 /Ff 65536 /H/N /BS ¡¡ /W 0 ¿¿ s of Nelson et al. (2013a) were probably pseudo-EBs, and likewise the 4 \HyColor@XZeroOneThreeFour\pc@goptd@color\pc@hyenc@colorpdfcommentcolor\HyColor@XZeroOneThreeFour\pc@goptd@fontcolor\pc@hyenc@fontcolorpdfcommentcolor\HyColor@XZeroOneThreeFour\pc@goptd@icolor\pc@hyenc@icolorpdfcommentcolor\pdfmark[EB]pdfmark=/ANN,Subtype=/Widget,Raw=/TU (Ellerman bomb\textCR(\pc@goptd@deadline)) /T (tooltip zref@30) /C [ ] /FT/Btn /F 768 /Ff 65536 /H/N /BS ¡¡ /W 0 ¿¿ s of Nelson et al. (2013b). Both studies targeted decaying sunspots rather than emerging active regions.
In contrast, we recognized the 3 \HyColor@XZeroOneThreeFour\pc@goptd@color\pc@hyenc@colorpdfcommentcolor\HyColor@XZeroOneThreeFour\pc@goptd@fontcolor\pc@hyenc@fontcolorpdfcommentcolor\HyColor@XZeroOneThreeFour\pc@goptd@icolor\pc@hyenc@icolorpdfcommentcolor\pdfmark[EB]pdfmark=/ANN,Subtype=/Widget,Raw=/TU (Ellerman bomb\textCR(\pc@goptd@deadline)) /T (tooltip zref@31) /C [ ] /FT/Btn /F 768 /Ff 65536 /H/N /BS ¡¡ /W 0 ¿¿ s of Bello González et al. (2013) as well-defined \HyColor@XZeroOneThreeFour\pc@goptd@color\pc@hyenc@colorpdfcommentcolor\HyColor@XZeroOneThreeFour\pc@goptd@fontcolor\pc@hyenc@fontcolorpdfcommentcolor\HyColor@XZeroOneThreeFour\pc@goptd@icolor\pc@hyenc@icolorpdfcommentcolor\pdfmark[EB]pdfmark=/ANN,Subtype=/Widget,Raw=/TU (Ellerman bomb\textCR(\pc@goptd@deadline)) /T (tooltip zref@32) /C [ ] /FT/Btn /F 768 /Ff 65536 /H/N /BS ¡¡ /W 0 ¿¿ s in 1700 Å, indeed occurring in a complex region with much flux emergence. Similarly for at least EB3 and EB4 of Hong et al. (2014) and the single \HyColor@XZeroOneThreeFour\pc@goptd@color\pc@hyenc@colorpdfcommentcolor\HyColor@XZeroOneThreeFour\pc@goptd@fontcolor\pc@hyenc@fontcolorpdfcommentcolor\HyColor@XZeroOneThreeFour\pc@goptd@icolor\pc@hyenc@icolorpdfcommentcolor\pdfmark[EB]pdfmark=/ANN,Subtype=/Widget,Raw=/TU (Ellerman bomb\textCR(\pc@goptd@deadline)) /T (tooltip zref@33) /C [ ] /FT/Btn /F 768 /Ff 65536 /H/N /BS ¡¡ /W 0 ¿¿ of Yang et al. 2013 (which occurred a day after those of Bello González et al. 2013 in the same region). Most recently, the near-limb \HyColor@XZeroOneThreeFour\pc@goptd@color\pc@hyenc@colorpdfcommentcolor\HyColor@XZeroOneThreeFour\pc@goptd@fontcolor\pc@hyenc@fontcolorpdfcommentcolor\HyColor@XZeroOneThreeFour\pc@goptd@icolor\pc@hyenc@icolorpdfcommentcolor\pdfmark[EB]pdfmark=/ANN,Subtype=/Widget,Raw=/TU (Ellerman bomb\textCR(\pc@goptd@deadline)) /T (tooltip zref@34) /C [ ] /FT/Btn /F 768 /Ff 65536 /H/N /BS ¡¡ /W 0 ¿¿ s in Nelson et al. (2015) have obvious flame morphology.
Generally, the latter papers confirm our view in Paper I, Paper II, Rutten et al. (2013). \HyColor@XZeroOneThreeFour\pc@goptd@color\pc@hyenc@colorpdfcommentcolor\HyColor@XZeroOneThreeFour\pc@goptd@fontcolor\pc@hyenc@fontcolorpdfcommentcolor\HyColor@XZeroOneThreeFour\pc@goptd@icolor\pc@hyenc@icolorpdfcommentcolor\pdfmark[EB]pdfmark=/ANN,Subtype=/Widget,Raw=/TU (Ellerman bomb\textCR(\pc@goptd@deadline)) /T (tooltip zref@35) /C [ ] /FT/Btn /F 768 /Ff 65536 /H/N /BS ¡¡ /W 0 ¿¿ s are strong-field opposite-polarity cancelations that occur in complex emerging active regions. They mark reconnection taking place in the photosphere, and produce substantial local heating that leaves no direct signature in the overlying chromosphere and transition region.
Modeling of the H -wing enhancements that characterize \HyColor@XZeroOneThreeFour\pc@goptd@color\pc@hyenc@colorpdfcommentcolor\HyColor@XZeroOneThreeFour\pc@goptd@fontcolor\pc@hyenc@fontcolorpdfcommentcolor\HyColor@XZeroOneThreeFour\pc@goptd@icolor\pc@hyenc@icolorpdfcommentcolor\pdfmark[EB]pdfmark=/ANN,Subtype=/Widget,Raw=/TU (Ellerman bomb\textCR(\pc@goptd@deadline)) /T (tooltip zref@36) /C [ ] /FT/Btn /F 768 /Ff 65536 /H/N /BS ¡¡ /W 0 ¿¿ s was recently reported by Nelson et al. (2013b), Bello González et al. (2013), Hong et al. (2014), and Berlicki & Heinzel (2014). We return to these analyses in Sect. 4, but already point out here that they agree with all earlier modeling in claiming upper-photosphere temperature enhancements of only 1000–5000 K, in obvious conflict with the notion that \HyColor@XZeroOneThreeFour\pc@goptd@color\pc@hyenc@colorpdfcommentcolor\HyColor@XZeroOneThreeFour\pc@goptd@fontcolor\pc@hyenc@fontcolorpdfcommentcolor\HyColor@XZeroOneThreeFour\pc@goptd@icolor\pc@hyenc@icolorpdfcommentcolor\pdfmark[EB]pdfmark=/ANN,Subtype=/Widget,Raw=/TU (Ellerman bomb\textCR(\pc@goptd@deadline)) /T (tooltip zref@37) /C [ ] /FT/Btn /F 768 /Ff 65536 /H/N /BS ¡¡ /W 0 ¿¿ s might be \HyColor@XZeroOneThreeFour\pc@goptd@color\pc@hyenc@colorpdfcommentcolor\HyColor@XZeroOneThreeFour\pc@goptd@fontcolor\pc@hyenc@fontcolorpdfcommentcolor\HyColor@XZeroOneThreeFour\pc@goptd@icolor\pc@hyenc@icolorpdfcommentcolor\pdfmark[IB]pdfmark=/ANN,Subtype=/Widget,Raw=/TU (IRIS bomb\textCR(\pc@goptd@deadline)) /T (tooltip zref@38) /C [ ] /FT/Btn /F 768 /Ff 65536 /H/N /BS ¡¡ /W 0 ¿¿ s for which Peter et al. (2014) suggest formation temperatures near 100 000 K.
Were the \HyColor@XZeroOneThreeFour\pc@goptd@color\pc@hyenc@colorpdfcommentcolor\HyColor@XZeroOneThreeFour\pc@goptd@fontcolor\pc@hyenc@fontcolorpdfcommentcolor\HyColor@XZeroOneThreeFour\pc@goptd@icolor\pc@hyenc@icolorpdfcommentcolor\pdfmark[IB]pdfmark=/ANN,Subtype=/Widget,Raw=/TU (IRIS bomb\textCR(\pc@goptd@deadline)) /T (tooltip zref@39) /C [ ] /FT/Btn /F 768 /Ff 65536 /H/N /BS ¡¡ /W 0 ¿¿ s of Peter et al. (2014) indeed \HyColor@XZeroOneThreeFour\pc@goptd@color\pc@hyenc@colorpdfcommentcolor\HyColor@XZeroOneThreeFour\pc@goptd@fontcolor\pc@hyenc@fontcolorpdfcommentcolor\HyColor@XZeroOneThreeFour\pc@goptd@icolor\pc@hyenc@icolorpdfcommentcolor\pdfmark[EB]pdfmark=/ANN,Subtype=/Widget,Raw=/TU (Ellerman bomb\textCR(\pc@goptd@deadline)) /T (tooltip zref@40) /C [ ] /FT/Btn /F 768 /Ff 65536 /H/N /BS ¡¡ /W 0 ¿¿ s as suggested by them? Our similar inspection of the concurrent \HyColor@XZeroOneThreeFour\pc@goptd@color\pc@hyenc@colorpdfcommentcolor\HyColor@XZeroOneThreeFour\pc@goptd@fontcolor\pc@hyenc@fontcolorpdfcommentcolor\HyColor@XZeroOneThreeFour\pc@goptd@icolor\pc@hyenc@icolorpdfcommentcolor\pdfmark[AIA]pdfmark=/ANN,Subtype=/Widget,Raw=/TU (Atmospheric Imaging Assembly\textCR(\pc@goptd@deadline)) /T (tooltip zref@41) /C [ ] /FT/Btn /F 768 /Ff 65536 /H/N /BS ¡¡ /W 0 ¿¿ 1700 and 1600 Å morphology turned out indecisive. Their bomb B-1, with deep Ni ii and Fe ii absorption blends in the Si iv lines, seemed a bonafide \HyColor@XZeroOneThreeFour\pc@goptd@color\pc@hyenc@colorpdfcommentcolor\HyColor@XZeroOneThreeFour\pc@goptd@fontcolor\pc@hyenc@fontcolorpdfcommentcolor\HyColor@XZeroOneThreeFour\pc@goptd@icolor\pc@hyenc@icolorpdfcommentcolor\pdfmark[EB]pdfmark=/ANN,Subtype=/Widget,Raw=/TU (Ellerman bomb\textCR(\pc@goptd@deadline)) /T (tooltip zref@42) /C [ ] /FT/Btn /F 768 /Ff 65536 /H/N /BS ¡¡ /W 0 ¿¿ to us but the others looked more \HyColor@XZeroOneThreeFour\pc@goptd@color\pc@hyenc@colorpdfcommentcolor\HyColor@XZeroOneThreeFour\pc@goptd@fontcolor\pc@hyenc@fontcolorpdfcommentcolor\HyColor@XZeroOneThreeFour\pc@goptd@icolor\pc@hyenc@icolorpdfcommentcolor\pdfmark[FAF]pdfmark=/ANN,Subtype=/Widget,Raw=/TU (flaring arch filament\textCR(\pc@goptd@deadline)) /T (tooltip zref@43) /C [ ] /FT/Btn /F 768 /Ff 65536 /H/N /BS ¡¡ /W 0 ¿¿ -like. Hence, as stressed by Peter et al. (2014), there is a clear need for simultaneous \HyColor@XZeroOneThreeFour\pc@goptd@color\pc@hyenc@colorpdfcommentcolor\HyColor@XZeroOneThreeFour\pc@goptd@fontcolor\pc@hyenc@fontcolorpdfcommentcolor\HyColor@XZeroOneThreeFour\pc@goptd@icolor\pc@hyenc@icolorpdfcommentcolor\pdfmark[IRIS]pdfmark=/ANN,Subtype=/Widget,Raw=/TU (Interface Region Imaging Spectrograph\textCR(\pc@goptd@deadline)) /T (tooltip zref@44) /C [ ] /FT/Btn /F 768 /Ff 65536 /H/N /BS ¡¡ /W 0 ¿¿ and ground-based H observation of \HyColor@XZeroOneThreeFour\pc@goptd@color\pc@hyenc@colorpdfcommentcolor\HyColor@XZeroOneThreeFour\pc@goptd@fontcolor\pc@hyenc@fontcolorpdfcommentcolor\HyColor@XZeroOneThreeFour\pc@goptd@icolor\pc@hyenc@icolorpdfcommentcolor\pdfmark[EB]pdfmark=/ANN,Subtype=/Widget,Raw=/TU (Ellerman bomb\textCR(\pc@goptd@deadline)) /T (tooltip zref@45) /C [ ] /FT/Btn /F 768 /Ff 65536 /H/N /BS ¡¡ /W 0 ¿¿ s and \HyColor@XZeroOneThreeFour\pc@goptd@color\pc@hyenc@colorpdfcommentcolor\HyColor@XZeroOneThreeFour\pc@goptd@fontcolor\pc@hyenc@fontcolorpdfcommentcolor\HyColor@XZeroOneThreeFour\pc@goptd@icolor\pc@hyenc@icolorpdfcommentcolor\pdfmark[IB]pdfmark=/ANN,Subtype=/Widget,Raw=/TU (IRIS bomb\textCR(\pc@goptd@deadline)) /T (tooltip zref@46) /C [ ] /FT/Btn /F 768 /Ff 65536 /H/N /BS ¡¡ /W 0 ¿¿ s because \HyColor@XZeroOneThreeFour\pc@goptd@color\pc@hyenc@colorpdfcommentcolor\HyColor@XZeroOneThreeFour\pc@goptd@fontcolor\pc@hyenc@fontcolorpdfcommentcolor\HyColor@XZeroOneThreeFour\pc@goptd@icolor\pc@hyenc@icolorpdfcommentcolor\pdfmark[EB]pdfmark=/ANN,Subtype=/Widget,Raw=/TU (Ellerman bomb\textCR(\pc@goptd@deadline)) /T (tooltip zref@47) /C [ ] /FT/Btn /F 768 /Ff 65536 /H/N /BS ¡¡ /W 0 ¿¿ recognition is easier in H .
In this paper we address this \HyColor@XZeroOneThreeFour\pc@goptd@color\pc@hyenc@colorpdfcommentcolor\HyColor@XZeroOneThreeFour\pc@goptd@fontcolor\pc@hyenc@fontcolorpdfcommentcolor\HyColor@XZeroOneThreeFour\pc@goptd@icolor\pc@hyenc@icolorpdfcommentcolor\pdfmark[EB]pdfmark=/ANN,Subtype=/Widget,Raw=/TU (Ellerman bomb\textCR(\pc@goptd@deadline)) /T (tooltip zref@48) /C [ ] /FT/Btn /F 768 /Ff 65536 /H/N /BS ¡¡ /W 0 ¿¿ –\HyColor@XZeroOneThreeFour\pc@goptd@color\pc@hyenc@colorpdfcommentcolor\HyColor@XZeroOneThreeFour\pc@goptd@fontcolor\pc@hyenc@fontcolorpdfcommentcolor\HyColor@XZeroOneThreeFour\pc@goptd@icolor\pc@hyenc@icolorpdfcommentcolor\pdfmark[IB]pdfmark=/ANN,Subtype=/Widget,Raw=/TU (IRIS bomb\textCR(\pc@goptd@deadline)) /T (tooltip zref@49) /C [ ] /FT/Btn /F 768 /Ff 65536 /H/N /BS ¡¡ /W 0 ¿¿ issue by combining new \HyColor@XZeroOneThreeFour\pc@goptd@color\pc@hyenc@colorpdfcommentcolor\HyColor@XZeroOneThreeFour\pc@goptd@fontcolor\pc@hyenc@fontcolorpdfcommentcolor\HyColor@XZeroOneThreeFour\pc@goptd@icolor\pc@hyenc@icolorpdfcommentcolor\pdfmark[EB]pdfmark=/ANN,Subtype=/Widget,Raw=/TU (Ellerman bomb\textCR(\pc@goptd@deadline)) /T (tooltip zref@50) /C [ ] /FT/Btn /F 768 /Ff 65536 /H/N /BS ¡¡ /W 0 ¿¿ and \HyColor@XZeroOneThreeFour\pc@goptd@color\pc@hyenc@colorpdfcommentcolor\HyColor@XZeroOneThreeFour\pc@goptd@fontcolor\pc@hyenc@fontcolorpdfcommentcolor\HyColor@XZeroOneThreeFour\pc@goptd@icolor\pc@hyenc@icolorpdfcommentcolor\pdfmark[FAF]pdfmark=/ANN,Subtype=/Widget,Raw=/TU (flaring arch filament\textCR(\pc@goptd@deadline)) /T (tooltip zref@51) /C [ ] /FT/Btn /F 768 /Ff 65536 /H/N /BS ¡¡ /W 0 ¿¿ observations with the \HyColor@XZeroOneThreeFour\pc@goptd@color\pc@hyenc@colorpdfcommentcolor\HyColor@XZeroOneThreeFour\pc@goptd@fontcolor\pc@hyenc@fontcolorpdfcommentcolor\HyColor@XZeroOneThreeFour\pc@goptd@icolor\pc@hyenc@icolorpdfcommentcolor\pdfmark[SST]pdfmark=/ANN,Subtype=/Widget,Raw=/TU (Swedish 1-m Solar Telescope\textCR(\pc@goptd@deadline)) /T (tooltip zref@52) /C [ ] /FT/Btn /F 768 /Ff 65536 /H/N /BS ¡¡ /W 0 ¿¿ with simultaneous observations with \HyColor@XZeroOneThreeFour\pc@goptd@color\pc@hyenc@colorpdfcommentcolor\HyColor@XZeroOneThreeFour\pc@goptd@fontcolor\pc@hyenc@fontcolorpdfcommentcolor\HyColor@XZeroOneThreeFour\pc@goptd@icolor\pc@hyenc@icolorpdfcommentcolor\pdfmark[IRIS]pdfmark=/ANN,Subtype=/Widget,Raw=/TU (Interface Region Imaging Spectrograph\textCR(\pc@goptd@deadline)) /T (tooltip zref@53) /C [ ] /FT/Btn /F 768 /Ff 65536 /H/N /BS ¡¡ /W 0 ¿¿ and \HyColor@XZeroOneThreeFour\pc@goptd@color\pc@hyenc@colorpdfcommentcolor\HyColor@XZeroOneThreeFour\pc@goptd@fontcolor\pc@hyenc@fontcolorpdfcommentcolor\HyColor@XZeroOneThreeFour\pc@goptd@icolor\pc@hyenc@icolorpdfcommentcolor\pdfmark[SDO]pdfmark=/ANN,Subtype=/Widget,Raw=/TU (Solar Dynamics Observatory\textCR(\pc@goptd@deadline)) /T (tooltip zref@54) /C [ ] /FT/Btn /F 768 /Ff 65536 /H/N /BS ¡¡ /W 0 ¿¿ /\HyColor@XZeroOneThreeFour\pc@goptd@color\pc@hyenc@colorpdfcommentcolor\HyColor@XZeroOneThreeFour\pc@goptd@fontcolor\pc@hyenc@fontcolorpdfcommentcolor\HyColor@XZeroOneThreeFour\pc@goptd@icolor\pc@hyenc@icolorpdfcommentcolor\pdfmark[AIA]pdfmark=/ANN,Subtype=/Widget,Raw=/TU (Atmospheric Imaging Assembly\textCR(\pc@goptd@deadline)) /T (tooltip zref@55) /C [ ] /FT/Btn /F 768 /Ff 65536 /H/N /BS ¡¡ /W 0 ¿¿ . Our conclusion is that both \HyColor@XZeroOneThreeFour\pc@goptd@color\pc@hyenc@colorpdfcommentcolor\HyColor@XZeroOneThreeFour\pc@goptd@fontcolor\pc@hyenc@fontcolorpdfcommentcolor\HyColor@XZeroOneThreeFour\pc@goptd@icolor\pc@hyenc@icolorpdfcommentcolor\pdfmark[EB]pdfmark=/ANN,Subtype=/Widget,Raw=/TU (Ellerman bomb\textCR(\pc@goptd@deadline)) /T (tooltip zref@56) /C [ ] /FT/Btn /F 768 /Ff 65536 /H/N /BS ¡¡ /W 0 ¿¿ s and \HyColor@XZeroOneThreeFour\pc@goptd@color\pc@hyenc@colorpdfcommentcolor\HyColor@XZeroOneThreeFour\pc@goptd@fontcolor\pc@hyenc@fontcolorpdfcommentcolor\HyColor@XZeroOneThreeFour\pc@goptd@icolor\pc@hyenc@icolorpdfcommentcolor\pdfmark[FAF]pdfmark=/ANN,Subtype=/Widget,Raw=/TU (flaring arch filament\textCR(\pc@goptd@deadline)) /T (tooltip zref@57) /C [ ] /FT/Btn /F 768 /Ff 65536 /H/N /BS ¡¡ /W 0 ¿¿ s produce ultraviolet line profiles of \HyColor@XZeroOneThreeFour\pc@goptd@color\pc@hyenc@colorpdfcommentcolor\HyColor@XZeroOneThreeFour\pc@goptd@fontcolor\pc@hyenc@fontcolorpdfcommentcolor\HyColor@XZeroOneThreeFour\pc@goptd@icolor\pc@hyenc@icolorpdfcommentcolor\pdfmark[IB]pdfmark=/ANN,Subtype=/Widget,Raw=/TU (IRIS bomb\textCR(\pc@goptd@deadline)) /T (tooltip zref@58) /C [ ] /FT/Btn /F 768 /Ff 65536 /H/N /BS ¡¡ /W 0 ¿¿ type, and that these provide valuable insights and constraints.
The observations are presented in the next section, the results in Sect. 3. We discuss them in Sect. 4 and add conclusions in Sect. 5.
| Target | Diagnostic details | |||||||||||
| Set | Date | AR | (, ) | Instru- | OBSID | Name | Rangea | Time | ||||
| [′′] | [∘] | ment | [Å] | [Å] | [mÅ] | [s] | [UTC] | |||||
| 1 | 2013 Sep 6 | 11836 | (763, 129) | 50.6 | CRISP | — | H | 6563 | 1.2 | 100 | 5.5 | 08:15 – 09:01 |
| IRIS | 4003004168 | SG (41′′) | — | — | — | 11 | 08:11 – 11:39 | |||||
| SJI 1330 | 1340 | 55 | — | 12 | ||||||||
| SJI 1400 | 1390 | 55 | — | 12 | ||||||||
| SJI 2796 | 2796 | 4 | — | 12 | ||||||||
| SJI 2832 | 2830 | 4 | — | 69 | ||||||||
| 2 | 2014 Jun 14 | 12089 | (221, 278) | 21.5 | CRISP | — | H | 6563 | 1.4 | 200 | 11.4 | 07:20 – 08:11 |
| — | Ca ii | 8542 | 1.2 | 100 | ||||||||
| — | Fe i | 6302 | 0.048b | — | ||||||||
| IRIS | 3820256197 | SG (960.33′′) | — | — | — | 516 | 07:29 – 10:47 | |||||
| SJI 1330 | 1340 | 55 | — | 17 | ||||||||
| SJI 1400 | 1390 | 55 | — | 17 | ||||||||
| SJI 2796 | 2796 | 4 | — | 17 | ||||||||
| SJI 2832 | 2830 | 4 | — | 86 | ||||||||
| 3 | 2014 Jun 15 | 12089 | (411, 281) | 31.0 | CRISP | — | H | 6563 | 1.4 | 200 | 11.4 | 07:47 – 08:49 |
| — | Ca ii | 8542 | 1.2 | 100 | ||||||||
| — | Fe i | 6302 | 0.048b | — | ||||||||
| IRIS | 3820256197 | SG (960.33′′) | — | — | — | 516 | 07:29 – 10:55 | |||||
| SJI 1330 | 1340 | 55 | — | 17 | ||||||||
| SJI 1400 | 1390 | 55 | — | 17 | ||||||||
| SJI 2796 | 2796 | 4 | — | 17 | ||||||||
| SJI 2832 | 2830 | 4 | — | 86 | ||||||||
a This column gives the passband width in case of the slitjaw image channels.
b Full Stokes polarization measurements were obtained at this
wavelength position.
2. Observations, Reduction, Methods
2.1. Data collection
For this study we analyzed data from multiple observing campaigns targeting emerging active regions with co-pointing of the \HyColor@XZeroOneThreeFour\pc@goptd@color\pc@hyenc@colorpdfcommentcolor\HyColor@XZeroOneThreeFour\pc@goptd@fontcolor\pc@hyenc@fontcolorpdfcommentcolor\HyColor@XZeroOneThreeFour\pc@goptd@icolor\pc@hyenc@icolorpdfcommentcolor\pdfmark[SST]pdfmark=/ANN,Subtype=/Widget,Raw=/TU (Swedish 1-m Solar Telescope\textCR(\pc@goptd@deadline)) /T (tooltip zref@95) /C [ ] /FT/Btn /F 768 /Ff 65536 /H/N /BS ¡¡ /W 0 ¿¿ and \HyColor@XZeroOneThreeFour\pc@goptd@color\pc@hyenc@colorpdfcommentcolor\HyColor@XZeroOneThreeFour\pc@goptd@fontcolor\pc@hyenc@fontcolorpdfcommentcolor\HyColor@XZeroOneThreeFour\pc@goptd@icolor\pc@hyenc@icolorpdfcommentcolor\pdfmark[IRIS]pdfmark=/ANN,Subtype=/Widget,Raw=/TU (Interface Region Imaging Spectrograph\textCR(\pc@goptd@deadline)) /T (tooltip zref@96) /C [ ] /FT/Btn /F 768 /Ff 65536 /H/N /BS ¡¡ /W 0 ¿¿ . The \HyColor@XZeroOneThreeFour\pc@goptd@color\pc@hyenc@colorpdfcommentcolor\HyColor@XZeroOneThreeFour\pc@goptd@fontcolor\pc@hyenc@fontcolorpdfcommentcolor\HyColor@XZeroOneThreeFour\pc@goptd@icolor\pc@hyenc@icolorpdfcommentcolor\pdfmark[SST]pdfmark=/ANN,Subtype=/Widget,Raw=/TU (Swedish 1-m Solar Telescope\textCR(\pc@goptd@deadline)) /T (tooltip zref@97) /C [ ] /FT/Btn /F 768 /Ff 65536 /H/N /BS ¡¡ /W 0 ¿¿ ’s CRisp Imaging SpectroPolarimeter (CRISP; Scharmer et al. 2008), a Fabry-Pérot interferometer, collected imaging spectroscopy in at least H (further specification in Table 1).
The \HyColor@XZeroOneThreeFour\pc@goptd@color\pc@hyenc@colorpdfcommentcolor\HyColor@XZeroOneThreeFour\pc@goptd@fontcolor\pc@hyenc@fontcolorpdfcommentcolor\HyColor@XZeroOneThreeFour\pc@goptd@icolor\pc@hyenc@icolorpdfcommentcolor\pdfmark[IRIS]pdfmark=/ANN,Subtype=/Widget,Raw=/TU (Interface Region Imaging Spectrograph\textCR(\pc@goptd@deadline)) /T (tooltip zref@98) /C [ ] /FT/Btn /F 768 /Ff 65536 /H/N /BS ¡¡ /W 0 ¿¿ spectrograph (SG) recorded its standard selection of ultraviolet lines: the C ii doublet near 1335 Å, the Si iv doublet at 1394 Å and 1403 Å, the Mg ii and k lines near 2796 Å and 2804 Å including the overlapping-wing part between them with various blends, in particular the Mg ii triplet lines near 2798 Å (which are two overlapping transitions that overlap so closely that they look like one line in the spectrum). For more details including characteristic formation temperatures see Table 4 of De Pontieu et al. (2014). For \HyColor@XZeroOneThreeFour\pc@goptd@color\pc@hyenc@colorpdfcommentcolor\HyColor@XZeroOneThreeFour\pc@goptd@fontcolor\pc@hyenc@fontcolorpdfcommentcolor\HyColor@XZeroOneThreeFour\pc@goptd@icolor\pc@hyenc@icolorpdfcommentcolor\pdfmark[IRIS]pdfmark=/ANN,Subtype=/Widget,Raw=/TU (Interface Region Imaging Spectrograph\textCR(\pc@goptd@deadline)) /T (tooltip zref@99) /C [ ] /FT/Btn /F 768 /Ff 65536 /H/N /BS ¡¡ /W 0 ¿¿ -related formation studies of Mg ii and k see Leenaarts et al. (2013a), Leenaarts et al. (2013b), and Pereira et al. (2013); see Pereira et al. (2015) for a similar formation study of the Mg ii triplet lines. In addition, \HyColor@XZeroOneThreeFour\pc@goptd@color\pc@hyenc@colorpdfcommentcolor\HyColor@XZeroOneThreeFour\pc@goptd@fontcolor\pc@hyenc@fontcolorpdfcommentcolor\HyColor@XZeroOneThreeFour\pc@goptd@icolor\pc@hyenc@icolorpdfcommentcolor\pdfmark[IRIS]pdfmark=/ANN,Subtype=/Widget,Raw=/TU (Interface Region Imaging Spectrograph\textCR(\pc@goptd@deadline)) /T (tooltip zref@100) /C [ ] /FT/Btn /F 768 /Ff 65536 /H/N /BS ¡¡ /W 0 ¿¿ collected slitjaw images (SJI) in the 1330 Å, 1400 Å, 2796 Å and 2832 Å channels, as detailed in Table 3 of De Pontieu et al. (2014).
In Table 1 we specify pointing, spectral and timing details for the three particular datasets from these co-ordinated observing campaigns that were selected for this paper.
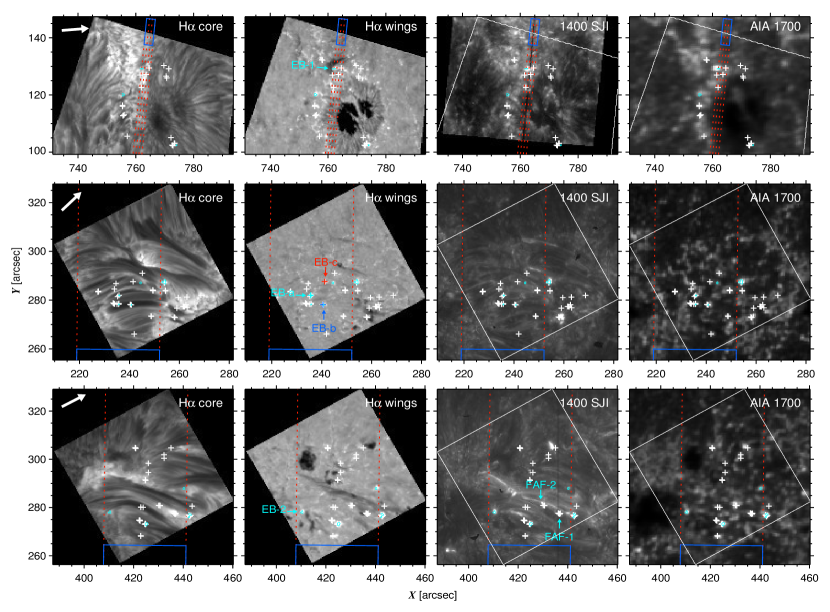
The top row of Fig. 1 shows image samples of the first. It covered the major sunspot in active region AR 11836 that had a pronounced moat flow. \HyColor@XZeroOneThreeFour\pc@goptd@color\pc@hyenc@colorpdfcommentcolor\HyColor@XZeroOneThreeFour\pc@goptd@fontcolor\pc@hyenc@fontcolorpdfcommentcolor\HyColor@XZeroOneThreeFour\pc@goptd@icolor\pc@hyenc@icolorpdfcommentcolor\pdfmark[IRIS]pdfmark=/ANN,Subtype=/Widget,Raw=/TU (Interface Region Imaging Spectrograph\textCR(\pc@goptd@deadline)) /T (tooltip zref@101) /C [ ] /FT/Btn /F 768 /Ff 65536 /H/N /BS ¡¡ /W 0 ¿¿ supported these observations in a “4-step sparse raster” mode of slit motion, covering 3 arcsec with 2 s exposure times per step. This pattern gives good temporal resolution for a given spot on the Sun but smaller chance of hitting a scarce feature such as an \HyColor@XZeroOneThreeFour\pc@goptd@color\pc@hyenc@colorpdfcommentcolor\HyColor@XZeroOneThreeFour\pc@goptd@fontcolor\pc@hyenc@fontcolorpdfcommentcolor\HyColor@XZeroOneThreeFour\pc@goptd@icolor\pc@hyenc@icolorpdfcommentcolor\pdfmark[EB]pdfmark=/ANN,Subtype=/Widget,Raw=/TU (Ellerman bomb\textCR(\pc@goptd@deadline)) /T (tooltip zref@102) /C [ ] /FT/Btn /F 768 /Ff 65536 /H/N /BS ¡¡ /W 0 ¿¿ .
Sample images for datasets 2 and 3 covering AR 12089 are similarly shown in the lower rows of Fig. 1. For both \HyColor@XZeroOneThreeFour\pc@goptd@color\pc@hyenc@colorpdfcommentcolor\HyColor@XZeroOneThreeFour\pc@goptd@fontcolor\pc@hyenc@fontcolorpdfcommentcolor\HyColor@XZeroOneThreeFour\pc@goptd@icolor\pc@hyenc@icolorpdfcommentcolor\pdfmark[IRIS]pdfmark=/ANN,Subtype=/Widget,Raw=/TU (Interface Region Imaging Spectrograph\textCR(\pc@goptd@deadline)) /T (tooltip zref@103) /C [ ] /FT/Btn /F 768 /Ff 65536 /H/N /BS ¡¡ /W 0 ¿¿ took a dense synoptic raster of 96 steps, covering 31.35 arcsec at 4 s exposure time per step. The larger pattern width gives larger spatial chance of hitting an \HyColor@XZeroOneThreeFour\pc@goptd@color\pc@hyenc@colorpdfcommentcolor\HyColor@XZeroOneThreeFour\pc@goptd@fontcolor\pc@hyenc@fontcolorpdfcommentcolor\HyColor@XZeroOneThreeFour\pc@goptd@icolor\pc@hyenc@icolorpdfcommentcolor\pdfmark[EB]pdfmark=/ANN,Subtype=/Widget,Raw=/TU (Ellerman bomb\textCR(\pc@goptd@deadline)) /T (tooltip zref@104) /C [ ] /FT/Btn /F 768 /Ff 65536 /H/N /BS ¡¡ /W 0 ¿¿ , but the consequently low repeat cadence, longer than the typical \HyColor@XZeroOneThreeFour\pc@goptd@color\pc@hyenc@colorpdfcommentcolor\HyColor@XZeroOneThreeFour\pc@goptd@fontcolor\pc@hyenc@fontcolorpdfcommentcolor\HyColor@XZeroOneThreeFour\pc@goptd@icolor\pc@hyenc@icolorpdfcommentcolor\pdfmark[EB]pdfmark=/ANN,Subtype=/Widget,Raw=/TU (Ellerman bomb\textCR(\pc@goptd@deadline)) /T (tooltip zref@105) /C [ ] /FT/Btn /F 768 /Ff 65536 /H/N /BS ¡¡ /W 0 ¿¿ appearance, diminishes the catch.
We also collected corresponding image sequences from \HyColor@XZeroOneThreeFour\pc@goptd@color\pc@hyenc@colorpdfcommentcolor\HyColor@XZeroOneThreeFour\pc@goptd@fontcolor\pc@hyenc@fontcolorpdfcommentcolor\HyColor@XZeroOneThreeFour\pc@goptd@icolor\pc@hyenc@icolorpdfcommentcolor\pdfmark[SDO]pdfmark=/ANN,Subtype=/Widget,Raw=/TU (Solar Dynamics Observatory\textCR(\pc@goptd@deadline)) /T (tooltip zref@106) /C [ ] /FT/Btn /F 768 /Ff 65536 /H/N /BS ¡¡ /W 0 ¿¿ /\HyColor@XZeroOneThreeFour\pc@goptd@color\pc@hyenc@colorpdfcommentcolor\HyColor@XZeroOneThreeFour\pc@goptd@fontcolor\pc@hyenc@fontcolorpdfcommentcolor\HyColor@XZeroOneThreeFour\pc@goptd@icolor\pc@hyenc@icolorpdfcommentcolor\pdfmark[AIA]pdfmark=/ANN,Subtype=/Widget,Raw=/TU (Atmospheric Imaging Assembly\textCR(\pc@goptd@deadline)) /T (tooltip zref@107) /C [ ] /FT/Btn /F 768 /Ff 65536 /H/N /BS ¡¡ /W 0 ¿¿ and \HyColor@XZeroOneThreeFour\pc@goptd@color\pc@hyenc@colorpdfcommentcolor\HyColor@XZeroOneThreeFour\pc@goptd@fontcolor\pc@hyenc@fontcolorpdfcommentcolor\HyColor@XZeroOneThreeFour\pc@goptd@icolor\pc@hyenc@icolorpdfcommentcolor\pdfmark[SDO]pdfmark=/ANN,Subtype=/Widget,Raw=/TU (Solar Dynamics Observatory\textCR(\pc@goptd@deadline)) /T (tooltip zref@108) /C [ ] /FT/Btn /F 768 /Ff 65536 /H/N /BS ¡¡ /W 0 ¿¿ /\HyColor@XZeroOneThreeFour\pc@goptd@color\pc@hyenc@colorpdfcommentcolor\HyColor@XZeroOneThreeFour\pc@goptd@fontcolor\pc@hyenc@fontcolorpdfcommentcolor\HyColor@XZeroOneThreeFour\pc@goptd@icolor\pc@hyenc@icolorpdfcommentcolor\pdfmark[HMI]pdfmark=/ANN,Subtype=/Widget,Raw=/TU (Helioseismic and Magnetic Imager\textCR(\pc@goptd@deadline)) /T (tooltip zref@109) /C [ ] /FT/Btn /F 768 /Ff 65536 /H/N /BS ¡¡ /W 0 ¿¿ (Scherrer et al. 2012) using the JSOC image cutout service at Stanford University.
2.2. Data reduction
The \HyColor@XZeroOneThreeFour\pc@goptd@color\pc@hyenc@colorpdfcommentcolor\HyColor@XZeroOneThreeFour\pc@goptd@fontcolor\pc@hyenc@fontcolorpdfcommentcolor\HyColor@XZeroOneThreeFour\pc@goptd@icolor\pc@hyenc@icolorpdfcommentcolor\pdfmark[SST]pdfmark=/ANN,Subtype=/Widget,Raw=/TU (Swedish 1-m Solar Telescope\textCR(\pc@goptd@deadline)) /T (tooltip zref@110) /C [ ] /FT/Btn /F 768 /Ff 65536 /H/N /BS ¡¡ /W 0 ¿¿ /\HyColor@XZeroOneThreeFour\pc@goptd@color\pc@hyenc@colorpdfcommentcolor\HyColor@XZeroOneThreeFour\pc@goptd@fontcolor\pc@hyenc@fontcolorpdfcommentcolor\HyColor@XZeroOneThreeFour\pc@goptd@icolor\pc@hyenc@icolorpdfcommentcolor\pdfmark[CRISP]pdfmark=/ANN,Subtype=/Widget,Raw=/TU (CRisp Imaging SpectroPolarimeter\textCR(\pc@goptd@deadline)) /T (tooltip zref@111) /C [ ] /FT/Btn /F 768 /Ff 65536 /H/N /BS ¡¡ /W 0 ¿¿ data were reduced using the CRISPRED pipeline (de la Cruz Rodríguez et al. 2015). It includes (1) dark and flat field correction, (2) multi-object multi-frame blind deconvolution (van Noort et al. 2005) to reduce the effects of high-order atmospheric seeing, (3) minimization of remaining small-scale deformation through cross-correlation (Henriques 2012), (4) prefilter transmission correction (de la Cruz Rodriguéz 2010), (5) correction for time-dependent image rotation due to the alt-azimuth telescope configuration, and (6) removal of remaining rubber-sheet distortions by destretching (Shine et al. 1994).
The \HyColor@XZeroOneThreeFour\pc@goptd@color\pc@hyenc@colorpdfcommentcolor\HyColor@XZeroOneThreeFour\pc@goptd@fontcolor\pc@hyenc@fontcolorpdfcommentcolor\HyColor@XZeroOneThreeFour\pc@goptd@icolor\pc@hyenc@icolorpdfcommentcolor\pdfmark[SST]pdfmark=/ANN,Subtype=/Widget,Raw=/TU (Swedish 1-m Solar Telescope\textCR(\pc@goptd@deadline)) /T (tooltip zref@112) /C [ ] /FT/Btn /F 768 /Ff 65536 /H/N /BS ¡¡ /W 0 ¿¿ and \HyColor@XZeroOneThreeFour\pc@goptd@color\pc@hyenc@colorpdfcommentcolor\HyColor@XZeroOneThreeFour\pc@goptd@fontcolor\pc@hyenc@fontcolorpdfcommentcolor\HyColor@XZeroOneThreeFour\pc@goptd@icolor\pc@hyenc@icolorpdfcommentcolor\pdfmark[IRIS]pdfmark=/ANN,Subtype=/Widget,Raw=/TU (Interface Region Imaging Spectrograph\textCR(\pc@goptd@deadline)) /T (tooltip zref@113) /C [ ] /FT/Btn /F 768 /Ff 65536 /H/N /BS ¡¡ /W 0 ¿¿ data were co-aligned using far-wing images in H (dataset 1) or Ca ii 8542 Å (datasets 2 and 3) and the \HyColor@XZeroOneThreeFour\pc@goptd@color\pc@hyenc@colorpdfcommentcolor\HyColor@XZeroOneThreeFour\pc@goptd@fontcolor\pc@hyenc@fontcolorpdfcommentcolor\HyColor@XZeroOneThreeFour\pc@goptd@icolor\pc@hyenc@icolorpdfcommentcolor\pdfmark[IRIS]pdfmark=/ANN,Subtype=/Widget,Raw=/TU (Interface Region Imaging Spectrograph\textCR(\pc@goptd@deadline)) /T (tooltip zref@114) /C [ ] /FT/Btn /F 768 /Ff 65536 /H/N /BS ¡¡ /W 0 ¿¿ Mg ii h 2832 Å slitjaws. \HyColor@XZeroOneThreeFour\pc@goptd@color\pc@hyenc@colorpdfcommentcolor\HyColor@XZeroOneThreeFour\pc@goptd@fontcolor\pc@hyenc@fontcolorpdfcommentcolor\HyColor@XZeroOneThreeFour\pc@goptd@icolor\pc@hyenc@icolorpdfcommentcolor\pdfmark[SDO]pdfmark=/ANN,Subtype=/Widget,Raw=/TU (Solar Dynamics Observatory\textCR(\pc@goptd@deadline)) /T (tooltip zref@115) /C [ ] /FT/Btn /F 768 /Ff 65536 /H/N /BS ¡¡ /W 0 ¿¿ /\HyColor@XZeroOneThreeFour\pc@goptd@color\pc@hyenc@colorpdfcommentcolor\HyColor@XZeroOneThreeFour\pc@goptd@fontcolor\pc@hyenc@fontcolorpdfcommentcolor\HyColor@XZeroOneThreeFour\pc@goptd@icolor\pc@hyenc@icolorpdfcommentcolor\pdfmark[AIA]pdfmark=/ANN,Subtype=/Widget,Raw=/TU (Atmospheric Imaging Assembly\textCR(\pc@goptd@deadline)) /T (tooltip zref@116) /C [ ] /FT/Btn /F 768 /Ff 65536 /H/N /BS ¡¡ /W 0 ¿¿ 1600 Å or 1700 Å images (depending on the dataset) were used as initial co-location reference to define common features in the fields-of-view and their offsets. The \HyColor@XZeroOneThreeFour\pc@goptd@color\pc@hyenc@colorpdfcommentcolor\HyColor@XZeroOneThreeFour\pc@goptd@fontcolor\pc@hyenc@fontcolorpdfcommentcolor\HyColor@XZeroOneThreeFour\pc@goptd@icolor\pc@hyenc@icolorpdfcommentcolor\pdfmark[SST]pdfmark=/ANN,Subtype=/Widget,Raw=/TU (Swedish 1-m Solar Telescope\textCR(\pc@goptd@deadline)) /T (tooltip zref@117) /C [ ] /FT/Btn /F 768 /Ff 65536 /H/N /BS ¡¡ /W 0 ¿¿ data were then resampled to the \HyColor@XZeroOneThreeFour\pc@goptd@color\pc@hyenc@colorpdfcommentcolor\HyColor@XZeroOneThreeFour\pc@goptd@fontcolor\pc@hyenc@fontcolorpdfcommentcolor\HyColor@XZeroOneThreeFour\pc@goptd@icolor\pc@hyenc@icolorpdfcommentcolor\pdfmark[IRIS]pdfmark=/ANN,Subtype=/Widget,Raw=/TU (Interface Region Imaging Spectrograph\textCR(\pc@goptd@deadline)) /T (tooltip zref@118) /C [ ] /FT/Btn /F 768 /Ff 65536 /H/N /BS ¡¡ /W 0 ¿¿ slitjaw pixel size of 0.167 arcsec2. Finally, sub-images (usually containing one or more pores) were then selected manually for cross-correlation at each time step.
The \HyColor@XZeroOneThreeFour\pc@goptd@color\pc@hyenc@colorpdfcommentcolor\HyColor@XZeroOneThreeFour\pc@goptd@fontcolor\pc@hyenc@fontcolorpdfcommentcolor\HyColor@XZeroOneThreeFour\pc@goptd@icolor\pc@hyenc@icolorpdfcommentcolor\pdfmark[AIA]pdfmark=/ANN,Subtype=/Widget,Raw=/TU (Atmospheric Imaging Assembly\textCR(\pc@goptd@deadline)) /T (tooltip zref@119) /C [ ] /FT/Btn /F 768 /Ff 65536 /H/N /BS ¡¡ /W 0 ¿¿ and \HyColor@XZeroOneThreeFour\pc@goptd@color\pc@hyenc@colorpdfcommentcolor\HyColor@XZeroOneThreeFour\pc@goptd@fontcolor\pc@hyenc@fontcolorpdfcommentcolor\HyColor@XZeroOneThreeFour\pc@goptd@icolor\pc@hyenc@icolorpdfcommentcolor\pdfmark[HMI]pdfmark=/ANN,Subtype=/Widget,Raw=/TU (Helioseismic and Magnetic Imager\textCR(\pc@goptd@deadline)) /T (tooltip zref@120) /C [ ] /FT/Btn /F 768 /Ff 65536 /H/N /BS ¡¡ /W 0 ¿¿ image sequences were also precisely co-aligned with the full-resolution \HyColor@XZeroOneThreeFour\pc@goptd@color\pc@hyenc@colorpdfcommentcolor\HyColor@XZeroOneThreeFour\pc@goptd@fontcolor\pc@hyenc@fontcolorpdfcommentcolor\HyColor@XZeroOneThreeFour\pc@goptd@icolor\pc@hyenc@icolorpdfcommentcolor\pdfmark[SST]pdfmark=/ANN,Subtype=/Widget,Raw=/TU (Swedish 1-m Solar Telescope\textCR(\pc@goptd@deadline)) /T (tooltip zref@121) /C [ ] /FT/Btn /F 768 /Ff 65536 /H/N /BS ¡¡ /W 0 ¿¿ image sequences.
In the alignment and the data analysis we made much use of the CRisp SPectral EXplorer (CRISPEX; Vissers & Rouppe van der Voort 2012) for data browsing. The latest version (available through SolarSoft) can handle both \HyColor@XZeroOneThreeFour\pc@goptd@color\pc@hyenc@colorpdfcommentcolor\HyColor@XZeroOneThreeFour\pc@goptd@fontcolor\pc@hyenc@fontcolorpdfcommentcolor\HyColor@XZeroOneThreeFour\pc@goptd@icolor\pc@hyenc@icolorpdfcommentcolor\pdfmark[FITS]pdfmark=/ANN,Subtype=/Widget,Raw=/TU (Flexible Image Transport System\textCR(\pc@goptd@deadline)) /T (tooltip zref@122) /C [ ] /FT/Btn /F 768 /Ff 65536 /H/N /BS ¡¡ /W 0 ¿¿ -formatted \HyColor@XZeroOneThreeFour\pc@goptd@color\pc@hyenc@colorpdfcommentcolor\HyColor@XZeroOneThreeFour\pc@goptd@fontcolor\pc@hyenc@fontcolorpdfcommentcolor\HyColor@XZeroOneThreeFour\pc@goptd@icolor\pc@hyenc@icolorpdfcommentcolor\pdfmark[IRIS]pdfmark=/ANN,Subtype=/Widget,Raw=/TU (Interface Region Imaging Spectrograph\textCR(\pc@goptd@deadline)) /T (tooltip zref@123) /C [ ] /FT/Btn /F 768 /Ff 65536 /H/N /BS ¡¡ /W 0 ¿¿ data including slitjaw images, and legacy “La Palma”-format data files from the \HyColor@XZeroOneThreeFour\pc@goptd@color\pc@hyenc@colorpdfcommentcolor\HyColor@XZeroOneThreeFour\pc@goptd@fontcolor\pc@hyenc@fontcolorpdfcommentcolor\HyColor@XZeroOneThreeFour\pc@goptd@icolor\pc@hyenc@icolorpdfcommentcolor\pdfmark[SST]pdfmark=/ANN,Subtype=/Widget,Raw=/TU (Swedish 1-m Solar Telescope\textCR(\pc@goptd@deadline)) /T (tooltip zref@124) /C [ ] /FT/Btn /F 768 /Ff 65536 /H/N /BS ¡¡ /W 0 ¿¿ .
2.3. \HyColor@XZeroOneThreeFour\pc@goptd@color\pc@hyenc@colorpdfcommentcolor\HyColor@XZeroOneThreeFour\pc@goptd@fontcolor\pc@hyenc@fontcolorpdfcommentcolor\HyColor@XZeroOneThreeFour\pc@goptd@icolor\pc@hyenc@icolorpdfcommentcolor\pdfmark[EB]pdfmark=/ANN,Subtype=/Widget,Raw=/TU (Ellerman bomb\textCR(\pc@goptd@deadline)) /T (tooltip zref@125) /C [ ] /FT/Btn /F 768 /Ff 65536 /H/N /BS ¡¡ /W 0 ¿¿ identification using H
Identifying \HyColor@XZeroOneThreeFour\pc@goptd@color\pc@hyenc@colorpdfcommentcolor\HyColor@XZeroOneThreeFour\pc@goptd@fontcolor\pc@hyenc@fontcolorpdfcommentcolor\HyColor@XZeroOneThreeFour\pc@goptd@icolor\pc@hyenc@icolorpdfcommentcolor\pdfmark[EB]pdfmark=/ANN,Subtype=/Widget,Raw=/TU (Ellerman bomb\textCR(\pc@goptd@deadline)) /T (tooltip zref@127) /C [ ] /FT/Btn /F 768 /Ff 65536 /H/N /BS ¡¡ /W 0 ¿¿ s is not a trivial matter. A substantial part of the \HyColor@XZeroOneThreeFour\pc@goptd@color\pc@hyenc@colorpdfcommentcolor\HyColor@XZeroOneThreeFour\pc@goptd@fontcolor\pc@hyenc@fontcolorpdfcommentcolor\HyColor@XZeroOneThreeFour\pc@goptd@icolor\pc@hyenc@icolorpdfcommentcolor\pdfmark[EB]pdfmark=/ANN,Subtype=/Widget,Raw=/TU (Ellerman bomb\textCR(\pc@goptd@deadline)) /T (tooltip zref@128) /C [ ] /FT/Btn /F 768 /Ff 65536 /H/N /BS ¡¡ /W 0 ¿¿ literature did not address actual \HyColor@XZeroOneThreeFour\pc@goptd@color\pc@hyenc@colorpdfcommentcolor\HyColor@XZeroOneThreeFour\pc@goptd@fontcolor\pc@hyenc@fontcolorpdfcommentcolor\HyColor@XZeroOneThreeFour\pc@goptd@icolor\pc@hyenc@icolorpdfcommentcolor\pdfmark[EB]pdfmark=/ANN,Subtype=/Widget,Raw=/TU (Ellerman bomb\textCR(\pc@goptd@deadline)) /T (tooltip zref@129) /C [ ] /FT/Btn /F 768 /Ff 65536 /H/N /BS ¡¡ /W 0 ¿¿ s but “pseudo-EBs”: magnetic concentrations (MC) in network or plage that likewise brighten in the H wings as explained by Leenaarts et al. (2006b). Such \HyColor@XZeroOneThreeFour\pc@goptd@color\pc@hyenc@colorpdfcommentcolor\HyColor@XZeroOneThreeFour\pc@goptd@fontcolor\pc@hyenc@fontcolorpdfcommentcolor\HyColor@XZeroOneThreeFour\pc@goptd@icolor\pc@hyenc@icolorpdfcommentcolor\pdfmark[MC]pdfmark=/ANN,Subtype=/Widget,Raw=/TU (magnetic concentration\textCR(\pc@goptd@deadline)) /T (tooltip zref@130) /C [ ] /FT/Btn /F 768 /Ff 65536 /H/N /BS ¡¡ /W 0 ¿¿ brightening is more familiar as “facular bright points” in the continuum and in the molecular G-band around 4305 Å and as “line gaps” in neutral-metal lines, but it actually reaches largest contrast in the blue wing of H (Leenaarts et al. 2006a). It is well understood and is not a sign of heating but of deeper-than-normal radiation escape (summary and references in Rutten et al. 2013). Hence, care must be taken to ascertain that features that appear bright in an H wing are indeed \HyColor@XZeroOneThreeFour\pc@goptd@color\pc@hyenc@colorpdfcommentcolor\HyColor@XZeroOneThreeFour\pc@goptd@fontcolor\pc@hyenc@fontcolorpdfcommentcolor\HyColor@XZeroOneThreeFour\pc@goptd@icolor\pc@hyenc@icolorpdfcommentcolor\pdfmark[EB]pdfmark=/ANN,Subtype=/Widget,Raw=/TU (Ellerman bomb\textCR(\pc@goptd@deadline)) /T (tooltip zref@131) /C [ ] /FT/Btn /F 768 /Ff 65536 /H/N /BS ¡¡ /W 0 ¿¿ s and not just facular brightenings—a warning already given by Ellerman (1917) himself. A first check is to ascertain on the daily magnetogram movies from \HyColor@XZeroOneThreeFour\pc@goptd@color\pc@hyenc@colorpdfcommentcolor\HyColor@XZeroOneThreeFour\pc@goptd@fontcolor\pc@hyenc@fontcolorpdfcommentcolor\HyColor@XZeroOneThreeFour\pc@goptd@icolor\pc@hyenc@icolorpdfcommentcolor\pdfmark[SDO]pdfmark=/ANN,Subtype=/Widget,Raw=/TU (Solar Dynamics Observatory\textCR(\pc@goptd@deadline)) /T (tooltip zref@132) /C [ ] /FT/Btn /F 768 /Ff 65536 /H/N /BS ¡¡ /W 0 ¿¿ /\HyColor@XZeroOneThreeFour\pc@goptd@color\pc@hyenc@colorpdfcommentcolor\HyColor@XZeroOneThreeFour\pc@goptd@fontcolor\pc@hyenc@fontcolorpdfcommentcolor\HyColor@XZeroOneThreeFour\pc@goptd@icolor\pc@hyenc@icolorpdfcommentcolor\pdfmark[HMI]pdfmark=/ANN,Subtype=/Widget,Raw=/TU (Helioseismic and Magnetic Imager\textCR(\pc@goptd@deadline)) /T (tooltip zref@133) /C [ ] /FT/Btn /F 768 /Ff 65536 /H/N /BS ¡¡ /W 0 ¿¿ that the observed field of view is part of an active region with much flux emergence and fast streaming motions including bipolar collisions.
In Paper I and Paper II we found that \HyColor@XZeroOneThreeFour\pc@goptd@color\pc@hyenc@colorpdfcommentcolor\HyColor@XZeroOneThreeFour\pc@goptd@fontcolor\pc@hyenc@fontcolorpdfcommentcolor\HyColor@XZeroOneThreeFour\pc@goptd@icolor\pc@hyenc@icolorpdfcommentcolor\pdfmark[EB]pdfmark=/ANN,Subtype=/Widget,Raw=/TU (Ellerman bomb\textCR(\pc@goptd@deadline)) /T (tooltip zref@134) /C [ ] /FT/Btn /F 768 /Ff 65536 /H/N /BS ¡¡ /W 0 ¿¿ s are best identified using H wing images with slanted viewing away from disk center. We obtain such wing images by summing the three spectral samplings of both H wings around Å. In limbward viewing at the \HyColor@XZeroOneThreeFour\pc@goptd@color\pc@hyenc@colorpdfcommentcolor\HyColor@XZeroOneThreeFour\pc@goptd@fontcolor\pc@hyenc@fontcolorpdfcommentcolor\HyColor@XZeroOneThreeFour\pc@goptd@icolor\pc@hyenc@icolorpdfcommentcolor\pdfmark[SST]pdfmark=/ANN,Subtype=/Widget,Raw=/TU (Swedish 1-m Solar Telescope\textCR(\pc@goptd@deadline)) /T (tooltip zref@135) /C [ ] /FT/Btn /F 768 /Ff 65536 /H/N /BS ¡¡ /W 0 ¿¿ resolution \HyColor@XZeroOneThreeFour\pc@goptd@color\pc@hyenc@colorpdfcommentcolor\HyColor@XZeroOneThreeFour\pc@goptd@fontcolor\pc@hyenc@fontcolorpdfcommentcolor\HyColor@XZeroOneThreeFour\pc@goptd@icolor\pc@hyenc@icolorpdfcommentcolor\pdfmark[MC]pdfmark=/ANN,Subtype=/Widget,Raw=/TU (magnetic concentration\textCR(\pc@goptd@deadline)) /T (tooltip zref@136) /C [ ] /FT/Btn /F 768 /Ff 65536 /H/N /BS ¡¡ /W 0 ¿¿ s reach less H -wing brightness contrast than near disk center, whereas \HyColor@XZeroOneThreeFour\pc@goptd@color\pc@hyenc@colorpdfcommentcolor\HyColor@XZeroOneThreeFour\pc@goptd@fontcolor\pc@hyenc@fontcolorpdfcommentcolor\HyColor@XZeroOneThreeFour\pc@goptd@icolor\pc@hyenc@icolorpdfcommentcolor\pdfmark[EB]pdfmark=/ANN,Subtype=/Widget,Raw=/TU (Ellerman bomb\textCR(\pc@goptd@deadline)) /T (tooltip zref@137) /C [ ] /FT/Btn /F 768 /Ff 65536 /H/N /BS ¡¡ /W 0 ¿¿ s appear with definite flame morphology. They show up as elongated bright upright features that rapidly flicker (hence “flames”) during a few minutes while their feet are anchored in and travel along \HyColor@XZeroOneThreeFour\pc@goptd@color\pc@hyenc@colorpdfcommentcolor\HyColor@XZeroOneThreeFour\pc@goptd@fontcolor\pc@hyenc@fontcolorpdfcommentcolor\HyColor@XZeroOneThreeFour\pc@goptd@icolor\pc@hyenc@icolorpdfcommentcolor\pdfmark[MC]pdfmark=/ANN,Subtype=/Widget,Raw=/TU (magnetic concentration\textCR(\pc@goptd@deadline)) /T (tooltip zref@138) /C [ ] /FT/Btn /F 768 /Ff 65536 /H/N /BS ¡¡ /W 0 ¿¿ -rich intergranular lanes. Their tops extend intermittently up to Mm heights. This rapid-flame behavior is the best diagnostic to classify an H wing brightening as \HyColor@XZeroOneThreeFour\pc@goptd@color\pc@hyenc@colorpdfcommentcolor\HyColor@XZeroOneThreeFour\pc@goptd@fontcolor\pc@hyenc@fontcolorpdfcommentcolor\HyColor@XZeroOneThreeFour\pc@goptd@icolor\pc@hyenc@icolorpdfcommentcolor\pdfmark[EB]pdfmark=/ANN,Subtype=/Widget,Raw=/TU (Ellerman bomb\textCR(\pc@goptd@deadline)) /T (tooltip zref@139) /C [ ] /FT/Btn /F 768 /Ff 65536 /H/N /BS ¡¡ /W 0 ¿¿ 111We emphatically invite the reader to inspect the high-resolution \HyColor@XZeroOneThreeFour\pc@goptd@color\pc@hyenc@colorpdfcommentcolor\HyColor@XZeroOneThreeFour\pc@goptd@fontcolor\pc@hyenc@fontcolorpdfcommentcolor\HyColor@XZeroOneThreeFour\pc@goptd@icolor\pc@hyenc@icolorpdfcommentcolor\pdfmark[EB]pdfmark=/ANN,Subtype=/Widget,Raw=/TU (Ellerman bomb\textCR(\pc@goptd@deadline)) /T (tooltip zref@140) /C [ ] /FT/Btn /F 768 /Ff 65536 /H/N /BS ¡¡ /W 0 ¿¿ movies available with Paper I and so become familiar with this defining morphology..
In Paper I this flame morphology was used to identify \HyColor@XZeroOneThreeFour\pc@goptd@color\pc@hyenc@colorpdfcommentcolor\HyColor@XZeroOneThreeFour\pc@goptd@fontcolor\pc@hyenc@fontcolorpdfcommentcolor\HyColor@XZeroOneThreeFour\pc@goptd@icolor\pc@hyenc@icolorpdfcommentcolor\pdfmark[EB]pdfmark=/ANN,Subtype=/Widget,Raw=/TU (Ellerman bomb\textCR(\pc@goptd@deadline)) /T (tooltip zref@141) /C [ ] /FT/Btn /F 768 /Ff 65536 /H/N /BS ¡¡ /W 0 ¿¿ s manually, but in Paper II we defined automated selection criteria employing the brightness contrast, spatial extent, temporal continuity and lifetime of candidate features in \HyColor@XZeroOneThreeFour\pc@goptd@color\pc@hyenc@colorpdfcommentcolor\HyColor@XZeroOneThreeFour\pc@goptd@fontcolor\pc@hyenc@fontcolorpdfcommentcolor\HyColor@XZeroOneThreeFour\pc@goptd@icolor\pc@hyenc@icolorpdfcommentcolor\pdfmark[SST]pdfmark=/ANN,Subtype=/Widget,Raw=/TU (Swedish 1-m Solar Telescope\textCR(\pc@goptd@deadline)) /T (tooltip zref@142) /C [ ] /FT/Btn /F 768 /Ff 65536 /H/N /BS ¡¡ /W 0 ¿¿ imaging-spectroscopy sequences sampling the H wings. These criteria were tuned to optimally recover example \HyColor@XZeroOneThreeFour\pc@goptd@color\pc@hyenc@colorpdfcommentcolor\HyColor@XZeroOneThreeFour\pc@goptd@fontcolor\pc@hyenc@fontcolorpdfcommentcolor\HyColor@XZeroOneThreeFour\pc@goptd@icolor\pc@hyenc@icolorpdfcommentcolor\pdfmark[EB]pdfmark=/ANN,Subtype=/Widget,Raw=/TU (Ellerman bomb\textCR(\pc@goptd@deadline)) /T (tooltip zref@143) /C [ ] /FT/Btn /F 768 /Ff 65536 /H/N /BS ¡¡ /W 0 ¿¿ s that had been identified visually from their time-dependent morphology, and then applied to obtain a faster, more objective, and more complete identification of \HyColor@XZeroOneThreeFour\pc@goptd@color\pc@hyenc@colorpdfcommentcolor\HyColor@XZeroOneThreeFour\pc@goptd@fontcolor\pc@hyenc@fontcolorpdfcommentcolor\HyColor@XZeroOneThreeFour\pc@goptd@icolor\pc@hyenc@icolorpdfcommentcolor\pdfmark[EB]pdfmark=/ANN,Subtype=/Widget,Raw=/TU (Ellerman bomb\textCR(\pc@goptd@deadline)) /T (tooltip zref@144) /C [ ] /FT/Btn /F 768 /Ff 65536 /H/N /BS ¡¡ /W 0 ¿¿ s in each data set.
In the present analysis we have applied these criteria to our three datasets, but with an adjustment for dataset 2 in which we lowered the thresholds to 145% brightness contrast over the field-of-view mean for the \HyColor@XZeroOneThreeFour\pc@goptd@color\pc@hyenc@colorpdfcommentcolor\HyColor@XZeroOneThreeFour\pc@goptd@fontcolor\pc@hyenc@fontcolorpdfcommentcolor\HyColor@XZeroOneThreeFour\pc@goptd@icolor\pc@hyenc@icolorpdfcommentcolor\pdfmark[EB]pdfmark=/ANN,Subtype=/Widget,Raw=/TU (Ellerman bomb\textCR(\pc@goptd@deadline)) /T (tooltip zref@145) /C [ ] /FT/Btn /F 768 /Ff 65536 /H/N /BS ¡¡ /W 0 ¿¿ kernel and 130% for adjacent pixels, instead of the Paper II values of 155% and 140%. We did so because visual inspection showed that with the latter thresholds we missed a number of features of which the morphology suggested they were \HyColor@XZeroOneThreeFour\pc@goptd@color\pc@hyenc@colorpdfcommentcolor\HyColor@XZeroOneThreeFour\pc@goptd@fontcolor\pc@hyenc@fontcolorpdfcommentcolor\HyColor@XZeroOneThreeFour\pc@goptd@icolor\pc@hyenc@icolorpdfcommentcolor\pdfmark[EB]pdfmark=/ANN,Subtype=/Widget,Raw=/TU (Ellerman bomb\textCR(\pc@goptd@deadline)) /T (tooltip zref@146) /C [ ] /FT/Btn /F 768 /Ff 65536 /H/N /BS ¡¡ /W 0 ¿¿ s, even though weak in relative H wing excess. A reason may be that this field of view contained no dark umbrae or pores and therefore had a higher mean profile than in Paper II. Also, it was the closest to disk center where \HyColor@XZeroOneThreeFour\pc@goptd@color\pc@hyenc@colorpdfcommentcolor\HyColor@XZeroOneThreeFour\pc@goptd@fontcolor\pc@hyenc@fontcolorpdfcommentcolor\HyColor@XZeroOneThreeFour\pc@goptd@icolor\pc@hyenc@icolorpdfcommentcolor\pdfmark[MC]pdfmark=/ANN,Subtype=/Widget,Raw=/TU (magnetic concentration\textCR(\pc@goptd@deadline)) /T (tooltip zref@147) /C [ ] /FT/Btn /F 768 /Ff 65536 /H/N /BS ¡¡ /W 0 ¿¿ s appear brightest in the H wings.
Examples of the resulting threshold contours outlining \HyColor@XZeroOneThreeFour\pc@goptd@color\pc@hyenc@colorpdfcommentcolor\HyColor@XZeroOneThreeFour\pc@goptd@fontcolor\pc@hyenc@fontcolorpdfcommentcolor\HyColor@XZeroOneThreeFour\pc@goptd@icolor\pc@hyenc@icolorpdfcommentcolor\pdfmark[EB]pdfmark=/ANN,Subtype=/Widget,Raw=/TU (Ellerman bomb\textCR(\pc@goptd@deadline)) /T (tooltip zref@148) /C [ ] /FT/Btn /F 768 /Ff 65536 /H/N /BS ¡¡ /W 0 ¿¿ candidates are shown in Fig. 1 for those that were detected at the particular moment at which each image was taken. The numerous white plus signs mark other H \HyColor@XZeroOneThreeFour\pc@goptd@color\pc@hyenc@colorpdfcommentcolor\HyColor@XZeroOneThreeFour\pc@goptd@fontcolor\pc@hyenc@fontcolorpdfcommentcolor\HyColor@XZeroOneThreeFour\pc@goptd@icolor\pc@hyenc@icolorpdfcommentcolor\pdfmark[EB]pdfmark=/ANN,Subtype=/Widget,Raw=/TU (Ellerman bomb\textCR(\pc@goptd@deadline)) /T (tooltip zref@149) /C [ ] /FT/Btn /F 768 /Ff 65536 /H/N /BS ¡¡ /W 0 ¿¿ detections during the whole \HyColor@XZeroOneThreeFour\pc@goptd@color\pc@hyenc@colorpdfcommentcolor\HyColor@XZeroOneThreeFour\pc@goptd@fontcolor\pc@hyenc@fontcolorpdfcommentcolor\HyColor@XZeroOneThreeFour\pc@goptd@icolor\pc@hyenc@icolorpdfcommentcolor\pdfmark[SST]pdfmark=/ANN,Subtype=/Widget,Raw=/TU (Swedish 1-m Solar Telescope\textCR(\pc@goptd@deadline)) /T (tooltip zref@150) /C [ ] /FT/Btn /F 768 /Ff 65536 /H/N /BS ¡¡ /W 0 ¿¿ observing period. Some overlap closely and are detections of repetitive \HyColor@XZeroOneThreeFour\pc@goptd@color\pc@hyenc@colorpdfcommentcolor\HyColor@XZeroOneThreeFour\pc@goptd@fontcolor\pc@hyenc@fontcolorpdfcommentcolor\HyColor@XZeroOneThreeFour\pc@goptd@icolor\pc@hyenc@icolorpdfcommentcolor\pdfmark[EB]pdfmark=/ANN,Subtype=/Widget,Raw=/TU (Ellerman bomb\textCR(\pc@goptd@deadline)) /T (tooltip zref@151) /C [ ] /FT/Btn /F 768 /Ff 65536 /H/N /BS ¡¡ /W 0 ¿¿ s at about the same location.
2.4. \HyColor@XZeroOneThreeFour\pc@goptd@color\pc@hyenc@colorpdfcommentcolor\HyColor@XZeroOneThreeFour\pc@goptd@fontcolor\pc@hyenc@fontcolorpdfcommentcolor\HyColor@XZeroOneThreeFour\pc@goptd@icolor\pc@hyenc@icolorpdfcommentcolor\pdfmark[EB]pdfmark=/ANN,Subtype=/Widget,Raw=/TU (Ellerman bomb\textCR(\pc@goptd@deadline)) /T (tooltip zref@152) /C [ ] /FT/Btn /F 768 /Ff 65536 /H/N /BS ¡¡ /W 0 ¿¿ identification in the 1700 Å continuum
In Paper II we also tried to automate \HyColor@XZeroOneThreeFour\pc@goptd@color\pc@hyenc@colorpdfcommentcolor\HyColor@XZeroOneThreeFour\pc@goptd@fontcolor\pc@hyenc@fontcolorpdfcommentcolor\HyColor@XZeroOneThreeFour\pc@goptd@icolor\pc@hyenc@icolorpdfcommentcolor\pdfmark[EB]pdfmark=/ANN,Subtype=/Widget,Raw=/TU (Ellerman bomb\textCR(\pc@goptd@deadline)) /T (tooltip zref@154) /C [ ] /FT/Btn /F 768 /Ff 65536 /H/N /BS ¡¡ /W 0 ¿¿ -finding in \HyColor@XZeroOneThreeFour\pc@goptd@color\pc@hyenc@colorpdfcommentcolor\HyColor@XZeroOneThreeFour\pc@goptd@fontcolor\pc@hyenc@fontcolorpdfcommentcolor\HyColor@XZeroOneThreeFour\pc@goptd@icolor\pc@hyenc@icolorpdfcommentcolor\pdfmark[SDO]pdfmark=/ANN,Subtype=/Widget,Raw=/TU (Solar Dynamics Observatory\textCR(\pc@goptd@deadline)) /T (tooltip zref@155) /C [ ] /FT/Btn /F 768 /Ff 65536 /H/N /BS ¡¡ /W 0 ¿¿ /\HyColor@XZeroOneThreeFour\pc@goptd@color\pc@hyenc@colorpdfcommentcolor\HyColor@XZeroOneThreeFour\pc@goptd@fontcolor\pc@hyenc@fontcolorpdfcommentcolor\HyColor@XZeroOneThreeFour\pc@goptd@icolor\pc@hyenc@icolorpdfcommentcolor\pdfmark[AIA]pdfmark=/ANN,Subtype=/Widget,Raw=/TU (Atmospheric Imaging Assembly\textCR(\pc@goptd@deadline)) /T (tooltip zref@156) /C [ ] /FT/Btn /F 768 /Ff 65536 /H/N /BS ¡¡ /W 0 ¿¿ 1700 Å image sequences. \HyColor@XZeroOneThreeFour\pc@goptd@color\pc@hyenc@colorpdfcommentcolor\HyColor@XZeroOneThreeFour\pc@goptd@fontcolor\pc@hyenc@fontcolorpdfcommentcolor\HyColor@XZeroOneThreeFour\pc@goptd@icolor\pc@hyenc@icolorpdfcommentcolor\pdfmark[EB]pdfmark=/ANN,Subtype=/Widget,Raw=/TU (Ellerman bomb\textCR(\pc@goptd@deadline)) /T (tooltip zref@157) /C [ ] /FT/Btn /F 768 /Ff 65536 /H/N /BS ¡¡ /W 0 ¿¿ s typically appear in these as strongly enhanced, fairly pointlike and fairly stable brightness features. \HyColor@XZeroOneThreeFour\pc@goptd@color\pc@hyenc@colorpdfcommentcolor\HyColor@XZeroOneThreeFour\pc@goptd@fontcolor\pc@hyenc@fontcolorpdfcommentcolor\HyColor@XZeroOneThreeFour\pc@goptd@icolor\pc@hyenc@icolorpdfcommentcolor\pdfmark[AIA]pdfmark=/ANN,Subtype=/Widget,Raw=/TU (Atmospheric Imaging Assembly\textCR(\pc@goptd@deadline)) /T (tooltip zref@158) /C [ ] /FT/Btn /F 768 /Ff 65536 /H/N /BS ¡¡ /W 0 ¿¿ 1600 Å images show them at yet larger brightness contrast above ordinary \HyColor@XZeroOneThreeFour\pc@goptd@color\pc@hyenc@colorpdfcommentcolor\HyColor@XZeroOneThreeFour\pc@goptd@fontcolor\pc@hyenc@fontcolorpdfcommentcolor\HyColor@XZeroOneThreeFour\pc@goptd@icolor\pc@hyenc@icolorpdfcommentcolor\pdfmark[MC]pdfmark=/ANN,Subtype=/Widget,Raw=/TU (magnetic concentration\textCR(\pc@goptd@deadline)) /T (tooltip zref@159) /C [ ] /FT/Btn /F 768 /Ff 65536 /H/N /BS ¡¡ /W 0 ¿¿ s, but as noted above the scene at this wavelength often contains \HyColor@XZeroOneThreeFour\pc@goptd@color\pc@hyenc@colorpdfcommentcolor\HyColor@XZeroOneThreeFour\pc@goptd@fontcolor\pc@hyenc@fontcolorpdfcommentcolor\HyColor@XZeroOneThreeFour\pc@goptd@icolor\pc@hyenc@icolorpdfcommentcolor\pdfmark[FAF]pdfmark=/ANN,Subtype=/Widget,Raw=/TU (flaring arch filament\textCR(\pc@goptd@deadline)) /T (tooltip zref@160) /C [ ] /FT/Btn /F 768 /Ff 65536 /H/N /BS ¡¡ /W 0 ¿¿ s as well (Rutten et al. 2013).
In the less \HyColor@XZeroOneThreeFour\pc@goptd@color\pc@hyenc@colorpdfcommentcolor\HyColor@XZeroOneThreeFour\pc@goptd@fontcolor\pc@hyenc@fontcolorpdfcommentcolor\HyColor@XZeroOneThreeFour\pc@goptd@icolor\pc@hyenc@icolorpdfcommentcolor\pdfmark[FAF]pdfmark=/ANN,Subtype=/Widget,Raw=/TU (flaring arch filament\textCR(\pc@goptd@deadline)) /T (tooltip zref@161) /C [ ] /FT/Btn /F 768 /Ff 65536 /H/N /BS ¡¡ /W 0 ¿¿ -infested 1700 Å images a contrast criterion of 8 above the mean intensity was found to recover most of the brighter H \HyColor@XZeroOneThreeFour\pc@goptd@color\pc@hyenc@colorpdfcommentcolor\HyColor@XZeroOneThreeFour\pc@goptd@fontcolor\pc@hyenc@fontcolorpdfcommentcolor\HyColor@XZeroOneThreeFour\pc@goptd@icolor\pc@hyenc@icolorpdfcommentcolor\pdfmark[EB]pdfmark=/ANN,Subtype=/Widget,Raw=/TU (Ellerman bomb\textCR(\pc@goptd@deadline)) /T (tooltip zref@162) /C [ ] /FT/Btn /F 768 /Ff 65536 /H/N /BS ¡¡ /W 0 ¿¿ s. This conservative threshold may miss weaker \HyColor@XZeroOneThreeFour\pc@goptd@color\pc@hyenc@colorpdfcommentcolor\HyColor@XZeroOneThreeFour\pc@goptd@fontcolor\pc@hyenc@fontcolorpdfcommentcolor\HyColor@XZeroOneThreeFour\pc@goptd@icolor\pc@hyenc@icolorpdfcommentcolor\pdfmark[EB]pdfmark=/ANN,Subtype=/Widget,Raw=/TU (Ellerman bomb\textCR(\pc@goptd@deadline)) /T (tooltip zref@163) /C [ ] /FT/Btn /F 768 /Ff 65536 /H/N /BS ¡¡ /W 0 ¿¿ s, but lower cutoff values give more confusion with non-eruptive \HyColor@XZeroOneThreeFour\pc@goptd@color\pc@hyenc@colorpdfcommentcolor\HyColor@XZeroOneThreeFour\pc@goptd@fontcolor\pc@hyenc@fontcolorpdfcommentcolor\HyColor@XZeroOneThreeFour\pc@goptd@icolor\pc@hyenc@icolorpdfcommentcolor\pdfmark[MC]pdfmark=/ANN,Subtype=/Widget,Raw=/TU (magnetic concentration\textCR(\pc@goptd@deadline)) /T (tooltip zref@164) /C [ ] /FT/Btn /F 768 /Ff 65536 /H/N /BS ¡¡ /W 0 ¿¿ s. An additional lifetime maximum of 5 min was also set to distinguish \HyColor@XZeroOneThreeFour\pc@goptd@color\pc@hyenc@colorpdfcommentcolor\HyColor@XZeroOneThreeFour\pc@goptd@fontcolor\pc@hyenc@fontcolorpdfcommentcolor\HyColor@XZeroOneThreeFour\pc@goptd@icolor\pc@hyenc@icolorpdfcommentcolor\pdfmark[EB]pdfmark=/ANN,Subtype=/Widget,Raw=/TU (Ellerman bomb\textCR(\pc@goptd@deadline)) /T (tooltip zref@165) /C [ ] /FT/Btn /F 768 /Ff 65536 /H/N /BS ¡¡ /W 0 ¿¿ s from longer-lived \HyColor@XZeroOneThreeFour\pc@goptd@color\pc@hyenc@colorpdfcommentcolor\HyColor@XZeroOneThreeFour\pc@goptd@fontcolor\pc@hyenc@fontcolorpdfcommentcolor\HyColor@XZeroOneThreeFour\pc@goptd@icolor\pc@hyenc@icolorpdfcommentcolor\pdfmark[MC]pdfmark=/ANN,Subtype=/Widget,Raw=/TU (magnetic concentration\textCR(\pc@goptd@deadline)) /T (tooltip zref@166) /C [ ] /FT/Btn /F 768 /Ff 65536 /H/N /BS ¡¡ /W 0 ¿¿ s. A further non-automated check is to ignore 1700 Å detections when they exhibit \HyColor@XZeroOneThreeFour\pc@goptd@color\pc@hyenc@colorpdfcommentcolor\HyColor@XZeroOneThreeFour\pc@goptd@fontcolor\pc@hyenc@fontcolorpdfcommentcolor\HyColor@XZeroOneThreeFour\pc@goptd@icolor\pc@hyenc@icolorpdfcommentcolor\pdfmark[FAF]pdfmark=/ANN,Subtype=/Widget,Raw=/TU (flaring arch filament\textCR(\pc@goptd@deadline)) /T (tooltip zref@167) /C [ ] /FT/Btn /F 768 /Ff 65536 /H/N /BS ¡¡ /W 0 ¿¿ behavior at 1600 Å.
2.5. \HyColor@XZeroOneThreeFour\pc@goptd@color\pc@hyenc@colorpdfcommentcolor\HyColor@XZeroOneThreeFour\pc@goptd@fontcolor\pc@hyenc@fontcolorpdfcommentcolor\HyColor@XZeroOneThreeFour\pc@goptd@icolor\pc@hyenc@icolorpdfcommentcolor\pdfmark[EB]pdfmark=/ANN,Subtype=/Widget,Raw=/TU (Ellerman bomb\textCR(\pc@goptd@deadline)) /T (tooltip zref@168) /C [ ] /FT/Btn /F 768 /Ff 65536 /H/N /BS ¡¡ /W 0 ¿¿ visibility in \HyColor@XZeroOneThreeFour\pc@goptd@color\pc@hyenc@colorpdfcommentcolor\HyColor@XZeroOneThreeFour\pc@goptd@fontcolor\pc@hyenc@fontcolorpdfcommentcolor\HyColor@XZeroOneThreeFour\pc@goptd@icolor\pc@hyenc@icolorpdfcommentcolor\pdfmark[IRIS]pdfmark=/ANN,Subtype=/Widget,Raw=/TU (Interface Region Imaging Spectrograph\textCR(\pc@goptd@deadline)) /T (tooltip zref@169) /C [ ] /FT/Btn /F 768 /Ff 65536 /H/N /BS ¡¡ /W 0 ¿¿ slitjaw images and spectra
Blinking of the \HyColor@XZeroOneThreeFour\pc@goptd@color\pc@hyenc@colorpdfcommentcolor\HyColor@XZeroOneThreeFour\pc@goptd@fontcolor\pc@hyenc@fontcolorpdfcommentcolor\HyColor@XZeroOneThreeFour\pc@goptd@icolor\pc@hyenc@icolorpdfcommentcolor\pdfmark[IRIS]pdfmark=/ANN,Subtype=/Widget,Raw=/TU (Interface Region Imaging Spectrograph\textCR(\pc@goptd@deadline)) /T (tooltip zref@172) /C [ ] /FT/Btn /F 768 /Ff 65536 /H/N /BS ¡¡ /W 0 ¿¿ slitjaw and the \HyColor@XZeroOneThreeFour\pc@goptd@color\pc@hyenc@colorpdfcommentcolor\HyColor@XZeroOneThreeFour\pc@goptd@fontcolor\pc@hyenc@fontcolorpdfcommentcolor\HyColor@XZeroOneThreeFour\pc@goptd@icolor\pc@hyenc@icolorpdfcommentcolor\pdfmark[CRISP]pdfmark=/ANN,Subtype=/Widget,Raw=/TU (CRisp Imaging SpectroPolarimeter\textCR(\pc@goptd@deadline)) /T (tooltip zref@173) /C [ ] /FT/Btn /F 768 /Ff 65536 /H/N /BS ¡¡ /W 0 ¿¿ H movies suggested that bright \HyColor@XZeroOneThreeFour\pc@goptd@color\pc@hyenc@colorpdfcommentcolor\HyColor@XZeroOneThreeFour\pc@goptd@fontcolor\pc@hyenc@fontcolorpdfcommentcolor\HyColor@XZeroOneThreeFour\pc@goptd@icolor\pc@hyenc@icolorpdfcommentcolor\pdfmark[EB]pdfmark=/ANN,Subtype=/Widget,Raw=/TU (Ellerman bomb\textCR(\pc@goptd@deadline)) /T (tooltip zref@174) /C [ ] /FT/Btn /F 768 /Ff 65536 /H/N /BS ¡¡ /W 0 ¿¿ s detected in the H wings often show up as bright features in the C ii, Si iv, and Mg ii k slitjaw images. However, the fraction for which we also have \HyColor@XZeroOneThreeFour\pc@goptd@color\pc@hyenc@colorpdfcommentcolor\HyColor@XZeroOneThreeFour\pc@goptd@fontcolor\pc@hyenc@fontcolorpdfcommentcolor\HyColor@XZeroOneThreeFour\pc@goptd@icolor\pc@hyenc@icolorpdfcommentcolor\pdfmark[IRIS]pdfmark=/ANN,Subtype=/Widget,Raw=/TU (Interface Region Imaging Spectrograph\textCR(\pc@goptd@deadline)) /T (tooltip zref@175) /C [ ] /FT/Btn /F 768 /Ff 65536 /H/N /BS ¡¡ /W 0 ¿¿ spectra is small. For dataset 1 this is obvious in the top row of Fig. 1 where the narrow \HyColor@XZeroOneThreeFour\pc@goptd@color\pc@hyenc@colorpdfcommentcolor\HyColor@XZeroOneThreeFour\pc@goptd@fontcolor\pc@hyenc@fontcolorpdfcommentcolor\HyColor@XZeroOneThreeFour\pc@goptd@icolor\pc@hyenc@icolorpdfcommentcolor\pdfmark[IRIS]pdfmark=/ANN,Subtype=/Widget,Raw=/TU (Interface Region Imaging Spectrograph\textCR(\pc@goptd@deadline)) /T (tooltip zref@176) /C [ ] /FT/Btn /F 768 /Ff 65536 /H/N /BS ¡¡ /W 0 ¿¿ scan-strip missed most H \HyColor@XZeroOneThreeFour\pc@goptd@color\pc@hyenc@colorpdfcommentcolor\HyColor@XZeroOneThreeFour\pc@goptd@fontcolor\pc@hyenc@fontcolorpdfcommentcolor\HyColor@XZeroOneThreeFour\pc@goptd@icolor\pc@hyenc@icolorpdfcommentcolor\pdfmark[EB]pdfmark=/ANN,Subtype=/Widget,Raw=/TU (Ellerman bomb\textCR(\pc@goptd@deadline)) /T (tooltip zref@177) /C [ ] /FT/Btn /F 768 /Ff 65536 /H/N /BS ¡¡ /W 0 ¿¿ detections (white plus signs).
For datasets 2 and 3 the \HyColor@XZeroOneThreeFour\pc@goptd@color\pc@hyenc@colorpdfcommentcolor\HyColor@XZeroOneThreeFour\pc@goptd@fontcolor\pc@hyenc@fontcolorpdfcommentcolor\HyColor@XZeroOneThreeFour\pc@goptd@icolor\pc@hyenc@icolorpdfcommentcolor\pdfmark[IRIS]pdfmark=/ANN,Subtype=/Widget,Raw=/TU (Interface Region Imaging Spectrograph\textCR(\pc@goptd@deadline)) /T (tooltip zref@178) /C [ ] /FT/Btn /F 768 /Ff 65536 /H/N /BS ¡¡ /W 0 ¿¿ raster extent was much wider so that many more H \HyColor@XZeroOneThreeFour\pc@goptd@color\pc@hyenc@colorpdfcommentcolor\HyColor@XZeroOneThreeFour\pc@goptd@fontcolor\pc@hyenc@fontcolorpdfcommentcolor\HyColor@XZeroOneThreeFour\pc@goptd@icolor\pc@hyenc@icolorpdfcommentcolor\pdfmark[EB]pdfmark=/ANN,Subtype=/Widget,Raw=/TU (Ellerman bomb\textCR(\pc@goptd@deadline)) /T (tooltip zref@179) /C [ ] /FT/Btn /F 768 /Ff 65536 /H/N /BS ¡¡ /W 0 ¿¿ s fell within it, but the slow raster repeat cadence of 516 s meant that most of these were not sampled spectroscopically during their brief lifetime. Nevertheless, in the few cases of proper \HyColor@XZeroOneThreeFour\pc@goptd@color\pc@hyenc@colorpdfcommentcolor\HyColor@XZeroOneThreeFour\pc@goptd@fontcolor\pc@hyenc@fontcolorpdfcommentcolor\HyColor@XZeroOneThreeFour\pc@goptd@icolor\pc@hyenc@icolorpdfcommentcolor\pdfmark[EB]pdfmark=/ANN,Subtype=/Widget,Raw=/TU (Ellerman bomb\textCR(\pc@goptd@deadline)) /T (tooltip zref@180) /C [ ] /FT/Btn /F 768 /Ff 65536 /H/N /BS ¡¡ /W 0 ¿¿ slit coverage the \HyColor@XZeroOneThreeFour\pc@goptd@color\pc@hyenc@colorpdfcommentcolor\HyColor@XZeroOneThreeFour\pc@goptd@fontcolor\pc@hyenc@fontcolorpdfcommentcolor\HyColor@XZeroOneThreeFour\pc@goptd@icolor\pc@hyenc@icolorpdfcommentcolor\pdfmark[IRIS]pdfmark=/ANN,Subtype=/Widget,Raw=/TU (Interface Region Imaging Spectrograph\textCR(\pc@goptd@deadline)) /T (tooltip zref@181) /C [ ] /FT/Btn /F 768 /Ff 65536 /H/N /BS ¡¡ /W 0 ¿¿ spectra show corresponding brightening of the major \HyColor@XZeroOneThreeFour\pc@goptd@color\pc@hyenc@colorpdfcommentcolor\HyColor@XZeroOneThreeFour\pc@goptd@fontcolor\pc@hyenc@fontcolorpdfcommentcolor\HyColor@XZeroOneThreeFour\pc@goptd@icolor\pc@hyenc@icolorpdfcommentcolor\pdfmark[IRIS]pdfmark=/ANN,Subtype=/Widget,Raw=/TU (Interface Region Imaging Spectrograph\textCR(\pc@goptd@deadline)) /T (tooltip zref@182) /C [ ] /FT/Btn /F 768 /Ff 65536 /H/N /BS ¡¡ /W 0 ¿¿ lines, so that it is probable that the slitjaw brightenings are simply set by the wavelength-integrated enhancements of these lines.
Examples are shown in Fig. 1 and yet clearer in the smaller cutout sequences in Figs. 2, 6, and 9 discussed below. In general, the bright \HyColor@XZeroOneThreeFour\pc@goptd@color\pc@hyenc@colorpdfcommentcolor\HyColor@XZeroOneThreeFour\pc@goptd@fontcolor\pc@hyenc@fontcolorpdfcommentcolor\HyColor@XZeroOneThreeFour\pc@goptd@icolor\pc@hyenc@icolorpdfcommentcolor\pdfmark[IRIS]pdfmark=/ANN,Subtype=/Widget,Raw=/TU (Interface Region Imaging Spectrograph\textCR(\pc@goptd@deadline)) /T (tooltip zref@183) /C [ ] /FT/Btn /F 768 /Ff 65536 /H/N /BS ¡¡ /W 0 ¿¿ slitjaw features are not one-to-one identical with the H -wing brightenings but there is good overall correspondence in location, orientation, shape, and evolution.
2.6. \HyColor@XZeroOneThreeFour\pc@goptd@color\pc@hyenc@colorpdfcommentcolor\HyColor@XZeroOneThreeFour\pc@goptd@fontcolor\pc@hyenc@fontcolorpdfcommentcolor\HyColor@XZeroOneThreeFour\pc@goptd@icolor\pc@hyenc@icolorpdfcommentcolor\pdfmark[EB]pdfmark=/ANN,Subtype=/Widget,Raw=/TU (Ellerman bomb\textCR(\pc@goptd@deadline)) /T (tooltip zref@184) /C [ ] /FT/Btn /F 768 /Ff 65536 /H/N /BS ¡¡ /W 0 ¿¿ and \HyColor@XZeroOneThreeFour\pc@goptd@color\pc@hyenc@colorpdfcommentcolor\HyColor@XZeroOneThreeFour\pc@goptd@fontcolor\pc@hyenc@fontcolorpdfcommentcolor\HyColor@XZeroOneThreeFour\pc@goptd@icolor\pc@hyenc@icolorpdfcommentcolor\pdfmark[FAF]pdfmark=/ANN,Subtype=/Widget,Raw=/TU (flaring arch filament\textCR(\pc@goptd@deadline)) /T (tooltip zref@185) /C [ ] /FT/Btn /F 768 /Ff 65536 /H/N /BS ¡¡ /W 0 ¿¿ selection for presentation here
For dataset 1 application of the Paper II H criteria resulted in 31 H \HyColor@XZeroOneThreeFour\pc@goptd@color\pc@hyenc@colorpdfcommentcolor\HyColor@XZeroOneThreeFour\pc@goptd@fontcolor\pc@hyenc@fontcolorpdfcommentcolor\HyColor@XZeroOneThreeFour\pc@goptd@icolor\pc@hyenc@icolorpdfcommentcolor\pdfmark[EB]pdfmark=/ANN,Subtype=/Widget,Raw=/TU (Ellerman bomb\textCR(\pc@goptd@deadline)) /T (tooltip zref@188) /C [ ] /FT/Btn /F 768 /Ff 65536 /H/N /BS ¡¡ /W 0 ¿¿ detections, of which many showed pronounced slitjaw brightening. However, of those 31 H \HyColor@XZeroOneThreeFour\pc@goptd@color\pc@hyenc@colorpdfcommentcolor\HyColor@XZeroOneThreeFour\pc@goptd@fontcolor\pc@hyenc@fontcolorpdfcommentcolor\HyColor@XZeroOneThreeFour\pc@goptd@icolor\pc@hyenc@icolorpdfcommentcolor\pdfmark[EB]pdfmark=/ANN,Subtype=/Widget,Raw=/TU (Ellerman bomb\textCR(\pc@goptd@deadline)) /T (tooltip zref@189) /C [ ] /FT/Btn /F 768 /Ff 65536 /H/N /BS ¡¡ /W 0 ¿¿ s only 4 where sampled by the \HyColor@XZeroOneThreeFour\pc@goptd@color\pc@hyenc@colorpdfcommentcolor\HyColor@XZeroOneThreeFour\pc@goptd@fontcolor\pc@hyenc@fontcolorpdfcommentcolor\HyColor@XZeroOneThreeFour\pc@goptd@icolor\pc@hyenc@icolorpdfcommentcolor\pdfmark[IRIS]pdfmark=/ANN,Subtype=/Widget,Raw=/TU (Interface Region Imaging Spectrograph\textCR(\pc@goptd@deadline)) /T (tooltip zref@190) /C [ ] /FT/Btn /F 768 /Ff 65536 /H/N /BS ¡¡ /W 0 ¿¿ slit and only one of these showed pronounced brightening in the slitjaws. We selected the latter one for detailed presentation below and henceforth refer to this \HyColor@XZeroOneThreeFour\pc@goptd@color\pc@hyenc@colorpdfcommentcolor\HyColor@XZeroOneThreeFour\pc@goptd@fontcolor\pc@hyenc@fontcolorpdfcommentcolor\HyColor@XZeroOneThreeFour\pc@goptd@icolor\pc@hyenc@icolorpdfcommentcolor\pdfmark[EB]pdfmark=/ANN,Subtype=/Widget,Raw=/TU (Ellerman bomb\textCR(\pc@goptd@deadline)) /T (tooltip zref@191) /C [ ] /FT/Btn /F 768 /Ff 65536 /H/N /BS ¡¡ /W 0 ¿¿ as EB-1. It also passed the 1700 Å criteria of Paper II, while the other three sampled by the \HyColor@XZeroOneThreeFour\pc@goptd@color\pc@hyenc@colorpdfcommentcolor\HyColor@XZeroOneThreeFour\pc@goptd@fontcolor\pc@hyenc@fontcolorpdfcommentcolor\HyColor@XZeroOneThreeFour\pc@goptd@icolor\pc@hyenc@icolorpdfcommentcolor\pdfmark[IRIS]pdfmark=/ANN,Subtype=/Widget,Raw=/TU (Interface Region Imaging Spectrograph\textCR(\pc@goptd@deadline)) /T (tooltip zref@192) /C [ ] /FT/Btn /F 768 /Ff 65536 /H/N /BS ¡¡ /W 0 ¿¿ slits did not.
Data set 2 was closest to disk center so that distinction from ordinary \HyColor@XZeroOneThreeFour\pc@goptd@color\pc@hyenc@colorpdfcommentcolor\HyColor@XZeroOneThreeFour\pc@goptd@fontcolor\pc@hyenc@fontcolorpdfcommentcolor\HyColor@XZeroOneThreeFour\pc@goptd@icolor\pc@hyenc@icolorpdfcommentcolor\pdfmark[MC]pdfmark=/ANN,Subtype=/Widget,Raw=/TU (magnetic concentration\textCR(\pc@goptd@deadline)) /T (tooltip zref@193) /C [ ] /FT/Btn /F 768 /Ff 65536 /H/N /BS ¡¡ /W 0 ¿¿ s and recognition of flame morphology was likely hampered by top-down viewing. Our down-tuned H criteria gave 49 \HyColor@XZeroOneThreeFour\pc@goptd@color\pc@hyenc@colorpdfcommentcolor\HyColor@XZeroOneThreeFour\pc@goptd@fontcolor\pc@hyenc@fontcolorpdfcommentcolor\HyColor@XZeroOneThreeFour\pc@goptd@icolor\pc@hyenc@icolorpdfcommentcolor\pdfmark[EB]pdfmark=/ANN,Subtype=/Widget,Raw=/TU (Ellerman bomb\textCR(\pc@goptd@deadline)) /T (tooltip zref@194) /C [ ] /FT/Btn /F 768 /Ff 65536 /H/N /BS ¡¡ /W 0 ¿¿ detections, of which 6 were sampled spectroscopically by \HyColor@XZeroOneThreeFour\pc@goptd@color\pc@hyenc@colorpdfcommentcolor\HyColor@XZeroOneThreeFour\pc@goptd@fontcolor\pc@hyenc@fontcolorpdfcommentcolor\HyColor@XZeroOneThreeFour\pc@goptd@icolor\pc@hyenc@icolorpdfcommentcolor\pdfmark[IRIS]pdfmark=/ANN,Subtype=/Widget,Raw=/TU (Interface Region Imaging Spectrograph\textCR(\pc@goptd@deadline)) /T (tooltip zref@195) /C [ ] /FT/Btn /F 768 /Ff 65536 /H/N /BS ¡¡ /W 0 ¿¿ . Most were weak in H and the \HyColor@XZeroOneThreeFour\pc@goptd@color\pc@hyenc@colorpdfcommentcolor\HyColor@XZeroOneThreeFour\pc@goptd@fontcolor\pc@hyenc@fontcolorpdfcommentcolor\HyColor@XZeroOneThreeFour\pc@goptd@icolor\pc@hyenc@icolorpdfcommentcolor\pdfmark[IRIS]pdfmark=/ANN,Subtype=/Widget,Raw=/TU (Interface Region Imaging Spectrograph\textCR(\pc@goptd@deadline)) /T (tooltip zref@196) /C [ ] /FT/Btn /F 768 /Ff 65536 /H/N /BS ¡¡ /W 0 ¿¿ spectra, and weak or invisible in the \HyColor@XZeroOneThreeFour\pc@goptd@color\pc@hyenc@colorpdfcommentcolor\HyColor@XZeroOneThreeFour\pc@goptd@fontcolor\pc@hyenc@fontcolorpdfcommentcolor\HyColor@XZeroOneThreeFour\pc@goptd@icolor\pc@hyenc@icolorpdfcommentcolor\pdfmark[IRIS]pdfmark=/ANN,Subtype=/Widget,Raw=/TU (Interface Region Imaging Spectrograph\textCR(\pc@goptd@deadline)) /T (tooltip zref@197) /C [ ] /FT/Btn /F 768 /Ff 65536 /H/N /BS ¡¡ /W 0 ¿¿ slitjaws. We selected the three with the highest \HyColor@XZeroOneThreeFour\pc@goptd@color\pc@hyenc@colorpdfcommentcolor\HyColor@XZeroOneThreeFour\pc@goptd@fontcolor\pc@hyenc@fontcolorpdfcommentcolor\HyColor@XZeroOneThreeFour\pc@goptd@icolor\pc@hyenc@icolorpdfcommentcolor\pdfmark[IRIS]pdfmark=/ANN,Subtype=/Widget,Raw=/TU (Interface Region Imaging Spectrograph\textCR(\pc@goptd@deadline)) /T (tooltip zref@198) /C [ ] /FT/Btn /F 768 /Ff 65536 /H/N /BS ¡¡ /W 0 ¿¿ profiles and call them EB-a, EB-b, EB-c henceforth and present their spectra below as examples of weaker or even questionable \HyColor@XZeroOneThreeFour\pc@goptd@color\pc@hyenc@colorpdfcommentcolor\HyColor@XZeroOneThreeFour\pc@goptd@fontcolor\pc@hyenc@fontcolorpdfcommentcolor\HyColor@XZeroOneThreeFour\pc@goptd@icolor\pc@hyenc@icolorpdfcommentcolor\pdfmark[EB]pdfmark=/ANN,Subtype=/Widget,Raw=/TU (Ellerman bomb\textCR(\pc@goptd@deadline)) /T (tooltip zref@199) /C [ ] /FT/Btn /F 768 /Ff 65536 /H/N /BS ¡¡ /W 0 ¿¿ s. Only EB-b passed the 1700 Å criteria.
For dataset 3 the Paper II H criteria yielded 56 detections of which 10 were sampled spectroscopically by \HyColor@XZeroOneThreeFour\pc@goptd@color\pc@hyenc@colorpdfcommentcolor\HyColor@XZeroOneThreeFour\pc@goptd@fontcolor\pc@hyenc@fontcolorpdfcommentcolor\HyColor@XZeroOneThreeFour\pc@goptd@icolor\pc@hyenc@icolorpdfcommentcolor\pdfmark[IRIS]pdfmark=/ANN,Subtype=/Widget,Raw=/TU (Interface Region Imaging Spectrograph\textCR(\pc@goptd@deadline)) /T (tooltip zref@200) /C [ ] /FT/Btn /F 768 /Ff 65536 /H/N /BS ¡¡ /W 0 ¿¿ . Most were weak; the exception was a very long-lived repetitive \HyColor@XZeroOneThreeFour\pc@goptd@color\pc@hyenc@colorpdfcommentcolor\HyColor@XZeroOneThreeFour\pc@goptd@fontcolor\pc@hyenc@fontcolorpdfcommentcolor\HyColor@XZeroOneThreeFour\pc@goptd@icolor\pc@hyenc@icolorpdfcommentcolor\pdfmark[EB]pdfmark=/ANN,Subtype=/Widget,Raw=/TU (Ellerman bomb\textCR(\pc@goptd@deadline)) /T (tooltip zref@201) /C [ ] /FT/Btn /F 768 /Ff 65536 /H/N /BS ¡¡ /W 0 ¿¿ which we call EB-2 henceforth. It did not pass the Paper II 1700 Å criteria initially, but it did when we relaxed the constraint on lifetime to distinguish weak \HyColor@XZeroOneThreeFour\pc@goptd@color\pc@hyenc@colorpdfcommentcolor\HyColor@XZeroOneThreeFour\pc@goptd@fontcolor\pc@hyenc@fontcolorpdfcommentcolor\HyColor@XZeroOneThreeFour\pc@goptd@icolor\pc@hyenc@icolorpdfcommentcolor\pdfmark[EB]pdfmark=/ANN,Subtype=/Widget,Raw=/TU (Ellerman bomb\textCR(\pc@goptd@deadline)) /T (tooltip zref@202) /C [ ] /FT/Btn /F 768 /Ff 65536 /H/N /BS ¡¡ /W 0 ¿¿ s from longer-lived \HyColor@XZeroOneThreeFour\pc@goptd@color\pc@hyenc@colorpdfcommentcolor\HyColor@XZeroOneThreeFour\pc@goptd@fontcolor\pc@hyenc@fontcolorpdfcommentcolor\HyColor@XZeroOneThreeFour\pc@goptd@icolor\pc@hyenc@icolorpdfcommentcolor\pdfmark[MC]pdfmark=/ANN,Subtype=/Widget,Raw=/TU (magnetic concentration\textCR(\pc@goptd@deadline)) /T (tooltip zref@203) /C [ ] /FT/Btn /F 768 /Ff 65536 /H/N /BS ¡¡ /W 0 ¿¿ s. EB-2 was clearly not a pseudo-EB in H . In 1700 Å it occurred repetitively for an exceptionally long period of time.
In dataset 3 we also noted a string of fierce repetitive interconnected brightenings of which the \HyColor@XZeroOneThreeFour\pc@goptd@color\pc@hyenc@colorpdfcommentcolor\HyColor@XZeroOneThreeFour\pc@goptd@fontcolor\pc@hyenc@fontcolorpdfcommentcolor\HyColor@XZeroOneThreeFour\pc@goptd@icolor\pc@hyenc@icolorpdfcommentcolor\pdfmark[SDO]pdfmark=/ANN,Subtype=/Widget,Raw=/TU (Solar Dynamics Observatory\textCR(\pc@goptd@deadline)) /T (tooltip zref@204) /C [ ] /FT/Btn /F 768 /Ff 65536 /H/N /BS ¡¡ /W 0 ¿¿ /\HyColor@XZeroOneThreeFour\pc@goptd@color\pc@hyenc@colorpdfcommentcolor\HyColor@XZeroOneThreeFour\pc@goptd@fontcolor\pc@hyenc@fontcolorpdfcommentcolor\HyColor@XZeroOneThreeFour\pc@goptd@icolor\pc@hyenc@icolorpdfcommentcolor\pdfmark[AIA]pdfmark=/ANN,Subtype=/Widget,Raw=/TU (Atmospheric Imaging Assembly\textCR(\pc@goptd@deadline)) /T (tooltip zref@205) /C [ ] /FT/Btn /F 768 /Ff 65536 /H/N /BS ¡¡ /W 0 ¿¿ 1600 Å movie shows they were \HyColor@XZeroOneThreeFour\pc@goptd@color\pc@hyenc@colorpdfcommentcolor\HyColor@XZeroOneThreeFour\pc@goptd@fontcolor\pc@hyenc@fontcolorpdfcommentcolor\HyColor@XZeroOneThreeFour\pc@goptd@icolor\pc@hyenc@icolorpdfcommentcolor\pdfmark[FAF]pdfmark=/ANN,Subtype=/Widget,Raw=/TU (flaring arch filament\textCR(\pc@goptd@deadline)) /T (tooltip zref@206) /C [ ] /FT/Btn /F 768 /Ff 65536 /H/N /BS ¡¡ /W 0 ¿¿ s. We also selected two of these for comparative display and discussion below.
A fourth \HyColor@XZeroOneThreeFour\pc@goptd@color\pc@hyenc@colorpdfcommentcolor\HyColor@XZeroOneThreeFour\pc@goptd@fontcolor\pc@hyenc@fontcolorpdfcommentcolor\HyColor@XZeroOneThreeFour\pc@goptd@icolor\pc@hyenc@icolorpdfcommentcolor\pdfmark[SST]pdfmark=/ANN,Subtype=/Widget,Raw=/TU (Swedish 1-m Solar Telescope\textCR(\pc@goptd@deadline)) /T (tooltip zref@207) /C [ ] /FT/Btn /F 768 /Ff 65536 /H/N /BS ¡¡ /W 0 ¿¿ -\HyColor@XZeroOneThreeFour\pc@goptd@color\pc@hyenc@colorpdfcommentcolor\HyColor@XZeroOneThreeFour\pc@goptd@fontcolor\pc@hyenc@fontcolorpdfcommentcolor\HyColor@XZeroOneThreeFour\pc@goptd@icolor\pc@hyenc@icolorpdfcommentcolor\pdfmark[IRIS]pdfmark=/ANN,Subtype=/Widget,Raw=/TU (Interface Region Imaging Spectrograph\textCR(\pc@goptd@deadline)) /T (tooltip zref@208) /C [ ] /FT/Btn /F 768 /Ff 65536 /H/N /BS ¡¡ /W 0 ¿¿ dataset taken on September 25, 2013 was discarded because of its 48 H \HyColor@XZeroOneThreeFour\pc@goptd@color\pc@hyenc@colorpdfcommentcolor\HyColor@XZeroOneThreeFour\pc@goptd@fontcolor\pc@hyenc@fontcolorpdfcommentcolor\HyColor@XZeroOneThreeFour\pc@goptd@icolor\pc@hyenc@icolorpdfcommentcolor\pdfmark[EB]pdfmark=/ANN,Subtype=/Widget,Raw=/TU (Ellerman bomb\textCR(\pc@goptd@deadline)) /T (tooltip zref@209) /C [ ] /FT/Btn /F 768 /Ff 65536 /H/N /BS ¡¡ /W 0 ¿¿ detections only one was sampled by \HyColor@XZeroOneThreeFour\pc@goptd@color\pc@hyenc@colorpdfcommentcolor\HyColor@XZeroOneThreeFour\pc@goptd@fontcolor\pc@hyenc@fontcolorpdfcommentcolor\HyColor@XZeroOneThreeFour\pc@goptd@icolor\pc@hyenc@icolorpdfcommentcolor\pdfmark[IRIS]pdfmark=/ANN,Subtype=/Widget,Raw=/TU (Interface Region Imaging Spectrograph\textCR(\pc@goptd@deadline)) /T (tooltip zref@210) /C [ ] /FT/Btn /F 768 /Ff 65536 /H/N /BS ¡¡ /W 0 ¿¿ . It did not show up in the slitjaw images and produced only slight ultraviolet line brightenings, much as the discarded \HyColor@XZeroOneThreeFour\pc@goptd@color\pc@hyenc@colorpdfcommentcolor\HyColor@XZeroOneThreeFour\pc@goptd@fontcolor\pc@hyenc@fontcolorpdfcommentcolor\HyColor@XZeroOneThreeFour\pc@goptd@icolor\pc@hyenc@icolorpdfcommentcolor\pdfmark[EB]pdfmark=/ANN,Subtype=/Widget,Raw=/TU (Ellerman bomb\textCR(\pc@goptd@deadline)) /T (tooltip zref@211) /C [ ] /FT/Btn /F 768 /Ff 65536 /H/N /BS ¡¡ /W 0 ¿¿ s in dataset 2 and therefore, like those, not selected for detailed presentation here. There were more \HyColor@XZeroOneThreeFour\pc@goptd@color\pc@hyenc@colorpdfcommentcolor\HyColor@XZeroOneThreeFour\pc@goptd@fontcolor\pc@hyenc@fontcolorpdfcommentcolor\HyColor@XZeroOneThreeFour\pc@goptd@icolor\pc@hyenc@icolorpdfcommentcolor\pdfmark[EB]pdfmark=/ANN,Subtype=/Widget,Raw=/TU (Ellerman bomb\textCR(\pc@goptd@deadline)) /T (tooltip zref@212) /C [ ] /FT/Btn /F 768 /Ff 65536 /H/N /BS ¡¡ /W 0 ¿¿ s visible in the latter, but outside the narrow raster strip.
3. Results
In this section we present the observations for each selected feature in succession, using the same plot formats for cutout samples from the \HyColor@XZeroOneThreeFour\pc@goptd@color\pc@hyenc@colorpdfcommentcolor\HyColor@XZeroOneThreeFour\pc@goptd@fontcolor\pc@hyenc@fontcolorpdfcommentcolor\HyColor@XZeroOneThreeFour\pc@goptd@icolor\pc@hyenc@icolorpdfcommentcolor\pdfmark[SST]pdfmark=/ANN,Subtype=/Widget,Raw=/TU (Swedish 1-m Solar Telescope\textCR(\pc@goptd@deadline)) /T (tooltip zref@213) /C [ ] /FT/Btn /F 768 /Ff 65536 /H/N /BS ¡¡ /W 0 ¿¿ , \HyColor@XZeroOneThreeFour\pc@goptd@color\pc@hyenc@colorpdfcommentcolor\HyColor@XZeroOneThreeFour\pc@goptd@fontcolor\pc@hyenc@fontcolorpdfcommentcolor\HyColor@XZeroOneThreeFour\pc@goptd@icolor\pc@hyenc@icolorpdfcommentcolor\pdfmark[SDO]pdfmark=/ANN,Subtype=/Widget,Raw=/TU (Solar Dynamics Observatory\textCR(\pc@goptd@deadline)) /T (tooltip zref@214) /C [ ] /FT/Btn /F 768 /Ff 65536 /H/N /BS ¡¡ /W 0 ¿¿ and \HyColor@XZeroOneThreeFour\pc@goptd@color\pc@hyenc@colorpdfcommentcolor\HyColor@XZeroOneThreeFour\pc@goptd@fontcolor\pc@hyenc@fontcolorpdfcommentcolor\HyColor@XZeroOneThreeFour\pc@goptd@icolor\pc@hyenc@icolorpdfcommentcolor\pdfmark[IRIS]pdfmark=/ANN,Subtype=/Widget,Raw=/TU (Interface Region Imaging Spectrograph\textCR(\pc@goptd@deadline)) /T (tooltip zref@215) /C [ ] /FT/Btn /F 768 /Ff 65536 /H/N /BS ¡¡ /W 0 ¿¿ slitjaw images, light curves distilled from these, and \HyColor@XZeroOneThreeFour\pc@goptd@color\pc@hyenc@colorpdfcommentcolor\HyColor@XZeroOneThreeFour\pc@goptd@fontcolor\pc@hyenc@fontcolorpdfcommentcolor\HyColor@XZeroOneThreeFour\pc@goptd@icolor\pc@hyenc@icolorpdfcommentcolor\pdfmark[IRIS]pdfmark=/ANN,Subtype=/Widget,Raw=/TU (Interface Region Imaging Spectrograph\textCR(\pc@goptd@deadline)) /T (tooltip zref@216) /C [ ] /FT/Btn /F 768 /Ff 65536 /H/N /BS ¡¡ /W 0 ¿¿ spectra at selected pixels and times corresponding to the cutouts. For each feature we add some interpretation, but we postpone overall discussion to Sect. 4.
3.1. Details for EB-1
When viewing EB-1 in the H sequences, using \HyColor@XZeroOneThreeFour\pc@goptd@color\pc@hyenc@colorpdfcommentcolor\HyColor@XZeroOneThreeFour\pc@goptd@fontcolor\pc@hyenc@fontcolorpdfcommentcolor\HyColor@XZeroOneThreeFour\pc@goptd@icolor\pc@hyenc@icolorpdfcommentcolor\pdfmark[CRISPEX]pdfmark=/ANN,Subtype=/Widget,Raw=/TU (CRisp SPectral EXplorer\textCR(\pc@goptd@deadline)) /T (tooltip zref@217) /C [ ] /FT/Btn /F 768 /Ff 65536 /H/N /BS ¡¡ /W 0 ¿¿ to inspect its spatial, temporal, and spectral behavior in flexible cursor-controlled movie mode (a recommended modus operandi), this \HyColor@XZeroOneThreeFour\pc@goptd@color\pc@hyenc@colorpdfcommentcolor\HyColor@XZeroOneThreeFour\pc@goptd@fontcolor\pc@hyenc@fontcolorpdfcommentcolor\HyColor@XZeroOneThreeFour\pc@goptd@icolor\pc@hyenc@icolorpdfcommentcolor\pdfmark[EB]pdfmark=/ANN,Subtype=/Widget,Raw=/TU (Ellerman bomb\textCR(\pc@goptd@deadline)) /T (tooltip zref@218) /C [ ] /FT/Btn /F 768 /Ff 65536 /H/N /BS ¡¡ /W 0 ¿¿ appears as a sequence of unmistakable tall \HyColor@XZeroOneThreeFour\pc@goptd@color\pc@hyenc@colorpdfcommentcolor\HyColor@XZeroOneThreeFour\pc@goptd@fontcolor\pc@hyenc@fontcolorpdfcommentcolor\HyColor@XZeroOneThreeFour\pc@goptd@icolor\pc@hyenc@icolorpdfcommentcolor\pdfmark[EB]pdfmark=/ANN,Subtype=/Widget,Raw=/TU (Ellerman bomb\textCR(\pc@goptd@deadline)) /T (tooltip zref@219) /C [ ] /FT/Btn /F 768 /Ff 65536 /H/N /BS ¡¡ /W 0 ¿¿ flames in the outer H wings, re-occurring in rapid succession during the whole observing period, with fast motion of its successive footpoints away from the spot along an \HyColor@XZeroOneThreeFour\pc@goptd@color\pc@hyenc@colorpdfcommentcolor\HyColor@XZeroOneThreeFour\pc@goptd@fontcolor\pc@hyenc@fontcolorpdfcommentcolor\HyColor@XZeroOneThreeFour\pc@goptd@icolor\pc@hyenc@icolorpdfcommentcolor\pdfmark[MC]pdfmark=/ANN,Subtype=/Widget,Raw=/TU (magnetic concentration\textCR(\pc@goptd@deadline)) /T (tooltip zref@220) /C [ ] /FT/Btn /F 768 /Ff 65536 /H/N /BS ¡¡ /W 0 ¿¿ -filled lane. Our \HyColor@XZeroOneThreeFour\pc@goptd@color\pc@hyenc@colorpdfcommentcolor\HyColor@XZeroOneThreeFour\pc@goptd@fontcolor\pc@hyenc@fontcolorpdfcommentcolor\HyColor@XZeroOneThreeFour\pc@goptd@icolor\pc@hyenc@icolorpdfcommentcolor\pdfmark[CRISPEX]pdfmark=/ANN,Subtype=/Widget,Raw=/TU (CRisp SPectral EXplorer\textCR(\pc@goptd@deadline)) /T (tooltip zref@221) /C [ ] /FT/Btn /F 768 /Ff 65536 /H/N /BS ¡¡ /W 0 ¿¿ inspection also showed that a dark redshifted chromospheric fibril was overlying the H core part of the time.
In the \HyColor@XZeroOneThreeFour\pc@goptd@color\pc@hyenc@colorpdfcommentcolor\HyColor@XZeroOneThreeFour\pc@goptd@fontcolor\pc@hyenc@fontcolorpdfcommentcolor\HyColor@XZeroOneThreeFour\pc@goptd@icolor\pc@hyenc@icolorpdfcommentcolor\pdfmark[AIA]pdfmark=/ANN,Subtype=/Widget,Raw=/TU (Atmospheric Imaging Assembly\textCR(\pc@goptd@deadline)) /T (tooltip zref@222) /C [ ] /FT/Btn /F 768 /Ff 65536 /H/N /BS ¡¡ /W 0 ¿¿ 1700 Å sequence EB-1 also stands out bright and \HyColor@XZeroOneThreeFour\pc@goptd@color\pc@hyenc@colorpdfcommentcolor\HyColor@XZeroOneThreeFour\pc@goptd@fontcolor\pc@hyenc@fontcolorpdfcommentcolor\HyColor@XZeroOneThreeFour\pc@goptd@icolor\pc@hyenc@icolorpdfcommentcolor\pdfmark[EB]pdfmark=/ANN,Subtype=/Widget,Raw=/TU (Ellerman bomb\textCR(\pc@goptd@deadline)) /T (tooltip zref@223) /C [ ] /FT/Btn /F 768 /Ff 65536 /H/N /BS ¡¡ /W 0 ¿¿ -like, i.e., pointlike, roughly stationary, without filamentary \HyColor@XZeroOneThreeFour\pc@goptd@color\pc@hyenc@colorpdfcommentcolor\HyColor@XZeroOneThreeFour\pc@goptd@fontcolor\pc@hyenc@fontcolorpdfcommentcolor\HyColor@XZeroOneThreeFour\pc@goptd@icolor\pc@hyenc@icolorpdfcommentcolor\pdfmark[FAF]pdfmark=/ANN,Subtype=/Widget,Raw=/TU (flaring arch filament\textCR(\pc@goptd@deadline)) /T (tooltip zref@224) /C [ ] /FT/Btn /F 768 /Ff 65536 /H/N /BS ¡¡ /W 0 ¿¿ signature. The \HyColor@XZeroOneThreeFour\pc@goptd@color\pc@hyenc@colorpdfcommentcolor\HyColor@XZeroOneThreeFour\pc@goptd@fontcolor\pc@hyenc@fontcolorpdfcommentcolor\HyColor@XZeroOneThreeFour\pc@goptd@icolor\pc@hyenc@icolorpdfcommentcolor\pdfmark[HMI]pdfmark=/ANN,Subtype=/Widget,Raw=/TU (Helioseismic and Magnetic Imager\textCR(\pc@goptd@deadline)) /T (tooltip zref@225) /C [ ] /FT/Btn /F 768 /Ff 65536 /H/N /BS ¡¡ /W 0 ¿¿ magnetogram sequence shows that it occurred in a complex region with much streaming motion, from the sunspot towards extended plage and pores of both polarities further North. Small patches of opposite polarity traveled fast in this flow but were barely visible with \HyColor@XZeroOneThreeFour\pc@goptd@color\pc@hyenc@colorpdfcommentcolor\HyColor@XZeroOneThreeFour\pc@goptd@fontcolor\pc@hyenc@fontcolorpdfcommentcolor\HyColor@XZeroOneThreeFour\pc@goptd@icolor\pc@hyenc@icolorpdfcommentcolor\pdfmark[HMI]pdfmark=/ANN,Subtype=/Widget,Raw=/TU (Helioseismic and Magnetic Imager\textCR(\pc@goptd@deadline)) /T (tooltip zref@226) /C [ ] /FT/Btn /F 768 /Ff 65536 /H/N /BS ¡¡ /W 0 ¿¿ . Likely such patches produced EB-1 successively wile canceling. In Paper II we observed \HyColor@XZeroOneThreeFour\pc@goptd@color\pc@hyenc@colorpdfcommentcolor\HyColor@XZeroOneThreeFour\pc@goptd@fontcolor\pc@hyenc@fontcolorpdfcommentcolor\HyColor@XZeroOneThreeFour\pc@goptd@icolor\pc@hyenc@icolorpdfcommentcolor\pdfmark[EB]pdfmark=/ANN,Subtype=/Widget,Raw=/TU (Ellerman bomb\textCR(\pc@goptd@deadline)) /T (tooltip zref@227) /C [ ] /FT/Btn /F 768 /Ff 65536 /H/N /BS ¡¡ /W 0 ¿¿ s at similar cancelations of small opposite-polarity patches in \HyColor@XZeroOneThreeFour\pc@goptd@color\pc@hyenc@colorpdfcommentcolor\HyColor@XZeroOneThreeFour\pc@goptd@fontcolor\pc@hyenc@fontcolorpdfcommentcolor\HyColor@XZeroOneThreeFour\pc@goptd@icolor\pc@hyenc@icolorpdfcommentcolor\pdfmark[SST]pdfmark=/ANN,Subtype=/Widget,Raw=/TU (Swedish 1-m Solar Telescope\textCR(\pc@goptd@deadline)) /T (tooltip zref@228) /C [ ] /FT/Btn /F 768 /Ff 65536 /H/N /BS ¡¡ /W 0 ¿¿ magnetograms with better detail than given by \HyColor@XZeroOneThreeFour\pc@goptd@color\pc@hyenc@colorpdfcommentcolor\HyColor@XZeroOneThreeFour\pc@goptd@fontcolor\pc@hyenc@fontcolorpdfcommentcolor\HyColor@XZeroOneThreeFour\pc@goptd@icolor\pc@hyenc@icolorpdfcommentcolor\pdfmark[HMI]pdfmark=/ANN,Subtype=/Widget,Raw=/TU (Helioseismic and Magnetic Imager\textCR(\pc@goptd@deadline)) /T (tooltip zref@229) /C [ ] /FT/Btn /F 768 /Ff 65536 /H/N /BS ¡¡ /W 0 ¿¿ .
Unfortunately, EB-1 was sampled by the \HyColor@XZeroOneThreeFour\pc@goptd@color\pc@hyenc@colorpdfcommentcolor\HyColor@XZeroOneThreeFour\pc@goptd@fontcolor\pc@hyenc@fontcolorpdfcommentcolor\HyColor@XZeroOneThreeFour\pc@goptd@icolor\pc@hyenc@icolorpdfcommentcolor\pdfmark[IRIS]pdfmark=/ANN,Subtype=/Widget,Raw=/TU (Interface Region Imaging Spectrograph\textCR(\pc@goptd@deadline)) /T (tooltip zref@230) /C [ ] /FT/Btn /F 768 /Ff 65536 /H/N /BS ¡¡ /W 0 ¿¿ slit only at the beginning of the \HyColor@XZeroOneThreeFour\pc@goptd@color\pc@hyenc@colorpdfcommentcolor\HyColor@XZeroOneThreeFour\pc@goptd@fontcolor\pc@hyenc@fontcolorpdfcommentcolor\HyColor@XZeroOneThreeFour\pc@goptd@icolor\pc@hyenc@icolorpdfcommentcolor\pdfmark[SST]pdfmark=/ANN,Subtype=/Widget,Raw=/TU (Swedish 1-m Solar Telescope\textCR(\pc@goptd@deadline)) /T (tooltip zref@231) /C [ ] /FT/Btn /F 768 /Ff 65536 /H/N /BS ¡¡ /W 0 ¿¿ sequence and only at two positions of the narrow scan pattern. In its successive flarings EB-1 migrated eastward out of the scan strip. However, during this 10-min overlap period the rapid-scan format gave good temporal sample resolution.
Figure 2 shows a selection of small-field cutouts of EB-1 in various diagnostics. The time differences along rows are negligible by using nearest-neighbor selection, whereas the rows are about 3 min apart in order to sample EB-1’s evolution. Colored plus signs specify the pixels for which \HyColor@XZeroOneThreeFour\pc@goptd@color\pc@hyenc@colorpdfcommentcolor\HyColor@XZeroOneThreeFour\pc@goptd@fontcolor\pc@hyenc@fontcolorpdfcommentcolor\HyColor@XZeroOneThreeFour\pc@goptd@icolor\pc@hyenc@icolorpdfcommentcolor\pdfmark[IRIS]pdfmark=/ANN,Subtype=/Widget,Raw=/TU (Interface Region Imaging Spectrograph\textCR(\pc@goptd@deadline)) /T (tooltip zref@232) /C [ ] /FT/Btn /F 768 /Ff 65536 /H/N /BS ¡¡ /W 0 ¿¿ spectra are shown in Fig. 4 with the same colors. The slitjaws in the last two columns of Fig. 2 show the \HyColor@XZeroOneThreeFour\pc@goptd@color\pc@hyenc@colorpdfcommentcolor\HyColor@XZeroOneThreeFour\pc@goptd@fontcolor\pc@hyenc@fontcolorpdfcommentcolor\HyColor@XZeroOneThreeFour\pc@goptd@icolor\pc@hyenc@icolorpdfcommentcolor\pdfmark[IRIS]pdfmark=/ANN,Subtype=/Widget,Raw=/TU (Interface Region Imaging Spectrograph\textCR(\pc@goptd@deadline)) /T (tooltip zref@233) /C [ ] /FT/Btn /F 768 /Ff 65536 /H/N /BS ¡¡ /W 0 ¿¿ slit as a dark near-vertical stripe at or close to the plus signs at corresponding times.
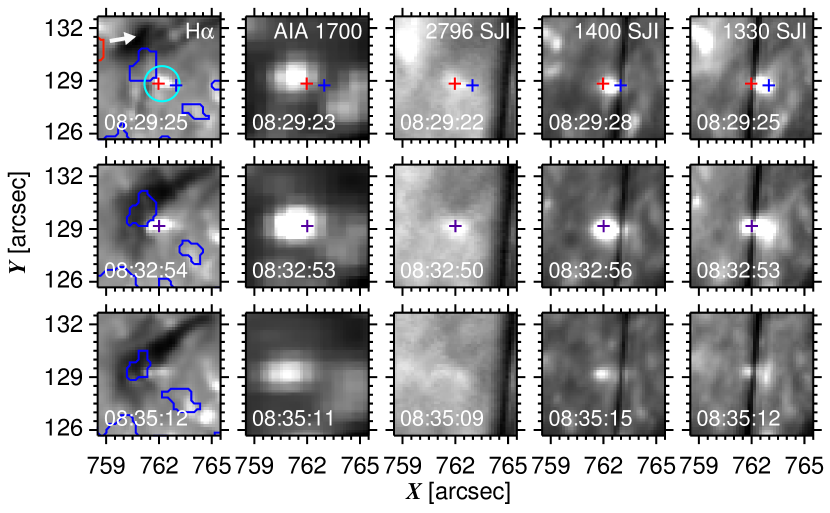
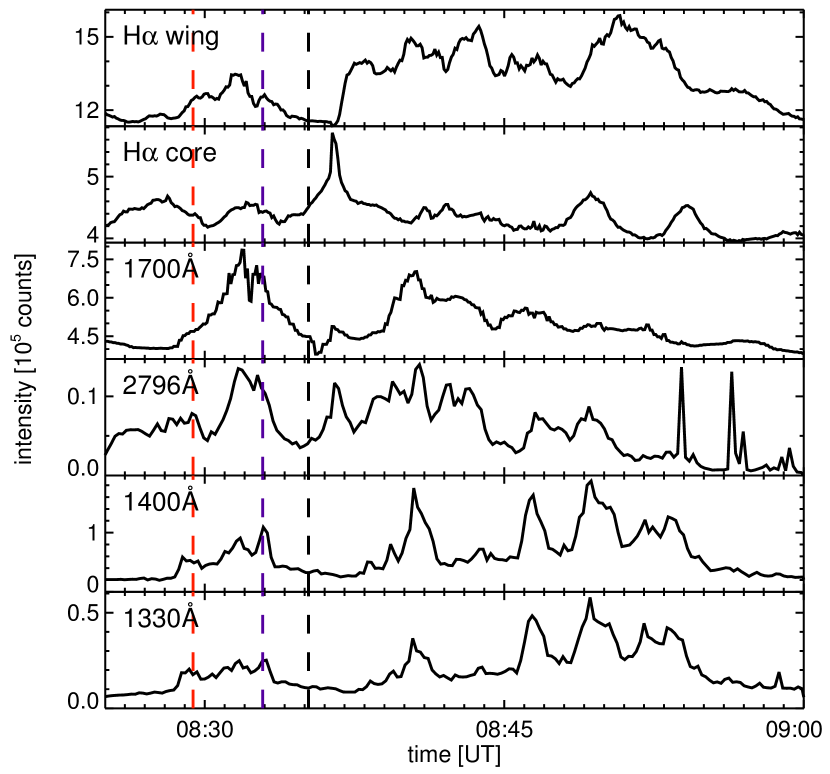
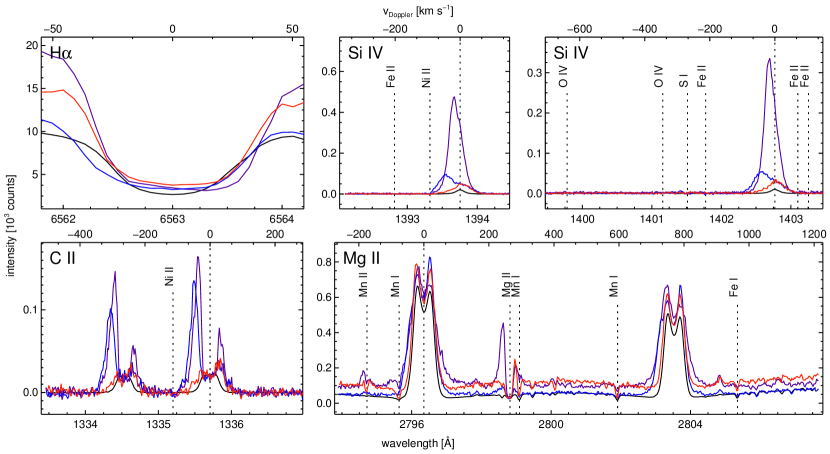
EB-1 appeared to be fairly upright, so that the red and blue pixels in the top row of Fig. 2 likely sampled its lower and upper parts (the spectra in Fig. 4 confirm this distinction). The violet pixel in the second row of Fig. 2 sampled the same location on the Sun as the red pixel in the first row, but during the 2.5 minutes between these samplings EB-1 moved to the left in its successive flaring, so that the violet pixel sampled its middle part. The morphology of the emission patches in Fig. 2 suggests that the 1700 Å feature came mostly from the lower part and that the ultraviolet images sampled increasingly more of the upper part for higher formation temperature (left to right). The H -wing brightness maps only the lower part in the top row, but in the second row EB-1 appears as an H -wing brightness patch that resembles the ultraviolet patches, whereas the 1700 Å feature remained dominated by the lower part.
The row-to-row evolution in Fig. 2 suggests that EB-1 grew from the first sample time to the second, while migrating leftward, and then diminished. This is confirmed by Fig. 3 which shows the time behavior of the integrated emission of EB-1 in the \HyColor@XZeroOneThreeFour\pc@goptd@color\pc@hyenc@colorpdfcommentcolor\HyColor@XZeroOneThreeFour\pc@goptd@fontcolor\pc@hyenc@fontcolorpdfcommentcolor\HyColor@XZeroOneThreeFour\pc@goptd@icolor\pc@hyenc@icolorpdfcommentcolor\pdfmark[SST]pdfmark=/ANN,Subtype=/Widget,Raw=/TU (Swedish 1-m Solar Telescope\textCR(\pc@goptd@deadline)) /T (tooltip zref@254) /C [ ] /FT/Btn /F 768 /Ff 65536 /H/N /BS ¡¡ /W 0 ¿¿ , \HyColor@XZeroOneThreeFour\pc@goptd@color\pc@hyenc@colorpdfcommentcolor\HyColor@XZeroOneThreeFour\pc@goptd@fontcolor\pc@hyenc@fontcolorpdfcommentcolor\HyColor@XZeroOneThreeFour\pc@goptd@icolor\pc@hyenc@icolorpdfcommentcolor\pdfmark[IRIS]pdfmark=/ANN,Subtype=/Widget,Raw=/TU (Interface Region Imaging Spectrograph\textCR(\pc@goptd@deadline)) /T (tooltip zref@255) /C [ ] /FT/Btn /F 768 /Ff 65536 /H/N /BS ¡¡ /W 0 ¿¿ , and \HyColor@XZeroOneThreeFour\pc@goptd@color\pc@hyenc@colorpdfcommentcolor\HyColor@XZeroOneThreeFour\pc@goptd@fontcolor\pc@hyenc@fontcolorpdfcommentcolor\HyColor@XZeroOneThreeFour\pc@goptd@icolor\pc@hyenc@icolorpdfcommentcolor\pdfmark[SDO]pdfmark=/ANN,Subtype=/Widget,Raw=/TU (Solar Dynamics Observatory\textCR(\pc@goptd@deadline)) /T (tooltip zref@256) /C [ ] /FT/Btn /F 768 /Ff 65536 /H/N /BS ¡¡ /W 0 ¿¿ /\HyColor@XZeroOneThreeFour\pc@goptd@color\pc@hyenc@colorpdfcommentcolor\HyColor@XZeroOneThreeFour\pc@goptd@fontcolor\pc@hyenc@fontcolorpdfcommentcolor\HyColor@XZeroOneThreeFour\pc@goptd@icolor\pc@hyenc@icolorpdfcommentcolor\pdfmark[AIA]pdfmark=/ANN,Subtype=/Widget,Raw=/TU (Atmospheric Imaging Assembly\textCR(\pc@goptd@deadline)) /T (tooltip zref@257) /C [ ] /FT/Btn /F 768 /Ff 65536 /H/N /BS ¡¡ /W 0 ¿¿ imaging. The integration area was defined appreciably wider than the H detection contour to admit the larger extent of the brightenings in the \HyColor@XZeroOneThreeFour\pc@goptd@color\pc@hyenc@colorpdfcommentcolor\HyColor@XZeroOneThreeFour\pc@goptd@fontcolor\pc@hyenc@fontcolorpdfcommentcolor\HyColor@XZeroOneThreeFour\pc@goptd@icolor\pc@hyenc@icolorpdfcommentcolor\pdfmark[IRIS]pdfmark=/ANN,Subtype=/Widget,Raw=/TU (Interface Region Imaging Spectrograph\textCR(\pc@goptd@deadline)) /T (tooltip zref@258) /C [ ] /FT/Btn /F 768 /Ff 65536 /H/N /BS ¡¡ /W 0 ¿¿ slitjaw and \HyColor@XZeroOneThreeFour\pc@goptd@color\pc@hyenc@colorpdfcommentcolor\HyColor@XZeroOneThreeFour\pc@goptd@fontcolor\pc@hyenc@fontcolorpdfcommentcolor\HyColor@XZeroOneThreeFour\pc@goptd@icolor\pc@hyenc@icolorpdfcommentcolor\pdfmark[AIA]pdfmark=/ANN,Subtype=/Widget,Raw=/TU (Atmospheric Imaging Assembly\textCR(\pc@goptd@deadline)) /T (tooltip zref@259) /C [ ] /FT/Btn /F 768 /Ff 65536 /H/N /BS ¡¡ /W 0 ¿¿ images (Fig. 2). The first part covers the three sample times of Fig. 2 (dashed vertical lines) and shows a rise, a high peak around 08:32 UT, and a subsequent decay in all diagnostics. Subsequently there were yet more brightenings, with interesting differences between the various curves, but unfortunately without spectroscopic sampling by \HyColor@XZeroOneThreeFour\pc@goptd@color\pc@hyenc@colorpdfcommentcolor\HyColor@XZeroOneThreeFour\pc@goptd@fontcolor\pc@hyenc@fontcolorpdfcommentcolor\HyColor@XZeroOneThreeFour\pc@goptd@icolor\pc@hyenc@icolorpdfcommentcolor\pdfmark[IRIS]pdfmark=/ANN,Subtype=/Widget,Raw=/TU (Interface Region Imaging Spectrograph\textCR(\pc@goptd@deadline)) /T (tooltip zref@260) /C [ ] /FT/Btn /F 768 /Ff 65536 /H/N /BS ¡¡ /W 0 ¿¿ because EB-1 had drifted off the slit scan strip. The H -core curve shows a high peak a minute after the third sampling. Inspection showed that it was from a bright fibril ending of the type commonly seen at H line center, with many similar ones in the neighborhood. Nothing like the microflare of FAF-1 discussed below.
Figure 4 shows \HyColor@XZeroOneThreeFour\pc@goptd@color\pc@hyenc@colorpdfcommentcolor\HyColor@XZeroOneThreeFour\pc@goptd@fontcolor\pc@hyenc@fontcolorpdfcommentcolor\HyColor@XZeroOneThreeFour\pc@goptd@icolor\pc@hyenc@icolorpdfcommentcolor\pdfmark[SST]pdfmark=/ANN,Subtype=/Widget,Raw=/TU (Swedish 1-m Solar Telescope\textCR(\pc@goptd@deadline)) /T (tooltip zref@261) /C [ ] /FT/Btn /F 768 /Ff 65536 /H/N /BS ¡¡ /W 0 ¿¿ H profiles and \HyColor@XZeroOneThreeFour\pc@goptd@color\pc@hyenc@colorpdfcommentcolor\HyColor@XZeroOneThreeFour\pc@goptd@fontcolor\pc@hyenc@fontcolorpdfcommentcolor\HyColor@XZeroOneThreeFour\pc@goptd@icolor\pc@hyenc@icolorpdfcommentcolor\pdfmark[IRIS]pdfmark=/ANN,Subtype=/Widget,Raw=/TU (Interface Region Imaging Spectrograph\textCR(\pc@goptd@deadline)) /T (tooltip zref@262) /C [ ] /FT/Btn /F 768 /Ff 65536 /H/N /BS ¡¡ /W 0 ¿¿ ultraviolet-line profiles of EB-1. The color coding corresponds to the pixel markers in Fig. 2. The black profiles are the spatial average over the area specified by blue frames in Fig. 1. These reference profiles serve to gauge the amount of unusual brightening in the \HyColor@XZeroOneThreeFour\pc@goptd@color\pc@hyenc@colorpdfcommentcolor\HyColor@XZeroOneThreeFour\pc@goptd@fontcolor\pc@hyenc@fontcolorpdfcommentcolor\HyColor@XZeroOneThreeFour\pc@goptd@icolor\pc@hyenc@icolorpdfcommentcolor\pdfmark[EB]pdfmark=/ANN,Subtype=/Widget,Raw=/TU (Ellerman bomb\textCR(\pc@goptd@deadline)) /T (tooltip zref@263) /C [ ] /FT/Btn /F 768 /Ff 65536 /H/N /BS ¡¡ /W 0 ¿¿ profiles.
In the first panel of Fig. 4 the red H profile from the lower part of EB-1 shows characteristic \HyColor@XZeroOneThreeFour\pc@goptd@color\pc@hyenc@colorpdfcommentcolor\HyColor@XZeroOneThreeFour\pc@goptd@fontcolor\pc@hyenc@fontcolorpdfcommentcolor\HyColor@XZeroOneThreeFour\pc@goptd@icolor\pc@hyenc@icolorpdfcommentcolor\pdfmark[EB]pdfmark=/ANN,Subtype=/Widget,Raw=/TU (Ellerman bomb\textCR(\pc@goptd@deadline)) /T (tooltip zref@264) /C [ ] /FT/Btn /F 768 /Ff 65536 /H/N /BS ¡¡ /W 0 ¿¿ signature: excess wings but nothing special in the core. The blue profile from the upper part shows no H brightening yet, as already noted in the first row of Fig. 2, but the subsequent violet profile shows considerable H wing brightening. This profile also indicates significant core redshift, but this we attribute to the overlying fibril seen in the line-center movie. EB-1 contributed only the wing parts outside the steep core flanks.
If overlying fibrils are opaque in the H core, they must be much more opaque in Mg ii and k for the following reasons. In Paper II we found already that the core of Ca ii 8542 Å is affected by overlying fibrils similarly to H , be it with larger sensitivity to non-thermal Dopplershifts. Fibrils that appear opaque in both H and Ca ii 8542 Å must necessarily be yet more opaque at the centers of the Ca ii H and K lines, since these are from the Ca ii ground state while the 8542 Å line is from an excited level. Such fibrils must then be 18 times (Mg/Ca abundance ratio) more opaque yet at the centers of the Mg ii and k lines.
The Mg ii and k cores in the bottom right panel of Fig. 4 indeed show only a small response and the 2796 Å slitjaw images in Fig. 2 show less \HyColor@XZeroOneThreeFour\pc@goptd@color\pc@hyenc@colorpdfcommentcolor\HyColor@XZeroOneThreeFour\pc@goptd@fontcolor\pc@hyenc@fontcolorpdfcommentcolor\HyColor@XZeroOneThreeFour\pc@goptd@icolor\pc@hyenc@icolorpdfcommentcolor\pdfmark[EB]pdfmark=/ANN,Subtype=/Widget,Raw=/TU (Ellerman bomb\textCR(\pc@goptd@deadline)) /T (tooltip zref@265) /C [ ] /FT/Btn /F 768 /Ff 65536 /H/N /BS ¡¡ /W 0 ¿¿ brightening than the other diagnostics. However, overlying fibrils must also become transparent further out in the h and k wings, just as in the H wings. The violet h and k profiles in Fig. 4 indeed show outer-wing brightening. The 2796 Å light curve in Fig. 3 shows a peak around 08:32 UT from these broader Mg ii k wings.
In contrast to the fibril-dominated H and Mg ii and k cores, there is large response to EB-1 in the Si iv and C ii profiles in Fig. 4 and also in the Mg ii triplet lines between h and k. They all show a clear progression of excess emission for the red, blue, and violet samplings, again suggesting that the upper part of EB-1 was hotter than the lower part and became hotter with time. From red to blue the C ii lines also became much wider. Only their central self-absorption dips remained unaffected. These are probably also fibrilar.
In addition to this brightening, the profiles of all these lines show marked asymmetries with very good correspondence between them. The redshifts of the red profiles from the lower part suggest downflow, the blueshifts of the blue and violet profiles from the upper part suggest upflow. These patterns provide direct evidence for the presence of a bi-directional flow, as discussed earlier for \HyColor@XZeroOneThreeFour\pc@goptd@color\pc@hyenc@colorpdfcommentcolor\HyColor@XZeroOneThreeFour\pc@goptd@fontcolor\pc@hyenc@fontcolorpdfcommentcolor\HyColor@XZeroOneThreeFour\pc@goptd@icolor\pc@hyenc@icolorpdfcommentcolor\pdfmark[EB]pdfmark=/ANN,Subtype=/Widget,Raw=/TU (Ellerman bomb\textCR(\pc@goptd@deadline)) /T (tooltip zref@266) /C [ ] /FT/Btn /F 768 /Ff 65536 /H/N /BS ¡¡ /W 0 ¿¿ s by Shibata et al. (2007), Matsumoto et al. (2008), Archontis & Hood (2009) and in Paper I.
The blue Si iv peaks show blueshifts of roughly 30 km s-1. More precise fits with double Gaussians to reproduce their asymmetry gave blueshift magnitudes of about 45 km s-1 for the main (i.e., highest intensity) components. The violet Si iv peaks for the later sampling show smaller blueshifts (about 15 km s-1) but this was the middle part of the \HyColor@XZeroOneThreeFour\pc@goptd@color\pc@hyenc@colorpdfcommentcolor\HyColor@XZeroOneThreeFour\pc@goptd@fontcolor\pc@hyenc@fontcolorpdfcommentcolor\HyColor@XZeroOneThreeFour\pc@goptd@icolor\pc@hyenc@icolorpdfcommentcolor\pdfmark[EB]pdfmark=/ANN,Subtype=/Widget,Raw=/TU (Ellerman bomb\textCR(\pc@goptd@deadline)) /T (tooltip zref@267) /C [ ] /FT/Btn /F 768 /Ff 65536 /H/N /BS ¡¡ /W 0 ¿¿ , not its top, due to its Eastward progression (Fig. 2).
Thus, there is no point in inspecting (or modeling) the cores of H and Mg ii and k to study \HyColor@XZeroOneThreeFour\pc@goptd@color\pc@hyenc@colorpdfcommentcolor\HyColor@XZeroOneThreeFour\pc@goptd@fontcolor\pc@hyenc@fontcolorpdfcommentcolor\HyColor@XZeroOneThreeFour\pc@goptd@icolor\pc@hyenc@icolorpdfcommentcolor\pdfmark[EB]pdfmark=/ANN,Subtype=/Widget,Raw=/TU (Ellerman bomb\textCR(\pc@goptd@deadline)) /T (tooltip zref@268) /C [ ] /FT/Btn /F 768 /Ff 65536 /H/N /BS ¡¡ /W 0 ¿¿ behavior, but the striking agreement in Doppler asymmetries for the Mg ii triplet, Si iv, and C ii lines suggests that these sample the underlying \HyColor@XZeroOneThreeFour\pc@goptd@color\pc@hyenc@colorpdfcommentcolor\HyColor@XZeroOneThreeFour\pc@goptd@fontcolor\pc@hyenc@fontcolorpdfcommentcolor\HyColor@XZeroOneThreeFour\pc@goptd@icolor\pc@hyenc@icolorpdfcommentcolor\pdfmark[EB]pdfmark=/ANN,Subtype=/Widget,Raw=/TU (Ellerman bomb\textCR(\pc@goptd@deadline)) /T (tooltip zref@269) /C [ ] /FT/Btn /F 768 /Ff 65536 /H/N /BS ¡¡ /W 0 ¿¿ without fibrilar obscuration. These \HyColor@XZeroOneThreeFour\pc@goptd@color\pc@hyenc@colorpdfcommentcolor\HyColor@XZeroOneThreeFour\pc@goptd@fontcolor\pc@hyenc@fontcolorpdfcommentcolor\HyColor@XZeroOneThreeFour\pc@goptd@icolor\pc@hyenc@icolorpdfcommentcolor\pdfmark[IRIS]pdfmark=/ANN,Subtype=/Widget,Raw=/TU (Interface Region Imaging Spectrograph\textCR(\pc@goptd@deadline)) /T (tooltip zref@270) /C [ ] /FT/Btn /F 768 /Ff 65536 /H/N /BS ¡¡ /W 0 ¿¿ lines thus provide diagnostics in which \HyColor@XZeroOneThreeFour\pc@goptd@color\pc@hyenc@colorpdfcommentcolor\HyColor@XZeroOneThreeFour\pc@goptd@fontcolor\pc@hyenc@fontcolorpdfcommentcolor\HyColor@XZeroOneThreeFour\pc@goptd@icolor\pc@hyenc@icolorpdfcommentcolor\pdfmark[EB]pdfmark=/ANN,Subtype=/Widget,Raw=/TU (Ellerman bomb\textCR(\pc@goptd@deadline)) /T (tooltip zref@271) /C [ ] /FT/Btn /F 768 /Ff 65536 /H/N /BS ¡¡ /W 0 ¿¿ s are “unveiled”.
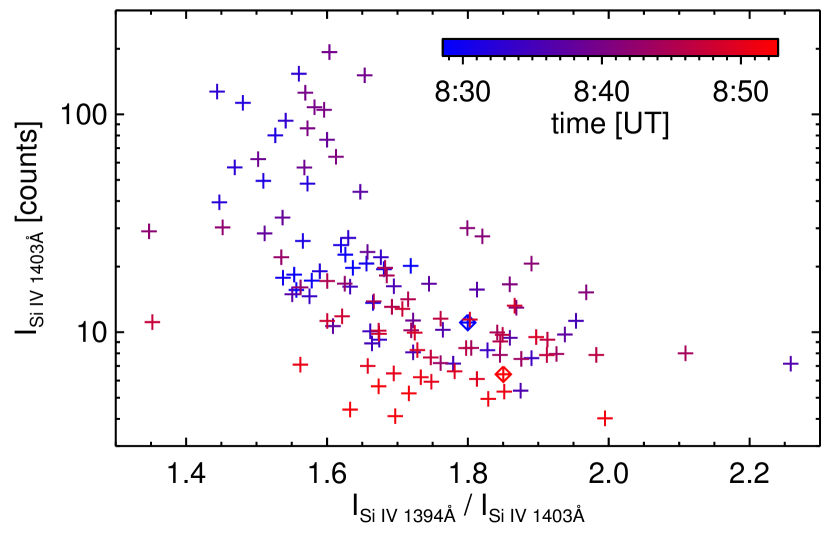
In addition, these \HyColor@XZeroOneThreeFour\pc@goptd@color\pc@hyenc@colorpdfcommentcolor\HyColor@XZeroOneThreeFour\pc@goptd@fontcolor\pc@hyenc@fontcolorpdfcommentcolor\HyColor@XZeroOneThreeFour\pc@goptd@icolor\pc@hyenc@icolorpdfcommentcolor\pdfmark[EB]pdfmark=/ANN,Subtype=/Widget,Raw=/TU (Ellerman bomb\textCR(\pc@goptd@deadline)) /T (tooltip zref@272) /C [ ] /FT/Btn /F 768 /Ff 65536 /H/N /BS ¡¡ /W 0 ¿¿ -unveiling diagnostics differ clearly in how they sample EB-1. The Si iv lines indicate a roughly optically thin feature for the red and blue profiles even at their centers, because each pair reaches similar height in the second and third panels of Fig. 4 and shows no flattening or dip in the line cores. Since the plot scales of the Si iv panels differ by the transition probability ratio, such apparent height equality suggests optically thin formation. For the violet profiles this is not the case, suggesting that the increased emissivity went together with larger EB-1 opacity.
This thickness measure is quantified in Fig. 5 which plots the intensity of one Si iv peak against the peak ratio. They were measured by averaging the profiles over all spatial-temporal samplings of pixels within the bright EB-1 patch in the 1400 Å slitjaw images that correspond to each successive \HyColor@XZeroOneThreeFour\pc@goptd@color\pc@hyenc@colorpdfcommentcolor\HyColor@XZeroOneThreeFour\pc@goptd@fontcolor\pc@hyenc@fontcolorpdfcommentcolor\HyColor@XZeroOneThreeFour\pc@goptd@icolor\pc@hyenc@icolorpdfcommentcolor\pdfmark[IRIS]pdfmark=/ANN,Subtype=/Widget,Raw=/TU (Interface Region Imaging Spectrograph\textCR(\pc@goptd@deadline)) /T (tooltip zref@273) /C [ ] /FT/Btn /F 768 /Ff 65536 /H/N /BS ¡¡ /W 0 ¿¿ scan, and smoothing the top of each averaged profile to measure its maximum intensity.
For an optically thin cloud without background irradiation the emergent doublet intensities equal the local emissivities times the geometrical thickness and obey the transition probability ratio of 2. For thicker features the ratio reduces, reaching unity for an opaque cloud with constant source function and then yielding flat-topped profiles (Fig. 2.2 of Rutten 2003). Figure 5 suggests that EB-1 was mostly neither thin nor thick, but “thinnish” with ratio values between 1.9 and 1.5 that typically correspond to thicknesses 0.3 and 1.6, respectively. The sample-time coding (color) suggests that EB-1 started and ended optically thin, but was generally somewhat thicker at high peak intensities in between.
When such features become much thicker than the photon mean free path, internal resonance scattering tends to cause outward source function decline and a corresponding central profile dip that is commonly called self-absorption. Such dips are seen in the C ii lines and also in the Mg ii triplet lines. However, their peak heights and asymmetries correspond very well to the Si iv profiles. Their peaks rise in concert and the higher peak of each profile is on the side to which the Si iv peaks are shifted. This good correspondence suggests that also these peaks sampled EB-1 without obscuration from overlying fibrils. The latter caused only the central dips because these show no Dopplershifts. Since the outer wings still show about similar intensities as function of wavelength separation from the line centers, the peaks and wings seem to sample the \HyColor@XZeroOneThreeFour\pc@goptd@color\pc@hyenc@colorpdfcommentcolor\HyColor@XZeroOneThreeFour\pc@goptd@fontcolor\pc@hyenc@fontcolorpdfcommentcolor\HyColor@XZeroOneThreeFour\pc@goptd@icolor\pc@hyenc@icolorpdfcommentcolor\pdfmark[EB]pdfmark=/ANN,Subtype=/Widget,Raw=/TU (Ellerman bomb\textCR(\pc@goptd@deadline)) /T (tooltip zref@274) /C [ ] /FT/Btn /F 768 /Ff 65536 /H/N /BS ¡¡ /W 0 ¿¿ in optically thick fashion (otherwise they would also differ a factor of two, the transition probability ratio). For an optically thick feature the profiles represent Eddington-Barbier mapping of the source function at monochromatic optical depth . In this case the different Dopplershifts of the upper and lower parts of EB-1 affect the optical depth scaling and produce the peak asymmetries. Thus, these unveiled \HyColor@XZeroOneThreeFour\pc@goptd@color\pc@hyenc@colorpdfcommentcolor\HyColor@XZeroOneThreeFour\pc@goptd@fontcolor\pc@hyenc@fontcolorpdfcommentcolor\HyColor@XZeroOneThreeFour\pc@goptd@icolor\pc@hyenc@icolorpdfcommentcolor\pdfmark[IRIS]pdfmark=/ANN,Subtype=/Widget,Raw=/TU (Interface Region Imaging Spectrograph\textCR(\pc@goptd@deadline)) /T (tooltip zref@275) /C [ ] /FT/Btn /F 768 /Ff 65536 /H/N /BS ¡¡ /W 0 ¿¿ diagnostics provide both thin and thick \HyColor@XZeroOneThreeFour\pc@goptd@color\pc@hyenc@colorpdfcommentcolor\HyColor@XZeroOneThreeFour\pc@goptd@fontcolor\pc@hyenc@fontcolorpdfcommentcolor\HyColor@XZeroOneThreeFour\pc@goptd@icolor\pc@hyenc@icolorpdfcommentcolor\pdfmark[EB]pdfmark=/ANN,Subtype=/Widget,Raw=/TU (Ellerman bomb\textCR(\pc@goptd@deadline)) /T (tooltip zref@276) /C [ ] /FT/Btn /F 768 /Ff 65536 /H/N /BS ¡¡ /W 0 ¿¿ sampling.
The final features of interest in Fig. 4 are the line blends. The Si iv and C ii lines are too narrow to reach the nearby Fe ii and Ni ii lines (rest wavelengths indicated by dashed vertical lines), but the blue wing of Mg ii k and the raised overlapping wings between h and k contain strong Mn i absorption blends at 2795.64, 2799.09, and 2801.91 Å in the red lower-part sampling (best seen per zoom-in with a pdf viewer). They are weak or absent in the other samplings. We attribute them to foreground upper-photosphere gas crossed by the slanted line of sight towards EB-1 that is not part of the phenomenon and indeed imparts no obvious Dopplershift. A line of sight to the lower part then passes through the Mn i formation layer, a line of sight towards the upper part catches less or none.
The Mn ii blend at 2794.72 Å shows up with interesting profiles: as a self-reversed line in the red lower-part sampling, absent in the blue upper-part sampling, but appearing with a blue-peaked profile similar to the Mg ii triplet lines at 2798.82 Å in the later violet upper-part sampling. This similarity indicates sampling of the \HyColor@XZeroOneThreeFour\pc@goptd@color\pc@hyenc@colorpdfcommentcolor\HyColor@XZeroOneThreeFour\pc@goptd@fontcolor\pc@hyenc@fontcolorpdfcommentcolor\HyColor@XZeroOneThreeFour\pc@goptd@icolor\pc@hyenc@icolorpdfcommentcolor\pdfmark[EB]pdfmark=/ANN,Subtype=/Widget,Raw=/TU (Ellerman bomb\textCR(\pc@goptd@deadline)) /T (tooltip zref@277) /C [ ] /FT/Btn /F 768 /Ff 65536 /H/N /BS ¡¡ /W 0 ¿¿ itself.
In summary, the \HyColor@XZeroOneThreeFour\pc@goptd@color\pc@hyenc@colorpdfcommentcolor\HyColor@XZeroOneThreeFour\pc@goptd@fontcolor\pc@hyenc@fontcolorpdfcommentcolor\HyColor@XZeroOneThreeFour\pc@goptd@icolor\pc@hyenc@icolorpdfcommentcolor\pdfmark[IRIS]pdfmark=/ANN,Subtype=/Widget,Raw=/TU (Interface Region Imaging Spectrograph\textCR(\pc@goptd@deadline)) /T (tooltip zref@278) /C [ ] /FT/Btn /F 768 /Ff 65536 /H/N /BS ¡¡ /W 0 ¿¿ diagnostics provide an informative, understandable, and self-consistent view of EB-1 that fits very well with our earlier \HyColor@XZeroOneThreeFour\pc@goptd@color\pc@hyenc@colorpdfcommentcolor\HyColor@XZeroOneThreeFour\pc@goptd@fontcolor\pc@hyenc@fontcolorpdfcommentcolor\HyColor@XZeroOneThreeFour\pc@goptd@icolor\pc@hyenc@icolorpdfcommentcolor\pdfmark[EB]pdfmark=/ANN,Subtype=/Widget,Raw=/TU (Ellerman bomb\textCR(\pc@goptd@deadline)) /T (tooltip zref@279) /C [ ] /FT/Btn /F 768 /Ff 65536 /H/N /BS ¡¡ /W 0 ¿¿ descriptions. EB-1 appeared as a photospheric below-the-fibrilar-canopy heating event with upward progression with time, larger heating higher up, and unmistakable bi-directional jet signature.
Are these \HyColor@XZeroOneThreeFour\pc@goptd@color\pc@hyenc@colorpdfcommentcolor\HyColor@XZeroOneThreeFour\pc@goptd@fontcolor\pc@hyenc@fontcolorpdfcommentcolor\HyColor@XZeroOneThreeFour\pc@goptd@icolor\pc@hyenc@icolorpdfcommentcolor\pdfmark[EB]pdfmark=/ANN,Subtype=/Widget,Raw=/TU (Ellerman bomb\textCR(\pc@goptd@deadline)) /T (tooltip zref@280) /C [ ] /FT/Btn /F 768 /Ff 65536 /H/N /BS ¡¡ /W 0 ¿¿ spectra similar to the \HyColor@XZeroOneThreeFour\pc@goptd@color\pc@hyenc@colorpdfcommentcolor\HyColor@XZeroOneThreeFour\pc@goptd@fontcolor\pc@hyenc@fontcolorpdfcommentcolor\HyColor@XZeroOneThreeFour\pc@goptd@icolor\pc@hyenc@icolorpdfcommentcolor\pdfmark[IB]pdfmark=/ANN,Subtype=/Widget,Raw=/TU (IRIS bomb\textCR(\pc@goptd@deadline)) /T (tooltip zref@281) /C [ ] /FT/Btn /F 768 /Ff 65536 /H/N /BS ¡¡ /W 0 ¿¿ spectra of Peter et al. (2014)? While the C ii and Si iv lines do show brightening, also with bi-directional Dopplershift signatures, their wings are not extravagantly wide. This may be a matter of timing. It is a pity that \HyColor@XZeroOneThreeFour\pc@goptd@color\pc@hyenc@colorpdfcommentcolor\HyColor@XZeroOneThreeFour\pc@goptd@fontcolor\pc@hyenc@fontcolorpdfcommentcolor\HyColor@XZeroOneThreeFour\pc@goptd@icolor\pc@hyenc@icolorpdfcommentcolor\pdfmark[IRIS]pdfmark=/ANN,Subtype=/Widget,Raw=/TU (Interface Region Imaging Spectrograph\textCR(\pc@goptd@deadline)) /T (tooltip zref@282) /C [ ] /FT/Btn /F 768 /Ff 65536 /H/N /BS ¡¡ /W 0 ¿¿ did not sample its aftermath, as is demonstrated by the next example.
3.2. Details for EB-2
EB-2 was sampled in \HyColor@XZeroOneThreeFour\pc@goptd@color\pc@hyenc@colorpdfcommentcolor\HyColor@XZeroOneThreeFour\pc@goptd@fontcolor\pc@hyenc@fontcolorpdfcommentcolor\HyColor@XZeroOneThreeFour\pc@goptd@icolor\pc@hyenc@icolorpdfcommentcolor\pdfmark[IRIS]pdfmark=/ANN,Subtype=/Widget,Raw=/TU (Interface Region Imaging Spectrograph\textCR(\pc@goptd@deadline)) /T (tooltip zref@283) /C [ ] /FT/Btn /F 768 /Ff 65536 /H/N /BS ¡¡ /W 0 ¿¿ spectroscopy during a longer period, but only intermittently due to the slow raster repeat at 8.6-minute cadence. Figures 6–8 display results for EB-2 in the same format as Figs. 2–4. This \HyColor@XZeroOneThreeFour\pc@goptd@color\pc@hyenc@colorpdfcommentcolor\HyColor@XZeroOneThreeFour\pc@goptd@fontcolor\pc@hyenc@fontcolorpdfcommentcolor\HyColor@XZeroOneThreeFour\pc@goptd@icolor\pc@hyenc@icolorpdfcommentcolor\pdfmark[EB]pdfmark=/ANN,Subtype=/Widget,Raw=/TU (Ellerman bomb\textCR(\pc@goptd@deadline)) /T (tooltip zref@284) /C [ ] /FT/Btn /F 768 /Ff 65536 /H/N /BS ¡¡ /W 0 ¿¿ had the advantage that it appeared aligned along the \HyColor@XZeroOneThreeFour\pc@goptd@color\pc@hyenc@colorpdfcommentcolor\HyColor@XZeroOneThreeFour\pc@goptd@fontcolor\pc@hyenc@fontcolorpdfcommentcolor\HyColor@XZeroOneThreeFour\pc@goptd@icolor\pc@hyenc@icolorpdfcommentcolor\pdfmark[IRIS]pdfmark=/ANN,Subtype=/Widget,Raw=/TU (Interface Region Imaging Spectrograph\textCR(\pc@goptd@deadline)) /T (tooltip zref@285) /C [ ] /FT/Btn /F 768 /Ff 65536 /H/N /BS ¡¡ /W 0 ¿¿ slit, so that its top and bottom were spectroscopically sampled at the same time in each row of Fig. 6. The alignment was fortuitous since EB-2 was tilted considerably away from the local vertical in its azimuthal orientation (angle with the arrow in the first panel of Fig. 6).
Inspection of the \HyColor@XZeroOneThreeFour\pc@goptd@color\pc@hyenc@colorpdfcommentcolor\HyColor@XZeroOneThreeFour\pc@goptd@fontcolor\pc@hyenc@fontcolorpdfcommentcolor\HyColor@XZeroOneThreeFour\pc@goptd@icolor\pc@hyenc@icolorpdfcommentcolor\pdfmark[SST]pdfmark=/ANN,Subtype=/Widget,Raw=/TU (Swedish 1-m Solar Telescope\textCR(\pc@goptd@deadline)) /T (tooltip zref@286) /C [ ] /FT/Btn /F 768 /Ff 65536 /H/N /BS ¡¡ /W 0 ¿¿ H sequences showed an unmistakable large, repetitive \HyColor@XZeroOneThreeFour\pc@goptd@color\pc@hyenc@colorpdfcommentcolor\HyColor@XZeroOneThreeFour\pc@goptd@fontcolor\pc@hyenc@fontcolorpdfcommentcolor\HyColor@XZeroOneThreeFour\pc@goptd@icolor\pc@hyenc@icolorpdfcommentcolor\pdfmark[EB]pdfmark=/ANN,Subtype=/Widget,Raw=/TU (Ellerman bomb\textCR(\pc@goptd@deadline)) /T (tooltip zref@287) /C [ ] /FT/Btn /F 768 /Ff 65536 /H/N /BS ¡¡ /W 0 ¿¿ flame. EB-2 was already present at the start of the \HyColor@XZeroOneThreeFour\pc@goptd@color\pc@hyenc@colorpdfcommentcolor\HyColor@XZeroOneThreeFour\pc@goptd@fontcolor\pc@hyenc@fontcolorpdfcommentcolor\HyColor@XZeroOneThreeFour\pc@goptd@icolor\pc@hyenc@icolorpdfcommentcolor\pdfmark[SST]pdfmark=/ANN,Subtype=/Widget,Raw=/TU (Swedish 1-m Solar Telescope\textCR(\pc@goptd@deadline)) /T (tooltip zref@288) /C [ ] /FT/Btn /F 768 /Ff 65536 /H/N /BS ¡¡ /W 0 ¿¿ observations at 07:47 UT, quickly brightened, and remained nearly continuously present in the \HyColor@XZeroOneThreeFour\pc@goptd@color\pc@hyenc@colorpdfcommentcolor\HyColor@XZeroOneThreeFour\pc@goptd@fontcolor\pc@hyenc@fontcolorpdfcommentcolor\HyColor@XZeroOneThreeFour\pc@goptd@icolor\pc@hyenc@icolorpdfcommentcolor\pdfmark[AIA]pdfmark=/ANN,Subtype=/Widget,Raw=/TU (Atmospheric Imaging Assembly\textCR(\pc@goptd@deadline)) /T (tooltip zref@289) /C [ ] /FT/Btn /F 768 /Ff 65536 /H/N /BS ¡¡ /W 0 ¿¿ image and \HyColor@XZeroOneThreeFour\pc@goptd@color\pc@hyenc@colorpdfcommentcolor\HyColor@XZeroOneThreeFour\pc@goptd@fontcolor\pc@hyenc@fontcolorpdfcommentcolor\HyColor@XZeroOneThreeFour\pc@goptd@icolor\pc@hyenc@icolorpdfcommentcolor\pdfmark[IRIS]pdfmark=/ANN,Subtype=/Widget,Raw=/TU (Interface Region Imaging Spectrograph\textCR(\pc@goptd@deadline)) /T (tooltip zref@290) /C [ ] /FT/Btn /F 768 /Ff 65536 /H/N /BS ¡¡ /W 0 ¿¿ slitjaw sequences until 08:29 UT. These image sequences and the corresponding light curves in Fig. 7 suggest that there was also preceding \HyColor@XZeroOneThreeFour\pc@goptd@color\pc@hyenc@colorpdfcommentcolor\HyColor@XZeroOneThreeFour\pc@goptd@fontcolor\pc@hyenc@fontcolorpdfcommentcolor\HyColor@XZeroOneThreeFour\pc@goptd@icolor\pc@hyenc@icolorpdfcommentcolor\pdfmark[EB]pdfmark=/ANN,Subtype=/Widget,Raw=/TU (Ellerman bomb\textCR(\pc@goptd@deadline)) /T (tooltip zref@291) /C [ ] /FT/Btn /F 768 /Ff 65536 /H/N /BS ¡¡ /W 0 ¿¿ activity during fifteen minutes before the \HyColor@XZeroOneThreeFour\pc@goptd@color\pc@hyenc@colorpdfcommentcolor\HyColor@XZeroOneThreeFour\pc@goptd@fontcolor\pc@hyenc@fontcolorpdfcommentcolor\HyColor@XZeroOneThreeFour\pc@goptd@icolor\pc@hyenc@icolorpdfcommentcolor\pdfmark[SST]pdfmark=/ANN,Subtype=/Widget,Raw=/TU (Swedish 1-m Solar Telescope\textCR(\pc@goptd@deadline)) /T (tooltip zref@292) /C [ ] /FT/Btn /F 768 /Ff 65536 /H/N /BS ¡¡ /W 0 ¿¿ start. A longer-duration \HyColor@XZeroOneThreeFour\pc@goptd@color\pc@hyenc@colorpdfcommentcolor\HyColor@XZeroOneThreeFour\pc@goptd@fontcolor\pc@hyenc@fontcolorpdfcommentcolor\HyColor@XZeroOneThreeFour\pc@goptd@icolor\pc@hyenc@icolorpdfcommentcolor\pdfmark[AIA]pdfmark=/ANN,Subtype=/Widget,Raw=/TU (Atmospheric Imaging Assembly\textCR(\pc@goptd@deadline)) /T (tooltip zref@293) /C [ ] /FT/Btn /F 768 /Ff 65536 /H/N /BS ¡¡ /W 0 ¿¿ 1700 Å sequence suggests strong repetitive \HyColor@XZeroOneThreeFour\pc@goptd@color\pc@hyenc@colorpdfcommentcolor\HyColor@XZeroOneThreeFour\pc@goptd@fontcolor\pc@hyenc@fontcolorpdfcommentcolor\HyColor@XZeroOneThreeFour\pc@goptd@icolor\pc@hyenc@icolorpdfcommentcolor\pdfmark[EB]pdfmark=/ANN,Subtype=/Widget,Raw=/TU (Ellerman bomb\textCR(\pc@goptd@deadline)) /T (tooltip zref@294) /C [ ] /FT/Btn /F 768 /Ff 65536 /H/N /BS ¡¡ /W 0 ¿¿ activity at the same location already from 06:36 UT onward. The \HyColor@XZeroOneThreeFour\pc@goptd@color\pc@hyenc@colorpdfcommentcolor\HyColor@XZeroOneThreeFour\pc@goptd@fontcolor\pc@hyenc@fontcolorpdfcommentcolor\HyColor@XZeroOneThreeFour\pc@goptd@icolor\pc@hyenc@icolorpdfcommentcolor\pdfmark[HMI]pdfmark=/ANN,Subtype=/Widget,Raw=/TU (Helioseismic and Magnetic Imager\textCR(\pc@goptd@deadline)) /T (tooltip zref@295) /C [ ] /FT/Btn /F 768 /Ff 65536 /H/N /BS ¡¡ /W 0 ¿¿ magnetogram sequence shows very fast streaming with an extended patch of white polarity running into a fairly large patch of black polarity that vanished gradually and was gone by 08:30 UT. The \HyColor@XZeroOneThreeFour\pc@goptd@color\pc@hyenc@colorpdfcommentcolor\HyColor@XZeroOneThreeFour\pc@goptd@fontcolor\pc@hyenc@fontcolorpdfcommentcolor\HyColor@XZeroOneThreeFour\pc@goptd@icolor\pc@hyenc@icolorpdfcommentcolor\pdfmark[SST]pdfmark=/ANN,Subtype=/Widget,Raw=/TU (Swedish 1-m Solar Telescope\textCR(\pc@goptd@deadline)) /T (tooltip zref@296) /C [ ] /FT/Btn /F 768 /Ff 65536 /H/N /BS ¡¡ /W 0 ¿¿ magnetograms have higher spatial resolution but only at the best-seeing moments; the homogeneity of the \HyColor@XZeroOneThreeFour\pc@goptd@color\pc@hyenc@colorpdfcommentcolor\HyColor@XZeroOneThreeFour\pc@goptd@fontcolor\pc@hyenc@fontcolorpdfcommentcolor\HyColor@XZeroOneThreeFour\pc@goptd@icolor\pc@hyenc@icolorpdfcommentcolor\pdfmark[HMI]pdfmark=/ANN,Subtype=/Widget,Raw=/TU (Helioseismic and Magnetic Imager\textCR(\pc@goptd@deadline)) /T (tooltip zref@297) /C [ ] /FT/Btn /F 768 /Ff 65536 /H/N /BS ¡¡ /W 0 ¿¿ sequence makes it more suited to follow such pattern changes.
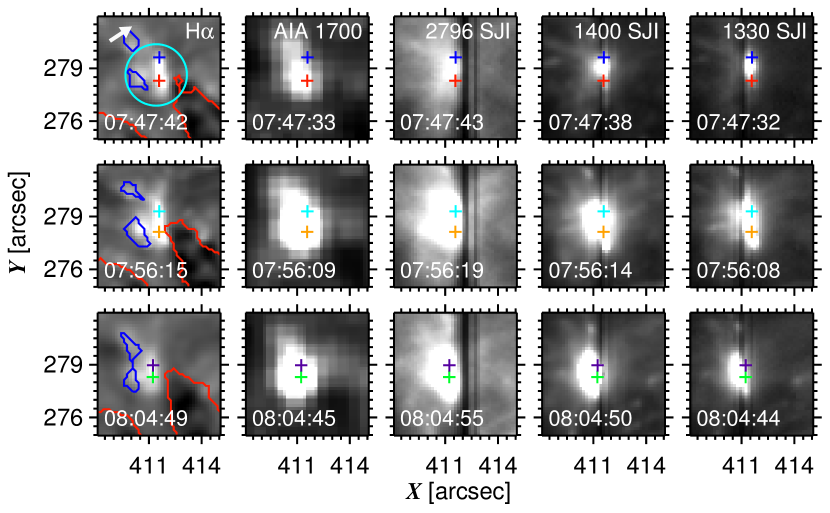
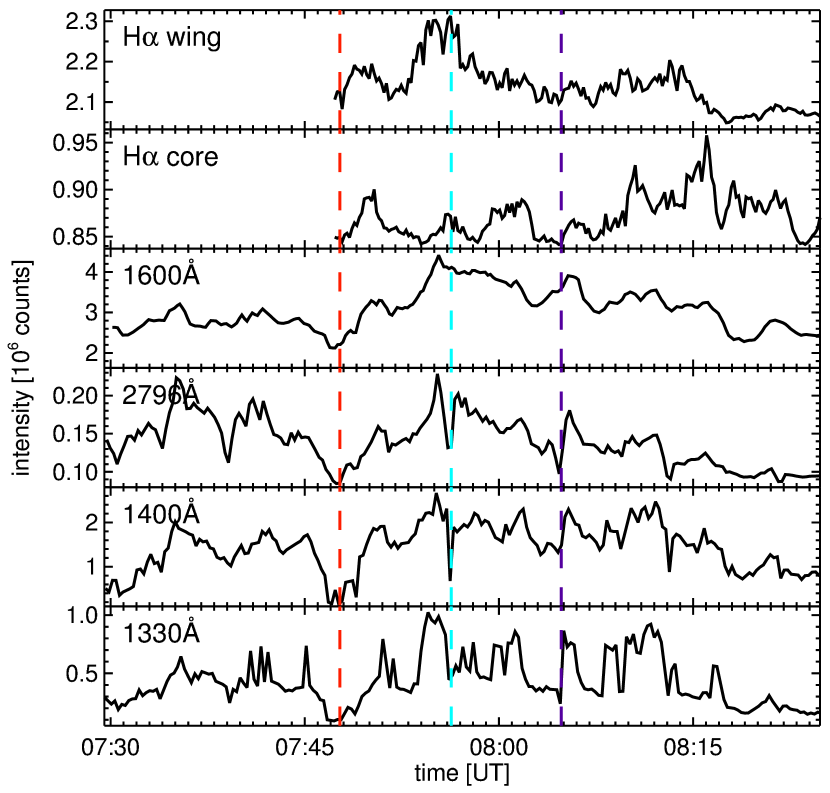

The hotter \HyColor@XZeroOneThreeFour\pc@goptd@color\pc@hyenc@colorpdfcommentcolor\HyColor@XZeroOneThreeFour\pc@goptd@fontcolor\pc@hyenc@fontcolorpdfcommentcolor\HyColor@XZeroOneThreeFour\pc@goptd@icolor\pc@hyenc@icolorpdfcommentcolor\pdfmark[AIA]pdfmark=/ANN,Subtype=/Widget,Raw=/TU (Atmospheric Imaging Assembly\textCR(\pc@goptd@deadline)) /T (tooltip zref@306) /C [ ] /FT/Btn /F 768 /Ff 65536 /H/N /BS ¡¡ /W 0 ¿¿ diagnostics (304, 171, 193 Å) show nothing special happening at the site of EB-2 during the whole period. EB-2 thus seems a bonafide \HyColor@XZeroOneThreeFour\pc@goptd@color\pc@hyenc@colorpdfcommentcolor\HyColor@XZeroOneThreeFour\pc@goptd@fontcolor\pc@hyenc@fontcolorpdfcommentcolor\HyColor@XZeroOneThreeFour\pc@goptd@icolor\pc@hyenc@icolorpdfcommentcolor\pdfmark[EB]pdfmark=/ANN,Subtype=/Widget,Raw=/TU (Ellerman bomb\textCR(\pc@goptd@deadline)) /T (tooltip zref@307) /C [ ] /FT/Btn /F 768 /Ff 65536 /H/N /BS ¡¡ /W 0 ¿¿ , but repeating over unusual duration thanks to continued supply of opposite-polarity fields.
The top row of Fig. 6 with red and blue pixel markers shows EB-2 at the start of the \HyColor@XZeroOneThreeFour\pc@goptd@color\pc@hyenc@colorpdfcommentcolor\HyColor@XZeroOneThreeFour\pc@goptd@fontcolor\pc@hyenc@fontcolorpdfcommentcolor\HyColor@XZeroOneThreeFour\pc@goptd@icolor\pc@hyenc@icolorpdfcommentcolor\pdfmark[SST]pdfmark=/ANN,Subtype=/Widget,Raw=/TU (Swedish 1-m Solar Telescope\textCR(\pc@goptd@deadline)) /T (tooltip zref@308) /C [ ] /FT/Btn /F 768 /Ff 65536 /H/N /BS ¡¡ /W 0 ¿¿ observations (first vertical line in Fig. 7). The corresponding red and blue Si iv and C ii profiles in Fig. 8 appear similar in shape to those in Fig. 4, but note the differences in intensity scales: the blue and red Si iv profiles reach nearly 20 times higher count values than for EB-1, more than expected from the doubled exposure time. They are also much wider. The red C ii profiles are still well separated, but the blue profiles nearly overlap. This is not seen in quiet-Sun spectra (Lites et al. 1978).
The red and blue profiles nevertheless still display similar profiles as EB-1: clean humps with the blue ones from the upper part reaching higher intensities than the red ones from the lower part, and with redshifts for the lower sampling and blueshifts for the upper sampling that again correspond very well between the Si iv, C ii, and Mg ii triplet lines. As in EB-1, the 1700 Å brightness patch in the top row of Fig. 6 favors the bottom part of EB-2 while the ultraviolet images indicate higher formation for hotter diagnostics. These EB-2 results are in excellent agreement with our EB-1 findings.
However, the red and blue profiles sampled only the start-up of EB-2. It became much larger and brighter afterwards (cf. Figs. 6 and 7). Figure 8 adds lower-and-upper spectral sample pairs also at the times when the \HyColor@XZeroOneThreeFour\pc@goptd@color\pc@hyenc@colorpdfcommentcolor\HyColor@XZeroOneThreeFour\pc@goptd@fontcolor\pc@hyenc@fontcolorpdfcommentcolor\HyColor@XZeroOneThreeFour\pc@goptd@icolor\pc@hyenc@icolorpdfcommentcolor\pdfmark[IRIS]pdfmark=/ANN,Subtype=/Widget,Raw=/TU (Interface Region Imaging Spectrograph\textCR(\pc@goptd@deadline)) /T (tooltip zref@309) /C [ ] /FT/Btn /F 768 /Ff 65536 /H/N /BS ¡¡ /W 0 ¿¿ slit passed EB-2 again around 07:56 UT and 08:05 UT, respectively (second and third rows of Fig. 6, with orange and cyan lower/upper markers in the second row and green and violet lower/upper markers in the third row). The Si iv and C ii lines grew considerably in intensity and developed more complex profiles that do show \HyColor@XZeroOneThreeFour\pc@goptd@color\pc@hyenc@colorpdfcommentcolor\HyColor@XZeroOneThreeFour\pc@goptd@fontcolor\pc@hyenc@fontcolorpdfcommentcolor\HyColor@XZeroOneThreeFour\pc@goptd@icolor\pc@hyenc@icolorpdfcommentcolor\pdfmark[IB]pdfmark=/ANN,Subtype=/Widget,Raw=/TU (IRIS bomb\textCR(\pc@goptd@deadline)) /T (tooltip zref@310) /C [ ] /FT/Btn /F 768 /Ff 65536 /H/N /BS ¡¡ /W 0 ¿¿ signatures: wide wings, cores with complex structure, and deep blends.
The orange and green lower-part samplings show the most complex double-peaked Si iv profiles in Fig. 8. These profiles come closest in shape to the double-peaked profiles in Peter et al. (2014), which were interpreted as signature of a bi-directional jet. Here, the small Si iv line-center dips may represent self-absorption in stationary gas, but also just lack of stationary gas in optically-thin emissivity mapping of two counter streams as blue- and redshifted profile humps. In contrast to the similarity of the two Si iv profiles in Peter et al. (2014), the green and orange Si iv profiles of EB-2 differ between the two lines.
The Dopplershift patterns are again consistent between the different unveiled diagnostics. All lower-part samples (red, orange, green) show redshifts domination, the upper-part samples (blue, cyan, violet) single blueshifted peaks, although with redward profile tails. Most profiles show ragged tops. Such core raggedness is further discussed in Sect. 4.
The Ni ii blends at 1393.32 Å in the stronger Si iv line and at 1335.20 Å between the C ii lines are very pronounced in all but the red samplings. The Fe ii blends at 1403.10 Å and 1403.26 Å in the red wing of the weaker Si iv line are present in the orange and green lower-part samplings, and weakly in the final violet upper-part sampling. These blends generally show blueshifts, larger in the orange than in the subsequent green sampling. They suggest upward, decelerating motion of cool gas along the line of sight to the \HyColor@XZeroOneThreeFour\pc@goptd@color\pc@hyenc@colorpdfcommentcolor\HyColor@XZeroOneThreeFour\pc@goptd@fontcolor\pc@hyenc@fontcolorpdfcommentcolor\HyColor@XZeroOneThreeFour\pc@goptd@icolor\pc@hyenc@icolorpdfcommentcolor\pdfmark[EB]pdfmark=/ANN,Subtype=/Widget,Raw=/TU (Ellerman bomb\textCR(\pc@goptd@deadline)) /T (tooltip zref@311) /C [ ] /FT/Btn /F 768 /Ff 65536 /H/N /BS ¡¡ /W 0 ¿¿ .
The three lower-part samples (red, orange, green) show the Mn i blends in the Mg ii and k wings, strongest in the red start-up lower sampling, whereas they are not present in the three upper samplings. We again attribute these blends to undisturbed upper-photosphere gas along slanted lines of sight to the \HyColor@XZeroOneThreeFour\pc@goptd@color\pc@hyenc@colorpdfcommentcolor\HyColor@XZeroOneThreeFour\pc@goptd@fontcolor\pc@hyenc@fontcolorpdfcommentcolor\HyColor@XZeroOneThreeFour\pc@goptd@icolor\pc@hyenc@icolorpdfcommentcolor\pdfmark[EB]pdfmark=/ANN,Subtype=/Widget,Raw=/TU (Ellerman bomb\textCR(\pc@goptd@deadline)) /T (tooltip zref@312) /C [ ] /FT/Btn /F 768 /Ff 65536 /H/N /BS ¡¡ /W 0 ¿¿ foot, with lines of sight towards the upper part passing over the Mn i formation layer. In this case the Mn ii line is only weakly present in the lower-part samplings, without \HyColor@XZeroOneThreeFour\pc@goptd@color\pc@hyenc@colorpdfcommentcolor\HyColor@XZeroOneThreeFour\pc@goptd@fontcolor\pc@hyenc@fontcolorpdfcommentcolor\HyColor@XZeroOneThreeFour\pc@goptd@icolor\pc@hyenc@icolorpdfcommentcolor\pdfmark[EB]pdfmark=/ANN,Subtype=/Widget,Raw=/TU (Ellerman bomb\textCR(\pc@goptd@deadline)) /T (tooltip zref@313) /C [ ] /FT/Btn /F 768 /Ff 65536 /H/N /BS ¡¡ /W 0 ¿¿ sampling.
The core of H remained similar in the various samplings, again indicating domination by overlying fibrils. The same holds for the line-center dips of Mg ii and k. The green H and h and k cores show similar redshift.
The Mg ii and k peaks brightened considerably in the cyan upper-part sampling (the dip in the 2796 Å light curve in Fig. 7 is due to the slit). This curve tracks the 1700 Å light curve fairly well. Since also the peak asymmetries correspond with those of the C ii lines the fibrilar obscuration may have been thinner for this sampling. The cyan H core is also relatively narrow.
The outer wings of the Mg ii and k seem to sample EB-2 in optically-thick manner because they have about equal intensities in the two lines (which also have a transition probability ratio of two).
We conclude that EB-2 showed EB-1-like profiles in its onset and later developed more outspoken \HyColor@XZeroOneThreeFour\pc@goptd@color\pc@hyenc@colorpdfcommentcolor\HyColor@XZeroOneThreeFour\pc@goptd@fontcolor\pc@hyenc@fontcolorpdfcommentcolor\HyColor@XZeroOneThreeFour\pc@goptd@icolor\pc@hyenc@icolorpdfcommentcolor\pdfmark[IB]pdfmark=/ANN,Subtype=/Widget,Raw=/TU (IRIS bomb\textCR(\pc@goptd@deadline)) /T (tooltip zref@314) /C [ ] /FT/Btn /F 768 /Ff 65536 /H/N /BS ¡¡ /W 0 ¿¿ signatures. Whether EB-1 did the same we do not know, but EB-2 shows that strong \HyColor@XZeroOneThreeFour\pc@goptd@color\pc@hyenc@colorpdfcommentcolor\HyColor@XZeroOneThreeFour\pc@goptd@fontcolor\pc@hyenc@fontcolorpdfcommentcolor\HyColor@XZeroOneThreeFour\pc@goptd@icolor\pc@hyenc@icolorpdfcommentcolor\pdfmark[EB]pdfmark=/ANN,Subtype=/Widget,Raw=/TU (Ellerman bomb\textCR(\pc@goptd@deadline)) /T (tooltip zref@315) /C [ ] /FT/Btn /F 768 /Ff 65536 /H/N /BS ¡¡ /W 0 ¿¿ activity can indeed produce \HyColor@XZeroOneThreeFour\pc@goptd@color\pc@hyenc@colorpdfcommentcolor\HyColor@XZeroOneThreeFour\pc@goptd@fontcolor\pc@hyenc@fontcolorpdfcommentcolor\HyColor@XZeroOneThreeFour\pc@goptd@icolor\pc@hyenc@icolorpdfcommentcolor\pdfmark[IB]pdfmark=/ANN,Subtype=/Widget,Raw=/TU (IRIS bomb\textCR(\pc@goptd@deadline)) /T (tooltip zref@316) /C [ ] /FT/Btn /F 768 /Ff 65536 /H/N /BS ¡¡ /W 0 ¿¿ -type spectra as suggested by Peter et al. (2014).
The similarity of the orange and green lower-part profiles and the similarity of the cyan and violet upper-part profiles at 8.6 min sampling delay suggests that the feature persisted over long duration.
Such a hot signature was not seen at the onset of EB-2, implying that the preceding hour of \HyColor@XZeroOneThreeFour\pc@goptd@color\pc@hyenc@colorpdfcommentcolor\HyColor@XZeroOneThreeFour\pc@goptd@fontcolor\pc@hyenc@fontcolorpdfcommentcolor\HyColor@XZeroOneThreeFour\pc@goptd@icolor\pc@hyenc@icolorpdfcommentcolor\pdfmark[EB]pdfmark=/ANN,Subtype=/Widget,Raw=/TU (Ellerman bomb\textCR(\pc@goptd@deadline)) /T (tooltip zref@317) /C [ ] /FT/Btn /F 768 /Ff 65536 /H/N /BS ¡¡ /W 0 ¿¿ activity suggested by the \HyColor@XZeroOneThreeFour\pc@goptd@color\pc@hyenc@colorpdfcommentcolor\HyColor@XZeroOneThreeFour\pc@goptd@fontcolor\pc@hyenc@fontcolorpdfcommentcolor\HyColor@XZeroOneThreeFour\pc@goptd@icolor\pc@hyenc@icolorpdfcommentcolor\pdfmark[AIA]pdfmark=/ANN,Subtype=/Widget,Raw=/TU (Atmospheric Imaging Assembly\textCR(\pc@goptd@deadline)) /T (tooltip zref@318) /C [ ] /FT/Btn /F 768 /Ff 65536 /H/N /BS ¡¡ /W 0 ¿¿ 1700 Å movie had not left one by that time.
3.3. Details for EB-a, EB-b, EB-c
EB-1 and EB-2 were well-defined strong \HyColor@XZeroOneThreeFour\pc@goptd@color\pc@hyenc@colorpdfcommentcolor\HyColor@XZeroOneThreeFour\pc@goptd@fontcolor\pc@hyenc@fontcolorpdfcommentcolor\HyColor@XZeroOneThreeFour\pc@goptd@icolor\pc@hyenc@icolorpdfcommentcolor\pdfmark[EB]pdfmark=/ANN,Subtype=/Widget,Raw=/TU (Ellerman bomb\textCR(\pc@goptd@deadline)) /T (tooltip zref@319) /C [ ] /FT/Btn /F 768 /Ff 65536 /H/N /BS ¡¡ /W 0 ¿¿ s. We now turn to the weaker or questionable EB-a, EB-b, EB-c in dataset 2. Figures 9 and 10 show their sampling and spectral profiles in the format of Figs. 2 and 4.
The \HyColor@XZeroOneThreeFour\pc@goptd@color\pc@hyenc@colorpdfcommentcolor\HyColor@XZeroOneThreeFour\pc@goptd@fontcolor\pc@hyenc@fontcolorpdfcommentcolor\HyColor@XZeroOneThreeFour\pc@goptd@icolor\pc@hyenc@icolorpdfcommentcolor\pdfmark[HMI]pdfmark=/ANN,Subtype=/Widget,Raw=/TU (Helioseismic and Magnetic Imager\textCR(\pc@goptd@deadline)) /T (tooltip zref@320) /C [ ] /FT/Btn /F 768 /Ff 65536 /H/N /BS ¡¡ /W 0 ¿¿ magnetogram sequence displays a complex region with much streaming motion in which opposite-polarity patches canceled frequently. There were strong H \HyColor@XZeroOneThreeFour\pc@goptd@color\pc@hyenc@colorpdfcommentcolor\HyColor@XZeroOneThreeFour\pc@goptd@fontcolor\pc@hyenc@fontcolorpdfcommentcolor\HyColor@XZeroOneThreeFour\pc@goptd@icolor\pc@hyenc@icolorpdfcommentcolor\pdfmark[EB]pdfmark=/ANN,Subtype=/Widget,Raw=/TU (Ellerman bomb\textCR(\pc@goptd@deadline)) /T (tooltip zref@321) /C [ ] /FT/Btn /F 768 /Ff 65536 /H/N /BS ¡¡ /W 0 ¿¿ s that appeared as obvious 1700 Å ones, but these were unfortunately not sampled by \HyColor@XZeroOneThreeFour\pc@goptd@color\pc@hyenc@colorpdfcommentcolor\HyColor@XZeroOneThreeFour\pc@goptd@fontcolor\pc@hyenc@fontcolorpdfcommentcolor\HyColor@XZeroOneThreeFour\pc@goptd@icolor\pc@hyenc@icolorpdfcommentcolor\pdfmark[IRIS]pdfmark=/ANN,Subtype=/Widget,Raw=/TU (Interface Region Imaging Spectrograph\textCR(\pc@goptd@deadline)) /T (tooltip zref@322) /C [ ] /FT/Btn /F 768 /Ff 65536 /H/N /BS ¡¡ /W 0 ¿¿ . As noted above, we lowered the H discrimination level to include weaker events that were sampled by \HyColor@XZeroOneThreeFour\pc@goptd@color\pc@hyenc@colorpdfcommentcolor\HyColor@XZeroOneThreeFour\pc@goptd@fontcolor\pc@hyenc@fontcolorpdfcommentcolor\HyColor@XZeroOneThreeFour\pc@goptd@icolor\pc@hyenc@icolorpdfcommentcolor\pdfmark[IRIS]pdfmark=/ANN,Subtype=/Widget,Raw=/TU (Interface Region Imaging Spectrograph\textCR(\pc@goptd@deadline)) /T (tooltip zref@323) /C [ ] /FT/Btn /F 768 /Ff 65536 /H/N /BS ¡¡ /W 0 ¿¿ because their H morphology indicated \HyColor@XZeroOneThreeFour\pc@goptd@color\pc@hyenc@colorpdfcommentcolor\HyColor@XZeroOneThreeFour\pc@goptd@fontcolor\pc@hyenc@fontcolorpdfcommentcolor\HyColor@XZeroOneThreeFour\pc@goptd@icolor\pc@hyenc@icolorpdfcommentcolor\pdfmark[EB]pdfmark=/ANN,Subtype=/Widget,Raw=/TU (Ellerman bomb\textCR(\pc@goptd@deadline)) /T (tooltip zref@324) /C [ ] /FT/Btn /F 768 /Ff 65536 /H/N /BS ¡¡ /W 0 ¿¿ nature rather than \HyColor@XZeroOneThreeFour\pc@goptd@color\pc@hyenc@colorpdfcommentcolor\HyColor@XZeroOneThreeFour\pc@goptd@fontcolor\pc@hyenc@fontcolorpdfcommentcolor\HyColor@XZeroOneThreeFour\pc@goptd@icolor\pc@hyenc@icolorpdfcommentcolor\pdfmark[MC]pdfmark=/ANN,Subtype=/Widget,Raw=/TU (magnetic concentration\textCR(\pc@goptd@deadline)) /T (tooltip zref@325) /C [ ] /FT/Btn /F 768 /Ff 65536 /H/N /BS ¡¡ /W 0 ¿¿ nature, although such recognition was hampered by more vertical viewing than in datasets 1 and 3. In the \HyColor@XZeroOneThreeFour\pc@goptd@color\pc@hyenc@colorpdfcommentcolor\HyColor@XZeroOneThreeFour\pc@goptd@fontcolor\pc@hyenc@fontcolorpdfcommentcolor\HyColor@XZeroOneThreeFour\pc@goptd@icolor\pc@hyenc@icolorpdfcommentcolor\pdfmark[AIA]pdfmark=/ANN,Subtype=/Widget,Raw=/TU (Atmospheric Imaging Assembly\textCR(\pc@goptd@deadline)) /T (tooltip zref@326) /C [ ] /FT/Btn /F 768 /Ff 65536 /H/N /BS ¡¡ /W 0 ¿¿ 1700 Å movie none of these appeared as an obvious \HyColor@XZeroOneThreeFour\pc@goptd@color\pc@hyenc@colorpdfcommentcolor\HyColor@XZeroOneThreeFour\pc@goptd@fontcolor\pc@hyenc@fontcolorpdfcommentcolor\HyColor@XZeroOneThreeFour\pc@goptd@icolor\pc@hyenc@icolorpdfcommentcolor\pdfmark[EB]pdfmark=/ANN,Subtype=/Widget,Raw=/TU (Ellerman bomb\textCR(\pc@goptd@deadline)) /T (tooltip zref@327) /C [ ] /FT/Btn /F 768 /Ff 65536 /H/N /BS ¡¡ /W 0 ¿¿ (even though EB-b passed the Paper II 1700 Å criteria). For example, in the first two panels of Fig. 9 the H feature appears EB-like, but the neighboring normal \HyColor@XZeroOneThreeFour\pc@goptd@color\pc@hyenc@colorpdfcommentcolor\HyColor@XZeroOneThreeFour\pc@goptd@fontcolor\pc@hyenc@fontcolorpdfcommentcolor\HyColor@XZeroOneThreeFour\pc@goptd@icolor\pc@hyenc@icolorpdfcommentcolor\pdfmark[MC]pdfmark=/ANN,Subtype=/Widget,Raw=/TU (magnetic concentration\textCR(\pc@goptd@deadline)) /T (tooltip zref@328) /C [ ] /FT/Btn /F 768 /Ff 65536 /H/N /BS ¡¡ /W 0 ¿¿ s appear as bright in 1700 Å.
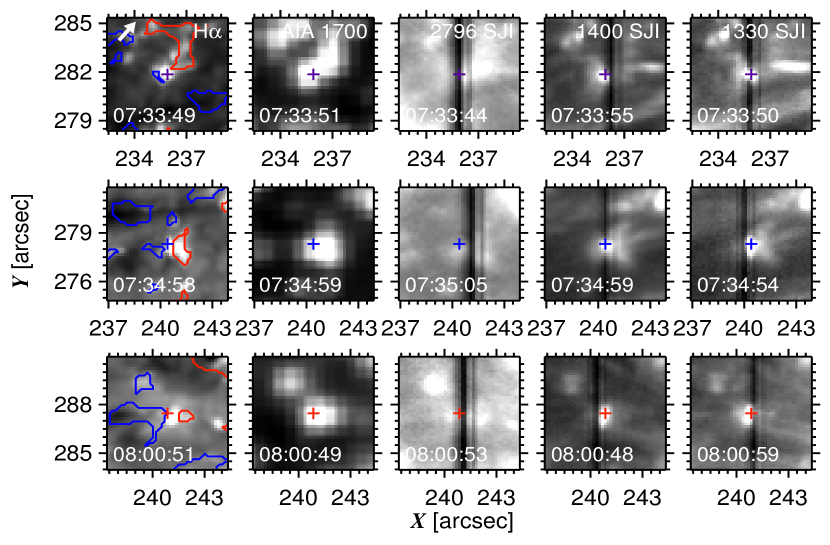
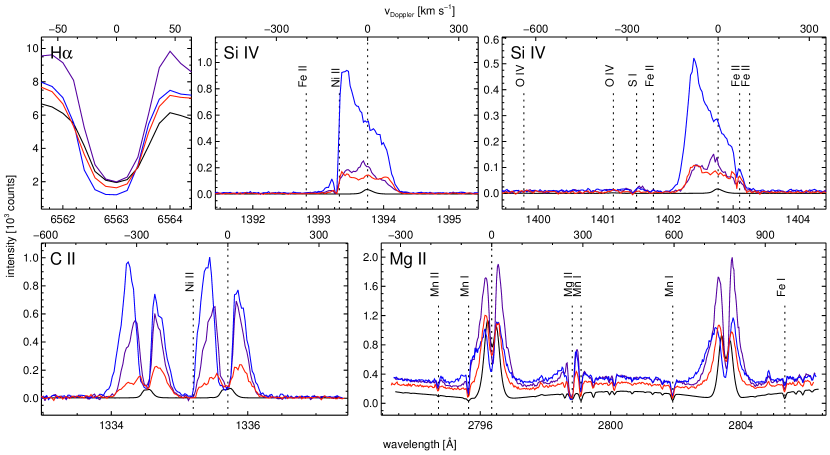
The three \HyColor@XZeroOneThreeFour\pc@goptd@color\pc@hyenc@colorpdfcommentcolor\HyColor@XZeroOneThreeFour\pc@goptd@fontcolor\pc@hyenc@fontcolorpdfcommentcolor\HyColor@XZeroOneThreeFour\pc@goptd@icolor\pc@hyenc@icolorpdfcommentcolor\pdfmark[EB]pdfmark=/ANN,Subtype=/Widget,Raw=/TU (Ellerman bomb\textCR(\pc@goptd@deadline)) /T (tooltip zref@333) /C [ ] /FT/Btn /F 768 /Ff 65536 /H/N /BS ¡¡ /W 0 ¿¿ s we selected for display are the ones with the highest intensities in the Si iv lines. They are sufficiently high to confirm that these candidates were not pseudo-EBs (ordinary \HyColor@XZeroOneThreeFour\pc@goptd@color\pc@hyenc@colorpdfcommentcolor\HyColor@XZeroOneThreeFour\pc@goptd@fontcolor\pc@hyenc@fontcolorpdfcommentcolor\HyColor@XZeroOneThreeFour\pc@goptd@icolor\pc@hyenc@icolorpdfcommentcolor\pdfmark[MC]pdfmark=/ANN,Subtype=/Widget,Raw=/TU (magnetic concentration\textCR(\pc@goptd@deadline)) /T (tooltip zref@334) /C [ ] /FT/Btn /F 768 /Ff 65536 /H/N /BS ¡¡ /W 0 ¿¿ s; if they were, \HyColor@XZeroOneThreeFour\pc@goptd@color\pc@hyenc@colorpdfcommentcolor\HyColor@XZeroOneThreeFour\pc@goptd@fontcolor\pc@hyenc@fontcolorpdfcommentcolor\HyColor@XZeroOneThreeFour\pc@goptd@icolor\pc@hyenc@icolorpdfcommentcolor\pdfmark[IRIS]pdfmark=/ANN,Subtype=/Widget,Raw=/TU (Interface Region Imaging Spectrograph\textCR(\pc@goptd@deadline)) /T (tooltip zref@335) /C [ ] /FT/Btn /F 768 /Ff 65536 /H/N /BS ¡¡ /W 0 ¿¿ would show such profiles from network everywhere). We therefore present these as non-suspect but weak \HyColor@XZeroOneThreeFour\pc@goptd@color\pc@hyenc@colorpdfcommentcolor\HyColor@XZeroOneThreeFour\pc@goptd@fontcolor\pc@hyenc@fontcolorpdfcommentcolor\HyColor@XZeroOneThreeFour\pc@goptd@icolor\pc@hyenc@icolorpdfcommentcolor\pdfmark[EB]pdfmark=/ANN,Subtype=/Widget,Raw=/TU (Ellerman bomb\textCR(\pc@goptd@deadline)) /T (tooltip zref@336) /C [ ] /FT/Btn /F 768 /Ff 65536 /H/N /BS ¡¡ /W 0 ¿¿ s.
In Fig. 10 the Si iv lines reach about twice as high values as EB-1 in Fig. 4 which could be explained from the doubling of the exposure time), but these Si iv profiles are more complex. The apparent Si iv height equality between the differently scaled panels again indicates thinnish formation, with the non-Gaussian shapes suggesting viewing through multiple Dopplershifted components. This strengthens our judgment from Paper I and Paper II that slanted \HyColor@XZeroOneThreeFour\pc@goptd@color\pc@hyenc@colorpdfcommentcolor\HyColor@XZeroOneThreeFour\pc@goptd@fontcolor\pc@hyenc@fontcolorpdfcommentcolor\HyColor@XZeroOneThreeFour\pc@goptd@icolor\pc@hyenc@icolorpdfcommentcolor\pdfmark[EB]pdfmark=/ANN,Subtype=/Widget,Raw=/TU (Ellerman bomb\textCR(\pc@goptd@deadline)) /T (tooltip zref@337) /C [ ] /FT/Btn /F 768 /Ff 65536 /H/N /BS ¡¡ /W 0 ¿¿ viewing helps to diagnose \HyColor@XZeroOneThreeFour\pc@goptd@color\pc@hyenc@colorpdfcommentcolor\HyColor@XZeroOneThreeFour\pc@goptd@fontcolor\pc@hyenc@fontcolorpdfcommentcolor\HyColor@XZeroOneThreeFour\pc@goptd@icolor\pc@hyenc@icolorpdfcommentcolor\pdfmark[EB]pdfmark=/ANN,Subtype=/Widget,Raw=/TU (Ellerman bomb\textCR(\pc@goptd@deadline)) /T (tooltip zref@338) /C [ ] /FT/Btn /F 768 /Ff 65536 /H/N /BS ¡¡ /W 0 ¿¿ formation. In Figs. 4 and Fig. 8 it did by spatially separating the different Dopplershift signatures of the lower and upper parts of the bi-directional jet. Here, these likely mixed together along the line of sight in all three \HyColor@XZeroOneThreeFour\pc@goptd@color\pc@hyenc@colorpdfcommentcolor\HyColor@XZeroOneThreeFour\pc@goptd@fontcolor\pc@hyenc@fontcolorpdfcommentcolor\HyColor@XZeroOneThreeFour\pc@goptd@icolor\pc@hyenc@icolorpdfcommentcolor\pdfmark[EB]pdfmark=/ANN,Subtype=/Widget,Raw=/TU (Ellerman bomb\textCR(\pc@goptd@deadline)) /T (tooltip zref@339) /C [ ] /FT/Btn /F 768 /Ff 65536 /H/N /BS ¡¡ /W 0 ¿¿ s.
Thus, the Si iv profiles in Fig. 10 suggest that the line of sight sampled both a blueshifted upper part and a redshifted lower part, with the upper part again hotter for EB-b (blue profiles) but with about equal contributions for the other two. All Si iv cores show small-scale raggedness (Sect. 4).
The C ii profiles are similar to those of EB-1 in Fig. 4 but with closer peak equalities that again suggest bi-modal sampling. For EB-b the blue profile of the Mg ii triplet lines shows opposite asymmetry to the blue Si iv and C ii profiles, suggesting peak formation in the lower part similar to the three lower-part samples of EB-2 in this line in Fig. 8.
The various blends are markedly present in all three samplings. The Fe ii and Ni ii blends again show substantial blueshifts, the Mn i and Mn ii lines in the last panel none. In top-down viewing as suggested by the jet mixing, the latter must be from cool upper-photosphere-like gas above the \HyColor@XZeroOneThreeFour\pc@goptd@color\pc@hyenc@colorpdfcommentcolor\HyColor@XZeroOneThreeFour\pc@goptd@fontcolor\pc@hyenc@fontcolorpdfcommentcolor\HyColor@XZeroOneThreeFour\pc@goptd@icolor\pc@hyenc@icolorpdfcommentcolor\pdfmark[EB]pdfmark=/ANN,Subtype=/Widget,Raw=/TU (Ellerman bomb\textCR(\pc@goptd@deadline)) /T (tooltip zref@340) /C [ ] /FT/Btn /F 768 /Ff 65536 /H/N /BS ¡¡ /W 0 ¿¿ s, suggesting that the \HyColor@XZeroOneThreeFour\pc@goptd@color\pc@hyenc@colorpdfcommentcolor\HyColor@XZeroOneThreeFour\pc@goptd@fontcolor\pc@hyenc@fontcolorpdfcommentcolor\HyColor@XZeroOneThreeFour\pc@goptd@icolor\pc@hyenc@icolorpdfcommentcolor\pdfmark[EB]pdfmark=/ANN,Subtype=/Widget,Raw=/TU (Ellerman bomb\textCR(\pc@goptd@deadline)) /T (tooltip zref@341) /C [ ] /FT/Btn /F 768 /Ff 65536 /H/N /BS ¡¡ /W 0 ¿¿ flames did not reach high into the atmosphere.
The upshot is that these three weak \HyColor@XZeroOneThreeFour\pc@goptd@color\pc@hyenc@colorpdfcommentcolor\HyColor@XZeroOneThreeFour\pc@goptd@fontcolor\pc@hyenc@fontcolorpdfcommentcolor\HyColor@XZeroOneThreeFour\pc@goptd@icolor\pc@hyenc@icolorpdfcommentcolor\pdfmark[EB]pdfmark=/ANN,Subtype=/Widget,Raw=/TU (Ellerman bomb\textCR(\pc@goptd@deadline)) /T (tooltip zref@342) /C [ ] /FT/Btn /F 768 /Ff 65536 /H/N /BS ¡¡ /W 0 ¿¿ s adhere to the pattern set by EB-1 and EB-2 in their start-up phases, but without spatially resolving the bi-directional jets. It is better to observe \HyColor@XZeroOneThreeFour\pc@goptd@color\pc@hyenc@colorpdfcommentcolor\HyColor@XZeroOneThreeFour\pc@goptd@fontcolor\pc@hyenc@fontcolorpdfcommentcolor\HyColor@XZeroOneThreeFour\pc@goptd@icolor\pc@hyenc@icolorpdfcommentcolor\pdfmark[EB]pdfmark=/ANN,Subtype=/Widget,Raw=/TU (Ellerman bomb\textCR(\pc@goptd@deadline)) /T (tooltip zref@343) /C [ ] /FT/Btn /F 768 /Ff 65536 /H/N /BS ¡¡ /W 0 ¿¿ s away from disk center, which also increases \HyColor@XZeroOneThreeFour\pc@goptd@color\pc@hyenc@colorpdfcommentcolor\HyColor@XZeroOneThreeFour\pc@goptd@fontcolor\pc@hyenc@fontcolorpdfcommentcolor\HyColor@XZeroOneThreeFour\pc@goptd@icolor\pc@hyenc@icolorpdfcommentcolor\pdfmark[EB]pdfmark=/ANN,Subtype=/Widget,Raw=/TU (Ellerman bomb\textCR(\pc@goptd@deadline)) /T (tooltip zref@344) /C [ ] /FT/Btn /F 768 /Ff 65536 /H/N /BS ¡¡ /W 0 ¿¿ contrasts over \HyColor@XZeroOneThreeFour\pc@goptd@color\pc@hyenc@colorpdfcommentcolor\HyColor@XZeroOneThreeFour\pc@goptd@fontcolor\pc@hyenc@fontcolorpdfcommentcolor\HyColor@XZeroOneThreeFour\pc@goptd@icolor\pc@hyenc@icolorpdfcommentcolor\pdfmark[MC]pdfmark=/ANN,Subtype=/Widget,Raw=/TU (magnetic concentration\textCR(\pc@goptd@deadline)) /T (tooltip zref@345) /C [ ] /FT/Btn /F 768 /Ff 65536 /H/N /BS ¡¡ /W 0 ¿¿ s at 1700 Å.
3.4. Details for FAF-1
In dataset 3 a string of very bright \HyColor@XZeroOneThreeFour\pc@goptd@color\pc@hyenc@colorpdfcommentcolor\HyColor@XZeroOneThreeFour\pc@goptd@fontcolor\pc@hyenc@fontcolorpdfcommentcolor\HyColor@XZeroOneThreeFour\pc@goptd@icolor\pc@hyenc@icolorpdfcommentcolor\pdfmark[FAF]pdfmark=/ANN,Subtype=/Widget,Raw=/TU (flaring arch filament\textCR(\pc@goptd@deadline)) /T (tooltip zref@346) /C [ ] /FT/Btn /F 768 /Ff 65536 /H/N /BS ¡¡ /W 0 ¿¿ s appeared in the lower part of the field of view in Fig. 1, East of EB-2. We selected two for display in Figs. 11–16. Their locations are specified in Fig. 1.
Blinking the \HyColor@XZeroOneThreeFour\pc@goptd@color\pc@hyenc@colorpdfcommentcolor\HyColor@XZeroOneThreeFour\pc@goptd@fontcolor\pc@hyenc@fontcolorpdfcommentcolor\HyColor@XZeroOneThreeFour\pc@goptd@icolor\pc@hyenc@icolorpdfcommentcolor\pdfmark[AIA]pdfmark=/ANN,Subtype=/Widget,Raw=/TU (Atmospheric Imaging Assembly\textCR(\pc@goptd@deadline)) /T (tooltip zref@347) /C [ ] /FT/Btn /F 768 /Ff 65536 /H/N /BS ¡¡ /W 0 ¿¿ 1700 Å and \HyColor@XZeroOneThreeFour\pc@goptd@color\pc@hyenc@colorpdfcommentcolor\HyColor@XZeroOneThreeFour\pc@goptd@fontcolor\pc@hyenc@fontcolorpdfcommentcolor\HyColor@XZeroOneThreeFour\pc@goptd@icolor\pc@hyenc@icolorpdfcommentcolor\pdfmark[HMI]pdfmark=/ANN,Subtype=/Widget,Raw=/TU (Helioseismic and Magnetic Imager\textCR(\pc@goptd@deadline)) /T (tooltip zref@348) /C [ ] /FT/Btn /F 768 /Ff 65536 /H/N /BS ¡¡ /W 0 ¿¿ magnetogram movies shows that FAF-1 started when a small patch of black polarity ran fast from afar to merge with a larger black one adjacent to yet a larger patch of white polarity; all black polarity then vanished. FAF-2 occurred next to a fairly large black-polarity patch that moved steadily East into a weak diffuse, barely visible, white-polarity patch.
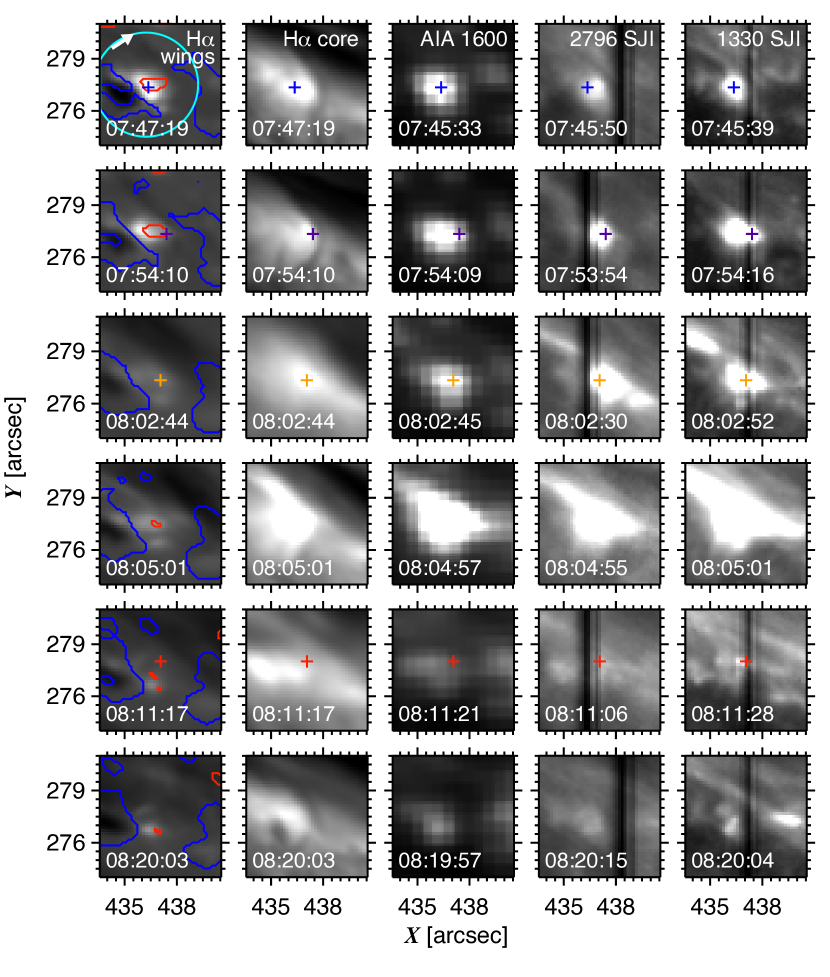
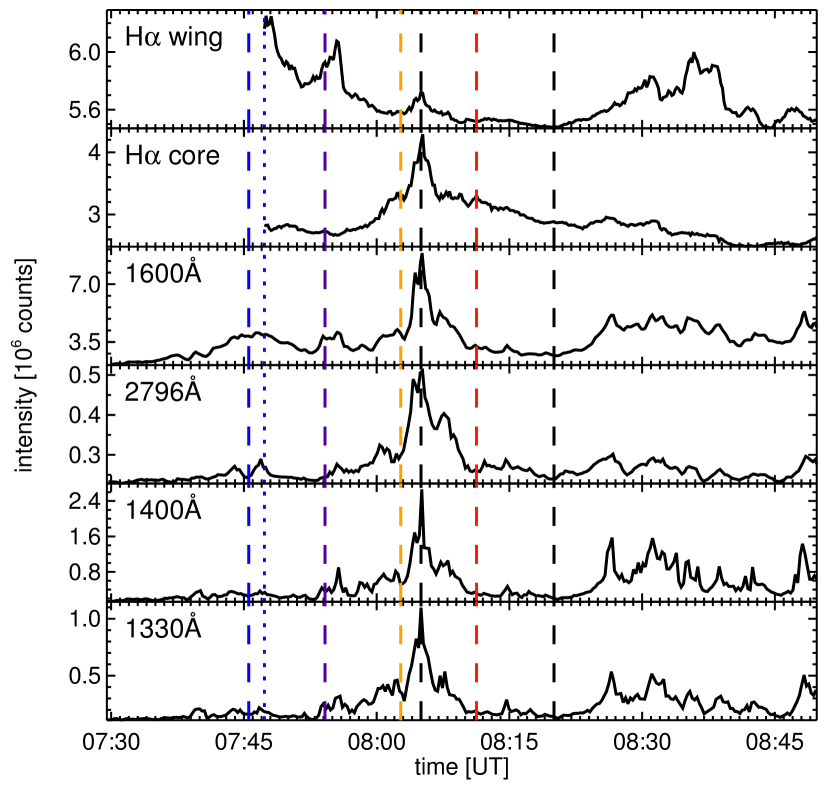
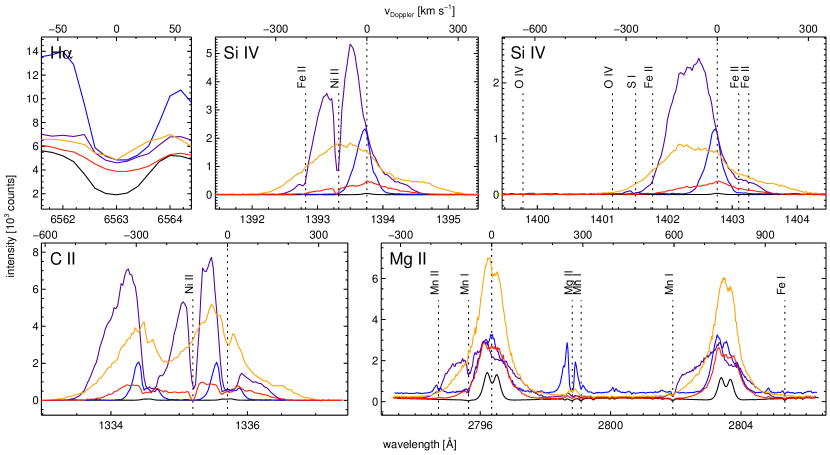
FAF-1 exhibited the strongest and most \HyColor@XZeroOneThreeFour\pc@goptd@color\pc@hyenc@colorpdfcommentcolor\HyColor@XZeroOneThreeFour\pc@goptd@fontcolor\pc@hyenc@fontcolorpdfcommentcolor\HyColor@XZeroOneThreeFour\pc@goptd@icolor\pc@hyenc@icolorpdfcommentcolor\pdfmark[FAF]pdfmark=/ANN,Subtype=/Widget,Raw=/TU (flaring arch filament\textCR(\pc@goptd@deadline)) /T (tooltip zref@363) /C [ ] /FT/Btn /F 768 /Ff 65536 /H/N /BS ¡¡ /W 0 ¿¿ -like flaring, at 08:05 UT. It did so not only in \HyColor@XZeroOneThreeFour\pc@goptd@color\pc@hyenc@colorpdfcommentcolor\HyColor@XZeroOneThreeFour\pc@goptd@fontcolor\pc@hyenc@fontcolorpdfcommentcolor\HyColor@XZeroOneThreeFour\pc@goptd@icolor\pc@hyenc@icolorpdfcommentcolor\pdfmark[AIA]pdfmark=/ANN,Subtype=/Widget,Raw=/TU (Atmospheric Imaging Assembly\textCR(\pc@goptd@deadline)) /T (tooltip zref@364) /C [ ] /FT/Btn /F 768 /Ff 65536 /H/N /BS ¡¡ /W 0 ¿¿ 1600 Å but also in the H core, appearing as a very bright microflare. At about that moment, filamentary arch-shaped brightenings extended from it and connected to two others, FAF-2 to the North-East and another \HyColor@XZeroOneThreeFour\pc@goptd@color\pc@hyenc@colorpdfcommentcolor\HyColor@XZeroOneThreeFour\pc@goptd@fontcolor\pc@hyenc@fontcolorpdfcommentcolor\HyColor@XZeroOneThreeFour\pc@goptd@icolor\pc@hyenc@icolorpdfcommentcolor\pdfmark[FAF]pdfmark=/ANN,Subtype=/Widget,Raw=/TU (flaring arch filament\textCR(\pc@goptd@deadline)) /T (tooltip zref@365) /C [ ] /FT/Btn /F 768 /Ff 65536 /H/N /BS ¡¡ /W 0 ¿¿ to the South-West. Both then brightened in tandem. EB-2 also flared again at 08:05 UT (Fig. 7), but inspection of the \HyColor@XZeroOneThreeFour\pc@goptd@color\pc@hyenc@colorpdfcommentcolor\HyColor@XZeroOneThreeFour\pc@goptd@fontcolor\pc@hyenc@fontcolorpdfcommentcolor\HyColor@XZeroOneThreeFour\pc@goptd@icolor\pc@hyenc@icolorpdfcommentcolor\pdfmark[AIA]pdfmark=/ANN,Subtype=/Widget,Raw=/TU (Atmospheric Imaging Assembly\textCR(\pc@goptd@deadline)) /T (tooltip zref@366) /C [ ] /FT/Btn /F 768 /Ff 65536 /H/N /BS ¡¡ /W 0 ¿¿ 1600 Å movie does not suggest a filamentary connection from FAF-1.
The double filamentary arches extended at apparent speeds over the surface of 200 km s-1 and then around 08:10 UT gave the impression of lifting off upward in the form of a bright thin arc-shaped thread, or giving such an appearance from successive brightening of a fan of adjacent higher-up field loops, over a length of about 20 arcsec and with an apparent projected rise speed of about 40 km s-1. This apparent lift-off was vague in \HyColor@XZeroOneThreeFour\pc@goptd@color\pc@hyenc@colorpdfcommentcolor\HyColor@XZeroOneThreeFour\pc@goptd@fontcolor\pc@hyenc@fontcolorpdfcommentcolor\HyColor@XZeroOneThreeFour\pc@goptd@icolor\pc@hyenc@icolorpdfcommentcolor\pdfmark[AIA]pdfmark=/ANN,Subtype=/Widget,Raw=/TU (Atmospheric Imaging Assembly\textCR(\pc@goptd@deadline)) /T (tooltip zref@367) /C [ ] /FT/Btn /F 768 /Ff 65536 /H/N /BS ¡¡ /W 0 ¿¿ 1600 Å but produced a very bright arch besides FAF-1 in \HyColor@XZeroOneThreeFour\pc@goptd@color\pc@hyenc@colorpdfcommentcolor\HyColor@XZeroOneThreeFour\pc@goptd@fontcolor\pc@hyenc@fontcolorpdfcommentcolor\HyColor@XZeroOneThreeFour\pc@goptd@icolor\pc@hyenc@icolorpdfcommentcolor\pdfmark[AIA]pdfmark=/ANN,Subtype=/Widget,Raw=/TU (Atmospheric Imaging Assembly\textCR(\pc@goptd@deadline)) /T (tooltip zref@368) /C [ ] /FT/Btn /F 768 /Ff 65536 /H/N /BS ¡¡ /W 0 ¿¿ 304, 171, and 193 Å during four minutes, with the same morphology in these diagnostics. Thus, in contrast to \HyColor@XZeroOneThreeFour\pc@goptd@color\pc@hyenc@colorpdfcommentcolor\HyColor@XZeroOneThreeFour\pc@goptd@fontcolor\pc@hyenc@fontcolorpdfcommentcolor\HyColor@XZeroOneThreeFour\pc@goptd@icolor\pc@hyenc@icolorpdfcommentcolor\pdfmark[EB]pdfmark=/ANN,Subtype=/Widget,Raw=/TU (Ellerman bomb\textCR(\pc@goptd@deadline)) /T (tooltip zref@369) /C [ ] /FT/Btn /F 768 /Ff 65536 /H/N /BS ¡¡ /W 0 ¿¿ s which do not excite response in the hotter \HyColor@XZeroOneThreeFour\pc@goptd@color\pc@hyenc@colorpdfcommentcolor\HyColor@XZeroOneThreeFour\pc@goptd@fontcolor\pc@hyenc@fontcolorpdfcommentcolor\HyColor@XZeroOneThreeFour\pc@goptd@icolor\pc@hyenc@icolorpdfcommentcolor\pdfmark[AIA]pdfmark=/ANN,Subtype=/Widget,Raw=/TU (Atmospheric Imaging Assembly\textCR(\pc@goptd@deadline)) /T (tooltip zref@370) /C [ ] /FT/Btn /F 768 /Ff 65536 /H/N /BS ¡¡ /W 0 ¿¿ channels, FAF-1 did so very markedly.
Inspection of the \HyColor@XZeroOneThreeFour\pc@goptd@color\pc@hyenc@colorpdfcommentcolor\HyColor@XZeroOneThreeFour\pc@goptd@fontcolor\pc@hyenc@fontcolorpdfcommentcolor\HyColor@XZeroOneThreeFour\pc@goptd@icolor\pc@hyenc@icolorpdfcommentcolor\pdfmark[IRIS]pdfmark=/ANN,Subtype=/Widget,Raw=/TU (Interface Region Imaging Spectrograph\textCR(\pc@goptd@deadline)) /T (tooltip zref@371) /C [ ] /FT/Btn /F 768 /Ff 65536 /H/N /BS ¡¡ /W 0 ¿¿ spectra showed no spectacular profiles from this million-Kelvin arch: the Si iv lines were enhanced but single-peaked, the C ii lines enhanced and double-peaked but fairly average in width, Mg ii and k were enhanced and broadened, and there was no sign of the Mg ii triplet lines. However, the O iv lines at 1399 and 1401 Å were clearly present throughout the hot arch. These signatures merit further investigation, but studying and displaying such hot coronal \HyColor@XZeroOneThreeFour\pc@goptd@color\pc@hyenc@colorpdfcommentcolor\HyColor@XZeroOneThreeFour\pc@goptd@fontcolor\pc@hyenc@fontcolorpdfcommentcolor\HyColor@XZeroOneThreeFour\pc@goptd@icolor\pc@hyenc@icolorpdfcommentcolor\pdfmark[FAF]pdfmark=/ANN,Subtype=/Widget,Raw=/TU (flaring arch filament\textCR(\pc@goptd@deadline)) /T (tooltip zref@372) /C [ ] /FT/Btn /F 768 /Ff 65536 /H/N /BS ¡¡ /W 0 ¿¿ aftermaths falls outside the scope of this \HyColor@XZeroOneThreeFour\pc@goptd@color\pc@hyenc@colorpdfcommentcolor\HyColor@XZeroOneThreeFour\pc@goptd@fontcolor\pc@hyenc@fontcolorpdfcommentcolor\HyColor@XZeroOneThreeFour\pc@goptd@icolor\pc@hyenc@icolorpdfcommentcolor\pdfmark[EB]pdfmark=/ANN,Subtype=/Widget,Raw=/TU (Ellerman bomb\textCR(\pc@goptd@deadline)) /T (tooltip zref@373) /C [ ] /FT/Btn /F 768 /Ff 65536 /H/N /BS ¡¡ /W 0 ¿¿ paper. We concentrate here on the lower-atmosphere signatures at the FAF-1 site.
Unfortunately, the \HyColor@XZeroOneThreeFour\pc@goptd@color\pc@hyenc@colorpdfcommentcolor\HyColor@XZeroOneThreeFour\pc@goptd@fontcolor\pc@hyenc@fontcolorpdfcommentcolor\HyColor@XZeroOneThreeFour\pc@goptd@icolor\pc@hyenc@icolorpdfcommentcolor\pdfmark[IRIS]pdfmark=/ANN,Subtype=/Widget,Raw=/TU (Interface Region Imaging Spectrograph\textCR(\pc@goptd@deadline)) /T (tooltip zref@374) /C [ ] /FT/Btn /F 768 /Ff 65536 /H/N /BS ¡¡ /W 0 ¿¿ slit did not sample FAF-1 at the time of its H flaring and filamentary extension. We therefore display the imaging at this time in the fourth row of Fig. 11 and show spectra from all slit passes before and after. In the fourth row the H core shows its microflare while the onset of the filamentary extensions is clearest in the 1330 Å slitjaw image, but also noticeable in H . There was no enhancement of the H wings, nothing like an \HyColor@XZeroOneThreeFour\pc@goptd@color\pc@hyenc@colorpdfcommentcolor\HyColor@XZeroOneThreeFour\pc@goptd@fontcolor\pc@hyenc@fontcolorpdfcommentcolor\HyColor@XZeroOneThreeFour\pc@goptd@icolor\pc@hyenc@icolorpdfcommentcolor\pdfmark[EB]pdfmark=/ANN,Subtype=/Widget,Raw=/TU (Ellerman bomb\textCR(\pc@goptd@deadline)) /T (tooltip zref@375) /C [ ] /FT/Btn /F 768 /Ff 65536 /H/N /BS ¡¡ /W 0 ¿¿ , at that time.
However, the first row of Fig. 11 displays brightness patches like an \HyColor@XZeroOneThreeFour\pc@goptd@color\pc@hyenc@colorpdfcommentcolor\HyColor@XZeroOneThreeFour\pc@goptd@fontcolor\pc@hyenc@fontcolorpdfcommentcolor\HyColor@XZeroOneThreeFour\pc@goptd@icolor\pc@hyenc@icolorpdfcommentcolor\pdfmark[EB]pdfmark=/ANN,Subtype=/Widget,Raw=/TU (Ellerman bomb\textCR(\pc@goptd@deadline)) /T (tooltip zref@376) /C [ ] /FT/Btn /F 768 /Ff 65536 /H/N /BS ¡¡ /W 0 ¿¿ , but with the abnormality of also appearing in the H core. The latter is not very bright at this initial sampling time in in Fig. 12, but this is due to the presence of an extended dark fibril within the wide integration contour. The corresponding blue profiles in Fig. 13 appear \HyColor@XZeroOneThreeFour\pc@goptd@color\pc@hyenc@colorpdfcommentcolor\HyColor@XZeroOneThreeFour\pc@goptd@fontcolor\pc@hyenc@fontcolorpdfcommentcolor\HyColor@XZeroOneThreeFour\pc@goptd@icolor\pc@hyenc@icolorpdfcommentcolor\pdfmark[EB]pdfmark=/ANN,Subtype=/Widget,Raw=/TU (Ellerman bomb\textCR(\pc@goptd@deadline)) /T (tooltip zref@377) /C [ ] /FT/Btn /F 768 /Ff 65536 /H/N /BS ¡¡ /W 0 ¿¿ -like, rather like EB-1’s violet profiles in Fig. 4 but higher, also in Mg ii and k. The blue Mg ii triplet profile shows very high peaks, also as for the violet sampling of EB-1.
The next sampling (second row, violet pixel and violet profiles) produced bright Si iv and C ii lines. They remain less intense than the brightest from EB-2, but show extremely wide and much blueshifted profiles, top raggedness, and deep Ni ii blends. The deep self-absorption dips of the C ii lines remain at their rest wavelengths but the rest of the profiles are so much blueshifted, as are the Si iv lines, that almost no red peaks remain. The intensity ratio of the Si iv lines still suggests thin to thinnish formation. Both Si iv lines resemble the Si iv profiles for B-2, 3 and 4 in Peter et al. (2014), while the C ii lines are most alike the C ii lines for B-3 and 4, suggesting that those three \HyColor@XZeroOneThreeFour\pc@goptd@color\pc@hyenc@colorpdfcommentcolor\HyColor@XZeroOneThreeFour\pc@goptd@fontcolor\pc@hyenc@fontcolorpdfcommentcolor\HyColor@XZeroOneThreeFour\pc@goptd@icolor\pc@hyenc@icolorpdfcommentcolor\pdfmark[IB]pdfmark=/ANN,Subtype=/Widget,Raw=/TU (IRIS bomb\textCR(\pc@goptd@deadline)) /T (tooltip zref@378) /C [ ] /FT/Btn /F 768 /Ff 65536 /H/N /BS ¡¡ /W 0 ¿¿ s may in fact have been FAFs.
The striking shape similarities between the C ii and Si iv profiles blueward from the nominal line centers and in the red tails suggest similar sampling of FAF-1 in these parts of the C ii lines, i.e., that the profile structure is mostly set by similar effects of Dopplershift, respectively on the emissivity in optically-thin formation and on the optical depth scales in optically-thick formation.
The non-shifted C ii core dips suggest formation (likely scattering) in a non-disturbed overlying region. The violet Mg ii and k profiles also show wide wing extensions, with the near equality of the two lines again suggesting optically thick formation. The violet Mg ii triplet profile is about normal (nearly absent). The Mn i blends in the blue h and k wings are deep dips.
The next sampling, again 8.6 min later but still 3 min before the H microflare, produced the extraordinary orange profiles in Fig. 13. The Si iv and C ii lines have lower intensities, but are much wider and more symmetrical, as if smeared by enormous thermal broadening or sampling a wide distribution of very fast motions. They are appreciably blueshifted, but have extended red tails. The C ii lines again appear very similar to the Si iv lines, except for the little dips at their nominal line centers suggesting minimal absorption (scattering) in undisturbed gas along the line sight. There are no absorption blends whatsoever. The profile tops are ragged.
The orange Mg ii and k profiles reach as high intensities as the brightest from EB-2 and with similar profiles but show only very small central dips, with ragged appearance. They are the only h and k sampling in all our spectra with obviously unequal wing intensities between the two lines. The cores share in this behavior. The ratio is about 1.5. The orange C ii profiles show similar difference. It suggests that these lines sampled FAF-1 less thickly than our other \HyColor@XZeroOneThreeFour\pc@goptd@color\pc@hyenc@colorpdfcommentcolor\HyColor@XZeroOneThreeFour\pc@goptd@fontcolor\pc@hyenc@fontcolorpdfcommentcolor\HyColor@XZeroOneThreeFour\pc@goptd@icolor\pc@hyenc@icolorpdfcommentcolor\pdfmark[EB]pdfmark=/ANN,Subtype=/Widget,Raw=/TU (Ellerman bomb\textCR(\pc@goptd@deadline)) /T (tooltip zref@379) /C [ ] /FT/Btn /F 768 /Ff 65536 /H/N /BS ¡¡ /W 0 ¿¿ and \HyColor@XZeroOneThreeFour\pc@goptd@color\pc@hyenc@colorpdfcommentcolor\HyColor@XZeroOneThreeFour\pc@goptd@fontcolor\pc@hyenc@fontcolorpdfcommentcolor\HyColor@XZeroOneThreeFour\pc@goptd@icolor\pc@hyenc@icolorpdfcommentcolor\pdfmark[FAF]pdfmark=/ANN,Subtype=/Widget,Raw=/TU (flaring arch filament\textCR(\pc@goptd@deadline)) /T (tooltip zref@380) /C [ ] /FT/Btn /F 768 /Ff 65536 /H/N /BS ¡¡ /W 0 ¿¿ measurements.
The Mg ii triplet lines show slight emission. Together, the orange profiles suggest sampling a very hot rising event with much internal motion that was similarly sampled by the Si iv, C ii, and h and k lines, with only a small amount of undisturbed gas causing dips at the C ii and h and k line centers. It indeed seems an event on its way to become a bright million-Kelvin feature in the \HyColor@XZeroOneThreeFour\pc@goptd@color\pc@hyenc@colorpdfcommentcolor\HyColor@XZeroOneThreeFour\pc@goptd@fontcolor\pc@hyenc@fontcolorpdfcommentcolor\HyColor@XZeroOneThreeFour\pc@goptd@icolor\pc@hyenc@icolorpdfcommentcolor\pdfmark[AIA]pdfmark=/ANN,Subtype=/Widget,Raw=/TU (Atmospheric Imaging Assembly\textCR(\pc@goptd@deadline)) /T (tooltip zref@381) /C [ ] /FT/Btn /F 768 /Ff 65536 /H/N /BS ¡¡ /W 0 ¿¿ diagnostics, becoming thin or thinnish even in Mg ii and k.
The next \HyColor@XZeroOneThreeFour\pc@goptd@color\pc@hyenc@colorpdfcommentcolor\HyColor@XZeroOneThreeFour\pc@goptd@fontcolor\pc@hyenc@fontcolorpdfcommentcolor\HyColor@XZeroOneThreeFour\pc@goptd@icolor\pc@hyenc@icolorpdfcommentcolor\pdfmark[IRIS]pdfmark=/ANN,Subtype=/Widget,Raw=/TU (Interface Region Imaging Spectrograph\textCR(\pc@goptd@deadline)) /T (tooltip zref@382) /C [ ] /FT/Btn /F 768 /Ff 65536 /H/N /BS ¡¡ /W 0 ¿¿ sampling came 6 min after the H microflare (fifth row, red pixel, red profiles) and while the bright million-Kelvin \HyColor@XZeroOneThreeFour\pc@goptd@color\pc@hyenc@colorpdfcommentcolor\HyColor@XZeroOneThreeFour\pc@goptd@fontcolor\pc@hyenc@fontcolorpdfcommentcolor\HyColor@XZeroOneThreeFour\pc@goptd@icolor\pc@hyenc@icolorpdfcommentcolor\pdfmark[AIA]pdfmark=/ANN,Subtype=/Widget,Raw=/TU (Atmospheric Imaging Assembly\textCR(\pc@goptd@deadline)) /T (tooltip zref@383) /C [ ] /FT/Btn /F 768 /Ff 65536 /H/N /BS ¡¡ /W 0 ¿¿ arch was present to the North-East (directly above FAF-1 it was at a height of about 6000 km and appeared projected well beyond the line of sight to FAF-1). These profiles are rather like the orange ones, but have lower intensity and are less blueshifted. They still have red tails but longer blue ones, show small C ii line-center dips, have deep Ni ii blends but no Fe ii blends, only very weak Mn i blends, and ratios departing from optical thickness. There was no specific brightening in the image cutouts anymore, except the H core which shows a long post-flare tail in Fig. 12. In summary, the red profiles suggest a cool-down aftermath.
In the last row of Fig. 11 we also show the scene in the next \HyColor@XZeroOneThreeFour\pc@goptd@color\pc@hyenc@colorpdfcommentcolor\HyColor@XZeroOneThreeFour\pc@goptd@fontcolor\pc@hyenc@fontcolorpdfcommentcolor\HyColor@XZeroOneThreeFour\pc@goptd@icolor\pc@hyenc@icolorpdfcommentcolor\pdfmark[IRIS]pdfmark=/ANN,Subtype=/Widget,Raw=/TU (Interface Region Imaging Spectrograph\textCR(\pc@goptd@deadline)) /T (tooltip zref@384) /C [ ] /FT/Btn /F 768 /Ff 65536 /H/N /BS ¡¡ /W 0 ¿¿ sampling, in order to illustrate that the show was over. There was nothing of interest in the spectra (not shown) anymore.
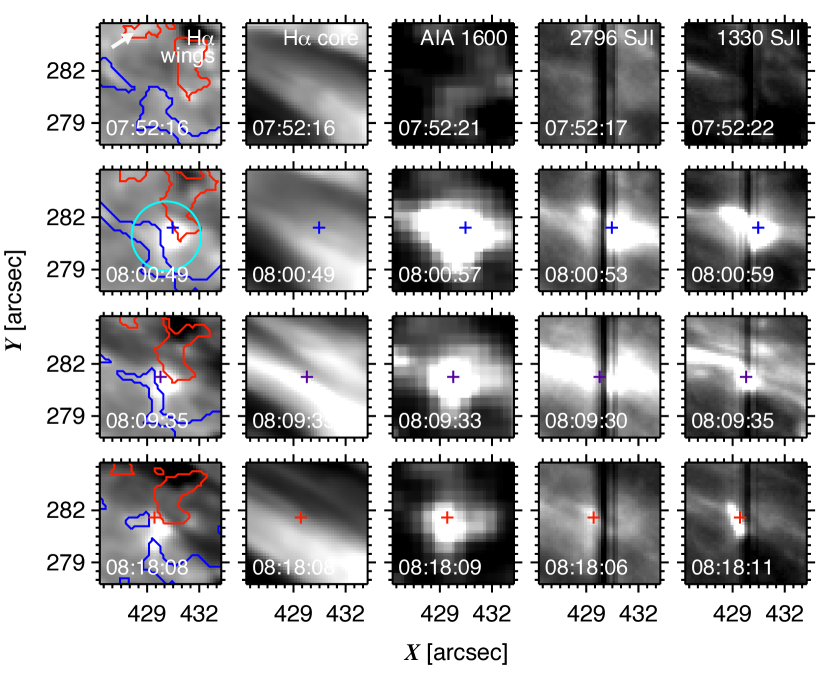
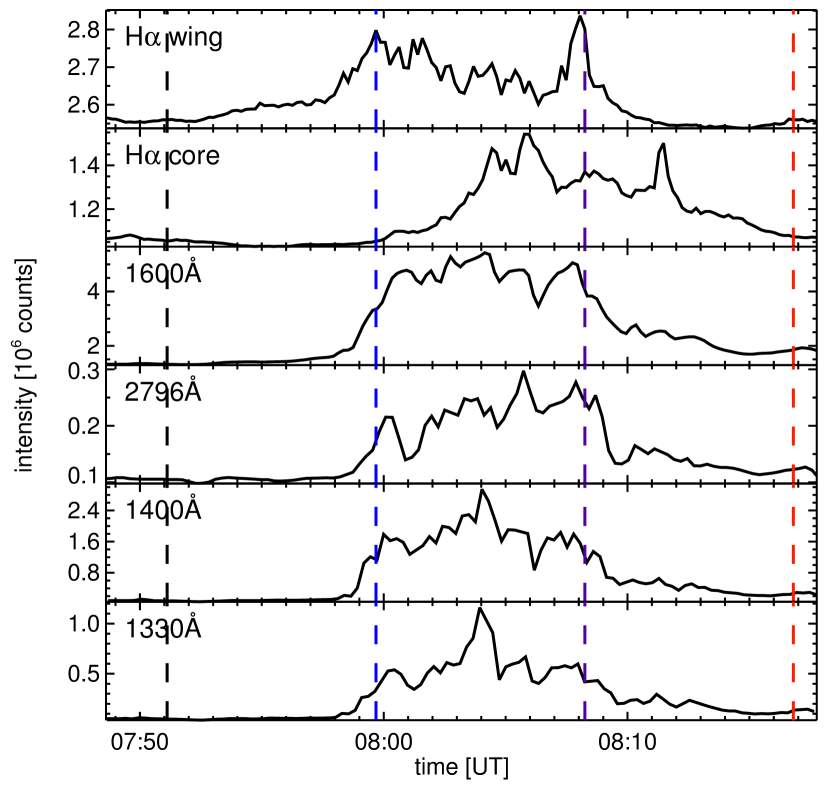
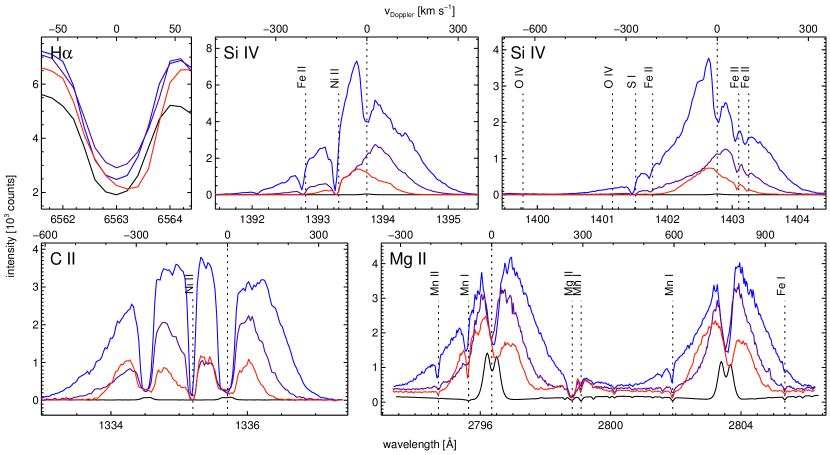
3.5. Details for FAF-2
FAF-2 occurred close to FAF-1 but brightened earlier. It also showed double filamentary extensions in 1600 Å and also seemed to excite response in the hotter \HyColor@XZeroOneThreeFour\pc@goptd@color\pc@hyenc@colorpdfcommentcolor\HyColor@XZeroOneThreeFour\pc@goptd@fontcolor\pc@hyenc@fontcolorpdfcommentcolor\HyColor@XZeroOneThreeFour\pc@goptd@icolor\pc@hyenc@icolorpdfcommentcolor\pdfmark[AIA]pdfmark=/ANN,Subtype=/Widget,Raw=/TU (Atmospheric Imaging Assembly\textCR(\pc@goptd@deadline)) /T (tooltip zref@389) /C [ ] /FT/Btn /F 768 /Ff 65536 /H/N /BS ¡¡ /W 0 ¿¿ channels: slender bright arches during 08:01:30–08:03:30 UT that were clearest in 171 and 193 Å and showed up as bright narrow arcs hovering over FAF-1 in projection to the North-East, but much less prominent than the bright arch after FAF-1.
Figures 14–16 display our standard-format results for FAF-2 in four successive \HyColor@XZeroOneThreeFour\pc@goptd@color\pc@hyenc@colorpdfcommentcolor\HyColor@XZeroOneThreeFour\pc@goptd@fontcolor\pc@hyenc@fontcolorpdfcommentcolor\HyColor@XZeroOneThreeFour\pc@goptd@icolor\pc@hyenc@icolorpdfcommentcolor\pdfmark[IRIS]pdfmark=/ANN,Subtype=/Widget,Raw=/TU (Interface Region Imaging Spectrograph\textCR(\pc@goptd@deadline)) /T (tooltip zref@390) /C [ ] /FT/Btn /F 768 /Ff 65536 /H/N /BS ¡¡ /W 0 ¿¿ samplings. The first sampling (top row of Fig. 14, first vertical time marker in Fig. 15, no spectra since not of interest) shows the scene seven minutes before FAF-2 brightened: nothing special. The second and third samplings bracket its largest brightness; in the fourth it had diminished (Fig. 15). The H core showed fibrilar brightening parallel to the filamentary extensions at 1600 Å but not co-spatially.
The blue profiles in Fig. 16 are the widest of all our specimens and have deep absorption blends (also from S i and Mn ii). They even show central dips in the Si iv lines. In this event the Mg ii and k lines share fully in the Si iv and C ii behavior. The similarity between the blue profiles of these six lines is striking, except that the peak ratios reverse from blue-over-red for Mg ii and k and the C ii lines to red-over-blue for the Si iv lines.
The central dips of the Si iv lines are not due to optically thick self-absorption because they do not have the same absolute intensity but still share the probability-corrected value. They suggest absorption (scattering) in stationary, likely undisturbed, gas along the line of sight that reaches sufficient opacity for thick self-absorption scattering in the C ii and Mg ii and k lines. Outside these cores the six lines exhibit strikingly similar profile shapes.
The blue profiles are not only the brightest but also display the largest raggedness. Inspection of the original spectral images suggests that most of the deeper narrow dips are unidentified blends (for example the dips just red and blue of the Ni ii line between the C ii lines). The Mn i and Mn ii lines in the h and k wings are also strongly present, in this case with significant blueshifts.
The later samplings (violet and red) show roughly similar profiles at diminishing intensities. The violet sampling shows peak redshift for the Si iv lines and corresponding red-over-blue peak asymmetry for the C ii lines, but not for Mg ii and k. The yet later red sampling shows small peak blueshift in the Si iv lines, but similar slight blue-over-red C ii and Mg ii and k peak asymmetries and similar line-center redshifts in these doublets (also in the H core). The blend blueshifts (also of the Mn i lines) became smaller than in the blue sampling. The Mg ii triplet lines show up in absorption in all three samplings. All profiles show some core raggedness.
In summary, FAF-2 showed yet wider profiles than FAF-1 but with more symmetry and with also the Mg ii and k wings taking part. The later samplings again suggest a cool-down phase, but with more undisturbed gas along the line of sight because there was no blend-free sampling as the orange profiles of FAF-1 in Fig. 13; in contrast, blends including the Mn i lines were present in all three samplings, strongly so in the first (blue) and last (red) ones. We speculate that our slanted viewing passed through undisturbed gas at larger height than the \HyColor@XZeroOneThreeFour\pc@goptd@color\pc@hyenc@colorpdfcommentcolor\HyColor@XZeroOneThreeFour\pc@goptd@fontcolor\pc@hyenc@fontcolorpdfcommentcolor\HyColor@XZeroOneThreeFour\pc@goptd@icolor\pc@hyenc@icolorpdfcommentcolor\pdfmark[FAF]pdfmark=/ANN,Subtype=/Widget,Raw=/TU (flaring arch filament\textCR(\pc@goptd@deadline)) /T (tooltip zref@391) /C [ ] /FT/Btn /F 768 /Ff 65536 /H/N /BS ¡¡ /W 0 ¿¿ samplings because fibrilar canopies tend to rise steeply away from network (containing the reconnecting \HyColor@XZeroOneThreeFour\pc@goptd@color\pc@hyenc@colorpdfcommentcolor\HyColor@XZeroOneThreeFour\pc@goptd@fontcolor\pc@hyenc@fontcolorpdfcommentcolor\HyColor@XZeroOneThreeFour\pc@goptd@icolor\pc@hyenc@icolorpdfcommentcolor\pdfmark[MC]pdfmark=/ANN,Subtype=/Widget,Raw=/TU (magnetic concentration\textCR(\pc@goptd@deadline)) /T (tooltip zref@392) /C [ ] /FT/Btn /F 768 /Ff 65536 /H/N /BS ¡¡ /W 0 ¿¿ s) to quieter internetwork areas.
4. Discussion
4.1. \HyColor@XZeroOneThreeFour\pc@goptd@color\pc@hyenc@colorpdfcommentcolor\HyColor@XZeroOneThreeFour\pc@goptd@fontcolor\pc@hyenc@fontcolorpdfcommentcolor\HyColor@XZeroOneThreeFour\pc@goptd@icolor\pc@hyenc@icolorpdfcommentcolor\pdfmark[EB]pdfmark=/ANN,Subtype=/Widget,Raw=/TU (Ellerman bomb\textCR(\pc@goptd@deadline)) /T (tooltip zref@393) /C [ ] /FT/Btn /F 768 /Ff 65536 /H/N /BS ¡¡ /W 0 ¿¿ and \HyColor@XZeroOneThreeFour\pc@goptd@color\pc@hyenc@colorpdfcommentcolor\HyColor@XZeroOneThreeFour\pc@goptd@fontcolor\pc@hyenc@fontcolorpdfcommentcolor\HyColor@XZeroOneThreeFour\pc@goptd@icolor\pc@hyenc@icolorpdfcommentcolor\pdfmark[FAF]pdfmark=/ANN,Subtype=/Widget,Raw=/TU (flaring arch filament\textCR(\pc@goptd@deadline)) /T (tooltip zref@394) /C [ ] /FT/Btn /F 768 /Ff 65536 /H/N /BS ¡¡ /W 0 ¿¿ properties
@goptd@color\pc@hyenc@colorpdfcommentcolor\HyColor@XZeroOneThreeFour\pc@goptd@fontcolor\pc@hyenc@fontcolorpdfcommentcolor\HyColor@XZeroOneThreeFour\pc@goptd@icolor\pc@hyenc@icolorpdfcommentcolor\pdfmark[EB]pdfmark=/ANN,Subtype=/Widget,Raw=/TU (Ellerman bomb\textCR(\pc@goptd@deadline)) /T (tooltip zref@397) /C [ ] /FT/Btn /F 768 /Ff 65536 /H/N /BS ¡¡ /W 0 ¿¿ s and \HyColor@XZeroOneThreeFour\pc@goptd@color\pc@hyenc@colorpdfcommentcolor\HyColor@XZeroOneThreeFour\pc@goptd@fontcolor\pc@hyenc@fontcolorpdfcommentcolor\HyColor@XZeroOneThreeFour\pc@goptd@icolor\pc@hyenc@icolorpdfcommentcolor\pdfmark[FAF]pdfmark=/ANN,Subtype=/Widget,Raw=/TU (flaring arch filament\textCR(\pc@goptd@deadline)) /T (tooltip zref@398) /C [ ] /FT/Btn /F 768 /Ff 65536 /H/N /BS ¡¡ /W 0 ¿¿ s show interesting similarities and differences. Both phenomena occur in emerging active regions and both probably mark reconnection. \HyColor@XZeroOneThreeFour\pc@goptd@color\pc@hyenc@colorpdfcommentcolor\HyColor@XZeroOneThreeFour\pc@goptd@fontcolor\pc@hyenc@fontcolorpdfcommentcolor\HyColor@XZeroOneThreeFour\pc@goptd@icolor\pc@hyenc@icolorpdfcommentcolor\pdfmark[EB]pdfmark=/ANN,Subtype=/Widget,Raw=/TU (Ellerman bomb\textCR(\pc@goptd@deadline)) /T (tooltip zref@399) /C [ ] /FT/Btn /F 768 /Ff 65536 /H/N /BS ¡¡ /W 0 ¿¿ s do this for reconnection of strong near-vertical fluxtubes in the photosphere and appear as upright flames that remain under the fibrilar chromospheric canopy (cf. Paper I, Paper II, further references in Rutten et al. 2013), or even below the upper photosphere when weak (EB-a, b, c). \HyColor@XZeroOneThreeFour\pc@goptd@color\pc@hyenc@colorpdfcommentcolor\HyColor@XZeroOneThreeFour\pc@goptd@fontcolor\pc@hyenc@fontcolorpdfcommentcolor\HyColor@XZeroOneThreeFour\pc@goptd@icolor\pc@hyenc@icolorpdfcommentcolor\pdfmark[FAF]pdfmark=/ANN,Subtype=/Widget,Raw=/TU (flaring arch filament\textCR(\pc@goptd@deadline)) /T (tooltip zref@400) /C [ ] /FT/Btn /F 768 /Ff 65536 /H/N /BS ¡¡ /W 0 ¿¿ s show distinctive fibrilar morphology and are likely reconnection events along the curved fields that define the canopy.
FAF-1 may have started below the canopy (but was then bright in the H core, therefore formally not an \HyColor@XZeroOneThreeFour\pc@goptd@color\pc@hyenc@colorpdfcommentcolor\HyColor@XZeroOneThreeFour\pc@goptd@fontcolor\pc@hyenc@fontcolorpdfcommentcolor\HyColor@XZeroOneThreeFour\pc@goptd@icolor\pc@hyenc@icolorpdfcommentcolor\pdfmark[EB]pdfmark=/ANN,Subtype=/Widget,Raw=/TU (Ellerman bomb\textCR(\pc@goptd@deadline)) /T (tooltip zref@401) /C [ ] /FT/Btn /F 768 /Ff 65536 /H/N /BS ¡¡ /W 0 ¿¿ ) but broke through and even became an H -core microflare at 08:05 UT, two minutes after it showed its widest ultraviolet profiles (orange in Fig. 13).
FAF-2 seemed to reach less high since the blends and line-center dips in all samplings in Fig. 16 suggest undisturbed cooler stationary gas along the line of sight.
Both \HyColor@XZeroOneThreeFour\pc@goptd@color\pc@hyenc@colorpdfcommentcolor\HyColor@XZeroOneThreeFour\pc@goptd@fontcolor\pc@hyenc@fontcolorpdfcommentcolor\HyColor@XZeroOneThreeFour\pc@goptd@icolor\pc@hyenc@icolorpdfcommentcolor\pdfmark[EB]pdfmark=/ANN,Subtype=/Widget,Raw=/TU (Ellerman bomb\textCR(\pc@goptd@deadline)) /T (tooltip zref@402) /C [ ] /FT/Btn /F 768 /Ff 65536 /H/N /BS ¡¡ /W 0 ¿¿ s and \HyColor@XZeroOneThreeFour\pc@goptd@color\pc@hyenc@colorpdfcommentcolor\HyColor@XZeroOneThreeFour\pc@goptd@fontcolor\pc@hyenc@fontcolorpdfcommentcolor\HyColor@XZeroOneThreeFour\pc@goptd@icolor\pc@hyenc@icolorpdfcommentcolor\pdfmark[FAF]pdfmark=/ANN,Subtype=/Widget,Raw=/TU (flaring arch filament\textCR(\pc@goptd@deadline)) /T (tooltip zref@403) /C [ ] /FT/Btn /F 768 /Ff 65536 /H/N /BS ¡¡ /W 0 ¿¿ s show outspoken bi-directional jet signatures. For the \HyColor@XZeroOneThreeFour\pc@goptd@color\pc@hyenc@colorpdfcommentcolor\HyColor@XZeroOneThreeFour\pc@goptd@fontcolor\pc@hyenc@fontcolorpdfcommentcolor\HyColor@XZeroOneThreeFour\pc@goptd@icolor\pc@hyenc@icolorpdfcommentcolor\pdfmark[EB]pdfmark=/ANN,Subtype=/Widget,Raw=/TU (Ellerman bomb\textCR(\pc@goptd@deadline)) /T (tooltip zref@404) /C [ ] /FT/Btn /F 768 /Ff 65536 /H/N /BS ¡¡ /W 0 ¿¿ s this is obvious since the \HyColor@XZeroOneThreeFour\pc@goptd@color\pc@hyenc@colorpdfcommentcolor\HyColor@XZeroOneThreeFour\pc@goptd@fontcolor\pc@hyenc@fontcolorpdfcommentcolor\HyColor@XZeroOneThreeFour\pc@goptd@icolor\pc@hyenc@icolorpdfcommentcolor\pdfmark[IRIS]pdfmark=/ANN,Subtype=/Widget,Raw=/TU (Interface Region Imaging Spectrograph\textCR(\pc@goptd@deadline)) /T (tooltip zref@405) /C [ ] /FT/Btn /F 768 /Ff 65536 /H/N /BS ¡¡ /W 0 ¿¿ spectra of EB-1, the onset of EB-2, and of EB-a, b, and c all show them directly, spatially separated for the first two but mixed up along the line of sight for the other three. The bi-directional nature of the \HyColor@XZeroOneThreeFour\pc@goptd@color\pc@hyenc@colorpdfcommentcolor\HyColor@XZeroOneThreeFour\pc@goptd@fontcolor\pc@hyenc@fontcolorpdfcommentcolor\HyColor@XZeroOneThreeFour\pc@goptd@icolor\pc@hyenc@icolorpdfcommentcolor\pdfmark[FAF]pdfmark=/ANN,Subtype=/Widget,Raw=/TU (flaring arch filament\textCR(\pc@goptd@deadline)) /T (tooltip zref@406) /C [ ] /FT/Btn /F 768 /Ff 65536 /H/N /BS ¡¡ /W 0 ¿¿ s is more complex because they are less aligned with the line of sight (since also seen in the images as rapid filamentary extensions) and cover larger temperature ranges. The striking difference between the violet sampling of FAF-1 and the blue sampling of FAF-2 in the \HyColor@XZeroOneThreeFour\pc@goptd@color\pc@hyenc@colorpdfcommentcolor\HyColor@XZeroOneThreeFour\pc@goptd@fontcolor\pc@hyenc@fontcolorpdfcommentcolor\HyColor@XZeroOneThreeFour\pc@goptd@icolor\pc@hyenc@icolorpdfcommentcolor\pdfmark[IRIS]pdfmark=/ANN,Subtype=/Widget,Raw=/TU (Interface Region Imaging Spectrograph\textCR(\pc@goptd@deadline)) /T (tooltip zref@407) /C [ ] /FT/Btn /F 768 /Ff 65536 /H/N /BS ¡¡ /W 0 ¿¿ profiles may simply be that the first sampled only one of such jets, the other both. The \HyColor@XZeroOneThreeFour\pc@goptd@color\pc@hyenc@colorpdfcommentcolor\HyColor@XZeroOneThreeFour\pc@goptd@fontcolor\pc@hyenc@fontcolorpdfcommentcolor\HyColor@XZeroOneThreeFour\pc@goptd@icolor\pc@hyenc@icolorpdfcommentcolor\pdfmark[IRIS]pdfmark=/ANN,Subtype=/Widget,Raw=/TU (Interface Region Imaging Spectrograph\textCR(\pc@goptd@deadline)) /T (tooltip zref@408) /C [ ] /FT/Btn /F 768 /Ff 65536 /H/N /BS ¡¡ /W 0 ¿¿ profiles from B-1 of Peter et al. (2014) then fit in this picture by showing larger Doppler separation.
4.2. \HyColor@XZeroOneThreeFour\pc@goptd@color\pc@hyenc@colorpdfcommentcolor\HyColor@XZeroOneThreeFour\pc@goptd@fontcolor\pc@hyenc@fontcolorpdfcommentcolor\HyColor@XZeroOneThreeFour\pc@goptd@icolor\pc@hyenc@icolorpdfcommentcolor\pdfmark[EB]pdfmark=/ANN,Subtype=/Widget,Raw=/TU (Ellerman bomb\textCR(\pc@goptd@deadline)) /T (tooltip zref@409) /C [ ] /FT/Btn /F 768 /Ff 65536 /H/N /BS ¡¡ /W 0 ¿¿ temperature estimation
The first conclusion from observing \HyColor@XZeroOneThreeFour\pc@goptd@color\pc@hyenc@colorpdfcommentcolor\HyColor@XZeroOneThreeFour\pc@goptd@fontcolor\pc@hyenc@fontcolorpdfcommentcolor\HyColor@XZeroOneThreeFour\pc@goptd@icolor\pc@hyenc@icolorpdfcommentcolor\pdfmark[EB]pdfmark=/ANN,Subtype=/Widget,Raw=/TU (Ellerman bomb\textCR(\pc@goptd@deadline)) /T (tooltip zref@411) /C [ ] /FT/Btn /F 768 /Ff 65536 /H/N /BS ¡¡ /W 0 ¿¿ s in the \HyColor@XZeroOneThreeFour\pc@goptd@color\pc@hyenc@colorpdfcommentcolor\HyColor@XZeroOneThreeFour\pc@goptd@fontcolor\pc@hyenc@fontcolorpdfcommentcolor\HyColor@XZeroOneThreeFour\pc@goptd@icolor\pc@hyenc@icolorpdfcommentcolor\pdfmark[IRIS]pdfmark=/ANN,Subtype=/Widget,Raw=/TU (Interface Region Imaging Spectrograph\textCR(\pc@goptd@deadline)) /T (tooltip zref@412) /C [ ] /FT/Btn /F 768 /Ff 65536 /H/N /BS ¡¡ /W 0 ¿¿ lines is that \HyColor@XZeroOneThreeFour\pc@goptd@color\pc@hyenc@colorpdfcommentcolor\HyColor@XZeroOneThreeFour\pc@goptd@fontcolor\pc@hyenc@fontcolorpdfcommentcolor\HyColor@XZeroOneThreeFour\pc@goptd@icolor\pc@hyenc@icolorpdfcommentcolor\pdfmark[EB]pdfmark=/ANN,Subtype=/Widget,Raw=/TU (Ellerman bomb\textCR(\pc@goptd@deadline)) /T (tooltip zref@413) /C [ ] /FT/Btn /F 768 /Ff 65536 /H/N /BS ¡¡ /W 0 ¿¿ s get very hot, especially in their tops. Such apparent heating to very high temperature in \HyColor@XZeroOneThreeFour\pc@goptd@color\pc@hyenc@colorpdfcommentcolor\HyColor@XZeroOneThreeFour\pc@goptd@fontcolor\pc@hyenc@fontcolorpdfcommentcolor\HyColor@XZeroOneThreeFour\pc@goptd@icolor\pc@hyenc@icolorpdfcommentcolor\pdfmark[IB]pdfmark=/ANN,Subtype=/Widget,Raw=/TU (IRIS bomb\textCR(\pc@goptd@deadline)) /T (tooltip zref@414) /C [ ] /FT/Btn /F 768 /Ff 65536 /H/N /BS ¡¡ /W 0 ¿¿ s was the main message of Peter et al. (2014) who wondered whether \HyColor@XZeroOneThreeFour\pc@goptd@color\pc@hyenc@colorpdfcommentcolor\HyColor@XZeroOneThreeFour\pc@goptd@fontcolor\pc@hyenc@fontcolorpdfcommentcolor\HyColor@XZeroOneThreeFour\pc@goptd@icolor\pc@hyenc@icolorpdfcommentcolor\pdfmark[IB]pdfmark=/ANN,Subtype=/Widget,Raw=/TU (IRIS bomb\textCR(\pc@goptd@deadline)) /T (tooltip zref@415) /C [ ] /FT/Btn /F 768 /Ff 65536 /H/N /BS ¡¡ /W 0 ¿¿ s are \HyColor@XZeroOneThreeFour\pc@goptd@color\pc@hyenc@colorpdfcommentcolor\HyColor@XZeroOneThreeFour\pc@goptd@fontcolor\pc@hyenc@fontcolorpdfcommentcolor\HyColor@XZeroOneThreeFour\pc@goptd@icolor\pc@hyenc@icolorpdfcommentcolor\pdfmark[EB]pdfmark=/ANN,Subtype=/Widget,Raw=/TU (Ellerman bomb\textCR(\pc@goptd@deadline)) /T (tooltip zref@416) /C [ ] /FT/Btn /F 768 /Ff 65536 /H/N /BS ¡¡ /W 0 ¿¿ s or not. Our results show that both \HyColor@XZeroOneThreeFour\pc@goptd@color\pc@hyenc@colorpdfcommentcolor\HyColor@XZeroOneThreeFour\pc@goptd@fontcolor\pc@hyenc@fontcolorpdfcommentcolor\HyColor@XZeroOneThreeFour\pc@goptd@icolor\pc@hyenc@icolorpdfcommentcolor\pdfmark[EB]pdfmark=/ANN,Subtype=/Widget,Raw=/TU (Ellerman bomb\textCR(\pc@goptd@deadline)) /T (tooltip zref@417) /C [ ] /FT/Btn /F 768 /Ff 65536 /H/N /BS ¡¡ /W 0 ¿¿ s and \HyColor@XZeroOneThreeFour\pc@goptd@color\pc@hyenc@colorpdfcommentcolor\HyColor@XZeroOneThreeFour\pc@goptd@fontcolor\pc@hyenc@fontcolorpdfcommentcolor\HyColor@XZeroOneThreeFour\pc@goptd@icolor\pc@hyenc@icolorpdfcommentcolor\pdfmark[FAF]pdfmark=/ANN,Subtype=/Widget,Raw=/TU (flaring arch filament\textCR(\pc@goptd@deadline)) /T (tooltip zref@418) /C [ ] /FT/Btn /F 768 /Ff 65536 /H/N /BS ¡¡ /W 0 ¿¿ s can produce \HyColor@XZeroOneThreeFour\pc@goptd@color\pc@hyenc@colorpdfcommentcolor\HyColor@XZeroOneThreeFour\pc@goptd@fontcolor\pc@hyenc@fontcolorpdfcommentcolor\HyColor@XZeroOneThreeFour\pc@goptd@icolor\pc@hyenc@icolorpdfcommentcolor\pdfmark[IB]pdfmark=/ANN,Subtype=/Widget,Raw=/TU (IRIS bomb\textCR(\pc@goptd@deadline)) /T (tooltip zref@419) /C [ ] /FT/Btn /F 768 /Ff 65536 /H/N /BS ¡¡ /W 0 ¿¿ signatures that suggest exceedingly hot events.
How hot precisely? Peter et al. (2014) cited the coronal-equilibrium presence temperature of 80,000 K for Si iv, but remarked that the actual ion distribution may be closer to \HyColor@XZeroOneThreeFour\pc@goptd@color\pc@hyenc@colorpdfcommentcolor\HyColor@XZeroOneThreeFour\pc@goptd@fontcolor\pc@hyenc@fontcolorpdfcommentcolor\HyColor@XZeroOneThreeFour\pc@goptd@icolor\pc@hyenc@icolorpdfcommentcolor\pdfmark[LTE]pdfmark=/ANN,Subtype=/Widget,Raw=/TU (local thermodynamic equilibrium\textCR(\pc@goptd@deadline)) /T (tooltip zref@420) /C [ ] /FT/Btn /F 768 /Ff 65536 /H/N /BS ¡¡ /W 0 ¿¿ and peak at lower temperature.
Another way to estimate formation temperature is profile matching. In the idealized case of a convolution of thermal broadening with Gaussian non-thermal broadening and instrumental broadening the full-width at half maximum (FWHM) of the emergent profile from an optically thin homogeneous feature is with the atomic mass, the non-thermal broadening, and the instrumental broadening. Figure 17 shows the possible combinations of thermal and non-thermal broadening that reproduce our observed halfwidth values. These range so wide that without precise knowledge of the non-thermal contribution this approach fails. In addition, our \HyColor@XZeroOneThreeFour\pc@goptd@color\pc@hyenc@colorpdfcommentcolor\HyColor@XZeroOneThreeFour\pc@goptd@fontcolor\pc@hyenc@fontcolorpdfcommentcolor\HyColor@XZeroOneThreeFour\pc@goptd@icolor\pc@hyenc@icolorpdfcommentcolor\pdfmark[EB]pdfmark=/ANN,Subtype=/Widget,Raw=/TU (Ellerman bomb\textCR(\pc@goptd@deadline)) /T (tooltip zref@421) /C [ ] /FT/Btn /F 768 /Ff 65536 /H/N /BS ¡¡ /W 0 ¿¿ s are not truly thin nor homogeneous.

A better way to establish \HyColor@XZeroOneThreeFour\pc@goptd@color\pc@hyenc@colorpdfcommentcolor\HyColor@XZeroOneThreeFour\pc@goptd@fontcolor\pc@hyenc@fontcolorpdfcommentcolor\HyColor@XZeroOneThreeFour\pc@goptd@icolor\pc@hyenc@icolorpdfcommentcolor\pdfmark[EB]pdfmark=/ANN,Subtype=/Widget,Raw=/TU (Ellerman bomb\textCR(\pc@goptd@deadline)) /T (tooltip zref@422) /C [ ] /FT/Btn /F 768 /Ff 65536 /H/N /BS ¡¡ /W 0 ¿¿ temperatures is profile matching with more sophisticated modeling. Modeling of H profiles from \HyColor@XZeroOneThreeFour\pc@goptd@color\pc@hyenc@colorpdfcommentcolor\HyColor@XZeroOneThreeFour\pc@goptd@fontcolor\pc@hyenc@fontcolorpdfcommentcolor\HyColor@XZeroOneThreeFour\pc@goptd@icolor\pc@hyenc@icolorpdfcommentcolor\pdfmark[EB]pdfmark=/ANN,Subtype=/Widget,Raw=/TU (Ellerman bomb\textCR(\pc@goptd@deadline)) /T (tooltip zref@423) /C [ ] /FT/Btn /F 768 /Ff 65536 /H/N /BS ¡¡ /W 0 ¿¿ s has been attempted by Kitai (1983), Berlicki et al. (2010), Bello González et al. (2013), and Berlicki & Heinzel (2014). They all applied ad-hoc perturbations of a static standard model to reproduce observed H moustaches. Most defined the perturbation to not extend high, in order to avoid non-observed brightening of the H core, but Hong et al. (2014) recognized that the core is actually formed in an overlying fibrilar canopy and should not be modeled as an \HyColor@XZeroOneThreeFour\pc@goptd@color\pc@hyenc@colorpdfcommentcolor\HyColor@XZeroOneThreeFour\pc@goptd@fontcolor\pc@hyenc@fontcolorpdfcommentcolor\HyColor@XZeroOneThreeFour\pc@goptd@icolor\pc@hyenc@icolorpdfcommentcolor\pdfmark[EB]pdfmark=/ANN,Subtype=/Widget,Raw=/TU (Ellerman bomb\textCR(\pc@goptd@deadline)) /T (tooltip zref@424) /C [ ] /FT/Btn /F 768 /Ff 65536 /H/N /BS ¡¡ /W 0 ¿¿ property. They applied a two-cloud fitting model, one for the \HyColor@XZeroOneThreeFour\pc@goptd@color\pc@hyenc@colorpdfcommentcolor\HyColor@XZeroOneThreeFour\pc@goptd@fontcolor\pc@hyenc@fontcolorpdfcommentcolor\HyColor@XZeroOneThreeFour\pc@goptd@icolor\pc@hyenc@icolorpdfcommentcolor\pdfmark[EB]pdfmark=/ANN,Subtype=/Widget,Raw=/TU (Ellerman bomb\textCR(\pc@goptd@deadline)) /T (tooltip zref@425) /C [ ] /FT/Btn /F 768 /Ff 65536 /H/N /BS ¡¡ /W 0 ¿¿ , the other for the canopy. These fitting exercises all claim that \HyColor@XZeroOneThreeFour\pc@goptd@color\pc@hyenc@colorpdfcommentcolor\HyColor@XZeroOneThreeFour\pc@goptd@fontcolor\pc@hyenc@fontcolorpdfcommentcolor\HyColor@XZeroOneThreeFour\pc@goptd@icolor\pc@hyenc@icolorpdfcommentcolor\pdfmark[EB]pdfmark=/ANN,Subtype=/Widget,Raw=/TU (Ellerman bomb\textCR(\pc@goptd@deadline)) /T (tooltip zref@426) /C [ ] /FT/Btn /F 768 /Ff 65536 /H/N /BS ¡¡ /W 0 ¿¿ s represent temperature enhancements of the low standard-model chromosphere by at most a few thousand Kelvin, usually less. It seems highly unlikely that Si iv lines as displayed here can be obtained from any of them.
In addition to these trial-and-error fits, numerical \HyColor@XZeroOneThreeFour\pc@goptd@color\pc@hyenc@colorpdfcommentcolor\HyColor@XZeroOneThreeFour\pc@goptd@fontcolor\pc@hyenc@fontcolorpdfcommentcolor\HyColor@XZeroOneThreeFour\pc@goptd@icolor\pc@hyenc@icolorpdfcommentcolor\pdfmark[EB]pdfmark=/ANN,Subtype=/Widget,Raw=/TU (Ellerman bomb\textCR(\pc@goptd@deadline)) /T (tooltip zref@427) /C [ ] /FT/Btn /F 768 /Ff 65536 /H/N /BS ¡¡ /W 0 ¿¿ simulations have been reported by Chen et al. (2001), Isobe et al. (2007) expanding on the serpentine emergence simulation of Nozawa et al. (1992), Archontis & Hood (2009), and most recently by Nelson et al. (2013b).
The most extensive simulation is the one by Archontis & Hood (2009) who specifically targeted \HyColor@XZeroOneThreeFour\pc@goptd@color\pc@hyenc@colorpdfcommentcolor\HyColor@XZeroOneThreeFour\pc@goptd@fontcolor\pc@hyenc@fontcolorpdfcommentcolor\HyColor@XZeroOneThreeFour\pc@goptd@icolor\pc@hyenc@icolorpdfcommentcolor\pdfmark[EB]pdfmark=/ANN,Subtype=/Widget,Raw=/TU (Ellerman bomb\textCR(\pc@goptd@deadline)) /T (tooltip zref@428) /C [ ] /FT/Btn /F 768 /Ff 65536 /H/N /BS ¡¡ /W 0 ¿¿ s by setting up strong-field U-loop emergence. It also delivered temperature enhancements of order 1000 K. However, there was no proper accounting for radiation and no spectral synthesis of e.g., H .
The most recent simulation, by Nelson et al. (2013b), did not set up an active-region emergence event but quiet-Sun magnetoconvection. If their reconnection event was an \HyColor@XZeroOneThreeFour\pc@goptd@color\pc@hyenc@colorpdfcommentcolor\HyColor@XZeroOneThreeFour\pc@goptd@fontcolor\pc@hyenc@fontcolorpdfcommentcolor\HyColor@XZeroOneThreeFour\pc@goptd@icolor\pc@hyenc@icolorpdfcommentcolor\pdfmark[EB]pdfmark=/ANN,Subtype=/Widget,Raw=/TU (Ellerman bomb\textCR(\pc@goptd@deadline)) /T (tooltip zref@429) /C [ ] /FT/Btn /F 768 /Ff 65536 /H/N /BS ¡¡ /W 0 ¿¿ then \HyColor@XZeroOneThreeFour\pc@goptd@color\pc@hyenc@colorpdfcommentcolor\HyColor@XZeroOneThreeFour\pc@goptd@fontcolor\pc@hyenc@fontcolorpdfcommentcolor\HyColor@XZeroOneThreeFour\pc@goptd@icolor\pc@hyenc@icolorpdfcommentcolor\pdfmark[EB]pdfmark=/ANN,Subtype=/Widget,Raw=/TU (Ellerman bomb\textCR(\pc@goptd@deadline)) /T (tooltip zref@430) /C [ ] /FT/Btn /F 768 /Ff 65536 /H/N /BS ¡¡ /W 0 ¿¿ s should appear all over the Sun, contrary to observation. The continuum brightening, core brightening (“line gap”) of Fe i 6303 Å and H inner-wing brightening in their synthesized spectra (at top-down viewing, not slanted) suggests that they simulated a pseudo-EB. In any case, the heating was less than 1000 K.
The conclusion must therefore be that the fact that \HyColor@XZeroOneThreeFour\pc@goptd@color\pc@hyenc@colorpdfcommentcolor\HyColor@XZeroOneThreeFour\pc@goptd@fontcolor\pc@hyenc@fontcolorpdfcommentcolor\HyColor@XZeroOneThreeFour\pc@goptd@icolor\pc@hyenc@icolorpdfcommentcolor\pdfmark[EB]pdfmark=/ANN,Subtype=/Widget,Raw=/TU (Ellerman bomb\textCR(\pc@goptd@deadline)) /T (tooltip zref@431) /C [ ] /FT/Btn /F 768 /Ff 65536 /H/N /BS ¡¡ /W 0 ¿¿ s show up in the \HyColor@XZeroOneThreeFour\pc@goptd@color\pc@hyenc@colorpdfcommentcolor\HyColor@XZeroOneThreeFour\pc@goptd@fontcolor\pc@hyenc@fontcolorpdfcommentcolor\HyColor@XZeroOneThreeFour\pc@goptd@icolor\pc@hyenc@icolorpdfcommentcolor\pdfmark[IRIS]pdfmark=/ANN,Subtype=/Widget,Raw=/TU (Interface Region Imaging Spectrograph\textCR(\pc@goptd@deadline)) /T (tooltip zref@432) /C [ ] /FT/Btn /F 768 /Ff 65536 /H/N /BS ¡¡ /W 0 ¿¿ lines contradicts all \HyColor@XZeroOneThreeFour\pc@goptd@color\pc@hyenc@colorpdfcommentcolor\HyColor@XZeroOneThreeFour\pc@goptd@fontcolor\pc@hyenc@fontcolorpdfcommentcolor\HyColor@XZeroOneThreeFour\pc@goptd@icolor\pc@hyenc@icolorpdfcommentcolor\pdfmark[EB]pdfmark=/ANN,Subtype=/Widget,Raw=/TU (Ellerman bomb\textCR(\pc@goptd@deadline)) /T (tooltip zref@433) /C [ ] /FT/Btn /F 768 /Ff 65536 /H/N /BS ¡¡ /W 0 ¿¿ modeling efforts so far.
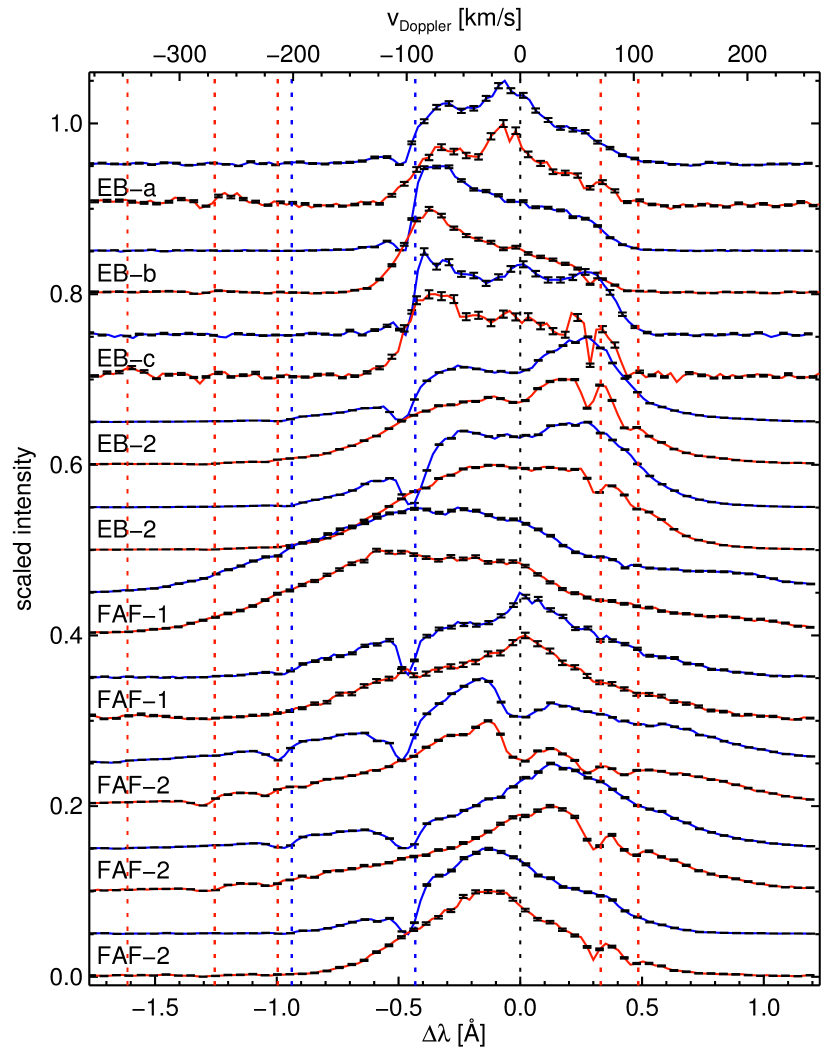
4.3. Fine structure in \HyColor@XZeroOneThreeFour\pc@goptd@color\pc@hyenc@colorpdfcommentcolor\HyColor@XZeroOneThreeFour\pc@goptd@fontcolor\pc@hyenc@fontcolorpdfcommentcolor\HyColor@XZeroOneThreeFour\pc@goptd@icolor\pc@hyenc@icolorpdfcommentcolor\pdfmark[IRIS]pdfmark=/ANN,Subtype=/Widget,Raw=/TU (Interface Region Imaging Spectrograph\textCR(\pc@goptd@deadline)) /T (tooltip zref@434) /C [ ] /FT/Btn /F 768 /Ff 65536 /H/N /BS ¡¡ /W 0 ¿¿ profiles
There is fine-structure raggedness in the green and orange EB-2 profiles in Fig. 8, the EB-a, b and c profiles in Fig. 10, the orange and red profiles of FAF-1 in Fig. 13, and the FAF-2 profiles in Fig. 16.
It can simply be measurement noise, especially at low count values (e.g., in the continua and overlapping wing part of Mg ii and k in Fig. 4), but such noise contribution is smaller in bright line cores. The largest counts in the Si iv lines were reached for EB-2 (Fig. 8), but also these cores show ragged fine structure.
If the raggedness is not noise then it is either due to blends, which when present should re-occur at the same wavelength in different spatio-temporal samplings of a given line, or to profile mapping of fine structure in the event along the line of sight. In the latter case and in optically thick line formation, similar small-scale profile structure should appear at comparable optical depth sampling in different lines per pixel sampling, i.e., slightly further out from line center in the stronger component of a doublet. In optically thin line formation similar profile structure should occur at about the same Dopplershift in different lines per sampling.
Figure 18 details this choice for the two Si iv lines. In all cases their height ratio suggests optically thin or thinnish line formation, so that the choice to explain raggedness is between noise, blends, and Doppler mapping of fine structure.
Most larger narrow dips re-occur at the same wavelength in different samplings of the same line (either blue or red) and are therefore blends. The major ones are identified by dashed lines with corresponding line colors. Most of these are blueshifted over about 10 km s-1. There are more blends, especially in the FAF-2 profiles as noted above.
The EB-a and EB-c profiles in Fig. 18 show the largest core raggedness, but also the largest raggedness in the adjacent continua and the largest noise (error bars in Fig. 18) because these cores reach only about 200 and 100 counts, respectively (Fig. 10). Indeed, the raggedness appears larger for the weaker red profiles and smaller in the brighter profiles from EB-b.
Finally, the somewhat larger-scale deviations from Gaussian profiles in the Si iv cores in Fig. 18 often show good similarity between the red and blue pair of profiles per sample. In view of the apparent optically-thin (or thinnish) line formation of the Si iv lines we attribute such common fine structure to Dopplershift mapping of features along the line of sight.
For the \HyColor@XZeroOneThreeFour\pc@goptd@color\pc@hyenc@colorpdfcommentcolor\HyColor@XZeroOneThreeFour\pc@goptd@fontcolor\pc@hyenc@fontcolorpdfcommentcolor\HyColor@XZeroOneThreeFour\pc@goptd@icolor\pc@hyenc@icolorpdfcommentcolor\pdfmark[EB]pdfmark=/ANN,Subtype=/Widget,Raw=/TU (Ellerman bomb\textCR(\pc@goptd@deadline)) /T (tooltip zref@436) /C [ ] /FT/Btn /F 768 /Ff 65536 /H/N /BS ¡¡ /W 0 ¿¿ s the presence of Dopplershift fine-structure fits the appearance of \HyColor@XZeroOneThreeFour\pc@goptd@color\pc@hyenc@colorpdfcommentcolor\HyColor@XZeroOneThreeFour\pc@goptd@fontcolor\pc@hyenc@fontcolorpdfcommentcolor\HyColor@XZeroOneThreeFour\pc@goptd@icolor\pc@hyenc@icolorpdfcommentcolor\pdfmark[EB]pdfmark=/ANN,Subtype=/Widget,Raw=/TU (Ellerman bomb\textCR(\pc@goptd@deadline)) /T (tooltip zref@437) /C [ ] /FT/Btn /F 768 /Ff 65536 /H/N /BS ¡¡ /W 0 ¿¿ s in our \HyColor@XZeroOneThreeFour\pc@goptd@color\pc@hyenc@colorpdfcommentcolor\HyColor@XZeroOneThreeFour\pc@goptd@fontcolor\pc@hyenc@fontcolorpdfcommentcolor\HyColor@XZeroOneThreeFour\pc@goptd@icolor\pc@hyenc@icolorpdfcommentcolor\pdfmark[SST]pdfmark=/ANN,Subtype=/Widget,Raw=/TU (Swedish 1-m Solar Telescope\textCR(\pc@goptd@deadline)) /T (tooltip zref@438) /C [ ] /FT/Btn /F 768 /Ff 65536 /H/N /BS ¡¡ /W 0 ¿¿ H movies as rapidly flickering flames and their bi-directional jet signatures. We surmise that rapid successive, intermittent reconnection of newly arriving opposite-polarity concentrations with varying flux content causes fast variations that eventually end up as fine structure in the resulting hot events.
For the \HyColor@XZeroOneThreeFour\pc@goptd@color\pc@hyenc@colorpdfcommentcolor\HyColor@XZeroOneThreeFour\pc@goptd@fontcolor\pc@hyenc@fontcolorpdfcommentcolor\HyColor@XZeroOneThreeFour\pc@goptd@icolor\pc@hyenc@icolorpdfcommentcolor\pdfmark[FAF]pdfmark=/ANN,Subtype=/Widget,Raw=/TU (flaring arch filament\textCR(\pc@goptd@deadline)) /T (tooltip zref@439) /C [ ] /FT/Btn /F 768 /Ff 65536 /H/N /BS ¡¡ /W 0 ¿¿ s the wide extent of the profile tails agree with the apparent observed filament extension speeds of 200 km s-1. The picture of thin fast-rising heating events also fits the morphology of the apparent lift-off of thin arcs and resulting bright arches in \HyColor@XZeroOneThreeFour\pc@goptd@color\pc@hyenc@colorpdfcommentcolor\HyColor@XZeroOneThreeFour\pc@goptd@fontcolor\pc@hyenc@fontcolorpdfcommentcolor\HyColor@XZeroOneThreeFour\pc@goptd@icolor\pc@hyenc@icolorpdfcommentcolor\pdfmark[AIA]pdfmark=/ANN,Subtype=/Widget,Raw=/TU (Atmospheric Imaging Assembly\textCR(\pc@goptd@deadline)) /T (tooltip zref@440) /C [ ] /FT/Btn /F 768 /Ff 65536 /H/N /BS ¡¡ /W 0 ¿¿ 304, 171 and 193 Å, in particular after FAF-1.
4.4. Nature of the hot events
EB-2 and the two \HyColor@XZeroOneThreeFour\pc@goptd@color\pc@hyenc@colorpdfcommentcolor\HyColor@XZeroOneThreeFour\pc@goptd@fontcolor\pc@hyenc@fontcolorpdfcommentcolor\HyColor@XZeroOneThreeFour\pc@goptd@icolor\pc@hyenc@icolorpdfcommentcolor\pdfmark[FAF]pdfmark=/ANN,Subtype=/Widget,Raw=/TU (flaring arch filament\textCR(\pc@goptd@deadline)) /T (tooltip zref@441) /C [ ] /FT/Btn /F 768 /Ff 65536 /H/N /BS ¡¡ /W 0 ¿¿ s produced spectra with \HyColor@XZeroOneThreeFour\pc@goptd@color\pc@hyenc@colorpdfcommentcolor\HyColor@XZeroOneThreeFour\pc@goptd@fontcolor\pc@hyenc@fontcolorpdfcommentcolor\HyColor@XZeroOneThreeFour\pc@goptd@icolor\pc@hyenc@icolorpdfcommentcolor\pdfmark[IB]pdfmark=/ANN,Subtype=/Widget,Raw=/TU (IRIS bomb\textCR(\pc@goptd@deadline)) /T (tooltip zref@442) /C [ ] /FT/Btn /F 768 /Ff 65536 /H/N /BS ¡¡ /W 0 ¿¿ hot-event signatures. EB-1 may have done so too, but its aftermath was not sampled by the \HyColor@XZeroOneThreeFour\pc@goptd@color\pc@hyenc@colorpdfcommentcolor\HyColor@XZeroOneThreeFour\pc@goptd@fontcolor\pc@hyenc@fontcolorpdfcommentcolor\HyColor@XZeroOneThreeFour\pc@goptd@icolor\pc@hyenc@icolorpdfcommentcolor\pdfmark[IRIS]pdfmark=/ANN,Subtype=/Widget,Raw=/TU (Interface Region Imaging Spectrograph\textCR(\pc@goptd@deadline)) /T (tooltip zref@443) /C [ ] /FT/Btn /F 768 /Ff 65536 /H/N /BS ¡¡ /W 0 ¿¿ slit. The weaker EB-a, b and c did not. The upshot is that strong \HyColor@XZeroOneThreeFour\pc@goptd@color\pc@hyenc@colorpdfcommentcolor\HyColor@XZeroOneThreeFour\pc@goptd@fontcolor\pc@hyenc@fontcolorpdfcommentcolor\HyColor@XZeroOneThreeFour\pc@goptd@icolor\pc@hyenc@icolorpdfcommentcolor\pdfmark[EB]pdfmark=/ANN,Subtype=/Widget,Raw=/TU (Ellerman bomb\textCR(\pc@goptd@deadline)) /T (tooltip zref@444) /C [ ] /FT/Btn /F 768 /Ff 65536 /H/N /BS ¡¡ /W 0 ¿¿ s can do so. Both \HyColor@XZeroOneThreeFour\pc@goptd@color\pc@hyenc@colorpdfcommentcolor\HyColor@XZeroOneThreeFour\pc@goptd@fontcolor\pc@hyenc@fontcolorpdfcommentcolor\HyColor@XZeroOneThreeFour\pc@goptd@icolor\pc@hyenc@icolorpdfcommentcolor\pdfmark[FAF]pdfmark=/ANN,Subtype=/Widget,Raw=/TU (flaring arch filament\textCR(\pc@goptd@deadline)) /T (tooltip zref@445) /C [ ] /FT/Btn /F 768 /Ff 65536 /H/N /BS ¡¡ /W 0 ¿¿ s certainly did.
The production of a hot event by upward progressing reconnection is not surprising. When in an \HyColor@XZeroOneThreeFour\pc@goptd@color\pc@hyenc@colorpdfcommentcolor\HyColor@XZeroOneThreeFour\pc@goptd@fontcolor\pc@hyenc@fontcolorpdfcommentcolor\HyColor@XZeroOneThreeFour\pc@goptd@icolor\pc@hyenc@icolorpdfcommentcolor\pdfmark[EB]pdfmark=/ANN,Subtype=/Widget,Raw=/TU (Ellerman bomb\textCR(\pc@goptd@deadline)) /T (tooltip zref@446) /C [ ] /FT/Btn /F 768 /Ff 65536 /H/N /BS ¡¡ /W 0 ¿¿ two photospheric fluxtubes cancel against each other by reconnection, one may expect local temperature increase below a factor two because such fluxtubes tend to obey magnetostatic equipartition with their surroundings. This is indeed seen in the numerical \HyColor@XZeroOneThreeFour\pc@goptd@color\pc@hyenc@colorpdfcommentcolor\HyColor@XZeroOneThreeFour\pc@goptd@fontcolor\pc@hyenc@fontcolorpdfcommentcolor\HyColor@XZeroOneThreeFour\pc@goptd@icolor\pc@hyenc@icolorpdfcommentcolor\pdfmark[MHD]pdfmark=/ANN,Subtype=/Widget,Raw=/TU (magnetohydrodynamics\textCR(\pc@goptd@deadline)) /T (tooltip zref@447) /C [ ] /FT/Btn /F 768 /Ff 65536 /H/N /BS ¡¡ /W 0 ¿¿ simulation of Archontis & Hood (2009). However, if the reconnection site then proceeds upward, the heating ratio increases because the magnetic energy diminishes less than the gas energy due to larger scale height. Much larger temperature increase may there be expected. In addition, the jet kicks are likely to cause Alfvénic wave generation and dissipation. Therefore, the observational indication that \HyColor@XZeroOneThreeFour\pc@goptd@color\pc@hyenc@colorpdfcommentcolor\HyColor@XZeroOneThreeFour\pc@goptd@fontcolor\pc@hyenc@fontcolorpdfcommentcolor\HyColor@XZeroOneThreeFour\pc@goptd@icolor\pc@hyenc@icolorpdfcommentcolor\pdfmark[FAF]pdfmark=/ANN,Subtype=/Widget,Raw=/TU (flaring arch filament\textCR(\pc@goptd@deadline)) /T (tooltip zref@448) /C [ ] /FT/Btn /F 768 /Ff 65536 /H/N /BS ¡¡ /W 0 ¿¿ reconnection occurs higher up than \HyColor@XZeroOneThreeFour\pc@goptd@color\pc@hyenc@colorpdfcommentcolor\HyColor@XZeroOneThreeFour\pc@goptd@fontcolor\pc@hyenc@fontcolorpdfcommentcolor\HyColor@XZeroOneThreeFour\pc@goptd@icolor\pc@hyenc@icolorpdfcommentcolor\pdfmark[EB]pdfmark=/ANN,Subtype=/Widget,Raw=/TU (Ellerman bomb\textCR(\pc@goptd@deadline)) /T (tooltip zref@449) /C [ ] /FT/Btn /F 768 /Ff 65536 /H/N /BS ¡¡ /W 0 ¿¿ reconnection may explain why \HyColor@XZeroOneThreeFour\pc@goptd@color\pc@hyenc@colorpdfcommentcolor\HyColor@XZeroOneThreeFour\pc@goptd@fontcolor\pc@hyenc@fontcolorpdfcommentcolor\HyColor@XZeroOneThreeFour\pc@goptd@icolor\pc@hyenc@icolorpdfcommentcolor\pdfmark[FAF]pdfmark=/ANN,Subtype=/Widget,Raw=/TU (flaring arch filament\textCR(\pc@goptd@deadline)) /T (tooltip zref@450) /C [ ] /FT/Btn /F 768 /Ff 65536 /H/N /BS ¡¡ /W 0 ¿¿ s produce larger \HyColor@XZeroOneThreeFour\pc@goptd@color\pc@hyenc@colorpdfcommentcolor\HyColor@XZeroOneThreeFour\pc@goptd@fontcolor\pc@hyenc@fontcolorpdfcommentcolor\HyColor@XZeroOneThreeFour\pc@goptd@icolor\pc@hyenc@icolorpdfcommentcolor\pdfmark[IB]pdfmark=/ANN,Subtype=/Widget,Raw=/TU (IRIS bomb\textCR(\pc@goptd@deadline)) /T (tooltip zref@451) /C [ ] /FT/Btn /F 768 /Ff 65536 /H/N /BS ¡¡ /W 0 ¿¿ s and also million-Kelvin arches as FAF-1 did.
Various scenarios come to mind to produce hot gas with spectral blend superimposing by cooler and relatively stationary gas. The first is that this gas is simply undisturbed upper-photosphere or chromospheric canopy gas along the line of sight. We suggest that this is the case for the Mn i blends in the Mg ii and k wings for the lines of sight to the feet of EB-1 and EB-2, and may likewise signify small event heights for EB-a, EB-b, and EB-c. Such blends were not present in FAF-1 which had the largest higher-atmosphere response of all our events, but for FAF-2 they were prominently present in the blue sampling in Fig. 16, superimposed on the widest of all our ultraviolet profiles, and still in the red sampling 17 min later. Assuming that these were from undisturbed “normal” gas along the line of sight implies that even FAF-2, which also showed filamentary extensions and \HyColor@XZeroOneThreeFour\pc@goptd@color\pc@hyenc@colorpdfcommentcolor\HyColor@XZeroOneThreeFour\pc@goptd@fontcolor\pc@hyenc@fontcolorpdfcommentcolor\HyColor@XZeroOneThreeFour\pc@goptd@icolor\pc@hyenc@icolorpdfcommentcolor\pdfmark[AIA]pdfmark=/ANN,Subtype=/Widget,Raw=/TU (Atmospheric Imaging Assembly\textCR(\pc@goptd@deadline)) /T (tooltip zref@452) /C [ ] /FT/Btn /F 768 /Ff 65536 /H/N /BS ¡¡ /W 0 ¿¿ hot-diagnostic brightening, did not reach very high in its \HyColor@XZeroOneThreeFour\pc@goptd@color\pc@hyenc@colorpdfcommentcolor\HyColor@XZeroOneThreeFour\pc@goptd@fontcolor\pc@hyenc@fontcolorpdfcommentcolor\HyColor@XZeroOneThreeFour\pc@goptd@icolor\pc@hyenc@icolorpdfcommentcolor\pdfmark[IRIS]pdfmark=/ANN,Subtype=/Widget,Raw=/TU (Interface Region Imaging Spectrograph\textCR(\pc@goptd@deadline)) /T (tooltip zref@453) /C [ ] /FT/Btn /F 768 /Ff 65536 /H/N /BS ¡¡ /W 0 ¿¿ samplings.
We similarly speculate that the Fe ii and Ni ii blends on the Si iv and C ii lines, which typically show blueshifts up to about 10 km s-1, as also found by Peter et al. (2014), sample adjacent gas harboring upward propagating shocks as those in internetwork regions (e.g., Carlsson & Stein 1997; Leenaarts et al. 2007; Vecchio et al. 2009) and in dynamic fibrils near network and plage (e.g., Hansteen et al. 2006; De Pontieu et al. 2007; Heggland et al. 2007; Langangen et al. 2008).
Alternatively, an EB-like start-up \HyColor@XZeroOneThreeFour\pc@goptd@color\pc@hyenc@colorpdfcommentcolor\HyColor@XZeroOneThreeFour\pc@goptd@fontcolor\pc@hyenc@fontcolorpdfcommentcolor\HyColor@XZeroOneThreeFour\pc@goptd@icolor\pc@hyenc@icolorpdfcommentcolor\pdfmark[FAF]pdfmark=/ANN,Subtype=/Widget,Raw=/TU (flaring arch filament\textCR(\pc@goptd@deadline)) /T (tooltip zref@454) /C [ ] /FT/Btn /F 768 /Ff 65536 /H/N /BS ¡¡ /W 0 ¿¿ may kick cool photospheric gas up to large height where it can cause line-center dips and absorption blends, or these may originate in a post-bomb cooling cloud. However, such scenarios seem unlikely in view of the lack of large Dopplershifts in the blend lines and central dips.
4.5. \HyColor@XZeroOneThreeFour\pc@goptd@color\pc@hyenc@colorpdfcommentcolor\HyColor@XZeroOneThreeFour\pc@goptd@fontcolor\pc@hyenc@fontcolorpdfcommentcolor\HyColor@XZeroOneThreeFour\pc@goptd@icolor\pc@hyenc@icolorpdfcommentcolor\pdfmark[EB]pdfmark=/ANN,Subtype=/Widget,Raw=/TU (Ellerman bomb\textCR(\pc@goptd@deadline)) /T (tooltip zref@455) /C [ ] /FT/Btn /F 768 /Ff 65536 /H/N /BS ¡¡ /W 0 ¿¿ and \HyColor@XZeroOneThreeFour\pc@goptd@color\pc@hyenc@colorpdfcommentcolor\HyColor@XZeroOneThreeFour\pc@goptd@fontcolor\pc@hyenc@fontcolorpdfcommentcolor\HyColor@XZeroOneThreeFour\pc@goptd@icolor\pc@hyenc@icolorpdfcommentcolor\pdfmark[FAF]pdfmark=/ANN,Subtype=/Widget,Raw=/TU (flaring arch filament\textCR(\pc@goptd@deadline)) /T (tooltip zref@456) /C [ ] /FT/Btn /F 768 /Ff 65536 /H/N /BS ¡¡ /W 0 ¿¿ visibility in Mg ii 2798 Å
In our \HyColor@XZeroOneThreeFour\pc@goptd@color\pc@hyenc@colorpdfcommentcolor\HyColor@XZeroOneThreeFour\pc@goptd@fontcolor\pc@hyenc@fontcolorpdfcommentcolor\HyColor@XZeroOneThreeFour\pc@goptd@icolor\pc@hyenc@icolorpdfcommentcolor\pdfmark[IRIS]pdfmark=/ANN,Subtype=/Widget,Raw=/TU (Interface Region Imaging Spectrograph\textCR(\pc@goptd@deadline)) /T (tooltip zref@459) /C [ ] /FT/Btn /F 768 /Ff 65536 /H/N /BS ¡¡ /W 0 ¿¿ spectra the Mg ii triplet lines appears with interesting behavior. Their emission profiles closely mimic the C ii line shapes in \HyColor@XZeroOneThreeFour\pc@goptd@color\pc@hyenc@colorpdfcommentcolor\HyColor@XZeroOneThreeFour\pc@goptd@fontcolor\pc@hyenc@fontcolorpdfcommentcolor\HyColor@XZeroOneThreeFour\pc@goptd@icolor\pc@hyenc@icolorpdfcommentcolor\pdfmark[EB]pdfmark=/ANN,Subtype=/Widget,Raw=/TU (Ellerman bomb\textCR(\pc@goptd@deadline)) /T (tooltip zref@460) /C [ ] /FT/Btn /F 768 /Ff 65536 /H/N /BS ¡¡ /W 0 ¿¿ s and in the initial \HyColor@XZeroOneThreeFour\pc@goptd@color\pc@hyenc@colorpdfcommentcolor\HyColor@XZeroOneThreeFour\pc@goptd@fontcolor\pc@hyenc@fontcolorpdfcommentcolor\HyColor@XZeroOneThreeFour\pc@goptd@icolor\pc@hyenc@icolorpdfcommentcolor\pdfmark[EB]pdfmark=/ANN,Subtype=/Widget,Raw=/TU (Ellerman bomb\textCR(\pc@goptd@deadline)) /T (tooltip zref@461) /C [ ] /FT/Btn /F 768 /Ff 65536 /H/N /BS ¡¡ /W 0 ¿¿ -like stage of FAF-1, but not in the \HyColor@XZeroOneThreeFour\pc@goptd@color\pc@hyenc@colorpdfcommentcolor\HyColor@XZeroOneThreeFour\pc@goptd@fontcolor\pc@hyenc@fontcolorpdfcommentcolor\HyColor@XZeroOneThreeFour\pc@goptd@icolor\pc@hyenc@icolorpdfcommentcolor\pdfmark[FAF]pdfmark=/ANN,Subtype=/Widget,Raw=/TU (flaring arch filament\textCR(\pc@goptd@deadline)) /T (tooltip zref@462) /C [ ] /FT/Btn /F 768 /Ff 65536 /H/N /BS ¡¡ /W 0 ¿¿ spectra with stronger \HyColor@XZeroOneThreeFour\pc@goptd@color\pc@hyenc@colorpdfcommentcolor\HyColor@XZeroOneThreeFour\pc@goptd@fontcolor\pc@hyenc@fontcolorpdfcommentcolor\HyColor@XZeroOneThreeFour\pc@goptd@icolor\pc@hyenc@icolorpdfcommentcolor\pdfmark[IB]pdfmark=/ANN,Subtype=/Widget,Raw=/TU (IRIS bomb\textCR(\pc@goptd@deadline)) /T (tooltip zref@463) /C [ ] /FT/Btn /F 768 /Ff 65536 /H/N /BS ¡¡ /W 0 ¿¿ signatures. Strong presence of this line suggests a steep, deeply located temperature rise (Pereira et al. 2015). The marked appearances of Mg ii 2798 Å in Figs. 4, 8 and 10 are indeed in good agreement with the C ii and Si iv indications of high temperature already in the lower-part samplings.
In Fig. 13 the line is very strongly present in the first sampling of FAF-1, almost as tall as h and k, so that the startup of FAF-1 resembled a low-atmosphere \HyColor@XZeroOneThreeFour\pc@goptd@color\pc@hyenc@colorpdfcommentcolor\HyColor@XZeroOneThreeFour\pc@goptd@fontcolor\pc@hyenc@fontcolorpdfcommentcolor\HyColor@XZeroOneThreeFour\pc@goptd@icolor\pc@hyenc@icolorpdfcommentcolor\pdfmark[EB]pdfmark=/ANN,Subtype=/Widget,Raw=/TU (Ellerman bomb\textCR(\pc@goptd@deadline)) /T (tooltip zref@464) /C [ ] /FT/Btn /F 768 /Ff 65536 /H/N /BS ¡¡ /W 0 ¿¿ also in this respect. The later Mg ii triplet profiles of FAF-1 in Fig. 13 are less extraordinary. In all FAF-2 samplings this line appeared in absorption (Fig. 16).
\HyColor@XZeroOneThreeFour\pc@goptd@color\pc@hyenc@colorpdfcommentcolor\HyColor@XZeroOneThreeFour\pc@goptd@fontcolor\pc@hyenc@fontcolorpdfcommentcolor\HyColor@XZeroOneThreeFour\pc@goptd@icolor\pc@hyenc@icolorpdfcommentcolor\pdfmark[EB]pdfmark=/ANN,Subtype=/Widget,Raw=/TU (Ellerman bomb\textCR(\pc@goptd@deadline)) /T (tooltip zref@465) /C [ ] /FT/Btn /F 768 /Ff 65536 /H/N /BS ¡¡ /W 0 ¿¿ and \HyColor@XZeroOneThreeFour\pc@goptd@color\pc@hyenc@colorpdfcommentcolor\HyColor@XZeroOneThreeFour\pc@goptd@fontcolor\pc@hyenc@fontcolorpdfcommentcolor\HyColor@XZeroOneThreeFour\pc@goptd@icolor\pc@hyenc@icolorpdfcommentcolor\pdfmark[FAF]pdfmark=/ANN,Subtype=/Widget,Raw=/TU (flaring arch filament\textCR(\pc@goptd@deadline)) /T (tooltip zref@466) /C [ ] /FT/Btn /F 768 /Ff 65536 /H/N /BS ¡¡ /W 0 ¿¿ visibility in H
H is an extraordinary line, as is obvious from any solar H filtergram. In \HyColor@XZeroOneThreeFour\pc@goptd@color\pc@hyenc@colorpdfcommentcolor\HyColor@XZeroOneThreeFour\pc@goptd@fontcolor\pc@hyenc@fontcolorpdfcommentcolor\HyColor@XZeroOneThreeFour\pc@goptd@icolor\pc@hyenc@icolorpdfcommentcolor\pdfmark[EB]pdfmark=/ANN,Subtype=/Widget,Raw=/TU (Ellerman bomb\textCR(\pc@goptd@deadline)) /T (tooltip zref@467) /C [ ] /FT/Btn /F 768 /Ff 65536 /H/N /BS ¡¡ /W 0 ¿¿ s and \HyColor@XZeroOneThreeFour\pc@goptd@color\pc@hyenc@colorpdfcommentcolor\HyColor@XZeroOneThreeFour\pc@goptd@fontcolor\pc@hyenc@fontcolorpdfcommentcolor\HyColor@XZeroOneThreeFour\pc@goptd@icolor\pc@hyenc@icolorpdfcommentcolor\pdfmark[FAF]pdfmark=/ANN,Subtype=/Widget,Raw=/TU (flaring arch filament\textCR(\pc@goptd@deadline)) /T (tooltip zref@468) /C [ ] /FT/Btn /F 768 /Ff 65536 /H/N /BS ¡¡ /W 0 ¿¿ s it is also special. In EB-1 the H top producing enhanced C ii and Si iv emission is not seen in the first panel of Fig. 2, nor in the second panel. This suggests that hydrogen was already ionized in the upper part, as one would expect from Si iv visibility. However, in the other rows of Fig. 2 and also in Fig. 6 the H -wing morphology resembles the \HyColor@XZeroOneThreeFour\pc@goptd@color\pc@hyenc@colorpdfcommentcolor\HyColor@XZeroOneThreeFour\pc@goptd@fontcolor\pc@hyenc@fontcolorpdfcommentcolor\HyColor@XZeroOneThreeFour\pc@goptd@icolor\pc@hyenc@icolorpdfcommentcolor\pdfmark[IRIS]pdfmark=/ANN,Subtype=/Widget,Raw=/TU (Interface Region Imaging Spectrograph\textCR(\pc@goptd@deadline)) /T (tooltip zref@469) /C [ ] /FT/Btn /F 768 /Ff 65536 /H/N /BS ¡¡ /W 0 ¿¿ 1330 Å slitjaw images. We believe that such hot response of H stems from severe non-equilibrium recombination of hydrogen (Carlsson & Stein 2002; Leenaarts et al. 2007).
5. Conclusions
We have combined a comprehensive suite of solar observations. The relatively large field of view, unsurpassed image quality, and fast cadence of the H imaging spectroscopy with the \HyColor@XZeroOneThreeFour\pc@goptd@color\pc@hyenc@colorpdfcommentcolor\HyColor@XZeroOneThreeFour\pc@goptd@fontcolor\pc@hyenc@fontcolorpdfcommentcolor\HyColor@XZeroOneThreeFour\pc@goptd@icolor\pc@hyenc@icolorpdfcommentcolor\pdfmark[SST]pdfmark=/ANN,Subtype=/Widget,Raw=/TU (Swedish 1-m Solar Telescope\textCR(\pc@goptd@deadline)) /T (tooltip zref@470) /C [ ] /FT/Btn /F 768 /Ff 65536 /H/N /BS ¡¡ /W 0 ¿¿ was indispensable to recognize both \HyColor@XZeroOneThreeFour\pc@goptd@color\pc@hyenc@colorpdfcommentcolor\HyColor@XZeroOneThreeFour\pc@goptd@fontcolor\pc@hyenc@fontcolorpdfcommentcolor\HyColor@XZeroOneThreeFour\pc@goptd@icolor\pc@hyenc@icolorpdfcommentcolor\pdfmark[EB]pdfmark=/ANN,Subtype=/Widget,Raw=/TU (Ellerman bomb\textCR(\pc@goptd@deadline)) /T (tooltip zref@471) /C [ ] /FT/Btn /F 768 /Ff 65536 /H/N /BS ¡¡ /W 0 ¿¿ s and overlying fibrils from their spatial, temporal, and spectral behavior. The full-time full-disk monitoring by \HyColor@XZeroOneThreeFour\pc@goptd@color\pc@hyenc@colorpdfcommentcolor\HyColor@XZeroOneThreeFour\pc@goptd@fontcolor\pc@hyenc@fontcolorpdfcommentcolor\HyColor@XZeroOneThreeFour\pc@goptd@icolor\pc@hyenc@icolorpdfcommentcolor\pdfmark[SDO]pdfmark=/ANN,Subtype=/Widget,Raw=/TU (Solar Dynamics Observatory\textCR(\pc@goptd@deadline)) /T (tooltip zref@472) /C [ ] /FT/Btn /F 768 /Ff 65536 /H/N /BS ¡¡ /W 0 ¿¿ served to separate \HyColor@XZeroOneThreeFour\pc@goptd@color\pc@hyenc@colorpdfcommentcolor\HyColor@XZeroOneThreeFour\pc@goptd@fontcolor\pc@hyenc@fontcolorpdfcommentcolor\HyColor@XZeroOneThreeFour\pc@goptd@icolor\pc@hyenc@icolorpdfcommentcolor\pdfmark[EB]pdfmark=/ANN,Subtype=/Widget,Raw=/TU (Ellerman bomb\textCR(\pc@goptd@deadline)) /T (tooltip zref@473) /C [ ] /FT/Btn /F 768 /Ff 65536 /H/N /BS ¡¡ /W 0 ¿¿ s and \HyColor@XZeroOneThreeFour\pc@goptd@color\pc@hyenc@colorpdfcommentcolor\HyColor@XZeroOneThreeFour\pc@goptd@fontcolor\pc@hyenc@fontcolorpdfcommentcolor\HyColor@XZeroOneThreeFour\pc@goptd@icolor\pc@hyenc@icolorpdfcommentcolor\pdfmark[FAF]pdfmark=/ANN,Subtype=/Widget,Raw=/TU (flaring arch filament\textCR(\pc@goptd@deadline)) /T (tooltip zref@474) /C [ ] /FT/Btn /F 768 /Ff 65536 /H/N /BS ¡¡ /W 0 ¿¿ s in \HyColor@XZeroOneThreeFour\pc@goptd@color\pc@hyenc@colorpdfcommentcolor\HyColor@XZeroOneThreeFour\pc@goptd@fontcolor\pc@hyenc@fontcolorpdfcommentcolor\HyColor@XZeroOneThreeFour\pc@goptd@icolor\pc@hyenc@icolorpdfcommentcolor\pdfmark[AIA]pdfmark=/ANN,Subtype=/Widget,Raw=/TU (Atmospheric Imaging Assembly\textCR(\pc@goptd@deadline)) /T (tooltip zref@475) /C [ ] /FT/Btn /F 768 /Ff 65536 /H/N /BS ¡¡ /W 0 ¿¿ 1700 and 1600 Å images and to inspect magnetic field evolution in \HyColor@XZeroOneThreeFour\pc@goptd@color\pc@hyenc@colorpdfcommentcolor\HyColor@XZeroOneThreeFour\pc@goptd@fontcolor\pc@hyenc@fontcolorpdfcommentcolor\HyColor@XZeroOneThreeFour\pc@goptd@icolor\pc@hyenc@icolorpdfcommentcolor\pdfmark[HMI]pdfmark=/ANN,Subtype=/Widget,Raw=/TU (Helioseismic and Magnetic Imager\textCR(\pc@goptd@deadline)) /T (tooltip zref@476) /C [ ] /FT/Btn /F 768 /Ff 65536 /H/N /BS ¡¡ /W 0 ¿¿ magnetograms. The \HyColor@XZeroOneThreeFour\pc@goptd@color\pc@hyenc@colorpdfcommentcolor\HyColor@XZeroOneThreeFour\pc@goptd@fontcolor\pc@hyenc@fontcolorpdfcommentcolor\HyColor@XZeroOneThreeFour\pc@goptd@icolor\pc@hyenc@icolorpdfcommentcolor\pdfmark[IRIS]pdfmark=/ANN,Subtype=/Widget,Raw=/TU (Interface Region Imaging Spectrograph\textCR(\pc@goptd@deadline)) /T (tooltip zref@477) /C [ ] /FT/Btn /F 768 /Ff 65536 /H/N /BS ¡¡ /W 0 ¿¿ slitjaw images, effectively providing high-cadence large-field images in the major \HyColor@XZeroOneThreeFour\pc@goptd@color\pc@hyenc@colorpdfcommentcolor\HyColor@XZeroOneThreeFour\pc@goptd@fontcolor\pc@hyenc@fontcolorpdfcommentcolor\HyColor@XZeroOneThreeFour\pc@goptd@icolor\pc@hyenc@icolorpdfcommentcolor\pdfmark[IRIS]pdfmark=/ANN,Subtype=/Widget,Raw=/TU (Interface Region Imaging Spectrograph\textCR(\pc@goptd@deadline)) /T (tooltip zref@478) /C [ ] /FT/Btn /F 768 /Ff 65536 /H/N /BS ¡¡ /W 0 ¿¿ lines, are an extremely valuable asset that previous solar ultraviolet spectrometers did not furnish. And last but not least, the spectra in the well-chosen set of \HyColor@XZeroOneThreeFour\pc@goptd@color\pc@hyenc@colorpdfcommentcolor\HyColor@XZeroOneThreeFour\pc@goptd@fontcolor\pc@hyenc@fontcolorpdfcommentcolor\HyColor@XZeroOneThreeFour\pc@goptd@icolor\pc@hyenc@icolorpdfcommentcolor\pdfmark[IRIS]pdfmark=/ANN,Subtype=/Widget,Raw=/TU (Interface Region Imaging Spectrograph\textCR(\pc@goptd@deadline)) /T (tooltip zref@479) /C [ ] /FT/Btn /F 768 /Ff 65536 /H/N /BS ¡¡ /W 0 ¿¿ lines emerge as varied “unveiled” \HyColor@XZeroOneThreeFour\pc@goptd@color\pc@hyenc@colorpdfcommentcolor\HyColor@XZeroOneThreeFour\pc@goptd@fontcolor\pc@hyenc@fontcolorpdfcommentcolor\HyColor@XZeroOneThreeFour\pc@goptd@icolor\pc@hyenc@icolorpdfcommentcolor\pdfmark[EB]pdfmark=/ANN,Subtype=/Widget,Raw=/TU (Ellerman bomb\textCR(\pc@goptd@deadline)) /T (tooltip zref@480) /C [ ] /FT/Btn /F 768 /Ff 65536 /H/N /BS ¡¡ /W 0 ¿¿ diagnostics not hampered by overlying fibrils and offering rich signatures of what happens in the solar atmosphere at \HyColor@XZeroOneThreeFour\pc@goptd@color\pc@hyenc@colorpdfcommentcolor\HyColor@XZeroOneThreeFour\pc@goptd@fontcolor\pc@hyenc@fontcolorpdfcommentcolor\HyColor@XZeroOneThreeFour\pc@goptd@icolor\pc@hyenc@icolorpdfcommentcolor\pdfmark[EB]pdfmark=/ANN,Subtype=/Widget,Raw=/TU (Ellerman bomb\textCR(\pc@goptd@deadline)) /T (tooltip zref@481) /C [ ] /FT/Btn /F 768 /Ff 65536 /H/N /BS ¡¡ /W 0 ¿¿ and \HyColor@XZeroOneThreeFour\pc@goptd@color\pc@hyenc@colorpdfcommentcolor\HyColor@XZeroOneThreeFour\pc@goptd@fontcolor\pc@hyenc@fontcolorpdfcommentcolor\HyColor@XZeroOneThreeFour\pc@goptd@icolor\pc@hyenc@icolorpdfcommentcolor\pdfmark[FAF]pdfmark=/ANN,Subtype=/Widget,Raw=/TU (flaring arch filament\textCR(\pc@goptd@deadline)) /T (tooltip zref@482) /C [ ] /FT/Btn /F 768 /Ff 65536 /H/N /BS ¡¡ /W 0 ¿¿ sites. They testify to Pannekoek’s dictum that “spectra constitute the astronomer’s treasure chest”.
We summarize our conclusions for \HyColor@XZeroOneThreeFour\pc@goptd@color\pc@hyenc@colorpdfcommentcolor\HyColor@XZeroOneThreeFour\pc@goptd@fontcolor\pc@hyenc@fontcolorpdfcommentcolor\HyColor@XZeroOneThreeFour\pc@goptd@icolor\pc@hyenc@icolorpdfcommentcolor\pdfmark[EB]pdfmark=/ANN,Subtype=/Widget,Raw=/TU (Ellerman bomb\textCR(\pc@goptd@deadline)) /T (tooltip zref@483) /C [ ] /FT/Btn /F 768 /Ff 65536 /H/N /BS ¡¡ /W 0 ¿¿ s as follows:
-
1.
the cores of H and the Mg ii h and k lines sample overlying chromospheric fibrils that are unaffected by the underlying \HyColor@XZeroOneThreeFour\pc@goptd@color\pc@hyenc@colorpdfcommentcolor\HyColor@XZeroOneThreeFour\pc@goptd@fontcolor\pc@hyenc@fontcolorpdfcommentcolor\HyColor@XZeroOneThreeFour\pc@goptd@icolor\pc@hyenc@icolorpdfcommentcolor\pdfmark[EB]pdfmark=/ANN,Subtype=/Widget,Raw=/TU (Ellerman bomb\textCR(\pc@goptd@deadline)) /T (tooltip zref@484) /C [ ] /FT/Btn /F 768 /Ff 65536 /H/N /BS ¡¡ /W 0 ¿¿ . In these lines \HyColor@XZeroOneThreeFour\pc@goptd@color\pc@hyenc@colorpdfcommentcolor\HyColor@XZeroOneThreeFour\pc@goptd@fontcolor\pc@hyenc@fontcolorpdfcommentcolor\HyColor@XZeroOneThreeFour\pc@goptd@icolor\pc@hyenc@icolorpdfcommentcolor\pdfmark[EB]pdfmark=/ANN,Subtype=/Widget,Raw=/TU (Ellerman bomb\textCR(\pc@goptd@deadline)) /T (tooltip zref@485) /C [ ] /FT/Btn /F 768 /Ff 65536 /H/N /BS ¡¡ /W 0 ¿¿ s are visible only well away from line center;
-
2.
the \HyColor@XZeroOneThreeFour\pc@goptd@color\pc@hyenc@colorpdfcommentcolor\HyColor@XZeroOneThreeFour\pc@goptd@fontcolor\pc@hyenc@fontcolorpdfcommentcolor\HyColor@XZeroOneThreeFour\pc@goptd@icolor\pc@hyenc@icolorpdfcommentcolor\pdfmark[IRIS]pdfmark=/ANN,Subtype=/Widget,Raw=/TU (Interface Region Imaging Spectrograph\textCR(\pc@goptd@deadline)) /T (tooltip zref@486) /C [ ] /FT/Btn /F 768 /Ff 65536 /H/N /BS ¡¡ /W 0 ¿¿ Mg ii triplet, C ii, and Si iv lines sample the Ellerman bomb itself, often with optically-thin or near-thin formation of the Si iv cores;
-
3.
these “unveiled” \HyColor@XZeroOneThreeFour\pc@goptd@color\pc@hyenc@colorpdfcommentcolor\HyColor@XZeroOneThreeFour\pc@goptd@fontcolor\pc@hyenc@fontcolorpdfcommentcolor\HyColor@XZeroOneThreeFour\pc@goptd@icolor\pc@hyenc@icolorpdfcommentcolor\pdfmark[IRIS]pdfmark=/ANN,Subtype=/Widget,Raw=/TU (Interface Region Imaging Spectrograph\textCR(\pc@goptd@deadline)) /T (tooltip zref@487) /C [ ] /FT/Btn /F 768 /Ff 65536 /H/N /BS ¡¡ /W 0 ¿¿ diagnostics indicate that the tops of Ellerman bombs become much hotter than all previous estimates in the literature;
-
4.
they also give direct evidence of bi-directional jet behavior, with downdrafts of the lower parts and faster updrafts of the hotter upper parts;
-
5.
subsequently, very hot post-bomb gas appears with wide and complex ultraviolet line profiles that suggest large Dopplershifts, possibly still from bi-directional jets, and much fine-scale structure. Even these remain a sub-canopy phenomenon.
@goptd@color\pc@hyenc@colorpdfcommentcolor\HyColor@XZeroOneThreeFour\pc@goptd@fontcolor\pc@hyenc@fontcolorpdfcommentcolor\HyColor@XZeroOneThreeFour\pc@goptd@icolor\pc@hyenc@icolorpdfcommentcolor\pdfmark[FAF]pdfmark=/ANN,Subtype=/Widget,Raw=/TU (flaring arch filament\textCR(\pc@goptd@deadline)) /T (tooltip zref@488) /C [ ] /FT/Btn /F 768 /Ff 65536 /H/N /BS ¡¡ /W 0 ¿¿ s seem to represent a comparable reconnection phenomenon, but breaking through or progressing along the chromospheric canopy and causing much hotter structures that also become evident in million-Kelvin \HyColor@XZeroOneThreeFour\pc@goptd@color\pc@hyenc@colorpdfcommentcolor\HyColor@XZeroOneThreeFour\pc@goptd@fontcolor\pc@hyenc@fontcolorpdfcommentcolor\HyColor@XZeroOneThreeFour\pc@goptd@icolor\pc@hyenc@icolorpdfcommentcolor\pdfmark[AIA]pdfmark=/ANN,Subtype=/Widget,Raw=/TU (Atmospheric Imaging Assembly\textCR(\pc@goptd@deadline)) /T (tooltip zref@489) /C [ ] /FT/Btn /F 768 /Ff 65536 /H/N /BS ¡¡ /W 0 ¿¿ diagnostics. The main difference with \HyColor@XZeroOneThreeFour\pc@goptd@color\pc@hyenc@colorpdfcommentcolor\HyColor@XZeroOneThreeFour\pc@goptd@fontcolor\pc@hyenc@fontcolorpdfcommentcolor\HyColor@XZeroOneThreeFour\pc@goptd@icolor\pc@hyenc@icolorpdfcommentcolor\pdfmark[EB]pdfmark=/ANN,Subtype=/Widget,Raw=/TU (Ellerman bomb\textCR(\pc@goptd@deadline)) /T (tooltip zref@490) /C [ ] /FT/Btn /F 768 /Ff 65536 /H/N /BS ¡¡ /W 0 ¿¿ s seems that the reconnection is located or proceeds higher, but the blends and line-center-dips in the \HyColor@XZeroOneThreeFour\pc@goptd@color\pc@hyenc@colorpdfcommentcolor\HyColor@XZeroOneThreeFour\pc@goptd@fontcolor\pc@hyenc@fontcolorpdfcommentcolor\HyColor@XZeroOneThreeFour\pc@goptd@icolor\pc@hyenc@icolorpdfcommentcolor\pdfmark[IRIS]pdfmark=/ANN,Subtype=/Widget,Raw=/TU (Interface Region Imaging Spectrograph\textCR(\pc@goptd@deadline)) /T (tooltip zref@491) /C [ ] /FT/Btn /F 768 /Ff 65536 /H/N /BS ¡¡ /W 0 ¿¿ profiles from FAF-2 still suggest fairly deep formation.
For future \HyColor@XZeroOneThreeFour\pc@goptd@color\pc@hyenc@colorpdfcommentcolor\HyColor@XZeroOneThreeFour\pc@goptd@fontcolor\pc@hyenc@fontcolorpdfcommentcolor\HyColor@XZeroOneThreeFour\pc@goptd@icolor\pc@hyenc@icolorpdfcommentcolor\pdfmark[EB]pdfmark=/ANN,Subtype=/Widget,Raw=/TU (Ellerman bomb\textCR(\pc@goptd@deadline)) /T (tooltip zref@492) /C [ ] /FT/Btn /F 768 /Ff 65536 /H/N /BS ¡¡ /W 0 ¿¿ modeling the ultraviolet line profiles from \HyColor@XZeroOneThreeFour\pc@goptd@color\pc@hyenc@colorpdfcommentcolor\HyColor@XZeroOneThreeFour\pc@goptd@fontcolor\pc@hyenc@fontcolorpdfcommentcolor\HyColor@XZeroOneThreeFour\pc@goptd@icolor\pc@hyenc@icolorpdfcommentcolor\pdfmark[IRIS]pdfmark=/ANN,Subtype=/Widget,Raw=/TU (Interface Region Imaging Spectrograph\textCR(\pc@goptd@deadline)) /T (tooltip zref@493) /C [ ] /FT/Btn /F 768 /Ff 65536 /H/N /BS ¡¡ /W 0 ¿¿ represent highly varied diagnostics furnishing such rich detail that modeling which succeeds in good reproduction is bound to be close to correct. If it does not succeed then such failure is bound to be instructive also. In this manner, \HyColor@XZeroOneThreeFour\pc@goptd@color\pc@hyenc@colorpdfcommentcolor\HyColor@XZeroOneThreeFour\pc@goptd@fontcolor\pc@hyenc@fontcolorpdfcommentcolor\HyColor@XZeroOneThreeFour\pc@goptd@icolor\pc@hyenc@icolorpdfcommentcolor\pdfmark[EB]pdfmark=/ANN,Subtype=/Widget,Raw=/TU (Ellerman bomb\textCR(\pc@goptd@deadline)) /T (tooltip zref@494) /C [ ] /FT/Btn /F 768 /Ff 65536 /H/N /BS ¡¡ /W 0 ¿¿ s are likely to become the first solar reconnection phenomenon for which detailed modeling may be verified with certainty.
Since \HyColor@XZeroOneThreeFour\pc@goptd@color\pc@hyenc@colorpdfcommentcolor\HyColor@XZeroOneThreeFour\pc@goptd@fontcolor\pc@hyenc@fontcolorpdfcommentcolor\HyColor@XZeroOneThreeFour\pc@goptd@icolor\pc@hyenc@icolorpdfcommentcolor\pdfmark[FAF]pdfmark=/ANN,Subtype=/Widget,Raw=/TU (flaring arch filament\textCR(\pc@goptd@deadline)) /T (tooltip zref@495) /C [ ] /FT/Btn /F 768 /Ff 65536 /H/N /BS ¡¡ /W 0 ¿¿ s seem of larger interest with regards to upper-atmosphere mass and heat loading, verified \HyColor@XZeroOneThreeFour\pc@goptd@color\pc@hyenc@colorpdfcommentcolor\HyColor@XZeroOneThreeFour\pc@goptd@fontcolor\pc@hyenc@fontcolorpdfcommentcolor\HyColor@XZeroOneThreeFour\pc@goptd@icolor\pc@hyenc@icolorpdfcommentcolor\pdfmark[EB]pdfmark=/ANN,Subtype=/Widget,Raw=/TU (Ellerman bomb\textCR(\pc@goptd@deadline)) /T (tooltip zref@496) /C [ ] /FT/Btn /F 768 /Ff 65536 /H/N /BS ¡¡ /W 0 ¿¿ modeling seems a worthwhile stepping stone to modeling \HyColor@XZeroOneThreeFour\pc@goptd@color\pc@hyenc@colorpdfcommentcolor\HyColor@XZeroOneThreeFour\pc@goptd@fontcolor\pc@hyenc@fontcolorpdfcommentcolor\HyColor@XZeroOneThreeFour\pc@goptd@icolor\pc@hyenc@icolorpdfcommentcolor\pdfmark[FAF]pdfmark=/ANN,Subtype=/Widget,Raw=/TU (flaring arch filament\textCR(\pc@goptd@deadline)) /T (tooltip zref@497) /C [ ] /FT/Btn /F 768 /Ff 65536 /H/N /BS ¡¡ /W 0 ¿¿ s properly. A good example in this direction is the recent study by Archontis & Hansteen (2014) of the formation of small flares from strong-field magnetoconvection producing serpentine emergence of the type proposed for \HyColor@XZeroOneThreeFour\pc@goptd@color\pc@hyenc@colorpdfcommentcolor\HyColor@XZeroOneThreeFour\pc@goptd@fontcolor\pc@hyenc@fontcolorpdfcommentcolor\HyColor@XZeroOneThreeFour\pc@goptd@icolor\pc@hyenc@icolorpdfcommentcolor\pdfmark[EB]pdfmark=/ANN,Subtype=/Widget,Raw=/TU (Ellerman bomb\textCR(\pc@goptd@deadline)) /T (tooltip zref@498) /C [ ] /FT/Btn /F 768 /Ff 65536 /H/N /BS ¡¡ /W 0 ¿¿ s. Their resulting heating events and coronal jets are more substantial and located higher than \HyColor@XZeroOneThreeFour\pc@goptd@color\pc@hyenc@colorpdfcommentcolor\HyColor@XZeroOneThreeFour\pc@goptd@fontcolor\pc@hyenc@fontcolorpdfcommentcolor\HyColor@XZeroOneThreeFour\pc@goptd@icolor\pc@hyenc@icolorpdfcommentcolor\pdfmark[EB]pdfmark=/ANN,Subtype=/Widget,Raw=/TU (Ellerman bomb\textCR(\pc@goptd@deadline)) /T (tooltip zref@499) /C [ ] /FT/Btn /F 768 /Ff 65536 /H/N /BS ¡¡ /W 0 ¿¿ s, but may well describe what we have called \HyColor@XZeroOneThreeFour\pc@goptd@color\pc@hyenc@colorpdfcommentcolor\HyColor@XZeroOneThreeFour\pc@goptd@fontcolor\pc@hyenc@fontcolorpdfcommentcolor\HyColor@XZeroOneThreeFour\pc@goptd@icolor\pc@hyenc@icolorpdfcommentcolor\pdfmark[FAF]pdfmark=/ANN,Subtype=/Widget,Raw=/TU (flaring arch filament\textCR(\pc@goptd@deadline)) /T (tooltip zref@500) /C [ ] /FT/Btn /F 768 /Ff 65536 /H/N /BS ¡¡ /W 0 ¿¿ s here.
Observationally, the next step is easier: catch \HyColor@XZeroOneThreeFour\pc@goptd@color\pc@hyenc@colorpdfcommentcolor\HyColor@XZeroOneThreeFour\pc@goptd@fontcolor\pc@hyenc@fontcolorpdfcommentcolor\HyColor@XZeroOneThreeFour\pc@goptd@icolor\pc@hyenc@icolorpdfcommentcolor\pdfmark[EB]pdfmark=/ANN,Subtype=/Widget,Raw=/TU (Ellerman bomb\textCR(\pc@goptd@deadline)) /T (tooltip zref@501) /C [ ] /FT/Btn /F 768 /Ff 65536 /H/N /BS ¡¡ /W 0 ¿¿ s and \HyColor@XZeroOneThreeFour\pc@goptd@color\pc@hyenc@colorpdfcommentcolor\HyColor@XZeroOneThreeFour\pc@goptd@fontcolor\pc@hyenc@fontcolorpdfcommentcolor\HyColor@XZeroOneThreeFour\pc@goptd@icolor\pc@hyenc@icolorpdfcommentcolor\pdfmark[FAF]pdfmark=/ANN,Subtype=/Widget,Raw=/TU (flaring arch filament\textCR(\pc@goptd@deadline)) /T (tooltip zref@502) /C [ ] /FT/Btn /F 768 /Ff 65536 /H/N /BS ¡¡ /W 0 ¿¿ s in joint \HyColor@XZeroOneThreeFour\pc@goptd@color\pc@hyenc@colorpdfcommentcolor\HyColor@XZeroOneThreeFour\pc@goptd@fontcolor\pc@hyenc@fontcolorpdfcommentcolor\HyColor@XZeroOneThreeFour\pc@goptd@icolor\pc@hyenc@icolorpdfcommentcolor\pdfmark[SST]pdfmark=/ANN,Subtype=/Widget,Raw=/TU (Swedish 1-m Solar Telescope\textCR(\pc@goptd@deadline)) /T (tooltip zref@503) /C [ ] /FT/Btn /F 768 /Ff 65536 /H/N /BS ¡¡ /W 0 ¿¿ and \HyColor@XZeroOneThreeFour\pc@goptd@color\pc@hyenc@colorpdfcommentcolor\HyColor@XZeroOneThreeFour\pc@goptd@fontcolor\pc@hyenc@fontcolorpdfcommentcolor\HyColor@XZeroOneThreeFour\pc@goptd@icolor\pc@hyenc@icolorpdfcommentcolor\pdfmark[IRIS]pdfmark=/ANN,Subtype=/Widget,Raw=/TU (Interface Region Imaging Spectrograph\textCR(\pc@goptd@deadline)) /T (tooltip zref@504) /C [ ] /FT/Btn /F 768 /Ff 65536 /H/N /BS ¡¡ /W 0 ¿¿ (and of course \HyColor@XZeroOneThreeFour\pc@goptd@color\pc@hyenc@colorpdfcommentcolor\HyColor@XZeroOneThreeFour\pc@goptd@fontcolor\pc@hyenc@fontcolorpdfcommentcolor\HyColor@XZeroOneThreeFour\pc@goptd@icolor\pc@hyenc@icolorpdfcommentcolor\pdfmark[SDO]pdfmark=/ANN,Subtype=/Widget,Raw=/TU (Solar Dynamics Observatory\textCR(\pc@goptd@deadline)) /T (tooltip zref@505) /C [ ] /FT/Btn /F 768 /Ff 65536 /H/N /BS ¡¡ /W 0 ¿¿ ) observing campaigns targeting emerging active regions well away from disk center with a faster \HyColor@XZeroOneThreeFour\pc@goptd@color\pc@hyenc@colorpdfcommentcolor\HyColor@XZeroOneThreeFour\pc@goptd@fontcolor\pc@hyenc@fontcolorpdfcommentcolor\HyColor@XZeroOneThreeFour\pc@goptd@icolor\pc@hyenc@icolorpdfcommentcolor\pdfmark[IRIS]pdfmark=/ANN,Subtype=/Widget,Raw=/TU (Interface Region Imaging Spectrograph\textCR(\pc@goptd@deadline)) /T (tooltip zref@506) /C [ ] /FT/Btn /F 768 /Ff 65536 /H/N /BS ¡¡ /W 0 ¿¿ repeat cadence than in datasets 2 and 3. It would also be good to roll \HyColor@XZeroOneThreeFour\pc@goptd@color\pc@hyenc@colorpdfcommentcolor\HyColor@XZeroOneThreeFour\pc@goptd@fontcolor\pc@hyenc@fontcolorpdfcommentcolor\HyColor@XZeroOneThreeFour\pc@goptd@icolor\pc@hyenc@icolorpdfcommentcolor\pdfmark[IRIS]pdfmark=/ANN,Subtype=/Widget,Raw=/TU (Interface Region Imaging Spectrograph\textCR(\pc@goptd@deadline)) /T (tooltip zref@507) /C [ ] /FT/Btn /F 768 /Ff 65536 /H/N /BS ¡¡ /W 0 ¿¿ to put its slit along the projected vertical per target.
References
- Archontis & Hansteen (2014) Archontis, V., & Hansteen, V. 2014, ApJL, 788, L2 ADS
- Archontis & Hood (2009) Archontis, V., & Hood, A. W. 2009, A&A, 508, 1469 ADS
- Bello González et al. (2013) Bello González, N., Danilovic, S., & Kneer, F. 2013, A&A, 557, A102 ADS
- Berlicki & Heinzel (2014) Berlicki, A., & Heinzel, P. 2014, A&A, 567, A110 ADS
- Berlicki et al. (2010) Berlicki, A., Heinzel, P., & Avrett, E. H. 2010, MmSAI, 81, 646 ADS
- Bernasconi et al. (2002) Bernasconi, P. N., Rust, D. M., Georgoulis, M. K., & Labonte, B. J. 2002, SoPh, 209, 119 ADS
- Carlsson & Stein (1997) Carlsson, M., & Stein, R. F. 1997, ApJ, 481, 500 ADS
- Carlsson & Stein (2002) —. 2002, ApJ, 572, 626 ADS
- Chen et al. (2001) Chen, P.-F., Fang, C., & Ding, M.-D. D. 2001, Chin. J. A&A, 1, 176 ADS
- de la Cruz Rodriguéz (2010) de la Cruz Rodriguéz, J. 2010, PhD thesis, Stockholm University ADS
- de la Cruz Rodríguez et al. (2015) de la Cruz Rodríguez, J., Löfdahl, M. G., Sütterlin, P., Hillberg, T., & Rouppe van der Voort, L. 2015, A&A, 573, A40 ADS
- De Pontieu et al. (2007) De Pontieu, B., Hansteen, V. H., Rouppe van der Voort, L., van Noort, M., & Carlsson, M. 2007, ApJ, 655, 624 ADS
- De Pontieu et al. (2014) De Pontieu, B., Title, A. M., Lemen, J. R., et al. 2014, SoPh, 289, 2733 ADS
- Ellerman (1917) Ellerman, F. 1917, ApJ, 46, 298 ADS
- Georgoulis et al. (2002) Georgoulis, M. K., Rust, D. M., Bernasconi, P. N., & Schmieder, B. 2002, ApJ, 575, 506 ADS
- Hansteen et al. (2006) Hansteen, V. H., De Pontieu, B., Rouppe van der Voort, L., van Noort, M., & Carlsson, M. 2006, ApJL, 647, L73 ADS
- Heggland et al. (2007) Heggland, L., De Pontieu, B., & Hansteen, V. H. 2007, ApJ, 666, 1277 ADS
- Henriques (2012) Henriques, V. M. J. 2012, A&A, 548, A114 ADS
- Hong et al. (2014) Hong, J., Ding, M. D., Li, Y., Fang, C., & Cao, W. 2014, ApJ, 792, 13 ADS
- Isobe et al. (2007) Isobe, H., Tripathi, D., & Archontis, V. 2007, ApJL, 657, L53 ADS
- Kitai (1983) Kitai, R. 1983, SoPh, 87, 135 ADS
- Langangen et al. (2008) Langangen, Ø., Carlsson, M., Rouppe van der Voort, L., Hansteen, V., & De Pontieu, B. 2008, ApJ, 673, 1194 ADS
- Leenaarts et al. (2007) Leenaarts, J., Carlsson, M., Hansteen, V., & Rutten, R. J. 2007, A&A, 473, 625 ADS
- Leenaarts et al. (2013a) Leenaarts, J., Pereira, T. M. D., Carlsson, M., Uitenbroek, H., & De Pontieu, B. 2013a, ApJ, 772, 89 ADS
- Leenaarts et al. (2013b) —. 2013b, ApJ, 772, 90 ADS
- Leenaarts et al. (2006a) Leenaarts, J., Rutten, R. J., Carlsson, M., & Uitenbroek, H. 2006a, A&A, 452, L15 ADS
- Leenaarts et al. (2006b) Leenaarts, J., Rutten, R. J., Sütterlin, P., Carlsson, M., & Uitenbroek, H. 2006b, A&A, 449, 1209 ADS
- Lemen et al. (2012) Lemen, J. R., Title, A. M., Akin, D. J., et al. 2012, SoPh, 275, 17 ADS
- Lites et al. (1978) Lites, B. W., Shine, R. A., & Chipman, E. G. 1978, ApJ, 222, 333 ADS
- Matsumoto et al. (2008) Matsumoto, T., Kitai, R., Shibata, K., et al. 2008, PASJ, 60, 95 ADS
- McMath et al. (1960) McMath, R. R., Mohler, O. C., & Dodson, H. W. 1960, Proceedings of the National Academy of Science, 46, 165 ADS
- Nelson et al. (2013a) Nelson, C. J., Doyle, J. G., Erdélyi, R., et al. 2013a, SoPh, 283, 307 ADS
- Nelson et al. (2015) Nelson, C. J., Scullion, E. M., Doyle, J. G., Freij, N., & Erdélyi, R. 2015, ApJ, 798, 19 ADS
- Nelson et al. (2013b) Nelson, C. J., Shelyag, S., Mathioudakis, M., et al. 2013b, ApJ, 779, 125 ADS
- Nozawa et al. (1992) Nozawa, S., Shibata, K., Matsumoto, R., et al. 1992, ApJS, 78, 267 ADS
- Pariat et al. (2004) Pariat, E., Aulanier, G., Schmieder, B., et al. 2004, ApJ, 614, 1099 ADS
- Pariat et al. (2009) Pariat, E., Masson, S., & Aulanier, G. 2009, ApJ, 701, 1911 ADS
- Pereira et al. (2015) Pereira, T. M. D., Carlsson, M., De Pontieu, B., & Hansteen, V. 2015, ArXiv e-prints, arXiv:1504.01733 ADS
- Pereira et al. (2013) Pereira, T. M. D., Leenaarts, J., De Pontieu, B., Carlsson, M., & Uitenbroek, H. 2013, ApJ, 778, 143 ADS
- Peter et al. (2014) Peter, H., Tian, H., Curdt, W., et al. 2014, Science, 346, C315 ADS
- Rutten (2003) Rutten, R. J. 2003, Radiative Transfer in Stellar Atmospheres ADS
- Rutten et al. (2013) Rutten, R. J., Vissers, G. J. M., Rouppe van der Voort, L. H. M., Sütterlin, P., & Vitas, N. 2013, Journal of Physics Conference Series, 440, 012007 ADS
- Scharmer et al. (2003) Scharmer, G. B., Bjelksjo, K., Korhonen, T. K., Lindberg, B., & Petterson, B. 2003, in Society of Photo-Optical Instrumentation Engineers (SPIE) Conference Series, Vol. 4853, Innovative Telescopes and Instrumentation for Solar Astrophysics, ed. S. L. Keil & S. V. Avakyan, 341–350 ADS
- Scharmer et al. (2008) Scharmer, G. B., Narayan, G., Hillberg, T., et al. 2008, ApJL, 689, L69 ADS
- Scherrer et al. (2012) Scherrer, P. H., Schou, J., Bush, R. I., et al. 2012, SoPh, 275, 207 ADS
- Shibata et al. (2007) Shibata, K., Nakamura, T., Matsumoto, T., et al. 2007, Science, 318, 1591 ADS
- Shine et al. (1994) Shine, R. A., Title, A. M., Tarbell, T. D., et al. 1994, ApJ, 430, 413 ADS
- Tian et al. (2014) Tian, H., DeLuca, E. E., Cranmer, S. R., et al. 2014, Science, 346, A315
- van Noort et al. (2005) van Noort, M., Rouppe van der Voort, L., & Löfdahl, M. G. 2005, SoPh, 228, 191 ADS
- Vecchio et al. (2009) Vecchio, A., Cauzzi, G., & Reardon, K. P. 2009, A&A, 494, 269 ADS
- Vissers & Rouppe van der Voort (2012) Vissers, G., & Rouppe van der Voort, L. 2012, ApJ, 750, 22 ADS
- Vissers et al. (2013) Vissers, G. J. M., Rouppe van der Voort, L. H. M., & Rutten, R. J. 2013, ApJ, 774, 32 ADS (Paper II)
- Watanabe et al. (2011) Watanabe, H., Vissers, G., Kitai, R., Rouppe van der Voort, L., & Rutten, R. J. 2011, ApJ, 736, 71 ADS (Paper I)
- Yang et al. (2013) Yang, H., Chae, J., Lim, E.-K., et al. 2013, SoPh, 288, 39 ADS