Physical Dust Models for the Extinction toward Supernova 2014J in M82
Abstract
Type Ia supernovae (SNe Ia) are powerful cosmological “standardizable candles” and the most precise distance indicators. However, a limiting factor in their use for precision cosmology rests on our ability to correct for the dust extinction toward them. SN 2014J in the starburst galaxy M82, the closest detected SN Ia in three decades, provides unparalleled opportunities to study the dust extinction toward an SN Ia. In order to derive the extinction as a function of wavelength, we model the color excesses toward SN 2014J, which are observationally derived over a wide wavelength range in terms of dust models consisting of a mixture of silicate and graphite. The resulting extinction laws steeply rise toward the far ultraviolet, even steeper than that of the Small Magellanic Cloud (SMC). We infer a visual extinction of , a reddening of , and a total-to-selective extinction ratio of 1.7, consistent with that previously derived from photometric, spectroscopic, and polarimetric observations. The size distributions of the dust in the interstellar medium toward SN 2014J are skewed toward substantially smaller grains than that of the Milky Way and the SMC.
Subject headings:
dust, extinction — galaxies: ISM — galaxies: individual (Messier 82) — supernovae: individual (SN 2014J)1. Introduction
Type Ia supernovae (SNe Ia) are considered to be one of the most precise tools for determining astronomical distances (Howell, 2011). Because of their high luminosity and relatively small dispersion at the maxima of their bolometric light curves, they are commonly utilized as cosmological “standardizable candles”. The accelerated expansion of the Universe and the presence of dark energy were discovered through SNe Ia used as standardizable candles (Riess et al., 1998; Perlmutter et al., 1999). The effectiveness of SNe Ia as distance indicators and standard candles is hampered by the systematic uncertainties related to their explosion mechanism and progenitor systems, and more importantly, the line-of-sight extinction. The distance measured in parsec to a SN is , where and are its apparent and absolute magnitudes at wavelength , and is the extinction. As it is not easy to directly measure , one often measures the color excess (or reddening) , where is the extinction in the V-band (centered around ). SN reddening is often measured by comparing the observed SN colors to a zero-reddening locus.
Cardelli et al. (1989; CCM) found that the Galactic extinction curves (or extinction laws) — the wavelength dependencies of the extinction — can be closely parametrized by the total-to-selective extinction ratio , where the B-band centers around (also see Fitzpatrick, 1999, hereafter FTZ). Astronomers often derive for SNe Ia by fitting the observed with the -based CCM formula. Once is determined, one can apply the CCM-formula (or some other parameterizations) to derive . However, we caution that the CCM- and FTZ-parameterizations have been derived for Galactic sightlines with , and may not be valid for external galaxies. Note that the CCM formula is not even applicable to the Large and Small Magellanic Clouds (LMC, SMC; Gordon et al., 2003).
SNe Ia are so rare that nearby SNe Ia () are detected only about once a decade. SN 2014J, discovered in the nearby starburst galaxy M82 at a distance of (Dalcanton et al., 2009), is the nearest SN Ia seen in the last three decades. Its proximity offers an unprecedented opportunity to study the extinction and reddening toward a SN Ia. The aim of this Letter is to derive and by fitting the reddening curve obtained by Amanullah et al. (2014) during the epoch range of days around its peak brightness (§2) using the silicate-graphite model (§3). The results are presented in §3, discussed in §4, and summarized in §5.
2. Color-Excess Curves of SN 2014J
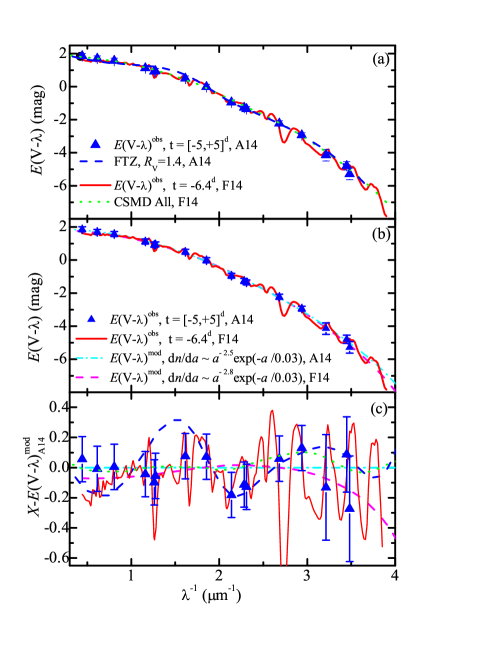
Various studies have been carried out to determine the value for the sightline toward SN 2014J (e.g., see Amanullah et al., 2014; Foley et al., 2014; Goobar et al., 2014; Marion et al., 2015; Welty et al., 2014). More specifically, based on the UV to near-IR photometry of SN 2014J obtained with the WFC3 filters aboard the Hubble Space Telescope (HST) and ground-based telescopes, Amanullah et al. (2014, hereafter A14) determined the reddening curve for SN 2014J over a wide wavelength range by comparing the colors of SN 2014J with that of SN 2011fe, a reddening-free SN Ia. They derived by fitting the observationally determined with three template extinction laws: an MW-type law as parameterized by CCM or FTZ (see Figure 1a), a third-order polynomial SALT2 law (see Betoule et al., 2014), and a power-law parameterization which was shown to be a good approximation for multiple scattering scenarios (Goobar, 2008).
We note that A14 shifted the effective wavelengths of the HST/WFC3 filters (see their Figure 3). In the following, we adopt the wavelength-shifted color-excess data of A14.
Foley et al. (2014, hereafter F14) determined the extinction curve toward SN 2014J at by comparing the UV/near-IR SED of SN 2014J with that of SN 2011fe. As shown in Figure 1, the color-excess curve of F14 closely resembles that of A14. The difference between the F14 curve and that of A14, on average, is 0.19 (see Figure 1c). Using FTZ and CCM models, F14 derived and for SN 2014J, respectively. F14 also argued that a two-component model (CSMD) with both a circumstellar scattering component of and an FTZ interstellar reddening component of could best account for the observed properties of SN 2014J.
3. Dust Model
We consider the silicate-graphite grain model that consists of amorphous silicate and graphite (Draine & Lee, 1984). We adopt the same exponentially cutoff power-law size distribution for both components: for the size range of , where is the spherical radius of the dust, is the number density of H nuclei, is the number density of dust of type with radii in the interval [, ], and are, respectively, the power index and exponential cutoff size, and is a constant related to the total amount of dust of type . The total extinction at wavelength is given by
| (1) |
where the summation is over the two grain types, () is the H column (number) density, and is the extinction cross section of grain type of size at wavelength calculated from Mie theory using the optical constants of Draine & Lee (1984).
For a given set of parameters and , we derive the constant from the abundances of the dust-forming elements. Let be the total interstellar abundance of element X (i.e., Fe, Mg, Si, O, and C) relative to H in the interstellar medium (ISM) of M82, be the amount of X in the gas phase, be the amount of X contained in dust (obviously, = ), and be the atomic weight of X. Let and , respectively, be the mass density of amorphous silicate and graphite. For a chosen set of dust depletions, we derive from the dust size distributions:
| (2) |
| (3) |
where we assume a stoichiometric composition of Mg2xFe2(1-x)SiO4 for amorphous silicate.
M82 is a prototypical starburst galaxy, experiencing a major star formation episode in its nuclear region, with strong superwind and SN activity. Origlia et al. (2004) obtained the stellar abundances in the nuclear region of M82, and compared them with those of the hot gas derived from the nuclear X-ray spectra. Compared with the solar abundance of Grevesse & Sauval (1998), both the cool stars and the hot gas in M82 suggest a reduction of Fe/H by dex (i.e., ) and an overall and enhancement by 0.4 and 0.5 dex, respectively (i.e., , ). Oxygen is enhanced by 0.3 dex in stars and reduced by 0.2 dex in the hot gas.111An accurate knowledge of the O/H abundance is not required. The amount of O/H locked up in dust is controlled by Si/H: for a silicate composition of Mg2xFe2(1-x)SiO4. The stellar abundance of C derived by Origlia et al. (2004) is only 1/4 of solar (i.e., ).
Similar to the Galactic ISM, we assume in M82 that Fe, Mg and Si are all locked up in silicate dust (i.e., , , ; Origlia et al. 2004). For carbon, it is less clear. In the Galactic ISM, a substantial fraction ()222We take the Galactic interstellar carbon abundance to be solar: (Grevesse & Sauval, 1998). of the total carbon abundance is in the gas phase (, Cardelli et al. 1996). For carbon dust (i.e., graphite) in M82, we will consider three cases (i.e., all C is locked up in dust), , and (i.e., all C is in the gas phase and the dust model only consists of amorphous silicate). With , the model has a silicate-to-graphite mass ratio of . This is close to that of the SMC (, Li et al. 2006).
To facilitate a direct comparison with the color excesses derived by A14 for SN 2014J, we first calculate from Eq.1 and then convert to reddening . For simplicity, the model color-excess has not been convolved with the HST/WFC3 filters. We evaluate the goodness of fitting by
| (4) |
where is the observed color excess toward SN 2014J at wavelength derived by A14, is the uncertainty of , is the model color excess at , is the number of observational data points, and is the number of adjustable parameters.
| aafootnotemark: | |||||||||
| (ppm) | () | () | () | () | () | () | |||
| 83.2 | 2.5 | 0.03 | 1.3 | 0.45 | 1.1 | 1.9 | 1.7 | ||
| 41.6 | 3.2 | 0.05 | 1.9 | 0.47 | 1.1 | 1.9 | 1.8 | ||
| 0 | 0 | 3.7 | 0.09 | 3.3 | 0.53 | 1.1 | 1.9 | 1.7 | |
| 83.2bbfootnotemark: | 3.1 | 0.05 | 1.6 | 0.51 | 1.1 | 2.0 | 1.8 | ||
| 41.6bbfootnotemark: | 3.3 | 0.06 | 2.1 | 0.51 | 1.1 | 1.9 | 1.8 | ||
| 83.2ccfootnotemark: | 2.4 | 0.03 | 1.3 | 0.43 | 1.1 | 1.9 | 1.7 | ||
| 83.2ddfootnotemark: | 2.8 | 0.03 | 1.5 | 2.96 | 1.1 | 1.9 | 1.7 |
4. Results
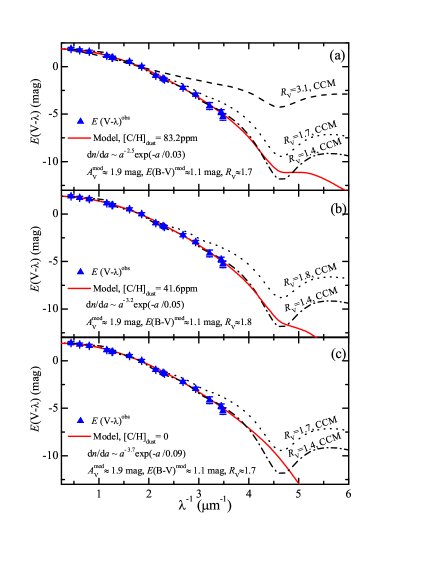
In fitting the color excesses of SN 2014J observationally determined by A14, we have three parameters (i.e., ): , , and . As shown in Figure 2, excellent fits to the observed color excesses can be achieved by varying and for a given (see Table 1).
The best-fit models derive , , and 1.7. The reddening and are consistent with those reported earlier, i.e., 0.8–1.3 and 1.8–2.0 (Amanullah et al., 2014; Ashall et al., 2014; Foley et al., 2014; Goobar et al., 2014; Welty et al., 2014), while the model values are somewhat larger than most of the earlier results, i.e., 1.4 (Amanullah et al., 2014; Brown et al., 2015; Goobar et al., 2014; Marion et al., 2015).
The best-fit models suggest 1.3–3.3 for the sightline toward SN 2014J, somewhat higher than that of the hot gas in M82, , derived from Chandra observations (Origlia et al., 2004).
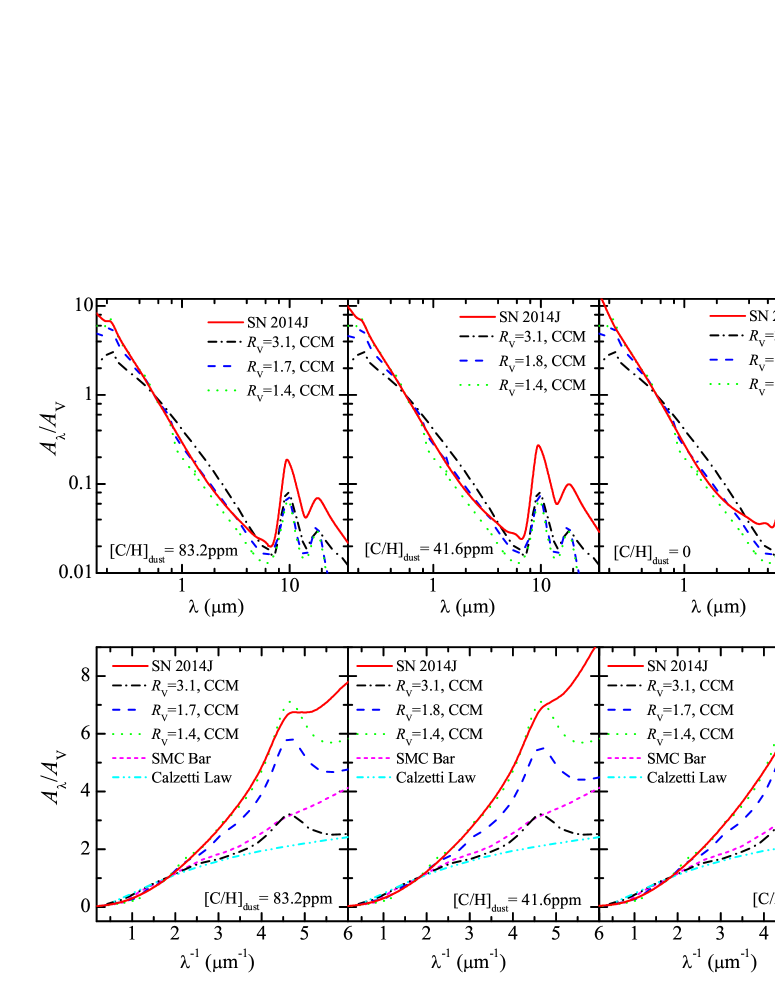
In Figure 3, we show the best-fit models shown in Figure 2 in terms of . For comparison, we also show the CCM reddening curve of = 1.4, the average extinction curves for the MW () and the SMC bar. The model extinction laws for SN 2014J all exhibit a rapid far-UV rise which is even much steeper than that of the SMC bar. Unlike the SMC bar, the SN 2014J extinction laws display an appreciable extinction bump at 2175 for . We also show in Figure 3 the extinction curves predicted from the CCM formula with the corresponding model-derived values (i.e., 1.7, 1.8). It is seen that they substantially differ from that calculated from the dust models.
As mentioned in §2, A14 shifted the effective wavelengths of the HST/WFC3 filters, especially for the bluest F218W and F225W bands, which are highly dependent on the SN spectrum and the reddening law. To examine the effects of the wavelength-shifts, we have also modeled the observed color-excess curve of A14 by excluding the F218W and F225W data points (which could be most affected). The results do not show any appreciable differences (see Table 1). We have also modeled the F14 curve (at ). As shown in Figure 1b and Table 1, the model extinction curves and the resulting and are very close to that derived from the A14 curve. Figure 1c shows the differences between the best-fit model color-excesses for A14 and that of the FTZ model for A14, the CSMD model for F14, as well as the best-fit model for F14. They are generally within the observational uncertainties. However, as shown in Figure 2, the model extinction at differs considerably from the CCM parameterization. The latter is known to be invalid for extragalactic sightlines.
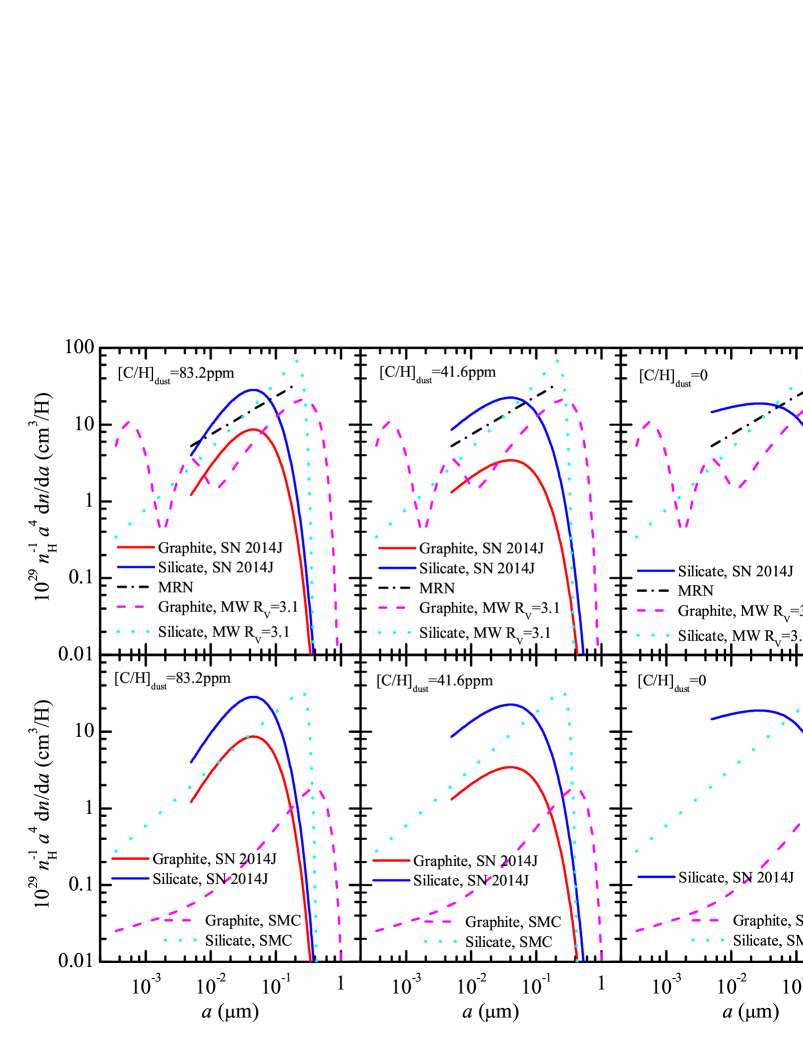
In Figure 4 we show the dust size distributions derived from the models with = 83.2, 41.6 and 0. Compared with that of the MW average of [Mathis et al. 1977 (hereafter MRN); Weingartner & Draine 2001 (hereafter WD01)], the size distributions of the dust in the ISM toward SN 2014J are skewed toward substantially smaller grains. The MRN size distribution is a power-law in the size range of for both dust components. The WD01 size distributions extend the lower cutoff size to with the smallest grains () constrained by the near- and mid-IR emission (see Li & Draine 2001). The dust model presented here for SN 2014J assumes since the UV extinction cannot constrain the exact size of nano-sized dust (see Li 2004).
5. Discussion
5.1. The Extinction Curves
The host galaxy of SN 2014J, M82, is regarded as one of the archetypical starburst and superwind galaxies. Calzetti et al. (1994) derived the internal dust extinction in starbursts from their overall emission spectra. The inferred attenuation curve is much flatter than that derived for SN 2014J (see Figure 3). While the SN 2014J model extinction curves for exhibit an appreciable bump at 2175 (e.g., for the model), the starburst attenuation curve shows no evidence for the 2175 bump. It is not clear to what extent the flatness of the apparent starburst attenuation curve may be due to the effects of radiative transfer in optically thick distributions of stars and dust.
Hutton et al. (2014) analyzed the UV images of M82 taken by the UV/Optical Telescope (UVOT) on board Swift. The color-color diagram obtained with the UVW2 (2033), UVM2 (2229), and UVW1 (2591) filters is especially sensitive to the presence of the 2175 bump. They examined the color-color diagram and argued against a “bump-less” Calzetti-type law.
In the silicate-graphite model presented here, the 2175 extinction bump is produced by small graphite dust. If we consider amorphous carbon (Rouleau & Martin, 1991) instead of graphite, the bump will be absent. Excellent fits can also be obtained from a mixture of silicate and amorphous carbon (see Table 1). Unfortunately, neither the A14 color-excess data points nor the F14 extinction curve covered the 2175 bump. Due to the lack of spectral features (e.g., the 2175 bump), we are not able to constrain the exact composition and quantity of the carbon dust component (see Table 1).
The extinction laws derived for SN 2014J are even steeper than that of the SMC bar (see Figure 3); correspondingly, the dust sizes of SN 2014J are smaller than that of the SMC bar (see Figure 4). This may be related to the intense UV radiation and shocks associated with star formation in M82 that could destroy the dust and lead to a predominance of small grains.
In addition to the 2175 bump, the models presented here also predict two absorption features around 9.7 and 18 arising from amorphous silicate (see Figure 3). Depending on , the optical depth of the 9.7 feature () ranges from 0.34 to 0.86. Beirão et al. (2008) reported the detection of the 9.7 feature in the Spitzer/IRS spectra of the central region of M82, with an optical depth of 0.3–3.1. Telesco et al. (2015) obtained the 8–13 mid-IR spectra of SN 2014J at 57 to 137 days after explosion and did not detect the 9.7 feature.
5.2.
It is often suggested that the extinction laws toward SNe Ia are “non-standard” or “unusual” in the sense that unlike the MW mean value of , SNe Ia often have a much smaller (see Figure 3 of Howell 2011), indicating steep UV extinction.
There are several examples of highly reddened SNe Ia for which can be measured directly. They all have (e.g., Krisciunas et al., 2006; Elias-Rosa et al., 2006, 2008; Nobili & Goobar, 2008; Wang et al., 2008; Folatelli et al., 2010). However, many low reddened [] ones have values close to that of the MW (Mandel et al., 2011; Phillips, 2012). On the other hand, statistical studies of large samples of SNe Ia have found (e.g., Nobili et al., 2005; Guy et al., 2005; Hicken et al., 2009; Folatelli et al., 2010; Burns et al., 2011).333However, it has also been suggested that the low values of derived from large samples may partly result from the poor assumptions about the intrinsic color distribution of SNe Ia (e.g., see Foley et al., 2011; Mandel et al., 2011). Betoule et al. (2014) analyzed 740 low- and high- SNe Ia and yields .
Many lines of evidence show that the reddening law to SN 2014J has a low value of (see §4). Patat et al. (2015) and Kawabata et al. (2014) presented spectropolarimetric and optical/near-IR multi-band polarimetric observations of SN 2014J and both indicated a low value of . However, relatively larger values have also been suggested for SN 2014J. Using the equivalent widths of 10 diffuse interstellar bands, Welty et al. (2014) yielded and for SN 2014J.
The extinction curves and values derived here for SN 2014J are based on detailed dust modeling of the observed color excesses. They are generally consistent with previous studies of for SN 2014J. However, we caution the use of to derive an extinction law for SN 2014J (or any extragalactic sightlines) since, as demonstrated in Figure 3, the model extinction curves differ substantially from that calculated from the CCM formula.
5.3. Interstellar or Circumstellar?
It has been suggested that multiple scattering by circumstellar dust surrounding their progenitors could explain the non-standard reddening observed in the lines of sight to SNe Ia (Wang, 2005; Goobar, 2008; Amanullah & Goobar, 2011). However, F14 argued that the wide range of observed properties for SN 2014J may be caused by a combination of interstellar reddening and scattering off circumstellar material. Johansson et al. (2014) analyzed the 3.6 and 4.5 Spitzer/IRAC data of SN 2014J and detected no significant IR excess. They hence placed an upper limit of on the pre-existing dust in the circumstellar environment of SN 2014J. This is insufficient to account for the observed non-standard reddening. Moreover, Brown et al. (2015) analyzed the light curves and color evolution obtained with Swift/UVOT. They argued that these observations are inconsistent with a contribution scattered into the line of sight by circumstellar dust.
6. Conclusions
The extinction toward SN 2014J in M82 is derived as a function of wavelength from fitting the observed color excesses with a mixture of silicate and graphite or amorphous carbon dust. Insensitive to the exact carbon dust composition and quantity, the model derives , , and 1.7, generally consistent with those reported in the literature.
| Band | |||||
|---|---|---|---|---|---|
| () | () | (cmH) | () | (cmH) | |
| Ly edge | 0.091 | 39.87 | 2.06 | 29.32 | 2.22 |
| Ly | 0.122 | 29.40 | 1.52 | 22.85 | 1.73 |
| UVW2/UVOT | 0.203 | 13.87 | 7.16 | 13.09 | 9.92 |
| UVM2/UVOT | 0.223 | 12.53 | 6.47 | 12.44 | 9.43 |
| UVW1/UVOT | 0.259 | 8.64 | 4.46 | 8.63 | 6.54 |
| F225W/HST | 0.287 | 6.98 | 3.60 | 6.96 | 5.28 |
| F275W/HST | 0.290 | 6.84 | 3.53 | 6.82 | 5.17 |
| F218W/HST | 0.311 | 5.97 | 3.08 | 5.96 | 4.52 |
| F336W/HST | 0.340 | 5.03 | 2.59 | 5.02 | 3.81 |
| u/SDSS | 0.355 | 4.63 | 2.39 | 4.62 | 3.50 |
| U | 0.365 | 4.39 | 2.27 | 4.39 | 3.33 |
| F438W/HST | 0.433 | 3.15 | 1.63 | 3.16 | 2.40 |
| B | 0.440 | 3.06 | 1.58 | 3.06 | 2.32 |
| F467M/HST | 0.468 | 2.70 | 1.39 | 2.71 | 2.05 |
| g/SDSS | 0.469 | 2.69 | 1.39 | 2.70 | 2.05 |
| V | 0.550 | 1.94 | 1.00 | 1.94 | 1.47 |
| F555W/HST | 0.550 | 1.94 | 1.00 | 1.94 | 1.47 |
| r/SDSS | 0.617 | 1.54 | 7.93 | 1.53 | 1.16 |
| F631N/HST | 0.630 | 1.48 | 7.62 | 1.47 | 1.12 |
| R | 0.700 | 1.19 | 6.13 | 1.18 | 8.98 |
| i/SDSS | 0.748 | 1.04 | 5.35 | 1.03 | 7.82 |
| F814W/HST | 0.792 | 0.92 | 4.75 | 0.92 | 6.95 |
| F845M/HST | 0.863 | 0.77 | 3.99 | 0.77 | 5.83 |
| z/SDSS | 0.893 | 0.72 | 3.72 | 0.72 | 5.44 |
| I | 0.900 | 0.71 | 3.66 | 0.71 | 5.35 |
| J/2MASS | 1.235 | 0.38 | 1.94 | 0.37 | 2.82 |
| H/2MASS | 1.662 | 0.22 | 1.14 | 0.22 | 1.64 |
| Ks/2MASS | 2.159 | 0.15 | 7.53 | 0.14 | 1.07 |
| W1/WISE | 3.353 | 0.08 | 4.32 | 0.08 | 5.83 |
| L | 3.450 | 0.08 | 4.18 | 0.07 | 5.63 |
| /IRAC | 3.545 | 0.08 | 4.06 | 0.07 | 5.45 |
| /IRAC | 4.442 | 0.06 | 3.18 | 0.05 | 4.13 |
| W2/WISE | 4.603 | 0.06 | 3.07 | 0.05 | 3.97 |
| M | 4.800 | 0.06 | 2.96 | 0.05 | 3.81 |
| /IRAC | 5.675 | 0.05 | 2.78 | 0.05 | 3.42 |
| /IRAC | 7.760 | 0.10 | 5.20 | 0.07 | 5.60 |
| N | 10.600 | 0.40 | 2.06 | 0.28 | 2.08 |
| W3/WISE | 11.561 | 0.27 | 1.40 | 0.19 | 1.42 |
| Q | 21.000 | 0.16 | 8.10 | 0.11 | 8.34 |
| W4/WISE | 22.088 | 0.14 | 7.21 | 0.10 | 7.47 |
References
- Amanullah & Goobar (2011) Amanullah, R., & Goobar, A. 2011, ApJ, 735, 20
- Amanullah et al. (2014) Amanullah, R., Goobar, A., Johansson, J., et al. 2014, ApJ, 788, L21
- Ashall et al. (2014) Ashall, C., Mazzali, P., Bersier, D., Hachinger, S., Phillips, M., Percival, S., James, P., & Maguire, K. 2014, MNRAS, 445, 4424
- Beirão et al. (2008) Beirão, P., Brandl, B. R., Appleton, P. N., et al. 2008, ApJ, 676, 304
- Betoule et al. (2014) Betoule, M., Kessler, R., Guy, J., et al. 2014, A&A, 568, A22
- Brown et al. (2015) Brown, P. J., Smitka, M. T., Wang, L., et al. 2015, ApJ, 805, 74
- Burns et al. (2011) Burns, C. R., Stritzinger, M., Phillips, M. M., et al. 2011, AJ, 141, 19
- Calzetti et al. (1994) Calzetti, D., Kinney, A. L., & Storchi-Bergmann, T. 1994, ApJ, 429, 582
- Cardelli et al. (1989) Cardelli, J. A., Clayton, G. C., & Mathis, J. S. 1989, ApJ, 345, 245
- Cardelli et al. (1996) Cardelli, J. A., Meyer, D. M., Jura, M., & Savage, B. D. 1996, ApJ, 467, 334
- Dalcanton et al. (2009) Dalcanton, J. J., Williams, B. F., Seth, A. C., et al. 2009, ApJS, 183, 67
- Draine & Lee (1984) Draine, B. T., & Lee, H. M. 1984, ApJ, 285, 89
- Elias-Rosa et al. (2006) Elias-Rosa, N., Benetti, S., Cappellaro, E., et al. 2006, MNRAS, 369, 1880
- Elias-Rosa et al. (2008) Elias-Rosa, N., Benetti, S., Turatto, M., et al. 2008, MNRAS, 384, 107
- Fitzpatrick (1999) Fitzpatrick, E. L. 1999, PASP, 111, 63
- Folatelli et al. (2010) Folatelli, G., Phillips, M. M., Burns, C. R., et al. 2010, AJ, 139, 120
- Foley et al. (2011) Foley, R. J., Sanders, N. E., & Kirshner, R. P. 2011, ApJ, 742, 89
- Foley et al. (2014) Foley, R. J., Fox, O. D., McCully, C., et al. 2014, MNRAS, 443, 2887
- Goobar (2008) Goobar, A. 2008, ApJ, 686, L103
- Goobar et al. (2014) Goobar, A., Johansson, J., Amanullah, R., et al. 2014, ApJ, 784, L12
- Gordon et al. (2003) Gordon, K. D., Clayton, G. C., Misselt, K. A., Landolt, A. U., & Wolff, M. J. 2003, ApJ, 594, 279
- Grevesse & Sauval (1998) Grevesse, N., & Sauval, A. J. 1998, Space Sci. Rev., 85, 161
- Guy et al. (2005) Guy, J., Astier, P., Nobili, S., Regnault, N., & Pain, R. 2005, A&A, 443, 781
- Hicken et al. (2009) Hicken, M., Challis, P., Jha, S., et al. 2009, ApJ, 700, 331
- Howell (2011) Howell, D. A. 2011, Nature Communications, 2, 350
- Hutton et al. (2014) Hutton, S., Ferreras, I., Wu, K., Kuin, P., Breeveld, A., Yershov, V., Cropper, M., & Page, M. 2014, MNRAS, 440, 150
- Johansson et al. (2014) Johansson, J., Goobar, A., Kasliwal, M. M., et al. 2014, arXiv:1411.3332
- Kawabata et al. (2014) Kawabata, K. S., Akitaya, H., Yamanaka, M., et al. 2014, ApJ, 795, L4
- Krisciunas et al. (2006) Krisciunas, K., Prieto, J. L., Garnavich, P. M., Riley, J.-L. G., Rest, A., Stubbs, C., & McMillan, R. 2006, AJ, 131, 1639
- Li (2004) Li, A. 2004, in Astrophysics of Dust, Witt, A.N., Clayton, G.C., & Draine, B.T. (eds.), ASP Conf. Ser., 309, 417
- Li & Draine (2001) Li, A., & Draine, B. T. 2001, ApJ, 554, 778
- Li et al. (2006) Li, A., Misselt, K. A., & Wang, Y. J. 2006, ApJ, 640, L151
- Mandel et al. (2011) Mandel, K. S., Narayan, G., & Kirshner, R. P. 2011, ApJ, 731, 120
- Marion et al. (2015) Marion, G. H., Sand, D. J., Hsiao, E. Y., et al. 2015, ApJ, 798, 39
- Mathis et al. (1977) Mathis, J. S., Rumpl, W., & Nordsieck, K. H. 1977, ApJ, 217, 425 (MRN)
- Nobili & Goobar (2008) Nobili, S., & Goobar, A. 2008, A&A, 487, 19
- Nobili et al. (2005) Nobili, S., Amanullah, R., Garavini, G., et al. 2005, A&A, 437, 789
- Origlia et al. (2004) Origlia, L., Ranalli, P., Comastri, A., & Maiolino, R. 2004, ApJ, 606, 862
- Patat et al. (2015) Patat, F., Taubenberger, S., Cox, N. L. J., et al. 2015, A&A, 577, A53
- Perlmutter et al. (1999) Perlmutter, S., Aldering, G., Goldhaber, G., et al. 1999, ApJ, 517, 565
- Phillips (2012) Phillips, M. M. 2012, PASA, 29, 434
- Riess et al. (1998) Riess, A. G., Filippenko, A. V., Challis, P., et al. 1998, AJ, 116, 1009
- Rouleau & Martin (1991) Rouleau, F., & Martin, P. G. 1991, ApJ, 377, 526
- Telesco et al. (2015) Telesco, C. M., Höflich, P., Li, D., et al. 2015, ApJ, 798, 93
- Wang (2005) Wang, L. 2005, ApJ, 635, L33
- Wang et al. (2008) Wang, X., Li, W., Filippenko, A. V., et al. 2008, ApJ, 675, 626
- Weingartner & Draine (2001) Weingartner, J. C., & Draine, B. T. 2001, ApJ, 548, 296 (WD01)
- Welty et al. (2014) Welty, D. E., Ritchey, A. M., Dahlstrom, J. A., & York, D. G. 2014, ApJ, 792, 106