On the [CII]-SFR relation in high redshift galaxies
Abstract
After two ALMA observing cycles, only a handful of [C ] emission line searches in galaxies have reported a positive detection, questioning the applicability of the local [C ]-SFR relation to high- systems. To investigate this issue we use the Vallini et al. (2013, V13) model, based on high-resolution, radiative transfer cosmological simulations to predict the [C ] emission from the interstellar medium of a (halo mass ) galaxy. We improve the V13 model by including (a) a physically-motivated metallicity () distribution of the gas, (b) the contribution of Photo-Dissociation Regions (PDRs), (c) the effects of Cosmic Microwave Background on the [C ] line luminosity. We study the relative contribution of diffuse neutral gas to the total [C ] emission () for different SFR and values. We find that the [C ] emission arises predominantly from PDRs: regardless of the galaxy properties, % since, at these early epochs, the CMB temperature approaches the spin temperature of the [C ] transition in the cold neutral medium ( K). Our model predicts a high- [C ]-SFR relation consistent with observations of local dwarf galaxies (). The [C ] deficit suggested by actual data ( in BDF3299 at ) if confirmed by deeper ALMA observations, can be ascribed to negative stellar feedback disrupting molecular clouds around star formation sites. The deviation from the local [C ]-SFR would then imply a modified Kennicutt-Schmidt relation in galaxies. Alternatively/in addition, the deficit might be explained by low gas metallicities ().
Subject headings:
galaxies:high-redshift, galaxies:ism, cosmology:theory, submillimeter:ism, line:formation, cosmology:observations1. Introduction
The study and characterization of the interstellar medium (ISM) of galaxies that formed in the early Universe is entering a golden era thanks to the unprecedented capabilities of the Atacama Large Millimeter-submillimeter Array (ALMA). In particular, the emission line due to the fine-structure transition of ionized carbon ([C ]), being the dominant coolant of the neutral diffuse ISM (Wolfire et al., 2003), is by far the brightest line in the far-infrared band (Stacey et al., 1991). In addition to the diffuse neutral gas, the [C ] line can be excited in other components of the interstellar medium such as high density photodissociation regions (PDRs), and in the diffuse ionized gas, where the main driver of the [C ] emissivity are the collisions with free . Although precisely assessing the relative contribution of the various gas phases to the total line emission might be difficult, [C ] line remains an exquisite proxy to characterize the ISM of galaxies that formed during the Epoch of Reionization (EoR; ) (e.g Carilli & Walter, 2013). Before the ALMA advent, the [C ] line from was solely detected in galaxies with extreme star formation rates (SFRs) (1000 M) (e.g. Cox et al., 2011; Carilli et al., 2013; Carniani et al., 2013; De Breuck et al., 2014), or in those hosting Active Galactic Nuclei (AGN) (e.g. Maiolino et al., 2005; Venemans et al., 2012; Gallerani et al., 2012; Cicone et al., 2015).
In the first years of ALMA operations, the [C ] emission line has been detected in a handful of galaxies with modest star formation rates () at , i.e. approximately after the end of the EoR (Carilli et al., 2013; Carniani et al., 2013; Williams et al., 2014; Riechers et al., 2014). Viceversa, other tentative searches of this line have failed in normal star-forming galaxies (NSFGs; SFR 10 M) at the end of Epoch of Reionization () (e.g. Walter et al., 2012; Kanekar et al., 2013; González-López et al., 2014; Ouchi et al., 2013; Ota et al., 2014; Schaerer et al., 2015). These early results seemed to be at odds with the correlation between the intensity of the [C ] line and the SFR observed in local galaxies (De Looze et al., 2011, 2014), thus questioning its applicability to sources at . Only very recently, three different ALMA campaigns targeting Lyman Alpha Emitters (LAEs) and Lyman Break Galaxies (LBGs) have yielded [C ] detections: Maiolino et al. (2015) in the vicinity of BDF3299, a LAE at , Capak et al. (2015) in a sample of LAEs at , and Willott et al. (2015) in two luminous LBGs at , being in agreement with the [C ] luminosity expected from lower- observations in star forming galaxies.
In the nearby Universe, the [C ]-SFR relation holds for a wide range of galaxy types, ranging from metal poor dwarf galaxies, to starbursts, ultra-luminous infrared galaxies, and AGN hosting galaxies (Boselli et al., 2002; De Looze et al., 2011; Sargsyan et al., 2012; De Looze et al., 2014; Pineda et al., 2014; Herrera-Camus et al., 2015). The [C ] emission from PDRs is primarily due to the far-ultraviolet (FUV) radiation produced by OB stars that form in the vicinity of the photodissociation regions (Hollenbach & Tielens, 1999). The relation between SFR and the [C ] luminosity in the neutral diffuse gas is more subtle. On the one hand, the [C ] emissivity is proportional to the gas heating due to the photoelectric effect on dust grains, namely to the intensity of the FUV radiation (Wolfire et al., 2003; Herrera-Camus et al., 2015). On the other hand, an increasing FUV radiation reduces the relative abundance of the cold neutral medium (CNM) with respect to the warm neutral medium (WNM), thus reducing the [C ] luminosity (Vallini et al., 2013). Observational studies have found that, in the plane of the Galaxy, the [C ] emission is mostly associated with dense PDRs (Pineda et al., 2013). On the contrary, in low metallicity local dwarf galaxies (e.g. Haro 11, Cormier et al., 2012), nearby galaxies (e.g. M51 and M31, Kramer et al., 2013; Parkin et al., 2013; Kapala et al., 2015) and the outskirts of the Milky Way (Langer et al., 2014) the PDR contribution can be as small as . The [C ]-SFR relation in these cases is shallower than that of starburst galaxies (De Looze et al., 2014).
From a theoretical point of view the intensity of the [C ] line from high- galaxies has been computed both through numerical simulations (e.g Nagamine et al., 2006) and semi-analytical models (e.g. Gong et al., 2012; Muñoz & Furlanetto, 2014; Popping et al., 2014). Recently Olsen et al. (2015) present a multi-phased ISM model consisting of molecular clouds, embedded within a cold neutral medium of atomic gas, and hot, partly ionized gas. The model, applied on top of a cosmological SPH simulation of massive star-forming galaxies on the main-sequence at , self-consistently calculates the relative contribution of the various phases to the [C ] emission.
In the previous paper of this series Vallini et al. (2013) (hereafter, V13) computed the [C ] emission arising from the neutral diffuse gas of a single prototypical high- () galaxy, extracted from a SPH cosmological simulation, further implemented with radiative transfer calculation. This is crucial to model the intensity of the galaxy internal UV field and the consequent gas ionization structure. The calculation of the [C ] emission is performed thanks to a sub-grid model describing the thermal equilibrium of the cold and warm neutral medium as a function of the FUV radiation field intensity within the galaxy. The spatial resolution () allows to properly describe the ISM small-scale density structure. Here we present an updated version of the V13 model that allows us to also compute the [C ] emission arising from the clumpy molecular gas, and the effect of the increased CMB temperature on the [C ] observability. The aim is to finally assess whether the local [C ]-SFR relation holds at high-, and what we can learn from any deviation from it.
2. Modelling [C ] emission
In this Section, we first summarize the main characteristics of the V13 model, referring the interested reader to V13 for further details. Next, we describe the additional features implemented by this work.
2.1. The V13 model
We run GADGET-2 (Springel, 2005) cosmological SPH hydrodynamic simulations of a comoving volume with a mass resolution of 1.32 (6.68) for baryons (dark matter). We take a snapshot at redshift , identify the most massive halo (total mass , kpc), and we select a comoving volume around the center of the halo. We post-process our simulations with the UV radiative transfer (RT) code LICORICE. Gas properties are resolved on a fixed grid with a resolution of 60 pc. We complement the simulation with a sub-grid model taking into account the cooling and heating processes producing a multi-phase thermal ISM structure (Wolfire et al., 1995, 2003). According to this model, the neutral gas in the ISM is constituted by a two-phase medium in which the cold neutral medium (CNM) and the warm neutral medium (WNM) are in pressure equilibrium. The relative abundance of these two components depends on (i) the gas metallicity, , determining the coolants abundance, and (ii) the FUV flux, , in the Habing () band, controlling the photoelectric heating produced by dust grains. The value of scales with SFR and is calculated as:
| (1) |
where is the number of sources, is the positions, is the monochromatic luminosity per source. We compute by using STARBURST99 template Leitherer et al. (1999), assuming continuous star formation (SF), an age for the stellar population111We keep fixed the original assumption of V13 in which a continuous SF with an age of for the stellar population was based on the Himiko SED fitting presented in Ouchi et al. (2009, 2013). This scenario have been recently confirmed Zabl et al. (2015) and Schaerer et al. (2015) that, when adopting continuous/exponential rising (declining) star formation histories for Himiko, obtain age of the stellar population in the range (Zabl et al., 2015), and (Schaerer et al., 2015) and setting the metallicity accordingly to the cell value (see Sec.2.2). In this work we explore the range SFR. For each value of the star formation rate and metallicity we run the V13 sub-grid model computing the expected distribution of the cold and warm diffuse gas within the galaxy.
We calculate the [C ] emissivity through Eq. (3) of V13. We note that this equation is valid under the assumption that the density of the colliding species (electrons and hydrogen atoms) is much lower than their corresponding critical densities222The critical density for collision with neutral hydrogen atoms (or with ) has been computed at K, a value consistent with the CNM temperature. and that no external radiation field is present. While the first assumption is justified by the fact that in our simulation and , in Sec. 2.3 we investigate whether the CMB may affect the intensity of the [C ] emission. As pointed out in V13, the CNM accounts for of the total [C ] emission arising from the diffuse neutral medium. Given this result, we refer to the diffuse medium as CNM.
2.2. Metallicity
The V13 model assumes that metals are uniformly distributed within the galaxy. Hereafter, we refer to models with a uniform metallicity distribution as333For example, we indicate with C02 a model in which a uniform is imposed. “C-models”. In this work, we also consider the possibility that the distribution of metals follows the density distribution, by relating to the baryonic overdensity of each cell , where is the gas density in the cell and is the critical density at redshift . This is in agreement with the parametrization adopted by Keating et al. (2014) to describe the circumgalactic medium of high- galaxies, and with the results presented in Pallottini et al. (2014a, P14) that has been applied to our galaxy.
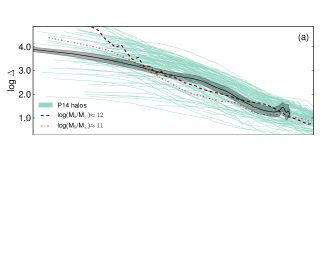
P14 use a customized version of the adaptive mesh refinement code RAMSES (Teyssier, 2002) in order to investigate the metal enrichment of high- galaxies. In P14 star formation is included via subgrid prescriptions, and supernovae feedback is accounted by implementing a metal-dependent parameterization of stellar yields and return fractions based on population synthesized models. The P14 galaxy sample reproduces the observed cosmic star formation rate (Bouwens et al., 2012; Zheng et al., 2012) and stellar mass densities (González et al., 2011) evolution in the redshift range . In the upper panel of Fig. 1 we plot the radial profile of the baryonic overdensity () and its r.m.s. fluctuation of our simulated galaxy. We test the profile with a sample of galaxies extracted from P14 (see also Pallottini et al. 2014b, in particular Fig. 1, upper panel). Among the P14 galaxies, with solid dashed/dot-dashed lines we highlight two galaxy hosted in dark matter halo with mass and , respectively. This is comparable to the dark matter halo mass of the galaxy adopted in this work ().
In particular, P14 found a tight correlation between and for , namely for overdensities typical of galaxy outskirts/ISM. While in the IGM () the metallicity is only weakly correlated with , in the ISM () the relation is tight. This is due to the fact that the most overdense regions denote the location in which stars form, and that are therefore more efficiently polluted with metals. We fit the relation provided in their paper and we normalize the relation to the mean metallicity over the galaxy, i.e. over those cells whose overdensity is . Hereafter, we refer to models that take into account this relation as “P-models”. The density-dependent metallicity case with is called P005, and the profile is shown in the (b) panel of Fig. 1.
2.3. Molecular clouds and PDRs
Beside the emission arising from the diffuse neutral medium, [C ] line can be excited in the so-called photodissociation regions (Tielens & Hollenbach, 1985; Hollenbach & Tielens, 1999) around molecular clouds (MCs). To establish whether the gas in a cell becomes gravitationally bound, we apply the Jeans instability criterium. We define molecular cells those satisfying the following condition: , where is the mass of the gas in the cell, is the Jeans mass at the CMB temperature () at , and at the density of the gas in the simulation cell (). As a caveat we note that is possible that other processes such as the cosmic rays heating (e.g. Papadopoulos, 2010) can increase the temperature above the CMB floor, even at . By applying this prescription, we find that the total mass of molecular hydrogen in the simulated galaxy is , consistently with previous theoretical estimates (, Vallini et al., 2012) and observational constraints (, Wagg et al., 2009) on LAEs.
Since we find that on average the simulation cells contain a molecular hydrogen mass , we consider each molecular cell as a Giant Molecular Cloud (GMC; , Murray, 2011). The properties of GMCs are controlled by a turbulent and highly supersonic velocity field that causes isothermal shock waves (Padoan, 1995; Ostriker et al., 2001; Padoan et al., 2014). The problem of turbulent fragmentation of molecular clouds can be treated analytically (e.g. Krumholz & McKee, 2005; Padoan & Nordlund, 2011; Hennebelle & Chabrier, 2011, 2013) or numerically (e.g. Vazquez-Semadeni, 1994; Kim & Ostriker, 2002; Kim et al., 2003; Wada, 2008; Tasker & Tan, 2009). Analytical models as well as numerical simulations show that the distribution of the gas density () in an isothermal, non self-gravitating, turbulent medium follows a log-normal distribution (Padoan, 1995; Padoan & Nordlund, 2011):
| (2) |
where , , is the average number density of the CNM (, see V13), is the Mach number value suggested by Kainulainen & Tan (2013), the turbulent velocity dispersion is given by with and . If we assume that each GMC in our simulation is composed by a set of clumps, we can compute the densities of each clump by adopting an iterative approach that consists of the following steps:
-
1.
Select by sampling the density distribution (Eq. 2).
-
2.
Set the clump radius equal to the Jeans length .
-
3.
Calculate the clump mass .
-
4.
If calculate the residual mass in the cell ; go to step 1.
-
5.
If reject the density sampled and assume . Calculate as in step 2. and use it to derive the resulting clump density.
Through this procedure, we find that the MCs in the simulations are characterized by the following properties: , and radius .
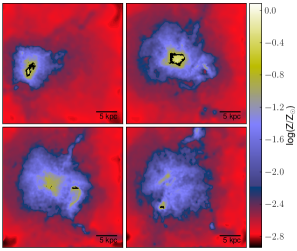
In Fig. 2, we show four 57 pc-thick slices of the simulated box showing the metallicity distribution and molecular clouds (black regions) for the P005 model. By inspecting the maps shown in the Figure we note that molecular cells reside in highly overdense regions mainly clustered at the center of the galaxy. The molecular cells are located predominantly in the innermost region of the galaxy () and have , whereas the mean metallicity over the galaxy is . This implies that any line arising from the PDRs would provide an upper limit on the mean metallicity of the galaxy. Finally, to calculate the [C ] emission from PDRs, we couple our simulation with UCL_PDR (Bell et al., 2005, 2007; Bayet et al., 2009) a PDR code that allows to derive the [C ] emissivity as a function of the intensity of the FUV radiation field (, Sec. 2.1), metallicity (, Sec. 2.2) and molecular gas density (, Sec 2.3).
2.4. CMB effects on [C ] emission
Since the CMB sets the minimum temperature of the ISM to , at high it represents a strong background against which the line fluxes are detected (e.g. da Cunha et al., 2013). The contrast of the cloud emission against the CMB radiation is given by the following relation:
| (3) |
where is the excitation (or spin) temperature. If we assume that the [C ] line is optically thin in the sub-millimeter, i.e. , the ratio () between the flux observed against the CMB and the intrinsic flux emitted by the cloud is (see also da Cunha et al., 2013):
| (4) |
Eq. (4) clearly shows that as the approaches the observed flux tends to zero. The ratio of the population of the upper (, labeled with ) and lower (, labeled with ) levels of the [C ] 158 transition formally defines the spin temperature:
| (5) |
where is the Einstein coefficient for spontaneous emission, () is the stimulated emission (absorption) coefficient, () is the collisional excitation rate for collision with (protons), () is the collisional de-excitation rate for collision with (protons), and () is the number density of (protons). For the [C ] line emission, , with if (Gong et al., 2012), is tabulated in Dalgarno & McCray (1972), and .
In local thermal equilibrium (LTE) the collisional excitation and de-excitation rates are related by the following expression that depends on the kinetic temperature :
| (6) |
By combining the equations (5) and (6) we obtain:
| (7) |
As discussed by Gong et al. (2012), the soft UV
background at 1330 Å () produced by stars can in
principle pump the [C ] ions from the energy level to
. This pumping effect, can lead to the [C ] fine
structure transition , which would mix the levels of the [C ] 158
line and thus modify the Eq. (7). However, the UV pumping effects are negligible in our calculations since the UV intensity inside the galaxy for all the SFR values considered is much smaller than the critical value for this effect to become important, namely erg s-1 cm-2Hz-1 sr-1 (Gong et al., 2012).
We calculate the spin temperature of the [C ] transition in the PDRs by substituting into Eq. (7) and as resulting from the UCL_PDR outputs. The gas temperature within PDRs depends on the radius
considered and on the SFR and ranges between .
We find that for SFR.
The in the CNM is calculated by considering the , , and provided by the V13 sub-grid model. We obtain K approximately constant in the range of SFR considered.
Since at , we find that the [C ] emission arising from PDRs is only slightly affected by the CMB (). Viceversa, the CNM is strongly attenuated at this redshift (); in this case the CMB effect becomes negligible only for galaxies at .
3. Results
In Fig. 3, we show the [C ] spectrum obtained from the P005 model, assuming SFR = (top panel) and SFR = (bottom panel). In this Figure, the contribution to the [C ] emission arising from PDRs and the CNM is shown in light red and dark blue, respectively.
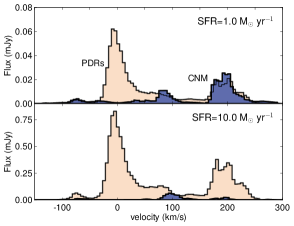
The emission from PDRs arises predominantly from the center of the galaxy, covering the velocity channels around . The second peak in the PDR emission at is produced by MCs located in the CNM clumps at the periphery of the galaxy (see Fig. 2). [C ] emission from the diffuse medium, visible as the two peaks around and is instead always displaced from the center of the galaxy. The [C ] line is relatively narrow, with a FWHM, as in V13. In Fig. 4, we plot the relative contribution of the diffuse medium to the total [C ] emission, , as a function of the SFR, for different C- and P-models, taking into account the CMB attenuation (dark blue). We find that the [C ] emission in galaxies is dominated by PDRs, since the CNM contribution is always , regardless of the metallicity profile and SFR considered.
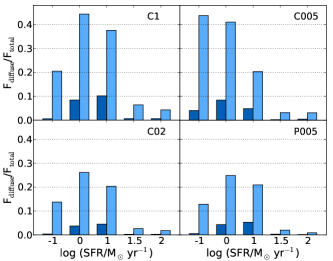
When the CMB attenuation of the CNM luminosity is negligible (i.e. typically for sources located at see Sec. 2.4), we find , consistently with several observations of [C ] emission in nearby galaxies (Cormier et al., 2012; Kramer et al., 2013; Parkin et al., 2013; Langer et al., 2014).
3.1. The [C ]-SFR relation
In the previous Section, we have found that the [C ] emission is dominated by PDRs, implying . We rescale the [C ] luminosity of our “fiducial” model (SFR, ) to an arbitrary molecular content by assuming the Kennicutt-Schmidt (KS) relation (Kennicutt et al., 1998; Kennicutt & Evans, 2012), namely a power-law correlation between the SFR and molecular gas surface densities, . The range in power-law index () relating and depends on a variety of factors, among which the most important ones are the observed scale, and the calibration of star formation rates. Kennicutt et al. (1998) and Narayanan et al. (2012) report super-linear indeces and respectively, while Bigiel et al. (2008) inferred an approximately linear molecular KS relation. More recently Shetty et al. (2013), by performing a hierarchical Bayesian analysis on the same sample considered by Bigiel et al. (2008) conclude that , with range [0.63–1.0]. In what follows we scale the molecular mass with the SFR by adopting leaving to the last Section the discussion on the impact of different on [C ]-SFR relation.
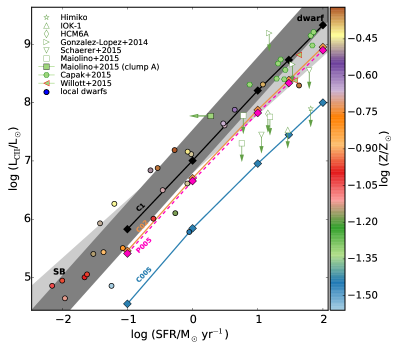
In Fig. 5, we show the result of this procedure for different metallicity profiles. Models with uniform metallicity are shown with a black dotted line for (C1), orange solid line for (C02), and blue dotted-dashed line for (C005). The results from our C-models are well described by the following best-fitting formula:
| (8) |
where is expressed in solar units, and the SFR in . The magenta dashed line indicates the predictions for the - relation with (P005). The slope of the [C ]-SFR relation does not depend neither on nor on the metallicity distribution. Moreover, the luminosity predicted by the P005 model is almost coincident with that obtained from the C02 model, in the entire range of SFR considered. This can be understood by considering that, in the case of a overdensity-dependent metallicity profile the photodissociation regions located ad the center and dominating the emission, have and, more precisely, , namely the metallicity value of the C02 model.
We compare our predictions with the [C ]-SFR relations and their 1 scatter found by De Looze et al. (2014) for local dwarf galaxies (dark gray shaded region) and local starburst galaxies (light gray shaded region). Dwarf galaxy data by De Looze et al. (2014) are shown through filled circles, individually color-coded according to their . Upper limits on the [C ] luminosity from LAEs and LBGs data are indicated with empty symbols (Ouchi et al., 2013; Ota et al., 2014; González-López et al., 2014; Schaerer et al., 2015; Maiolino et al., 2015). The recent [C ] detection in the vicinity of a LAE (Maiolino et al., 2015) is plotted as a filled square, while [C ] data at by Capak et al. (2015) and Willott et al. (2015) are indicated with filled hexagons and triangles, respectively. The [C ]-SFR relation predicted by our model fairly reproduces the slope of the relation found in local dwarfs, as well as its trend with metallicity, although the scatter in the data is large. As shown in Fig. 5, the [CII] emission arising from the diffuse medium is expected to be % in local galaxies, where the CMB attenuation on the CNM luminosity is negligible. This implies that the [CII]-SFR relation is always driven by the correlation between the SFR and the intensity of the [CII] emission arising from PDRs, with and without taking into account CMB effects. Possible variations in the diffuse medium contribution to the total [CII] emission may result in a slight tilt of the [CII]-SFR relation, certainly within the current 1 scatter.
4. Summary and Discussion
By coupling radiative transfer cosmological simulations of a galaxy with a sub-grid ISM model and a PDR code (UCL_PDR), we have computed the [C ] emission arising from the diffuse cold neutral medium (CNM) and molecular clouds in early galaxies, characterized by SFRs ranging from 0.1 to 100 M⊙yr-1. We have distributed metals in the ISM, both uniformly and according to the relation found by Pallottini et al. (2014a), to simulate gas metallicities in the range 0.05-1 .
We find that the [C ] line from high- galaxies is dominated by emission from PDRs, while the CNM accounts for % of the total flux. This is due to the fact that at these early epochs the CMB temperature approaches the spin temperature of the [C ] transition in the CNM ( K) suppressing the flux contrast. The [C ] spectrum predicted by our model is complex. It shows a pronounced peak (FWHM km s-1) due to centrally located () PDRs, and weaker [C ] displaced ( km s-1) peaks from MCs in the galaxy outskirts.
The predicted [C ]-SFR relation reproduces the corresponding relation found in local dwarfs remarkably well. Current upper limits from observations of LAEs and LBGs seem to indicate that these galaxies are characterized by a [C ] luminosity fainter than expected from the local relation. Although this conclusion is still not definitive, it must be noted that the SFRs quoted for high- galaxies are inferred from observations of the Ly emission line, and therefore must be considered as lower limits to the actual value. This implies that green arrows in Fig. 5 should be moved towards higher SFR values, hence exhacerbating the inconsistency with the local relation.
| (%) | () | ||||||||
|---|---|---|---|---|---|---|---|---|---|
| Name | profile | 1 | 10 | 100 | 1 | 10 | 100 | ||
| C1 | 1 | cnst | 44(8) | 37(10) | 4(0.6) | 0.1 | 1.6 | 21 | |
| C02 | 0.2 | cnst | 26(4) | 20(5) | 2(0.2) | 0.05 | 0.7 | 9.0 | |
| C005 | 0.05 | cnst | 41(8) | 20(5) | 3(0.2) | 0.007 | 0.09 | 1 | |
| P005 | 0.05 | - | 24(4) | 21(5) | 2(0.3) | 0.05 | 0.6 | 8.0 | |
Note. — Name: model name, : mean metallicity in solar units, profile: type of metallicity profile adopted, : percentage of the [C ] emission arising from the CNM without (and with, in bold) the attenuation due to the increased CMB temperature, : predicted [C ] luminosity in .
Our results contain a caveat: we have so far neglected the possible effect of stellar feedback (i.e. photo-evaporation, radiation pressure, [H ] thermal pressure) on molecular clouds. Broadly speaking, these effects should act to reduce the mass of the molecular gas (Tasker & Tan, 2009; Tasker, 2011; Tasker et al., 2015). On the other hand, the expansion of [H ] regions might have either a positive effect, by triggering new star formation (e.g. Mellema et al., 2006; Bisbas et al., 2011; Haworth & Harries, 2012), or disperse the surrounding cloud (Dale et al., 2005). Typical negative feedback timescales range from 1 to 10 Myr (Krumholz et al., 2006; Walch et al., 2012), namely the age of stars taken into account in our radiative transfer calculations. This would imply a steeper scaling between the SFR and molecular hydrogen surface densities, because for a given value of SFR the mass of is lower.
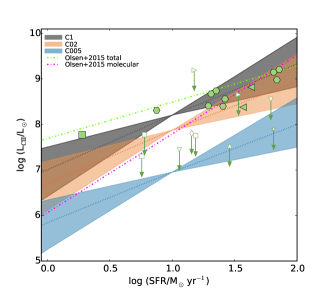
In Fig. 6 we plot the [C ]-SFR relation for models with constant metallicity (C1, C02, and C005) as a function of the slope in the range (Shetty et al., 2013; Bigiel et al., 2008; Narayanan et al., 2012). We show for reference the [C ]-SFR relation obtained for our fiducial model with thin dotted lines. At a given the steeper is the slope of the KS relation, the shallower is the [C ]-SFR curve. Hence, a [C ] deficit in galaxies, if confirmed by deeper observations, would favor a scenario in which star formation in early galaxies blows the molecular gas apart, reducing the amount of material from which most of the [C ] emission arises. The deviation from the local [C ]-SFR would then imply a modified Kennicutt-Schmidt relation in galaxies. Stellar feedback effects are likely to be stronger in regions of very active star formation, more often located in galactic centers. This is particularly important in high- galaxies that are known to be more compact than their low- counterparts. If so, negative feedback should preferentially suppress the peak in the [C ] spectrum at the systemic redshift of the galaxy. Alternatively/in addition, as can be noted in Fig. 6, the deficit might be explained by lower gas metallicities. In the same Figure, we also test our results with the [C ]-SFR relation for all gas phases (PDR + molecular + ionized) and from molecular phase only, calculated by Olsen et al. (2015) in a sample of simulated galaxies. As they point out in their work, their PDR component is best identified with what we call CNM, while their molecular component, located at the center, is comparable to what we call PDR emission. We find a nice agreement between our results and their findings for the molecular gas. This is something expected, given that the fraction of [C ] emission arising from the CNM is almost totally attenuated due to the increased CMB temperature at .
Finally, we note that the MC density distribution may play a role. Our simulated galaxy is characterized by a mean molecular hydrogen number density cm-3; this quantity depends on the square of the assumed Mach number . Calculations performed with UCL_PDR show that molecular clouds characterized by densities 10 times higher (lower), for a fixed gas metallicity (e.g. ), would result into a [C ] emissivity 5 times higher (20 times lower) than found here. Although we consider such large variations of the Mach number unlikely, at present we cannot exclude that the corresponding shift in the mean MC density plays some role in the interpretation of the results.
References
- Bayet et al. (2009) Bayet, E., Gerin, M., Phillips, T. G., & Contursi, A. 2009, MNRAS, 399, 264
- Bell et al. (2007) Bell, T. A., Viti, S., & Williams, D. A. 2007, MNRAS, 378, 983
- Bell et al. (2005) Bell, T. A., Viti, S., Williams, D. A., Crawford, I. A., & Price, R. J. 2005, MNRAS, 357, 961
- Bigiel et al. (2008) Bigiel, F., Leroy, A., Walter, F., et al. 2008, AJ, 136, 2846
- Bisbas et al. (2011) Bisbas, T. G., Wünsch, R., Whitworth, A. P., Hubber, D. A., & Walch, S. 2011, ApJ, 736, 142
- Boselli et al. (2002) Boselli, A., Gavazzi, G., Lequeux, J., & Pierini, D. 2002, A&A, 385, 454
- Bouwens et al. (2012) Bouwens, R. J., Illingworth, G. D., Oesch, P. A., et al. 2012, ApJ, 754, 83
- Capak et al. (2015) Capak, P. L., Carilli, C., Jones, G., et al. 2015, ArXiv e-prints:1503.07596, arXiv:1503.07596
- Carilli et al. (2013) Carilli, C. L., Riechers, D., Walter, F., et al. 2013, ApJ, 763, 120
- Carilli & Walter (2013) Carilli, C. L., & Walter, F. 2013, ARA&A, 51, 105
- Carniani et al. (2013) Carniani, S., Marconi, A., Biggs, A., et al. 2013, A&A, 559, A29
- Cicone et al. (2015) Cicone, C., Maiolino, R., Gallerani, S., et al. 2015, A&A, 574, A14
- Cormier et al. (2012) Cormier, D., Lebouteiller, V., Madden, S. C., et al. 2012, A&A, 548, A20
- Cox et al. (2011) Cox, P., Krips, M., Neri, R., et al. 2011, ApJ, 740, 63
- da Cunha et al. (2013) da Cunha, E., Groves, B., Walter, F., et al. 2013, ApJ, 766, 13
- Dale et al. (2005) Dale, J. E., Bonnell, I. A., Clarke, C. J., & Bate, M. R. 2005, MNRAS, 358, 291
- Dalgarno & McCray (1972) Dalgarno, A., & McCray, R. A. 1972, ARA&A, 10, 375
- De Breuck et al. (2014) De Breuck, C., Williams, R. J., Swinbank, M., et al. 2014, A&A, 565, A59
- De Looze et al. (2011) De Looze, I., Baes, M., Bendo, G. J., Cortese, L., & Fritz, J. 2011, MNRAS, 416, 2712
- De Looze et al. (2014) De Looze, I., Cormier, D., Lebouteiller, V., et al. 2014, A&A, 568, A62
- Gallerani et al. (2012) Gallerani, S., Neri, R., Maiolino, R., et al. 2012, A&A, 543, A114
- Gong et al. (2012) Gong, Y., Cooray, A., Silva, M., et al. 2012, ApJ, 745, 49
- González et al. (2011) González, V., Labbé, I., Bouwens, R. J., et al. 2011, ApJ, 735, L34
- González-López et al. (2014) González-López, J., Riechers, D. A., Decarli, R., et al. 2014, ApJ, 784, 99
- Haworth & Harries (2012) Haworth, T. J., & Harries, T. J. 2012, MNRAS, 420, 562
- Hennebelle & Chabrier (2011) Hennebelle, P., & Chabrier, G. 2011, ApJ, 743, L29
- Hennebelle & Chabrier (2013) —. 2013, ApJ, 770, 150
- Herrera-Camus et al. (2015) Herrera-Camus, R., Bolatto, A. D., Wolfire, M. G., et al. 2015, ApJ, 800, 1
- Hollenbach & Tielens (1999) Hollenbach, D. J., & Tielens, A. G. G. M. 1999, Reviews of Modern Physics, 71, 173
- Kainulainen & Tan (2013) Kainulainen, J., & Tan, J. C. 2013, A&A, 549, A53
- Kanekar et al. (2013) Kanekar, N., Wagg, J., Ram Chary, R., & Carilli, C. L. 2013, ApJ, 771, L20
- Kapala et al. (2015) Kapala, M. J., Sandstrom, K., Groves, B., et al. 2015, ApJ, 798, 24
- Keating et al. (2014) Keating, L. C., Haehnelt, M. G., Becker, G. D., & Bolton, J. S. 2014, MNRAS, 438, 1820
- Kennicutt & Evans (2012) Kennicutt, R. C., & Evans, N. J. 2012, ARA&A, 50, 531
- Kennicutt et al. (1998) Kennicutt, Jr., R. C., Stetson, P. B., Saha, A., et al. 1998, ApJ, 498, 181
- Kim & Ostriker (2002) Kim, W.-T., & Ostriker, E. C. 2002, ApJ, 570, 132
- Kim et al. (2003) Kim, W.-T., Ostriker, E. C., & Stone, J. M. 2003, ApJ, 599, 1157
- Kramer et al. (2013) Kramer, C., Abreu-Vicente, J., García-Burillo, S., et al. 2013, A&A, 553, A114
- Krumholz et al. (2006) Krumholz, M. R., Matzner, C. D., & McKee, C. F. 2006, ApJ, 653, 361
- Krumholz & McKee (2005) Krumholz, M. R., & McKee, C. F. 2005, ApJ, 630, 250
- Langer et al. (2014) Langer, W. D., Pineda, J. L., & Velusamy, T. 2014, A&A, 564, A101
- Leitherer et al. (1999) Leitherer, C., Schaerer, D., Goldader, J. D., et al. 1999, APJS, 123, 3
- Maiolino et al. (2005) Maiolino, R., Cox, P., Caselli, P., et al. 2005, A&A, 440, L51
- Maiolino et al. (2015) Maiolino, R., Carniani, S., Fontana, A., et al. 2015, ArXiv e-prints:1502.06634, arXiv:1502.06634
- Mellema et al. (2006) Mellema, G., Arthur, S. J., Henney, W. J., Iliev, I. T., & Shapiro, P. R. 2006, ApJ, 647, 397
- Muñoz & Furlanetto (2014) Muñoz, J. A., & Furlanetto, S. R. 2014, MNRAS, 438, 2483
- Murray (2011) Murray, N. 2011, ApJ, 729, 133
- Nagamine et al. (2006) Nagamine, K., Wolfe, A. M., & Hernquist, L. 2006, ApJ, 647, 60
- Narayanan et al. (2012) Narayanan, D., Krumholz, M. R., Ostriker, E. C., & Hernquist, L. 2012, MNRAS, 421, 3127
- Olsen et al. (2015) Olsen, K. P., Greve, T. R., Narayanan, D., et al. 2015, ArXiv e-prints:1507.00362, arXiv:1507.00362
- Ostriker et al. (2001) Ostriker, E. C., Stone, J. M., & Gammie, C. F. 2001, ApJ, 546, 980
- Ota et al. (2014) Ota, K., Walter, F., Ohta, K., et al. 2014, ApJ, 792, 34
- Ouchi et al. (2009) Ouchi, M., Ono, Y., Egami, E., et al. 2009, ApJ, 696, 1164
- Ouchi et al. (2013) Ouchi, M., Ellis, R., Ono, Y., et al. 2013, ApJ, 778, 102
- Padoan (1995) Padoan, P. 1995, MNRAS, 277, 377
- Padoan et al. (2014) Padoan, P., Federrath, C., Chabrier, G., et al. 2014, Protostars and Planets VI, 77
- Padoan & Nordlund (2011) Padoan, P., & Nordlund, Å. 2011, ApJ, 730, 40
- Pallottini et al. (2014a) Pallottini, A., Ferrara, A., Gallerani, S., Salvadori, S., & D’Odorico, V. 2014a, MNRAS, 440, 2498
- Pallottini et al. (2014b) Pallottini, A., Gallerani, S., & Ferrara, A. 2014b, MNRAS, 444, L105
- Papadopoulos (2010) Papadopoulos, P. P. 2010, ApJ, 720, 226
- Parkin et al. (2013) Parkin, T. J., Wilson, C. D., Schirm, M. R. P., et al. 2013, ApJ, 776, 65
- Pineda et al. (2014) Pineda, J. L., Langer, W. D., & Goldsmith, P. F. 2014, A&A, 570, A121
- Pineda et al. (2013) Pineda, J. L., Langer, W. D., Velusamy, T., & Goldsmith, P. F. 2013, A&A, 554, A103
- Popping et al. (2014) Popping, G., Pérez-Beaupuits, J. P., Spaans, M., Trager, S. C., & Somerville, R. S. 2014, MNRAS, 444, 1301
- Riechers et al. (2014) Riechers, D. A., Carilli, C. L., Capak, P. L., et al. 2014, ApJ, 796, 84
- Sargsyan et al. (2012) Sargsyan, L., Lebouteiller, V., Weedman, D., et al. 2012, ApJ, 755, 171
- Schaerer et al. (2015) Schaerer, D., Boone, F., Zamojski, M., et al. 2015, A&A, 574, A19
- Shetty et al. (2013) Shetty, R., Kelly, B. C., & Bigiel, F. 2013, MNRAS, 430, 288
- Springel (2005) Springel, V. 2005, MNRAS, 364, 1105
- Stacey et al. (1991) Stacey, G. J., Geis, N., Genzel, R., et al. 1991, ApJ, 373, 423
- Tasker (2011) Tasker, E. J. 2011, ApJ, 730, 11
- Tasker & Tan (2009) Tasker, E. J., & Tan, J. C. 2009, ApJ, 700, 358
- Tasker et al. (2015) Tasker, E. J., Wadsley, J., & Pudritz, R. 2015, ApJ, 801, 33
- Teyssier (2002) Teyssier, R. 2002, A&A, 385, 337
- Tielens & Hollenbach (1985) Tielens, A. G. G. M., & Hollenbach, D. 1985, ApJ, 291, 722
- Vallini et al. (2012) Vallini, L., Dayal, P., & Ferrara, A. 2012, MNRAS, 421, 3266
- Vallini et al. (2013) Vallini, L., Gallerani, S., Ferrara, A., & Baek, S. 2013, MNRAS, 433, 1567
- Vazquez-Semadeni (1994) Vazquez-Semadeni, E. 1994, ApJ, 423, 681
- Venemans et al. (2012) Venemans, B. P., McMahon, R. G., Walter, F., et al. 2012, ApJ, 751, L25
- Wada (2008) Wada, K. 2008, ApJ, 675, 188
- Wagg et al. (2009) Wagg, J., Kanekar, N., & Carilli, C. L. 2009, ApJ, 697, L33
- Walch et al. (2012) Walch, S. K., Whitworth, A. P., Bisbas, T., Wünsch, R., & Hubber, D. 2012, MNRAS, 427, 625
- Walter et al. (2012) Walter, F., Decarli, R., Carilli, C., et al. 2012, ApJ, 752, 93
- Williams et al. (2014) Williams, R. J., Wagg, J., Maiolino, R., et al. 2014, MNRAS, 439, 2096
- Willott et al. (2015) Willott, C. J., Carilli, C. L., Wagg, J., & Wang, R. 2015, ArXiv e-prints:1504.05875, arXiv:1504.05875
- Wolfire et al. (1995) Wolfire, M. G., Hollenbach, D., McKee, C. F., Tielens, A. G. G. M., & Bakes, E. L. O. 1995, ApJ, 443, 152
- Wolfire et al. (2003) Wolfire, M. G., McKee, C. F., Hollenbach, D., & Tielens, A. G. G. M. 2003, ApJ, 587, 278
- Zabl et al. (2015) Zabl, J., Nørgaard-Nielsen, H. U., Fynbo, J. P. U., et al. 2015, MNRAS, 451, 2050
- Zheng et al. (2012) Zheng, W., Postman, M., Zitrin, A., et al. 2012, Nature, 489, 406