Hu 1-2: a metal-poor bipolar planetary nebula with fast collimated outflows
Abstract
We present narrow-band optical and near-IR imaging and optical long-slit spectroscopic observations of Hu 1-2, a Galactic planetary nebula (PN) with a pair of [N ii]-bright, fast-moving (340 km s-1) bipolar knots. Intermediate-dispersion spectra are used to derive physical conditions and abundances across the nebula, and high-dispersion spectra to study the spatio-kinematical structure. Generally Hu 1-2 has high He/H (0.14) and N/O ratios (0.9), typical of Type I PNe. On the other hand, its abundances of O, Ne, S, and Ar are low as compared with the average abundances of Galactic bulge and disc PNe. The position-velocity maps can be generally described as an hour-glass shaped nebula with bipolar expansion, although the morphology and kinematics of the innermost regions cannot be satisfactorily explained with a simple, tilted equatorial torus. The spatio-kinematical study confines the inclination angle of its major axis to be within 10∘ of the plane of sky. As in the irradiated bow-shocks of IC 4634 and NGC 7009, there is a clear stratification in the emission peaks of [O iii], H, and [N ii] in the northwest (NW) knot of Hu 1-2. Fast collimated outflows in PNe exhibit higher excitation than other low-ionization structures. This is particularly the case for the bipolar knots of Hu1-2, with He ii emission levels above those of collimated outflows in other Galactic PNe. The excitation of the knots in Hu 1-2 is consistent with the combined effects of shocks and UV radiation from the central star. The mechanical energy and luminosity of the knots are similar to those observed in the PNe known to harbor a post-common envelope (post-CE) close binary central star.
keywords:
ISM: abundances – ISM: jets and outflows – ISM: planetary nebulae: individual: Hu 1-21 Introduction
Planetary nebulae (PNe) represent the last stages in the evolution of low- and intermediate-mass stars, before they turn into white dwarfs. A large fraction of PNe presents complex morphologies, including axisymmetric shells, multipolar lobes, and collimated structures, in sharp contrast with the spherical envelopes typically seen around asymptotic giant branch (AGB) stars (e.g., Olofsson et al. olo10 2010). Somehow, the spherical AGB envelope is transformed into the complex PN shell. Hubble Space Telescope (HST) observations have led to the suggestion that the shaping of the most structured young PNe (or proto-planetary nebulae, proto-PNe) could be attributed to the action of high-speed collimated outflows or jets that operate during the late-AGB and/or early post-AGB phase, as they interact with the intrinsically spherical AGB circumstellar envelope (Sahai & Trauger st98 1998). These observations indicate that collimated outflows probably also play a crucial role in the shaping and dynamical evolution of PNe (e.g., Dennis et al. den08 2008; Huarte-Espinosa et al. hua12 2012).
Collimated outflows or jet-like structures have been identified in a significant number of PNe. The origin of collimated outflows is still uncertain, although they are most likely related to the evolution of binary systems, the action of magnetic fields, or both (e.g., Soker sok06 2006; De Marco marco09 2009). Particularly, binary interactions that involve accretion (e.g., Soker sok98 1998; Soker & Livio sl94 1994; Reyes-Ruiz & López rrl99 1999; Nordhaus & Blackman nb06 2006; Blackman & Lucchini bl14 2014) have been considered to be a plausible engine to produce the ubiquitous collimated outflows in PNe and proto-PNe (e.g., Balick & Frank bf02 2002). Recently, Tocknell, De Marco & Wardle toc14 (2014) constrained the physical properties of the common envelope (CE) interaction using the observed masses and kinematics of jets in four post-CE PNe.
Detailed studies of the spectra of jet-like structures in PNe are scarce, but they generally report strong low-excitation emission lines (particularly from [N ii]) combined with high-excitation emission lines (e.g., [O iii]; Guerrero et al. guerrero2008 2008; Gonçalves et al. gon09 2009). This notable difference with the spectra of the main nebular shells can be attributed to the combined contributions of ionizing photons from the central star and excitation by shocks. Therefore, these structures are candidates of irradiated shocks, i.e., bow-shocks that are illuminated by ionizing (stellar) fluxes from the post-shock direction (e.g., Hartigan, Raymond & Hartmann har87 1987).
Hu 1-2 (PN G086.508.8), first identified by Humason hum21 (1921) and classified as elliptical by Manchado et al. man96 (1996), is a PN with fast, highly collimated outflows. Recently, Miranda et al. 2012a identified two bipolar compact knots along the main axis of Hu 1-2 with bow-shock-like morphologies. An analysis of the radial velocities and proper motions of these knots showed that they move at velocities 340 km s-1. This velocity is much higher than the expansion velocities of the collimated outflows observed in most PNe (Guerrero et al. gue02 2002). For instance, the bright “Saturn Nebula”, NGC 7009, has an elliptical main nebula with a pair of [N ii]-bright outer knots along its major axis (e.g., Gonçalves et al. gon03 2003). Despite the morphological similarities with Hu 1-2, the expansion velocity of 60 km s-1 reported for the bipolar knots of NGC 7009 (Reay & Atherton ra85 1985) is much lower than that observed in Hu 1-2, although we recall that the expansion velocity of the knots in NGC 7009 is quite uncertain (Gonçalves et al. gon03 2003).
The high-velocity and bow-shock-like morphology led Miranda et al. 2012a to conclude that these knots probably represent bow-shocks associated to high-velocity bullets. Furthermore, a preliminary analysis of narrow-band images of the knots suggests that [N ii] peaks farther away from the central star than [O iii] (Miranda et al. 2012b ). The enhanced [N ii] emission in the knots seems to imply shock-excitation, whereas the strong [O iii] emission rather points to irradiation from the central star. A comprehensive analysis of the emission spectrum of the knots is crucial to determine the excitation mechanism, as done by, e.g., Riera et al. rie06 (2006) for Hen 3-1475 and Guerrero et al. guerrero2008 (2008) for IC 4634.
The physical structure of its main nebular shell is also largely unknown. Narrow-band [N ii] image (Miranda et al. 2012a ) reveals a complex morphology for its innermost regions, which adds to the peculiar velocity field revealed by kinematical studies (Sabbadin, Bianchini & Hamzaoglu sab83 1983; Sabbadin, Cappellaro & Turatto sab87 1987). Similarly, the kinematical structure of the faint bipolar lobes is completely unknown. The relatively large He/H and N/O abundance ratios of the bright inner regions of Hu 1-2 qualify it to be Type I PN (Peimbert & Torres-Peimbert ptp87 1987), but detailed abundance analyses of the same nebular regions (Pottasch et al. pot03 2003; Hyung, Pottasch & Feibelman hyu04 2004) found that abundances of the elements (oxygen, neon, sulfur and argon) are much lower than those in most other Galactic PNe. This peculiar abundance pattern may shed light on the origin and evolution of Hu 1-2, but a spatially-resolved study of the physical conditions, chemical abundances, and excitation mechanisms is lacking.
In this paper we present high spatial resolution narrow-band optical and near-infrared images and high- and intermediate-dispersion long-slit optical spectra of Hu 1-2. These data have allowed us to carry out a complete analysis of its spatio-kinematical properties and physical conditions, abundances, and excitation mechanisms. Particular emphasis is made in the investigation of the properties of the collimated outflows in Hu 1-2.
2 Observations
2.1 Imagery
Narrow-band optical images in the [O iii], H, and [N ii] emission lines were acquired on 2008 September 2 using the Andalucía Faint Object Spectrograph and Camera (ALFOSC) on the 2.5m Nordic Optical Telescope (NOT) of the Observatorio del Roque de los Muchachos (ORM) on the island of La Palma (Spain). The characteristics of the narrow-band filters used in these observations (central wavelength and bandwidth ) are summarized in Table 1. An EEV 2k2k CCD was used as detector, yielding a plate scale of 0184 pixel-1 and a field of view (FoV) of 6363.
Two images in each filter were obtained with a small dithering between them to eliminate cosmic rays and reduce cosmetic defects of the CCD. The images were bias-subtracted, flat-fielded by twilight flats, and combined using standard iraf111iraf, the Image Reduction and Analysis Facility, is distributed by the National Optical Astronomy Observatory, which is operated by the Association of Universities for Research in Astronomy under cooperative agreement with the National Science Foundation. V2.14.1 routines. The spatial resolution of the final images, as derived from the FWHM of stars in FoV is 07.
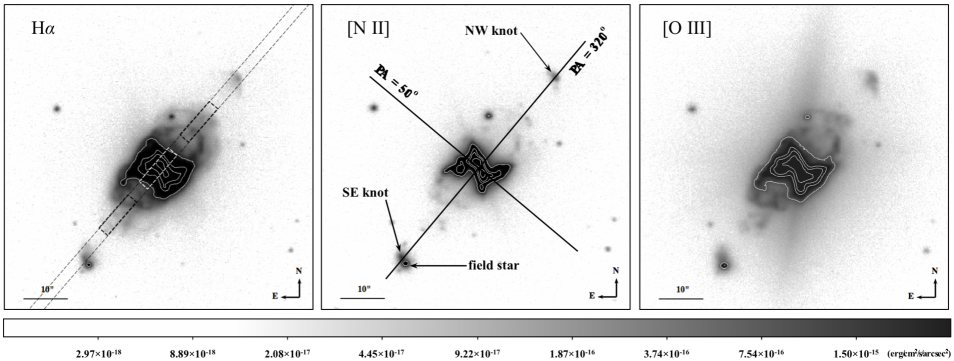
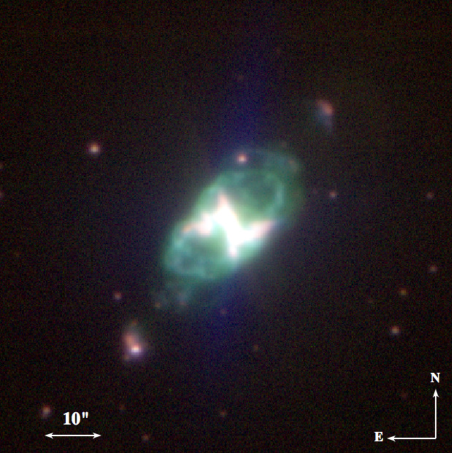
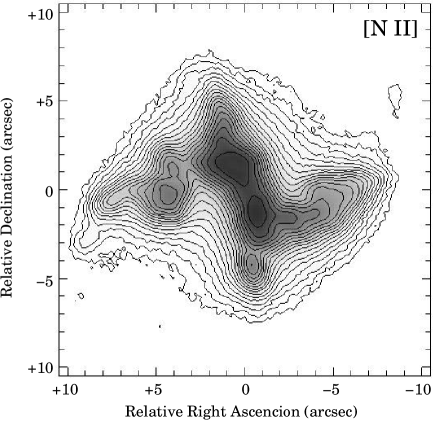
The three images were then background-subtracted and flux-calibrated using the H, [N ii] 6583 and [O iii] 5007 line fluxes measured in the intermediate-dispersion spectrum that will be presented in Section 2.2. The individual flux-calibrated narrow-band images of Hu 1-2 are presented in Figure 1, whereas a color-composite picture is displayed in Figure 2. In Figure 3 we present a close-up of the [N ii] emission from the inner region of Hu 1-2.
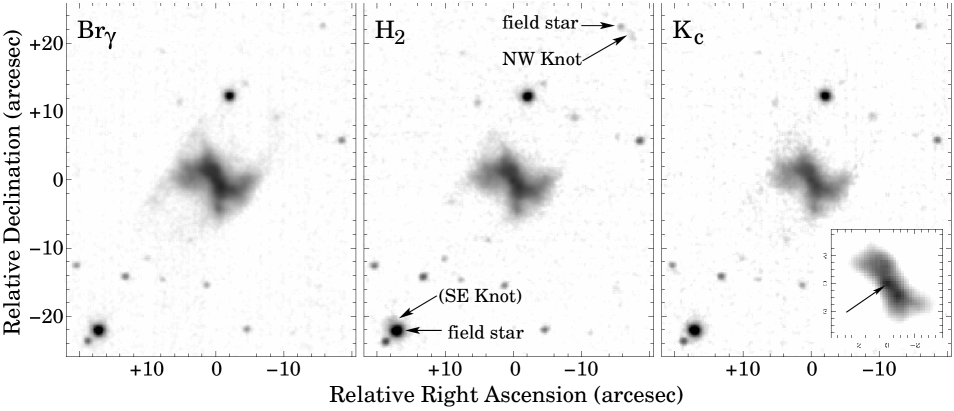
Narrow-band, near-infrared (IR) images were obtained on 2004 July 11 with the 3.5m Telescope Nazionale Galileo (TNG) also at the ORM. The Near-Infrared Camera and Spectrograph (NICS) was used with a 10241024 Rockwell HgCdTe array. The spatial scale is 013 pixel-1 and the FoV is 2222. The images were obtained through Br, H2 and continuum () filters whose central wavelengths and bandwidths are given in Table 1. The images were reduced with the midas222midas is developed and distributed by the European Southern Observatory. package following standard procedures for near-IR image reduction. The spatial resolution of the final images, as derived from the FWHM of field stars in the FoV, is 075. Figure 4 presents the three near-IR images.
| Telescope | Instrument | Filter | Exp. Time | ||
|---|---|---|---|---|---|
| (s) | |||||
| NOT | ALFOSC | [O iii] | 5007 Å | 30 Å | 600 |
| H | 6567 Å | 8 Å | 600 | ||
| [N ii] | 6588 Å | 9 Å | 900 | ||
| TNG | NICS | Br | 2.169 m | 0.035 m | 1200 |
| H2 | 2.122 m | 0.032 m | 1200 | ||
| 2.275 m | 0.039 m | 1200 |
2.2 Intermediate-dispersion spectroscopy
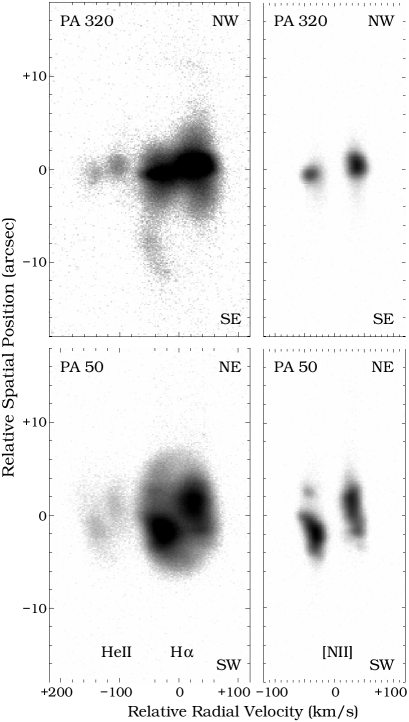
Intermediate-dispersion spectra of Hu 1-2 were obtained on 2011 October 9, using the ALBIREO spectrograph at the 1.5m telescope of the Observatorio de Sierra Nevada (OSN), Granada, Spain. A Marconi 20482048 CCD was used as a detector, in conjunction with the 400 lines mm-1 grating #4 blazed at 5500 Å. The slit length was 6′ and its width was set at 50 m (25). A 22 binning in the detector was used, implying plate and spectral scales of 153 pixel-1 and 3.54 Å pixel-1, respectively. The spectral resolution was 4.7 Å, and the wavelength uncertainty 1 Å. The spectral coverage is 3570–7200 Å. The seeing, as determined from the FWHM of the continuum of field stars covered by the slit, was 3″. As illustrated in Figure 1-left, the slit was aligned along a position angle (PA) of 320°, i.e., along the major nebular axis and through the bipolar knots.
Three 60 s and six 300 s exposures were obtained to secure information both from the bright and faint emission lines in this nebula; indeed, the bright [O iii] 5007 emission line was found to saturate in the central regions of the nebula in the long exposures. All the spectra were bias-subtracted, flat-fielded, wavelength and flux calibrated, following standard procedures using iraf. Spectra of the spectrophotometric standard star Feige 115 acquired on the same night were used to carry out the flux calibration.
2.3 High-dispersion spectroscopy
Two high-dispersion, long-slit spectra of Hu 1-2 were obtained in 2004 June with IACUB333 The IACUB uncrossed echelle spectrograph was built in a collaboration between the Instituto de Astrofísica de Canarias (IAC) and Queen’s University of Belfast. on the 2.5m NOT at ORM. The slit positions, oriented at PAs 50∘ and 320∘, are shown in Figure 1-middle. The long-slit spectra at PA 320∘ was already presented by Miranda et al. 2012a in the analysis of the kinematics of the bipolar knots. The H and [N ii] 6548, 6583 emission lines were observed with a slit width of 065 for an exposure of 900 s. The spectral resolution (FWHM) is 8 km s-1, and the spatial resolution is 1″. See Miranda et al. 2012a for a detailed description of these observations.
3 Main nebula
3.1 Morphology
The optical narrow-band images in Figure 1 show that Hu 1-2 has an elongated elliptical or slightly bipolar main nebula with a size of 12″32″ with the major axis oriented at PA320∘, and a pair of bipolar knots (NW and SE) located along the main nebular axis, each 27″ away from the central star. As already noted by Miranda et al. 2012a , the SE knot is partially superimposed by a field star and cannot be well studied. At any rate, the high-resolution NOT images reveal that the knots (in particular the NW one) present bow-shock morphology (Figure 1). In the central region of Hu 1-2, there is a bright, -shaped structure (hereafter the inner region) with a size of 10″10″ (Figure 1-middle; see also description below). The bipolar lobes are considerably fainter than the inner region. Moreover, the lobes harbor a noticeable richness of small structures that differ from each other. The NW lobe seems to be composed of two concentric structures, a NW inner lobe and a NW outer lobe, that are better observed in the H image. Only part of the NW outer lobe can be recognized in the [O iii] image, where it shows a clearly curly morphology, and in the [N ii] image, where the [N ii] emission is mainly detected in a couple of very compact regions. A SE counterpart of the NW inner lobe can be recognized, also exhibiting a remarkable curly structure in the [O iii] image. No SE counterpart of the NW outer lobe can be identified. Instead, several knots are observed in the [O iii] image, that are oriented along (or close to) the main nebular axis. Faint [N ii] emission is detected at the leading head of these knots.
A close inspection of the inner region of Hu 1-2 in the [N ii] image reveals a peculiar structure, as shown in Figure 3. It shows an arc-shaped central “bar” with a size 6″ oriented at PA 30∘ that contains two bright knots separated by 28. There is enhanced emission and/or knots on either end of the bar that seem to trace the edges of bipolar lobes towards the east and west. As a whole, the inner region of Hu 1-2 exhibits a remarkable point-symmetric structure. It is worth noting that none of the point-symmetric pairs of knots is oriented along the major nebular axis. It is tantalizing to interpret the inner region as a broken equatorial torus, but we have to admit that such a torus would be broken in a very point-symmetric manner. The kinematics of this region, to be described in Section 3.2, is less compatible with that expected from a simple ring-like equatorial torus.
The optical images (Figures 1 and 2) show that [N ii] emission is enhanced in the knots and in the inner region while the bipolar lobes (hereafter the outer region) are dominated by the H line emission. The strongest [O iii] emission comes from both the main nebula and regions behind the head of the knots facing toward the central star.
The point-symmetric inner region is also enhanced in the near-IR emission, as shown in Figure 4, where it presents a very similar morphology to that observed in the optical ones. In addition, faint emission from the bipolar lobes can be recognized in the Br filter. The H2 emission is faint, but definitely present in the NW knot and, possibly, also in the SE counterpart. We have tried to subtract the continuum image from the emission-line images (the subtracted images are not shown here), and found that Br emission is present in the inner region and bipolar lobes whereas in the case of H2, no satisfactory subtraction was achieved; nevertheless, the presence of H2 emission in the inner region is doubtful as the emission in the H2 image can be attributed to continuum emission. Finally we note that both the and H2 images show a faint point-like source at the center of the inner region (Figure 4), which could be the central star of Hu 1-2. This point-like source is not well observed in the Br image probably due to the relatively stronger line emission. In all three near-IR filters, we observed an emission feature located towards the SW of the central point-like source (better seen in Figure 4-right). A comparison between the NOT ALFOSC [N ii] and TNG NICS images shows that the SW feature in the image is associated with the SW [N ii] knot in the central bar. The knot peaks closer to the central star by 03, suggesting that it corresponds to ionized material with higher excitation than the [N ii] line.
3.2 Kinematics
The grey-scale position-velocity (PV) maps of the H and [N ii] 6583 emission lines derived from the high-resolution, long-slit spectra at PA 50∘ and 320∘ are shown in Figure 5. The PV map of the He ii 6560 emission line is close to that of H. The PV map of the [N ii] line at PA 320∘ was already presented by Miranda et al. (2012a, , Figure 2 therein), who focused on the emission features associated with the bipolar knots. We examine in detail the kinematical structure of the main nebula instead. In the following, radial velocities will be quoted with respect to the heliocentric systemic velocity of 3.3 km s-1 for Hu 1-2 that we deduced from our high-dispersion spectra (see below).
The [N ii] PV map at PA=320∘ shows two compact features at 05 from the center with radial velocities 38 km s-1, with the feature at PA 320∘ being redshifted. In the PV map at PA 50∘, the emission features are more elongated along the slit (10″), and present point-symmetric, arc-like shapes, with the NE feature redshifted and the SW one blueshifted. The emission peaks in these features are located 19 from the center and their radial velocity amounts to 30 km s-1. At larger distances from the center, the radial velocity in the features remains approximately constant; at smaller distances the radial velocity increases up to 48 km s-1 at 03 from the center in the blueshifted feature and up to 43 km s-1 at 15–32 from the center in the redshifted feature. This morphology in the PV diagram indicats a rotation of the torus. If the inner structure is/was indeed a ring (or torus), then it could have been distorted by some agent such as several bipolar ejections along different directions, as suggested by the point-symmetry of the bright regions. If this is the case, the kinematics cannot be interpreted easily. An isolated knot is also observed at 43 km s-1 and 25 (Figure 5), which reflects the complexity of the inner structure.
These [N ii] features are generally consistent with the brightest features in the H PV maps. The arc shape of the [N ii] features in the PV map at PA 50∘ can also be recognized in H with radial velocities about 5 km s-1 lower than those measured in the [N ii] emission line. In the H PV map, these features are embedded or superimposed on a broad and faint H component that extends to 12″ and 130 km s-1 in radial velocity. The broad H emission is mostly symmetrical with respect to the velocity axes. At PA 320∘ the extended H emission is observed up to a distance of 12″ on both sides of the center. This emission corresponds to the elliptical/bipolar lobes of the nebula. Although the emission is very faint in the PV maps, the observed kinematics appears compatible with that expected from an hour-glass nebula. The total spatial extent of the H emission detected in the PV maps (12″24″) coincides very well with the spatial extent of the main nebula observed in direct images.
Two bright features are detected in the He ii emission line at both PAs. Their radial velocity separation amounts to 33 km s-1, while their spatial separation is 17 at PA 50∘ (where they present a slight spatial elongation) and 04 at PA 320∘ (Figure 5). The brightest features in each of the three emission lines and their spatio-kinematical properties indicate that they probably trace a unique structure that is related to the bright inner region of Hu 1-2.
It has been shown that differing the systemic velocities () of the main nebular shell and collimated outflows can be associated to the presence of a binary central star (e.g., Miranda et al. mir01 2001). Using our high-dispersion spectra of Hu 1-2, we measured the heliocentric systemic velocities of the main nebula and the knots: (nebula) = 3.31.7 km s-1, and (knot) = 1.42.5 km s-1. These two systemic velocities agree within the errors and, therefore, they cannot confirm whether a binary central star exist or not. We note that our measurement of the nebular systemic velocity are consistent, but not completely coincident, with previous measurements: 9.08.1 km s-1 (Schneider et al. sch83 1983) and 9.04.3 km s-1 (Durand et al. dur98 1998). These differences most likely reflect the complex kinematical structure of the main nebular shell of Hu 1-2, which makes difficult a precise estimate of the systemic velocity based on spatially unresolved observations.
3.3 Spatio-kinematical model
The H PV map at PA 320∘ is similar to that found in other bipolar nebula (e.g., Kn 26; Guerrero et al. guerrero2013 2013) suggesting bipolar expansion. We have adopted the prescription by Solf & Ulrich su1985 (1985) to model a bipolar outflow, where the radial velocity () at a latitude angle () above the equatorial plane is given by
| (1) |
where and are the polar and equatorial velocities, respectively, and is a parameter to fit the specific shape of the hour-glass. We note that the PV map suggests a small inclination angle with respect to the plane of the sky. Figure 6 shows three hour-glass models at inclination angles of 10∘, 5∘, and 0∘, each assuming that and are 150 and 30 km s-1, respectively, and a polar radius () of 125. By varying the parameter we obtained the best fit model for the PV map.
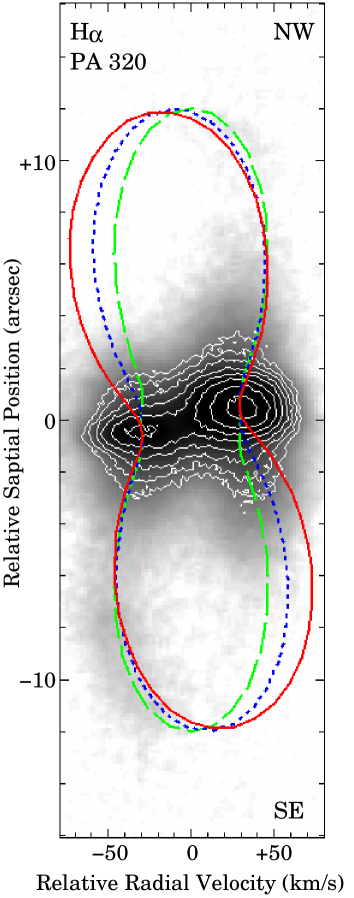
It is clear from Figure 6 that no ideal representation of the kinematics can be reached. Whereas one particular set of parameters explains the observed kinematics of a given region (e.g., the front side of the SE lobe and the rear side of the NW lobe), other parameters are needed to reproduce the observed kinematics of other nebular regions (e.g., the rear side of the SE lobe and the front side of the NW lobe). This is not surprising because the images already suggest noticeable morphological differences between the two lobes, and these are reflected into differences in their intrinsic kinematics. From our analysis we conclude that a reasonable upper limit for the inclination angle of the polar axis is 10∘ and an approximate value for the polar expansion velocity is 150 km s-1. Assuming a lower limit of 3.5 kpc for the distance to Hu 1-2 (Miranda et al. 2012a ), we derived a lower limit 1100 yr for the kinematical age of the bipolar lobes, which is consistent with the value of 1375 yr obtained for the bipolar knots (Miranda et al. 2012a ).
The [N ii] features in the PV maps could be due to a tilted torus (or ring-like structure). If we assume a diameter of 10″ for the equator and a projection of 1″ due to tilt, an inclination angle 6∘ is obtained for the plane of the ring with respect to the line of sight. This value is compatible with the inclination angle of the bipolar lobes. However, the observed kinematics strengthens the idea that the inner regions of Hu 1-2 is difficult to be interpreted as a simple equatorial torus. In particular, for a torus oriented at PA 50∘ and seen almost edge on, a long-slit spectrum along PA 50∘ should show a velocity ellipse with maximum splitting at the center and decreasing towards the edges of the torus. The PV map at PA 50∘ (Figure 5) shows a very different structure. A possible interpretation for the inner region is that a series of bipolar ejections at different directions have have been involved in its formation, distorting a previous, more defined structure.
| Inner Region | Outer Region | NW Knot | |||||||||||
| Ion | Mult. | Lower | Upper | ||||||||||
| (Å) | (Å) | ||||||||||||
| 3726.2a | 47.8 | 75.22.5 | 14.7 | 23.11.5 | 347 | 54534 | [O ii] | 3727 | 2p3 4So | 2p3 2Do | 4 | 4 | |
| 3749.5 | 2.11 | 3.300.35 | H i | H12 | 3750 | 2p 2Po | 12d 2D | 8 | |||||
| 3757.8b | 1.87 | 2.910.32 | 4.65 | 7.20.8 | O iii | V2 | 3757 | 3s 3Po | 3p 3D | 1 | 3 | ||
| 3769.9 | 2.89 | 4.50.5 | H i | H11 | 3770 | 2p 2Po | 11d 2D | 8 | |||||
| 3797.1 | 3.78 | 5.80.6 | H i | H10 | 3798 | 2p 2Po | 10d 2D | 8 | |||||
| 3815.9 | 1.08 | 1.70.4 | 12.9 | 205 | He ii | 3813 | 4f 2Fo | 19g 2G | 32 | ||||
| 3834.4 | 5.19 | 7.90.6 | H i | H9 | 3835 | 2p 2Po | 9d 2D | 8 | |||||
| 3868.0 | 50.8 | 76.51.3 | 29.5 | 44.41.8 | [Ne iii] | 3868 | 2p4 3P | 2p4 1D | 5 | 5 | |||
| 3888.0c | 12.3 | 18.50.7 | 12.6 | 18.90.7 | H i | H8 | 3889 | 2p 2Po | 8d 2D | 8 | |||
| 3922.0 | 0.52 | 0.780.21 | He ii | 3923 | 4f 2Fo | 15g 2G | 32 | ||||||
| 3967.5d | 26.5 | 38.61.2 | 18.7 | 27.31.8 | 80.6 | 1178 | [Ne iii] | 3967 | 2p4 3P | 2p4 1D | 3 | 5 | |
| 4024.8 | 1.68 | 2.400.35 | He i | 4024 | 2p 1Po | 7s 1S | 1 | 3 | |||||
| 4067.9 | 3.67 | 5.10.5 | [S ii] | 4068 | 3p3 4So | 2p3 2Po | 4 | 4 | |||||
| 4100.4e | 18.0 | 24.90.46 | 17.6 | 24.31.0 | 38.0 | 52.52.2 | H i | H6 | 4101 | 2p 2Po | 6d 2D | 8 | 72 |
| 4143.9 | 0.211 | 0.290.13 | He i | V53 | 4144 | 2p 1Po | 6d 1D | 3 | 5 | ||||
| 4198.2 | 1.26 | 1.670.25 | He ii | 4200 | 4f 2Fo | 11g 2G | 32 | ||||||
| 4226.7 | 0.24 | 0.320.10 | [Fe v] | 4227 | 3d4 5D | 3d4 3H | 9 | 9 | |||||
| 4340.0 | 38.1 | 47.51.2 | 30.3 | 37.71.9 | 34.2 | 42.62.3 | H i | H5 | 4340 | 2p 2Po | 5d 2D | 8 | 50 |
| 4362.5 | 14.6 | 18.00.6 | 7.82 | 9.60.6 | [O iii] | 4363 | 2p2 1D | 2p2 1S | 5 | 1 | |||
| 4386.6 | 0.36 | 0.440.10 | He i | V15 | 4388 | 2p 1Po | 5d 1D | 3 | 5 | ||||
| 4470.9 | 2.31 | 2.720.21 | He i | V14 | 4471 | 2p 3Po | 4d 3D | 9 | 15 | ||||
| 4541.2 | 2.94 | 3.350.19 | He ii | 4541 | 4f 2Fo | 9g 2G | 32 | ||||||
| 4640.8 | 1.92 | 2.10.8 | N iii | V2 | 4641 | 3p 2Po | 3d 2D | 4 | 6 | ||||
| 4685.6 | 88.6 | 95.02.1 | 117 | 1266 | 132 | 1426 | He ii | 4686 | 3d 2D | 4f 2Fo | 18 | 3 | |
| 4711.3 | 8.25 | 8.80.8 | 7.76 | 8.21.1 | [Ar iv] | 4711 | 3p3 4So | 3p3 2Do | 4 | 6 | |||
| 4725.6 | 1.84 | 1.90.7 | [Ne iv] | 4724 | 2p3 2Do | 2p3 2Po | 4 | 6 | |||||
| 4740.2 | 5.80 | 6.090.25 | 5.83 | 6.10.5 | [Ar iv] | 4740 | 3p3 4So | 3p3 2Do | 4 | 4 | |||
| 4861.6f | 100 | 100 | 100 | 100 | 100 | 100 | H i | H4 | 4861 | 2p 2Po | 4d 2D | 8 | 32 |
| 4921.8 | 0.70 | 0.70.5 | He i | V48 | 4922 | 2p 1Po | 4d 1D | 3 | 5 | ||||
| 4959.3 | 252 | 2433 | 168 | 1622 | 408.31 | 3948 | [O iii] | 4959 | 2p2 3P | 2p2 1D | 3 | 5 | |
| 5007.0 | 775 | 7355 | 516 | 4894 | 1109.88 | 105311 | [O iii] | 5007 | 2p2 3P | 2p2 1D | 5 | 5 | |
| 5145.5 | 0.30 | 0.27 : | [Fe vi] | 5145 | 3d3 4F | 3d3 2G | 8 | 8 | |||||
| 5176.9 | 0.25 | 0.22 : | [Fe vi] | 5176 | 3d3 4F | 3d3 2G | 10 | 10 | |||||
| 5198.7g | 2.02 | 1.800.25 | [N i] | 5198 | 2p3 4So | 2p3 2Do | 4 | 4 | |||||
| 5275.9 | 0.21 | 0.18 : | [Fe vi] | 5278 | 3d3 4F | 3d3 4P | 4 | 4 | |||||
| 5335.6 | 0.30 | 0.26 : | [Fe vi] | 5335 | 3d3 4F | 3d3 4P | 4 | 2 | |||||
| 5412.0 | 8.71 | 7.30.5 | 8.09 | 6.80.9 | He ii | 5411 | 4f 2Fo | 7g 2G | 32 | 98 | |||
| 5483.8 | 0.14 | 0.11 : | [Fe vi] | 5485 | 3d3 4F | 3d3 4P | 6 | 2 | |||||
| 5516.4 | 0.56 | 0.460.14 | [Cl iii] | 5517 | 3p3 4So | 3p3 2Do | 4 | 6 | |||||
| 5538.3 | 0.74 | 0.600.14 | [Cl iii] | 5537 | 3p3 4So | 3p3 2Do | 4 | 4 | |||||
| 5630.0 | 0.14 | 0.11 : | [Fe vi] | 5631 | 3d3 4F | 3d3 4P | 8 | 4 | |||||
| 5678.1 | 0.25 | 0.20 : | [Fe vi] | 5677 | 3d3 4F | 3d3 4P | 10 | 6 | |||||
| 5721.4 | 0.90 | 0.700.17 | [Fe vii] | 5721 | 3d2 3F | 3d2 1D | 5 | 5 | |||||
| 5755.4 | 5.73 | 4.420.19 | [N ii] | 5755 | 2p2 1D | 2p2 1S | 5 | 1 | |||||
| 5876.2 | 12.3 | 9.20.5 | He i | 5876 | 2p 3Po | 3d 3D | 9 | 15 | |||||
| 6037.9 | 0.18 | 0.130.14 | He ii | 6036 | 5g 2G | 21h 2Ho | 50 | ||||||
| 6072.8 | 0.24 | 0.180.16 | He ii | 6074 | 5g 2G | 20h 2Ho | 50 | ||||||
| 6086.2 | 1.61 | 1.160.15 | [Fe vii] | 6086 | 3d2 3F | 3d2 1D | 7 | 5 | |||||
| 6101.3 | 0.42 | 0.300.10 | [K iv] | 6102 | 3p4 3P | 3p4 1D | 5 | 5 | |||||
| 6117.9 | 0.32 | 0.230.13 | He ii | 6118 | 5g 2G | 19h 2Ho | 50 | ||||||
| 6169.9 | 0.31 | 0.220.12 | He ii | 6170 | 5g 2G | 18h 2Ho | 50 | ||||||
| 6232.5 | 0.49 | 0.340.14 | He ii | 6234 | 5g 2G | 17h 2Ho | 50 | ||||||
| 6300.3 | 8.52 | 5.890.25 | [O i] | 6300 | 2p4 3P | 2p4 1D | 5 | 5 | |||||
| 6311.8h | 5.02 | 3.470.14 | 4.51 | 3.110.19 | [S iii] | 6312 | 3p2 1D | 3p2 1S | 5 | 1 | |||
| 6363.6 | 2.68 | 1.830.11 | [O i] | 6363 | 2p4 3P | 2p4 1D | 5 | 3 | |||||
| Inner Region | Outer Region | NW Knot | |||||||||||
| Ion | Mult. | Lower | Upper | ||||||||||
| (Å) | (Å) | ||||||||||||
| 6405.5 | 0.72 | 0.490.11 | He ii | 6406 | 5g 2G | 15h 2Ho | 50 | ||||||
| 6434.1 | 2.70 | 1.820.12 | 2.58 | 1.740.17 | [Ar v] | 6435 | 3p2 3P | 3p2 1D | 3 | 5 | |||
| 6526.1 | 0.75 | 0.500.12 | [N ii] | 6527 | 2p2 3P | 2p2 1D | 1 | 5 | |||||
| 6547.5 | 77.1 | 515 | 23.1 | 15.22.3 | 219 | 14426 | [N ii] | 6548 | 2p2 3P | 2p2 1D | 3 | 5 | |
| 6561.9 | 468 | 33920 | 387 | 25519 | 585 | 38532 | H i | 6563 | 2p 2Po | 3d 2D | 8 | 18 | |
| 6582.9 | 248 | 1625 | 69.9 | 45.82.3 | 540 | 35422 | [N ii] | 6583 | 2p2 3P | 2p2 1D | 5 | 5 | |
| 6678.3i | 4.13 | 2.70.4 | He i | V46 | 6678 | 2p 1Po | 3d 1D | 3 | 5 | ||||
| 6715.7 | 7.51 | 4.810.22 | 3.58 | 2.290.21 | [S ii] | 6716 | 2p3 4So | 2p3 2Do | 4 | 6 | |||
| 6730.5 | 12.7 | 8.110.25 | 6.27 | 4.000.25 | 47.6 | 30.42.4 | [S ii] | 6731 | 2p3 4So | 2p3 2Do | 4 | 4 | |
| 6820.9 | 0.52 | 0.330.12 | [Fe v] | 6819 | 3d4 3P4 | 3d4 1S4 | 3 | 1 | |||||
| 6889.8 | 1.13 | 0.700.14 | He ii | 6891 | 5g 2G | 12h 2Ho | 50 | ||||||
| 7004.8 | 6.43 | 3.900.20 | 3.97 | 2.410.24 | [Ar v] | 7006 | 3p2 3P | 3p2 1D | 5 | 5 | |||
| 7065.2 | 7.22 | 4.330.24 | 4.00 | 2.400.26 | He i | 7065 | 2p 3Po | 3s 3S | 9 | 3 | |||
| (H)j | 11.85 | 13.61 | 14.47 | ||||||||||
- a
-
A blend of the [O ii] 3726, 3729 lines.
- b
-
Blended with the O iii 3760 (3s 3P – 3p 3D3) line.
- c
-
Blended with the He i 3888 (2s 3S – 3p 3Po) line.
- d
-
Blended with the H i 3970 (2p 2Po – 7d 2D) line.
- e
-
Blended with the N iii 4103 (3s 2S1/2 – 3p 2P) line.
- f
-
Blended with He ii 4859 line, whose flux contribution is negligible. The same happens to H, whose is blended with He ii 6560. See the text for details.
- g
-
Blended with the [N i] 5200 (2p3 4S – 2p3 2D) line.
- h
-
Corrected for the flux of the blended He ii 6311 (5g 2G – 16h 2Ho) line.
- i
-
Corrected for the flux of the blended He ii 6683 (5g 2G – 13h 2Ho) line.
- j
-
erg cm-2 s-1 in our extracted spectra.
4 Spectral analysis
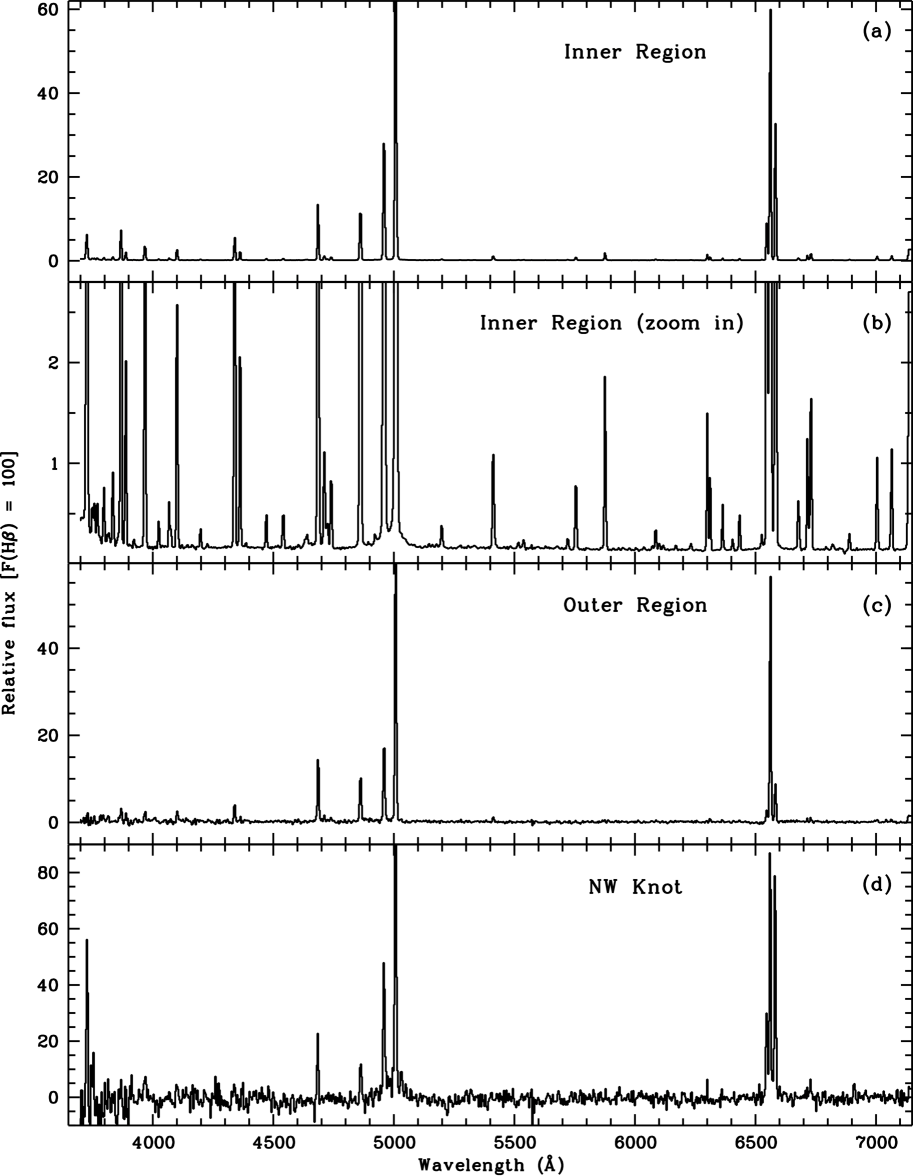
One-dimensional (1-D) spectra of the bright inner region, the bipolar lobes, and the bipolar knots were extracted with the spatial extents shown in the H image in Figure 1-left. The contamination by a background star with absorptions in the hydrogen Balmer lines renders of little use of the spectrum of the SE knot. The 1-D spectra showed scattered light from the bright inner region of the H+[O iii] and H+[N ii] lines. As a result, the 1-D spectra displayed a pedestal of emission under the [O iii] and H+[N ii] lines. We removed this dispersed light by fitting a long-pass Gaussian profile to the nebular continuum around these lines. After this correction, the [O iii] 5007/4959 and [N ii] 6583/6548 line ratios measured from the spectra are both close to their theoretical value of 3. The corrected 1-D spectra are shown in Figure 7. We also integrated total fluxes of the [O iii] 5007, [N ii] 6583, and H emission lines for the main nebula and estimated the surface brightnesses. The brightness values were used to calibrate the ALFOSC narrow-band images of Hu 1-2 (Section 2.1).
4.1 Physical conditions
The 1-D intermediate-dispersion, normalized spectra of the inner region, outer region, and NW knot of Hu 1-2 are shown in Figure 7. Although at intermediate-dispersion, the long slit spectrum of Hu 1-2 presented here proves to be very deep. The signal-to-noise ratio (S/N) of the spectrum of the inner region is particularly high, and thus many weak emission lines with fluxes lower than 1% of H are detected (see Figure 7). The emission lines detected in the spectra of the three regions are compiled in Table 2.
We derived a logarithmic extinction parameter, (H), of in the inner region of Hu 1-2 using the observed H/H line ratio. Here the theoretical H/H line ratio was adopted from Storey & Hummer sh95 (1995), assuming an electron temperature of 10 000 K and a density of 104 cm-3. Our (H) value agrees with 0.60 given by Pottasch et al. (pot03 2003; also Hyung, Pottasch & Feibelman hyu04 2004), who carried out echelle spectroscopy at the center of Hu 1-2 with a slit entrance 124″, i.e., also the inner region of Hu 1-2. Earlier observations by Peimbert & Torres-Peimbert ptp87 (1987) and Aller & Czyzak ac79 (1979) gave an extinction value of 0.64 and 0.61, respectively. The (H) values derived for the outer region and the NW knot are 0.40 and 0.90, respectively. Given the more accurate emission-line measurements for the inner region, we adopted 0.61 as the extinction in all three regions of Hu 1-2, although we cannot totally rule out the possibility that extinction in the NW knot could be higher. The extinction law of Whitford whit58 (1958) was used to apply this correction. We found that the use of different extinction laws (e.g., Whitford whit58 1958; Savage & Mathis sm79 1979; Cardelli, Clayton & Mathis ccm89 1989) results in differences in the extinction-corrected fluxes of emission lines in the optical range from 3700 Å to 7100 Å lower than 5%.
The extinction-corrected relative line intensities, (), together with the estimated errors, are given in Table 2. Errors in the line intensities were estimated from multiple measurements of the observed fluxes, through the almost linear relation between the two quantities,
| (2) |
where () is the reddening function, normalized to (H) = 0, adopted from Whitford whit58 (1958). Uncertainties in the extinction function are supposed to be negligible, as discussed in the previous paragraph. Flux calibration, which can affect the observed fluxes and consequently the extinction-corrected relative line intensities, was supposed to be accurate.
The [O iii] 5007 line was saturated in the long-exposure (1800 s) spectrum of the inner region, and the flux from the short-exposure (180 s) spectrum was thus used in Table 2. The He ii 6560 (4f 2Fo – 6g 2G) line is blended with H. Using the theoretical line ratios of the hydrogenic ions (Storey & Hummer sh95 1995) and the He ii 4686 line fluxes measured in our spectra, we estimated that the He ii 6560 line contributes 3% and 6% to the total flux of H in the inner and outer region of Hu 1-2, respectively. As a consequence, the corrected fluxes of H will result in an increase in (H) by 9% and 14% in the two regions. That will cause negligible changes in the extinction-corrected line intensities, given that the extinction in Hu 1-2 is low and that the inner-region extinction was adopted for the whole nebula.
The electron temperatures and densities derived for the inner and outer regions using the detected emission lines are presented in Table 3. The [O iii] nebular-to-auroral line ratio yielded a temperature of 16 800 K for the inner region, and 15 200 K for the outer region. The [N ii] line ratio yielded a temperature of 13 000 K in the inner region, but the temperature-sensitive 5755 auroral line was not detected in the outer region. We adopted the above two temperatures for the high- and low-excitation regions in Hu 1-2. An averaged electron density of 5700 cm-3 in the inner region was derived from the [S ii] 6716/6731 and [Cl iii] 5517/5537 line ratios. It agrees with the density 5770 cm-3 in the outer region, as yielded by the [S ii] lines (Table 3). The [Cl iii] lines were not detected in the outer region.
4.2 Chemical abundances
4.2.1 Ionic abundances
Using the electron temperatures defined for the high- and low-excitation zones, we derived the ionic abundances of helium and heavy elements presented in Table 4. The He i effective recombination coefficients used for abundance determination were adopted from Benjamin, Skillman & Smits bss99 (1999). For the inner region, we adopted the He+/H+ abundance ratio derived from the 5876 line which is the strongest He i line. For the outer region, the He+/H+ abundance derived from the 7065 line was adopted. No He i lines were detected in the spectrum of the NW knot.
The He2+/H+ abundance was derived from the He ii 4686 line, which is very strong in all the three regions of Hu 1-2 (Figure 7). The extinction-corrected flux of the He ii 4686 line in the outer region is even higher than that of the H line by 25%, in consistency with the low intensities of the [N ii] and [O ii] nebular lines. Note, however, that the relative strengths of the [O ii] 3727 (a blend of the 3726, 3729 doublet), [N ii] 6548, 6583, and He ii 4686 lines in the NW knot are higher than those in the inner and outer regions (Table 2). The He/H abundance is a sum of the He+/H+ and He2+/H+ ratios and are given in Table 5. The He/H ratio in the inner region (0.144) is slightly lower than that in the outer region (0.159), but a little higher than the NW knot, where no He i line was detected. The absence of He i lines in the NW knot probably indicates that helium in the NW knot is all doubly ionized, although the relatively low S/N’s of the spectrum in this region may hinder the detection of the He i lines. Given that measurements of the He i 7065 line in the outer region of Hu 1-2 have relatively large uncertainties, the He/H abundance in the outer region is considered to agree with that in the inner region within the errors.
The N+/H+ abundance derived from the [N ii] 6583 line was adopted for the three regions because measurements of the relatively weaker 6548 line were much affected by the nearby H line. The Ne2+/H+ abundances derived from the [Ne iii] 3869 line were adopted because the [Ne iii] 3967 line was blended with the H i 3970 line. The [S iii] 6312 line was observed in the inner and outer regions. It was blended with the He ii 6311 (5g 2G – 16h 2Ho) line, whose flux contribution was estimated from the observed 4686 line using the hydrogenic atomic model of Storey & Hummer sh95 (1995). The corrected flux of the [S iii] 6312 line was used to derive S2+/H+. The Ar3+/H+ ratio derived from the [Ar iv] 4740 line was adopted for Hu 1-2, as the 4711 line was blended with [Ne iv] lines.
The abundance errors following the ionic abundance ratios in Table 4 were mainly propagated from the measurement errors of the extinction-corrected relative line intensities given in Table 2. Both the [O iii] 4363 and the [N ii] 5755 temperature-sensitive auroral lines were well detected in the inner region of Hu 1-2, and the electron temperatures derived from these ions were adopted for all the three regions when calculating ionic abundance ratios (Table 4). Thus the errors in the electron temperature were small (Table 3) and not considered in the ionic abundance calculations.
4.2.2 Elemental abundances
The elemental abundances of He, N, O, Ne, S, and Ar in Table 5 were calculated using the ionization correction factor (ICF) method of Kingsburgh & Barlow kb94 (1994). No elemental abundances were calculated for the NW knot because the He i line needed for ICF calculations was not detected in this region. The He/H abundance in the inner region of Hu 1-2 derived in this paper is 10% higher than that derived by Pottasch et al. pot03 (2003) and Hyung, Pottasch & Feibelman hyu04 (2004), but it agrees with that of Peimbert & Torres-Peimbert ptp87 (1987) and Peimbert, Luridiana & Torres-Peimbert pltp95 (1995) within the errors. Meanwhile, the nitrogen abundance derived for the inner region by us is 50% higher than that of the outer region, and both are lower than that of previous observations. The oxygen, neon and sulfur abundances in this paper generally agree with those of Pottasch et al. pot03 (2003) and Hyung, Pottasch & Feibelman hyu04 (2004), while our argon abundance is slightly lower. However, uncertainties in abundances were not indicated in the two previous studies. We also notice that the inner-region abundances of N, O, and Ne are higher than those in the outer region.
Errors in the brackets following the total elemental abundances in Table 5 (the first two columns) were estimated mainly based on the errors in the ionic abundances through a simple propagation paradigm. For helium, the error is contributed by uncertainties in the He+/H+ and He2+/H+ ratios. For heavy elements, the errors can also be introduced by the use of ICFs. This source of error is negligible for oxygen, whose ICF is always close to unity. For other heavy elements, uncertainties introduced by ICFs could be significant. The nitrogen and neon abundances were derived based on the ionic and elemental abundances of oxygen, and thus are reliable. The total sulfur abundance is generally quite uncertain, as usually only the [S ii] lines are well observed for this element. Although the [S iii] 6312 line was also detected in the spectrum of Hu 1-2 (Table 2), it arises from an auroral transition (3p2 1D2 – 3p2 1S0), hence it is particularly temperature sensitive. Besides, the [S iii] 6312 line is also blended with the He ii 6311 (5g 2G – 16h 2Ho) line. Uncertainties and systematic errors in the ICFs are difficult to define, and thus they were not considered for the error estimate of our object. The actual uncertainties in the elemental abundances of nitrogen, neon, sulfur and argon in Table 5 must be regarded as lower limits of the real abundance uncertainties.
Average abundances of Type I, bulge, and disc PNe as well as the solar abundances are also presented in Table 5 for comparison. The He/H abundances of the inner and outer regions of Hu 1-2 are both higher than 0.14, whereas the N/O ratios of the two regions are both close to 0.9. The He/H and N/O abundance ratios, generally in line with those of Pottasch et al. pot03 (2003) and Hyung, Pottasch & Feibelman hyu04 (2004), indicate that Hu 1-2 belongs to Type I PNe (Peimbert & Torres-Peimbert ptp83 1983). On the other hand, the elemental abundances of oxygen, neon, sulfur, and argon in Hu 1-2 are lower than the average abundances of bulge and disc PNe (see Table 5). This difference in abundances is real for the heavy elements, given the uncertainties presented in Table 5 (see the discussion above). Since these four elements were not supposed to be produced or depleted in the central star during its evolution444 This is not the exact case for, at least, the production of neon in some low- and intermediate-mass stars, as analyzed by, e.g., Wang & Liu wl08 (2008) and Milingo et al. mil10 (2010). Karakas & Lattanzio kar03 (2003) also predicted that neon can be produced in a narrow range of stellar mass. , their very low abundances reflect those of the interstellar medium from which the progenitor star of Hu 1-2 formed. Indeed the Ne/H vs. O/H, S/H vs. O/H, and Ar/H vs. O/H abundance patterns of elements in Hu 1-2 generally agree with those established for H ii regions and blue compact galaxies by Milingo et al. (2010; Figures 1–10 therein). In these figures, the loci of Hu 1-2 are found at the low abundance tail of the samples of Type I PNe (Milingo et al. 2010) and Galactic anticenter PNe (Kwitter et al. 2010).
| Inner region | Outer region | |
| (K) | ||
| O iii | 16 800250 | 15 200400 |
| N ii | 13 000400 | |
| (cm-3) | ||
| S ii | 51001300 | 57702200 |
| Cl iii | 64002800 | |
| Ar iv | 39001600 | 32002500 |
| Ion | Abundance | ||||
|---|---|---|---|---|---|
| (Å) | (K) | (X+/H+) | |||
| Inner | Outer | Knot | |||
| He+ | 4471 | 10 000 | 0.0520.004 | ||
| He+ | 5876 | 10 000 | 0.0600.003 | ||
| He+ | 7065 | 10 000 | 0.0870.005 | 0.0480.005 | |
| He2+ | 4686 | 16 800 | 0.0840.002 | 0.1110.005 | 0.1260.007 |
| N+ | 5755 | 13 000 | 1.70(0.25)10-5 | ||
| N+ | 6548 | 13 000 | 1.66(0.10)10-5 | 4.96(0.33)10-6 | 4.7(0.4)10-5 |
| N+ | 6583 | 13 000 | 1.79(0.12)10-5 | 5.1(0.4)10-6 | 3.93(0.30)10-5 |
| O+ | 3727 | 13 000 | 1.92(0.25)10-5 | 5.9(0.8)10-6 | 1.40(0.12)10-4 |
| O2+ | 4363 | 16 800 | 5.9(0.5)10-5 | 3.16(0.24)10-5 | |
| O2+ | 4959 | 16 800 | 5.67(0.24)10-5 | 3.78(0.15)10-5 | 9.2(0.4)10-5 |
| O2+ | 5007 | 16 800 | 5.90(0.25)10-5 | 3.95(0.18)10-5 | 8.5(0.4)10-5 |
| Ne2+ | 3869 | 16 800 | 1.40(0.07)10-5 | 8.1(0.6)10-6 | |
| Ne2+ | 3967 | 16 800 | 2.34(0.14)10-5 | 1.66(0.14)10-5 | 7.1(0.5)10-5 |
| S+ | 4068 | 13 000 | 4.26(0.35)10-7 | ||
| S+ | 6716 | 13 000 | 3.4(0.4)10-7 | 1.62(0.24)10-7 | |
| S+ | 6731 | 13 000 | 3.28(0.30)10-7 | 1.62(0.18)10-7 | 1.23(0.14)10-6 |
| S2+ | 6312 | 13 000 | 2.66(0.35)10-6 | 2.26(0.26)10-6 | |
| Cl2+ | 5517 | 13 000 | 3.7(0.4)10-8 | ||
| Cl2+ | 5537 | 13 000 | 3.77(0.34)10-8 | ||
| Ar3+ | 4711 | 16 800 | 4.8(0.9)10-7 | 4.6(0.8)10-7 | |
| Ar3+ | 4740 | 16 800 | 3.27(0.50)10-7 | 3.3(0.6)10-7 | |
| Ar4+ | 6435 | 16 800 | 2.9(0.4)10-7 | 2.8(0.5)10-7 | |
| Ar4+ | 7006 | 16 800 | 2.31(0.36)10-7 | 1.43(0.26)10-7 | |
| K3+ | 6102 | 16 800 | 8.1(2.1)10-9 | ||
- a
-
Number ratios relative to hydrogen.
- b
-
The effective recombination coefficients used for the He+/H+ abundance calculations were adopted from Benjamin, Skillman & Smits bss99 (1999), where only three temperature cases, 5000 K, 10 000 K, and 20 000 K are presented. We have used the He i atomic data at 10 000 K, which is close to the low-excitation temperature (13 000 K) derived for Hu 1-2.
| Ele. | Abundance (X/H) | |||||||
|---|---|---|---|---|---|---|---|---|
| Innera | Outerb | Pottaschc | Hyungd | PTP87e | Bulgef | Diskg | Solarh | |
| He | 0.1440.013 | 0.1590.022 | 0.127 | 0.130 | 0.147 | 0.105 | 0.115 | 0.085 |
| N | 1.31(0.22)10-4 | 8.7(1.7)10-5 | 1.910-4 | 1.710-4 | 2.210-4 | 1.4810-4 | 2.1910-4 | 6.7610-5 |
| O | 1.40(0.20)10-4 | 1.01(0.14)10-4 | 1.610-4 | 1.310-4 | 1.610-4 | 3.9810-4 | 5.0110-4 | 4.9010-4 |
| Ne | 3.3(0.7)10-5 | 2.1(0.5)10-5 | 4.910-5 | 3.010-5 | 3.610-5 | 9.7710-5 | 1.3510-4 | 8.5110-5 |
| S | 4.2(1.3)10-6 | 4.4(1.5)10-6 | 4.210-6 | 3.510-6 | 6.9210-6 | 1.1210-5 | 1.3210-5 | |
| Ar | 7.8(2.2)10-7 | 8.4(2.9)10-7 | 1.110-6 | 1.110-6 | 7.910-7 | 1.5810-6 | 2.1910-6 | 2.5110-6 |
- a
-
Elemental abundances of the inner region of Hu 1-2.
- b
-
Elemental abundances of the outer region of Hu 1-2.
- c
-
Pottasch et al. pot03 (2003).
- d
-
Hyung, Pottasch & Feibelman hyu04 (2004).
- e
-
Peimbert & Torres-Peimbert ptp87 (1987).
- f
- g
-
Average abundances given by Wang & Liu wl07 (2007) for 58 Galactic disc PNe.
- h
-
Solar values from Asplund et al. asp09 (2009).
4.3 Could Hu 1-2 be a halo PN?
The abundances of the heavy elements of Hu 1-2 are generally consistent with those of the halo PNe, given their comparatively large abundance scatter as opposed to the disc PNe (Howard, Henry & McCartney hhm97 1997). Note, however, that the helium abundances of Hu 1-2 are slightly higher than those of the sample of halo PNe studied by Howard, Henry & McCartney hhm97 (1997). It is thus pertinent to question whether Hu 1-2 is a halo PN or not.
Halo PNe are characterized by their height above the Galactic plane, their kinematic characteristics, and/or their low metallicity relative to disc PNe. Specifically Peimbert pei90 (1990) proposed 0.8 kpc, 60 km s-1, and (O/H)+12 8.1 as the criteria for halo PNe, where is the distance to the Galactic plane and is the peculiar radial velocity, which is the difference between the observed systemic radial velocity of a PN and its circular radial velocity ( = ; Peña, Rechy-García & García-Rojas pena13 2013). For Hu 1-2, at a Galactic latitude of 88, its distance of 3.5 kpc (Miranda et al. 2012a ) implies a height of 0.55 kpc over the Galactic plane. Its oxygen abundance is (O/H)+12 8.1 (see Table 5). Therefore, the oxygen abundance and its distance to the Galactic plane marginally support a halo nature. However, following the formulation by Peña, Rechy-García & García-Rojas (pena13, 2013, Equation 1 therein), assuming a galactocentric distance of 8.3 kpc for the Sun, adopting a distance of 3.5 kpc to Hu 1-2, and taking into account the systemic velocity of 3.31.7 km s-1 (see Section 3.2), we obtain a peculiar velocity of 22 km s-1, which is much lower than required for a PN to belong to the halo. From these results we conclude that most probably Hu 1-2 is not a halo PN.
4.4 Excitation mechanism of the outer knots
The H, [N ii] and [O iii] composite picture of Hu 1-2 (Figure 2) shows two bipolar knots at a distance 27″ from the central source. The ionization and excitation conditions of these knots are studied in detail in this section using our narrow-band images and long-slit intermediate-dispersion spectroscopy. Since the SE knot is partially superimposed by a field star, our analysis will be mainly based on the NW knot, in which a bow-shock-like structure is otherwise clearly observed.
Figure 8 shows the NOT ALFOSC H, [O iii] 5007, and [N ii] 6583 surface brightness distributions (or 1-D profiles) projected along the line that connects the NW knot to the center of Hu 1-2. The knot has single-peaked profiles in the three emission lines, but they show notable differences. The H and [O iii] emissions extend inward from the head of the bow-shock toward the central source, whereas the distribution of the [N ii] line has a single peak. The positions of the peaks in different emission lines also differ; the [N ii] peak is the farthest from the central source, the H peak is located at an intermediate distance, and the [O iii] peak is the closest to the central source. This same pattern is observed in the bow-shock structures of IC 4634 and NGC 7009 (Raga et al. raga2008 2008). The position of the [N ii] peak coincides with that of the H2 emission, further confirming the small thickness of the shell of low-ionization material. For a distance of 3.5 kpc (Miranda et al. 2012a ), the spatial shifts between the H and the [N ii] and [O iii] peaks are 3.51015 cm and 1016 cm, respectively. These are similar, but somewhat larger, than the shifts of a few times 1015 cm observed in the outer bow shocks of IC 4634 and NGC 7009.
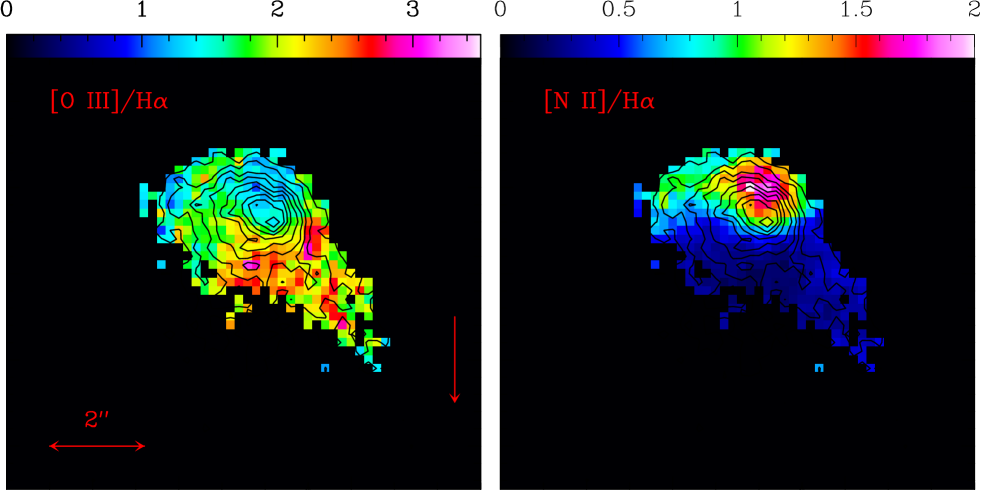
Figure 9 shows the [O iii]/H and [N ii]/H ratio maps of the NW knot obtained at each pixel with surface brightness above a threshold value of 3 from the background. Abrupt changes in these emission line ratios are observed at the position of the H peak. At the leading edge of the bow-shock, the [O iii]/H has values of 1.2–1.8. Behind the H peak, the [O iii]/H ratio increases up to values 2–3, following the ionization stratification also found in the FLIERs of other PNe (Balick et al. balick1998 1998; Riera & Raga rr2007 2007). At the head of the bow-shock, where the [O iii]/H ratio declines, the [N ii] emission is enhanced, with [N ii]/H ratios of 2–3, significantly raised from the value 0.5 detected upstream. In short, the NW knot of Hu 1-2 shows a low-excitation [N ii]-bright head and a high-excitation [O iii]-bright, arc-shaped wing and upstream region.
Our intermediate-dispersion spectroscopy cannot resolve spatially the ionization structure seen in the NOT ALFOSC images, but the use of additional line diagnostic diagrams provides further constraint on the excitation conditions of this knot. The spectrum of the NW knot is characterized by lines of intermediate-to-high excitation. Besides the H i Balmer lines, the strongest optical lines are [O ii] 3727, [O iii] 4959, 5007, [N ii] 6548, 6583, and He ii 4686. We also detect the strong, high excitation [Ne iii] 3967 line in the NW knot. The intensities of the [O ii] 3727, [N ii] 6548, 6583 and [S ii] 6716, 6731 emission lines relative to H are much stronger in the NW knot than in the inner and outer regions.
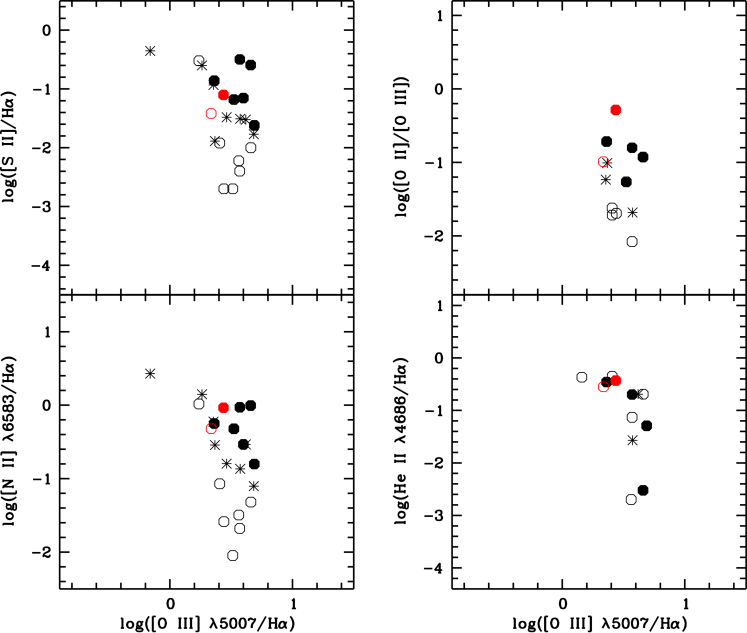
Figure 10 shows the observed line ratios in different regions of Hu 1-2 compared to those measured in the rims/shells and low-ionization structures of a sample of PNe using a set of diagnostic diagrams adopted from Raga et al. raga2008 (2008). In these diagrams, the data points associated to the rims and shells of PNe trace the locus of photoionized gas. The data points corresponding to low-ionization structures have been split into two different groups. The first one includes low-ionization structures that are projected inside the nebular shells (e.g., the FLIERs of NGC 6826), whereas the second group consists of those projected outside the nebular shells (e.g., the bow-shock features of IC 4634). This very simple classification is expected to assign mostly low-velocity photoionized structures to the first group, whereas the second group will be mostly populated by fast outflows, where irradiated shocks are expected to occur.
In the [S ii]/H and [N ii]/H versus [O iii]/H diagrams, the data points of Hu 1-2 are located in the regions occupied by other PNe (Figure 10). In particular, the emission line ratios for the NW knot are compatible with those of the low-ionization structures in other PNe, with the [S ii]/H and [N ii]/H ratios consistently higher (by definition) than those derived for the photoionized rims and shells of PNe. Furthermore, the [O iii]/H ratios of outflows tend to be higher than those of low-ionization structures projected inside the nebular shells. This can be evidence of an additional source of excitation, i.e., the shocks, particularly at larger distances from the central source, where the ionizing flux of photons is reduced and thus lower [O iii]/H ratios would have been expected instead. It is also interesting to note that the NW knot of Hu 1-2 shows higher [O ii]/[O iii] and He ii/H ratios than those typically seen in the low-ionization structures and outflows of other PNe. The He ii/H ratios in the NW knot is also compatible with that observed in the inner region of Hu 1-2 (Figure 10, bottom right). These patterns observed in Hu 1-2 might be a consequence of the very high temperature of its central star (125 000 K; Hyung, Pottasch & Feibelman hyu04 2004). The NW knot of Hu 1-2 probably harbors a significant amount of high-excitation material, and its relative amount of the high- to low-excitation material could be higher than that in the outflows and low-ionization structures of other PNe, making it a very peculiar structure.
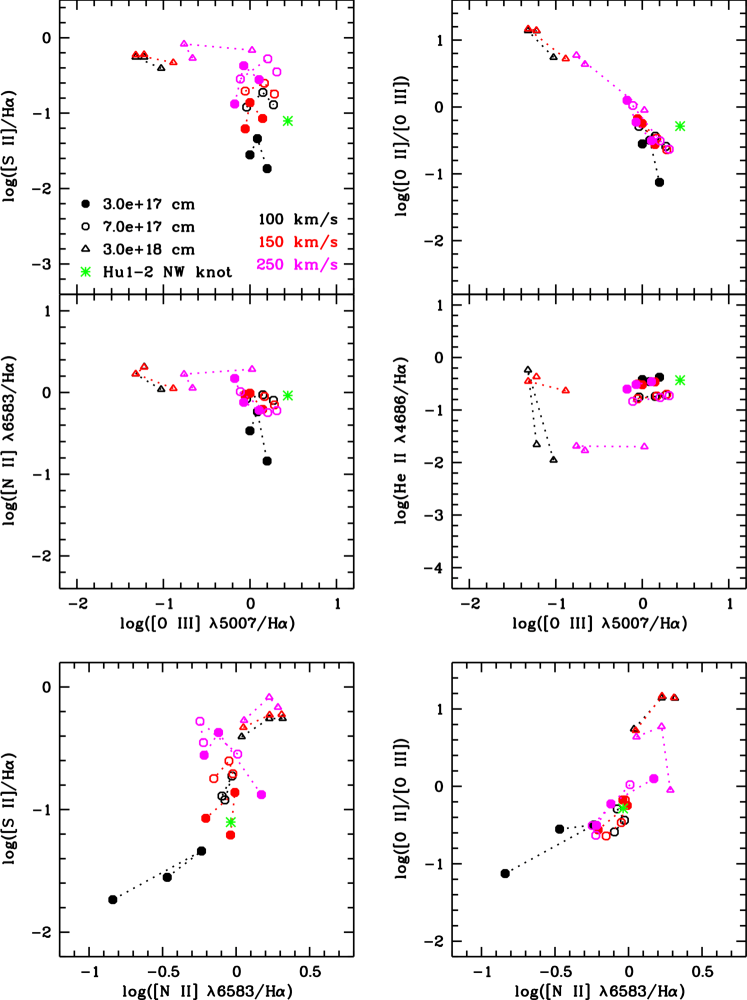
The observed line ratios in the NW knot of Hu 1-2 are also compared in Figure 11 with the predictions for shocked regions in high-velocity knots of PNe developed by Raga et al. raga2008 (2008). This comparison helps to diagnose the excitation mechanisms (photoionization, shocks, or both) in the NW knot. These models assume a cloudlet traveling away from a photoionizing source into a uniform medium (102 cm-3). The simulations include transfer of the ionizing radiation and a non-equilibrium ionization network of many ionic species. In Figure 11, We present the predicted line ratios from an “ad hoc” model for Hu 1-2 where a high-density (103 cm-3), high-velocity ( = 100, 150 and 250 km s-1) cloudlet with the chemical abundances measured in Hu 1-2 is moving away from a 100 000-K central star. Cases with different distances from the central source (31017, 71017 and 31018 cm) have been simulated. Those are axisymmetric simulations, and the initial temperature of the clump/cloudlet was set to be 104 K. In order to compare the observations and the numerical simulations, we integrated the computed emission line coefficients over the entire emitting volume to derive the emission line luminosities of the NW knot of Hu 1-2. Predicted line ratios for different integration times since the start of the shock are summarized in Table 6.
The predicted [S ii]/H, [N ii]/H, [O ii]/[O iii] and He ii/H line ratios in Table 6 show a large scatter, but they are generally comparable to those derived from the observations of Hu 1-2. The plots in Figure 11 show that the best models to reproduce the observed line ratios in the NW knot of Hu 1-2 are those for a knot at distances of a few times 1017 cm. Models at the largest distance, 31018 cm, generally predict too low [O iii]/H ratios, which can be explained by the greater dilution of the ionizing flux from the central star. For models where the knot has smaller distances (1017 cm) from the central source (this is equivalent to changes in the ionizing flux at the clump), all predicted line ratios agree with those observed in the NW knot of Hu 1-2 within a factor of 2 to 3. Given the simplicity and limitations of our models (a spherical clump moving away from the central source through a constant medium, where the absorption of the photons by nebular gas between the star and the clump is not accounted for), the discrepancies between the observed line ratios and those predicted can be considered to be reasonable.
The plots in Figure 11 also help to constrain the knot velocity. Models at low velocity (100 km s-1) tend to predict [S ii]/H, [N ii]/H, and [O ii]/[O iii] line ratios lower than those observed in Hu 1-2. On the contrary, models at high velocity (250 km s-1) predict too high values for these line ratios. Therefore, the knot velocity seems constrained in the range 100–250 km s-1. We note that this knot velocity is smaller than the outflow velocity 340 km s-1 derived from a spatio-kinematical model of the outflow (Miranda et al. 2012a ).
Finally, we remark the persistent difficulty of our models to reproduce the observed [O iii]/H line ratios. This issue can be alleviated by increasing the oxygen abundance assumed by our model. We tested this by increasing the oxygen abundance, and found that increasing the abundance within the uncertainty of our abundance determination produced some improvement (not shown in Figure 11); however it was insufficient to reproduce the observed [O iii]/H line ratio.
| Distance | [O ii]/H | [O iii]/H | [N ii]/H | [S ii]/H | He ii/H | ||
|---|---|---|---|---|---|---|---|
| (km s-1) | (1018 cm) | (years) | |||||
| 100 | 0.3 | 50 | 0.280 | 1.000 | 0.340 | 0.028 | 0.380 |
| 200 | 0.388 | 1.220 | 0.582 | 0.046 | 0.347 | ||
| 350 | 0.118 | 1.580 | 0.145 | 0.018 | 0.421 | ||
| 100 | 0.7 | 50 | 0.468 | 0.915 | 0.839 | 0.120 | 0.176 |
| 200 | 0.515 | 1.410 | 0.938 | 0.188 | 0.181 | ||
| 350 | 0.482 | 1.870 | 0.802 | 0.129 | 0.193 | ||
| 100 | 3.0 | 50 | 0.519 | 0.094 | 1.090 | 0.393 | 0.011 |
| 200 | 0.659 | 0.048 | 1.680 | 0.553 | 0.578 | ||
| 350 | 0.826 | 0.060 | 2.070 | 0.554 | 0.022 | ||
| 150 | 0.3 | 50 | 0.588 | 0.882 | 0.916 | 0.062 | 0.313 |
| 200 | 0.566 | 1.000 | 0.981 | 0.138 | 0.302 | ||
| 350 | 0.384 | 1.400 | 0.622 | 0.085 | 0.343 | ||
| 150 | 0.7 | 50 | 0.588 | 0.882 | 0.951 | 0.196 | 0.164 |
| 200 | 0.501 | 1.470 | 0.894 | 0.249 | 0.185 | ||
| 350 | 0.439 | 1.920 | 0.705 | 0.179 | 0.200 | ||
| 150 | 3.0 | 50 | 0.684 | 0.130 | 1.120 | 0.468 | 0.233 |
| 200 | 0.704 | 0.048 | 1.690 | 0.592 | 0.352 | ||
| 350 | 0.835 | 0.060 | 2.040 | 0.597 | 0.429 | ||
| 250 | 0.3 | 40 | 0.838 | 0.666 | 1.486 | 0.132 | 0.250 |
| 120 | 0.503 | 0.847 | 0.759 | 0.425 | 0.306 | ||
| 200 | 0.401 | 1.276 | 0.606 | 0.278 | 0.346 | ||
| 250 | 0.7 | 40 | 0.815 | 0.775 | 1.025 | 0.283 | 0.146 |
| 120 | 0.500 | 1.606 | 0.568 | 0.525 | 0.173 | ||
| 200 | 0.477 | 2.047 | 0.600 | 0.352 | 0.188 | ||
| 250 | 3.0 | 40 | 0.943 | 0.217 | 1.132 | 0.535 | 0.017 |
| 120 | 1.026 | 0.173 | 1.679 | 0.826 | 0.021 | ||
| 200 | 0.946 | 1.056 | 1.925 | 0.683 | 0.020 | ||
| Observationsa | 1.415 | 2.735 | 0.920 | 0.080 | 0.368 | ||
- a
-
Observations of the NW knot of Hu 1-2.

4.5 The jet-launching engine of Hu 1-2
The total mass, momentum and mechanical luminosity of the jets can be used to assess the jet-launching engine of a PN or proto-PN (e.g., Bujarrabal et al. buj01 2001; Blackman & Lucchini bl14 2014). Similar diagnosis is carried out for Hu 1-2 below. The ionized mass of the NW knot can be estimated from its H flux. Using the total H flux of the NW knot derived from the NOT H flux-calibrated image presented in Figure 1 and the H to H ratio derived 1-D spectrum in Table 2, we derived a total H flux of 310-15 erg cm-2 s-1 for the NW knot. Adopting a distance of 3.5 kpc (Miranda et al. 2012a ), and an angular radius of 2″, an electron temperature of 104 K, and a filling factor of 0.4, we estimated an electron density of 200 cm-3 and an ionized mass of 210-5 for the bipolar knots of Hu 1-2.
The dynamical age of the bipolar knots of Hu 1-2 is well constrained to be 1375 yr under the assumption that the knots have been moving ballistically since their ejection (Miranda et al. 2012a ). Under the same assumption, the ejection time-scale of these knots can be estimated from the ratio between their angular size, 4″, and their distance to the central star, 27″. This result in an ejection time-scale () 200 yr. The averaged mass-loss rate during the ejection would then be 110-7 yr-1.
The mechanical luminosity of the jets can be estimated using the equation
| (3) |
where is the total ionized mass of the knots, is the expansion velocity (340 km s-1; Miranda et al. 2012a ), and is the jet ejection time-scale (200 yr). Thus the jets mechanical luminosity of Hu 1-2 would be 0.5 . The total energy of the jets is 1.21043 erg, which is lower than the kinetic energies of fast outflows in proto-PNe (e.g., the sample studied by Bujarrabal et al. buj01 2001) by at least one order of magnitude. The momentum estimated for the bipolar knots of Hu 1-2 is 1.41036 g cm s-1, also much lower than those (1037–1040 g cm s-1) observed in proto-PNe, whose high linear momenta defy any easy interpretation (Bujarrabal et al. buj01 2001).
| PN | ||||
|---|---|---|---|---|
| () | (km s-1) | (yr) | () | |
| Hu 1-2 | 210-5 | 340 | 200 | 0.5 |
| The Necklacea | 10-3 | 95(N), 115(S) | 3700–8000 | 0.1–0.23 |
| NGC 6778a | 1.510-3 | 270, 460 | 1700 | 5.3 |
- a
-
From Tocknell, De Marco & Wardle toc14 (2014).
The parameters associated to the jet launching in Hu 1-2 and those studied by Tocknell, De Marco & Wardle toc14 (2014) are presented in Table 7. A comparison among them indicates that the bipolar knots of Hu 1-2 are lighter, less massive than those of the Necklace Nebula and NGC 6778, whereas their ejection time-scale is much shorter. The two effects combined result in very similar mechanical luminosities for all sources in Table 7. We note the large uncertainty in the estimate of the ejection time-scale of the knots of Hu 1-2. Dynamical effects are certainly playing a crucial role in the evolution of the outflow, compressing the head of the flow (reducing the apparent ejection time-scale) or lagging material upstream (increasing the apparent ejection time-scale). Thus this ejection time-scale could be quite uncertain and so is the derived jets mechanical luminosity () of Hu 1-2.
It is interesting to note that the jets mechanical luminosity of NGC 6778 is extremely high (Table 7), if we adopt the parameters given in Tocknell, De Marco & Wardle toc14 (2014). This PN, which has a similar distance (2.6 kpc; Tocknell, De Marco & Wardle toc14 2014) as Hu 1-2, has a highly disrupted equatorial ring and a binary central star (Miszalski et al. 2011b ; Guerrero & Miranda gm12 2012). Both NGC 6778 and the Necklace Nebula in Table 7 have a post-common envelope (post-CE) close binary in the center (Miszalski et al. 2011b ; Corradi et al. corradi11 2011). Like NGC 6778, Hu 1-2 displays an overall bipolar structure and a likely disrupted equatorial ring. This resemblance suggests that Hu 1-2 might have similar jet-launching mechanisms as the other two PNe.
5 Conclusions
We have presented a thorough imaging and spectroscopic study of the main nebular regions and bipolar outflows of Hu 1-2. The physical structure of the main nebula can be described as bipolar, although its velocity field cannot be described by a simple hour-glass law. The inclination of the bipolar lobes is 10° and its polar expansion velocity 150 km s-1, resulting in a lower-limit expansion age 1100 yr. Neither the morphology nor the kinematics of the central, -shaped innermost region of Hu 1-2 can be simply described as a waist or torus located between the two bipolar lobes. The knotty morphology of this region and its relatively high expansion velocity, 40 km s-1, are suggestive of a “broken” equatorial ring. The distorted velocity field of the bipolar lobes and the complex morphology of the equatorial regions make us conclude that Hu 1-2 has experienced notable violent dynamical processes during its formation. Similar interpretation has been given to the disrupted equatorial regions of a few bipolar PNe known to harbor binary systems (e.g., NGC 6778, NGC 7354; Contreras et al. con10 2010; Miszalski et al. 2011b ; Guerrero & Miranda gm12 2012). It is tempting to conclude that the fast bipolar knots present in all these sources are dynamical agents which caused the disrupted equatorial features.
It is interesting to remark here the apparent discrepancies implied by the chemical abundances of Hu 1-2. The high He/H and N/O abundance ratios suggest a Type I nature for Hu 1-2, which indicates that it descended from a relatively massive intermediate-mass progenitor star (4 ; e.g., Karakas et al. kar09 2009). On the other hand, the low abundances of the heavy elements of Hu 1-2 suggest it formed long time ago, probably in an early-stage of the chemical evolution of the Galaxy, and thus it corresponds to a low-mass progenitor. Cases of Type I PNe with very low abundances of elements can be interpreted as a result of formation of a massive PN progenitor from unmixed (i.e., metal-poor) interstellar material (Milingo et al. mil10 2010). Therefore, the chemical composition of Hu 1-2 probably does not represent that of its current environment. This might indeed be the case. At a galactocentric distance 9 kpc, as estimated from the distance to Hu 1-2 (3.5 kpc; Miranda et al. 2012a ), its Galactic longitude (865) and the galactocentric distance of the Sun (8.3 kpc; Gillessen et al. gil09 2009), the oxygen abundance of the interstellar medium is 410-4 (Henry et al. hen10 2010, and Figure 1 therein), which is much higher than that of Hu 1-2 (see Table 5). Alternatively, Type I PNe have long been connected to bipolar morphology (e.g., Peimbert & Torres-Peimbert ptp83 1983) which is likely the result of binary interactions (e.g., Soker sok97 1997) or common envelope binary interaction (e.g., Zijlstra zijl07 2007; De Marco marco09 2009; Miszalski et al. mis09 2009). The abundance pattern of Hu 1-2 might be due to the effects of binary interactions on the evolution of the progenitor and the composition of the subsequent PN, although so far it is not clear whether there is a binary central star in Hu 1-2. Detailed discussion of this point is beyond the scope of this paper. We also discussed the possibility of Hu 1-2 being a halo PN, given that it is quite out of the Galactic plane ( = 88). Although the oxygen abundances of Hu 1-2 and its distance to the Galactic plane marginally support a halo nature, its low peculiar radial velocity obviously argues against a halo nature for Hu 1-2.
The collimated bipolar outflows of Hu 1-2 are particularly interesting. They show a notable bow-shock-like morphology. The emission within these structures is found to be highly stratified, with [N ii] peaking at the leading edge of the bow-shock and [O iii] mostly occupying the star-facing region. This profile is similar to that found in the bow-shock structures of PNe such as IC 4634 and NGC 7009. Previous spatio-kinematical studies have suggested an expansion velocity 340 km s-1 for the outer knots of Hu 1-2. This high expansion velocity of the bipolar knots, together with the bow-shock-like morphology associated with them, indicate that the high-velocity, collimated bipolar outflows are moving through the interstellar medium like “bullets”.
The line ratios of the NW knot of Hu 1-2 and those from the collimated outflows of other PNe are generally consistent with those of other low-ionization structures, but they exhibit higher [O iii]/H ratios. This line ratio is particularly high in Hu 1-2, indicating that both low- and high-excitation gas are present at the location of this feature with significant amounts. The observed line ratios of the NW knot of Hu 1-2 have been modeled using “ad hoc” simulations of a fast moving cloudlet in a medium with homogeneous density. The model predictions are generally consistent with the observed line ratios, thus confirming that the excitation of the bipolar knots of Hu 1-2 can be explained by a mix of the UV radiation and shocks. The models favor distance, nebular abundances, and stellar parameters consistent with those derived for Hu 1-2. As reported for the collimated outflows of other PNe and proto-PNe (e.g., Hen 3-1475; Riera et al. rie06 2006), the best knot velocity (100–250 km s-1) inferred from the models is below that derived by spatio-kinematical studies (340 km s-1).
Finally, we estimated the ionized mass of the NW knot of Hu 1-2, and calculated the jets mechanical luminosity using the knots’ mass and the ejection time-scale based on the dynamical age of the bipolar outflow. The jets mechanical luminosity and the mass-loss rate of Hu 1-2 generally agree, within the uncertainties, with those of the Necklace and NGC 6778, both of which have a post-common envelope close binary central star. The resemblance of Hu 1-2 with NGC 6778 in nebular structure and morphology hints at a possibility that the former might have similar jet-launching engine as the latter.
Acknowledgements
XF and MAG acknowledge support from grant AYA 2011-29754-C03-02. LFM is partially supported by grant AYA2011-30228-C3-01 (co-funded by FEDER funds) of the Spanish MICINN. AR is supported by grant MINECO AYA2011-30228-C03 (Spain). PFV and ACR are supported by CONACyT grant 167611 and DGAPA-PAPIIT (UNAM) grant IG100214. This paper is based on observations made with the 1.5m telescope operated by the Instituto de Astrofísica de Andalucía at the Observatorio de Sierra Nevada, Granada, Spain, and with the Nordic Optical Telescope (NOT) and the Italian Telescopio Nazionale Galileo (TNG) operated at the Observatorio del Roque de los Muchachos, La Palma, Spain, by the Nordic Optical Telescope Scientific Association and the Fundación Galileo Galilei of the INAF (Istituto Nazionale di Astrofisica), respectively. We thank Orsola De Marco, the referee of this article, for her insightful comments which have greatly improved the quality of this article.
References
- (1) Aller L. H., Czyzak S. J., 1979, Ap&SS, 62, 397
- (2) Asplund M., Grevesse N., Sauval A. J., Scott P., 2009, ARA&A, 47, 481
- (3) Balick B., Alexander J., Hajian A. R., Terzian Y., Perinotto M., Patriarchi P., 1998, AJ, 116, 360
- (4) Balick B., Frank A., 2002, ARA&A, 40, 439
- (5) Balick B., Perinotto M., Maccioni A., Terzian Y., Hajian A., 1994, ApJ, 424, 800
- (6) Benjamin R. A., Skillman E. D., Smits D. P., 1999, ApJ, 514, 307
- (7) Blackman E. G., Lucchini S., 2014, MNRAS, 440, L16
- (8) Bujarrabal V., Castro-Carrizo A., Alcolea J., Sánchez Contreras C., 2001, A&A, 377, 868
- (9) Cardelli J. A., Clayton G. C., Mathis J. S., 1989, ApJ, 345, 245
- (10) Contreras M. E., Vázquez R., Miranda L. F., et al., 2010, AJ, 139, 1426
- (11) Corradi R. L. M., Sabin L., Miszalski B., et al., 2011, MNRAS, 410, 1349
- (12) Dennis T. J., Cunningham A. J., Frank A., Balick B., Blackman E. G., Mitran S., 2008, ApJ, 679, 1327
- (13) Durand S., Acker A., Zijlstra A., 1998, A&AS, 132, 13
- (14) Exter K. M., Pollacco D. L., Bell S. A., 2003, MNRAS, 341, 1349
- (15) De Marco O., 2009, PASP, 121, 316
- (16) Gillessen S., Eisenhauer F., Trippe S., Alexander T., Genzel R., Martins F., Ott T., 2009, ApJ, 692, 1075
- (17) Gonçalves D. R., Corradi R. L. M., Mampaso A., Perinotto M., 2003, ApJ, 597, 975
- (18) Gonçalves D. R., Mampaso A., Corradi R. L. M., Quireza C., 2009, MNRAS, 398, 2166
- (19) Guerrero M. A., Miranda L. F., 2012, A&A, 539, A47
- (20) Guerrero M. A., Miranda L. F., Chu Y.-H., Rev. Mex. Astron. Astrofís., 12, 156
- (21) Guerrero M. A., Miranda L. F., Ramos-Larios G., Vázquez R., 2013, A&A, 551, A53
- (22) Guerrero M. A., Miranda L. F., Riera A., Velázquez P. F., Olguín L., Vázquez R., Chu Y.-H., Raga A., Benítez G., 2008, ApJ, 683, 272
- (23) Hartigan P., Raymond J., Hartmann L., 1987, ApJ, 316, 323
- (24) Henry R. B. C., Kwitter K. B., Jaskot A. E., Balick B., Morrison M. A., Milingo J. B., 2010, ApJ, 724, 748
- (25) Howard J. W., Henry R. B. C., McCartney S., 1997, MNRAS, 284, 465
- (26) Huarte-Espinosa M., Frank A., Balick B., Blackman E. G., De Marco O., Kastner J. H., Sahai R., 2012, MNRAS, 424, 2055
- (27) Humason M. L., 1921, PASP, 33, 175
- (28) Hyung S., Pottasch S. R., Feibelman W. A., 2004, A&A, 425, 143
- (29) Karakas A. I., Lattanzio J. C., 2003, PASA, 20, 393
- (30) Karakas A. I., van Raai M. A., van Lugaro M., Sterling N. C., Dinerstein H. L., 2009, ApJ, 690, 1130
- (31) Kingsburg R. L., Barlow M. J., 1994, MNRAS, 271, 257
- (32) Kwitter K. B., Henry R. B. C., Jaskot A. E., Balick B., 2010, AAS, 42, 472
- (33) Liu X.-W., Luo S.-G., Barlow M. J., Danziger I. J., Storey P. J., 2001, MNRAS, 327, 141
- (34) López-Martín L., López J. A., Esteban C., Vázquez R., Raga A., Torrelles J. M., Miranda L. F., Meaburn J., Olguín L., 2002, A&A, 388, 652
- (35) Manchado A., Guerrero M. A., Stanghellini L., Serra-Ricart M., 1996, IAC Morphological Catalog of Northern Planetary Nebulae. IAC, La Laguna
- (36) Milingo J. B., Kwitter K. B., Henry R. B. C., Souza S. P., 2010, ApJ, 711, 619
- (37) Miranda L. F., Blanco M., Guerrero M. A., Riera A., 2012a, MNRAS, 421, 1661
- (38) Miranda L. F., Blanco M., Guerrero M. A., Riera A., 2012b, IAUS, 283, 440
- (39) Miranda L. F., Torrelles J. M., Guerrero M. A., Vázquez R., Gómez Y., 2001, MNRAS, 321, 487
- (40) Miszalski B., Acker A., Parker Q. A., Moffat A. F. J., 2009, A&A, 505, 249
- (41) Miszalski B., Corradi R. L. M., Boffin H. M. J., et al., 2011a, MNRAS, 413, 1264
- (42) Miszalski B., Jones D., Rodríguez-Gil P., et al., 2011b, A&A, 531, A158
- (43) Nordhaus J., Blackman E. G., 2006, MNRAS, 370, 2004
- (44) Olofsson H., Maercker M., Eriksson K., Gustafsson B., Schöier F., 2010, A&A, 151, A27
- (45) Peimbert M., 1990, MNRAS, Rep. Prog. Phys., 53, 1559
- (46) Peimbert M., Luridiana V., Torres-Peimbert S., 1995, Rev. Mex. Astron. Astrofís., 31, 147
- (47) Peimbert M., Torres-Peimbert S., 1983, IAUS, 103, 233
- (48) Peimbert M., Torres-Peimbert S., 1987, Rev. Mex. Astron. Astrofís., 14, 540
- (49) Peña M., Rechy-García J. S., García-Rojas J., 2013, Rev. Mex. Astron. Astrofís., 49, 87
- (50) Pottasch S. R., Hyung S., Aller L. H., Beintema D. A., Bernard-Salas J., Feibelman W. A., Klöckner H. R., 2003, A&A, 401, 205
- (51) Raga A. C., Riera A., Mellema G., Esquivel A., Velázquez P. F., 2008, A&A, 489, 1141
- (52) Reay N. K., Atherton P. D., 1985, MNRAS, 215, 233
- (53) Reyes-Ruiz M., López J. A. 1999, ApJ, 524, 952
- (54) Riera A., Binette L., Raga A. C., 2006, MNRAS, 203, 213
- (55) Riera A., Raga A. C., Asymmetrical Planetary Nebulae IV, 14
- (56) Sabbadin F., Bianchini A., Hamzaoglu E., 1983, A&AS, 51, 119
- (57) Sabbadin F., Cappellaro E., Turatto M., 1987, A&A, 182, 305
- (58) Sahai R., Trauger J. T., 1998, AJ, 116, 1357
- (59) Savage B. D., Mathis J. S., 1979, ARA&A, 17, 73
- (60) Schneider S. E., Terzian Y., Purgathofer A., Perinotto M., 1983, ApJS, 52, 399
- (61) Soker N., 1997, ApJS, 112, 487
- (62) Soker N., 1998, ApJ, 496, 833
- (63) Soker N., 2006, ApJL, 645, L57
- (64) Soker N., Livio M., 1994, ApJ, 421, 219
- (65) Solf J., Ulrich H., 1985, A&A, 148, 274
- (66) Storey P. J., Hummer D. G., 1995, MNRAS, 272, 41
- (67) Tocknell J., De Marco O., Wardle M., 2014, MNRAS, 439, 2014
- (68) Wang W., Liu X.-W., 2007, MNRAS, 381, 669
- (69) Wang W., Liu X.-W., 2008, MNRAS, 389, L33
- (70) Whitford A. E., 1958, AJ, 63, 201
- (71) Zijlstra A. A., 2007, Balt. Astron., 16, 79