Constraints on the Ultra-High-Energy Neutrino Flux from Gamma-Ray Bursts from a Prototype Station of the Askaryan Radio Array
Abstract
We report on a search for ultra-high-energy (UHE) neutrinos from gamma-ray bursts (GRBs) in the data set collected by the Testbed station of the Askaryan Radio Array (ARA) in 2011 and 2012. From 57 selected GRBs, we observed no events that survive our cuts, which is consistent with 0.12 expected background events. Using NeuCosmA as a numerical GRB reference emission model, we estimate upper limits on the prompt UHE GRB neutrino fluence and quasi-diffuse flux from to GeV. This is the first limit on the prompt UHE GRB neutrino quasi-diffuse flux above GeV.
keywords:
Gamma-Ray Bursts , UHE neutrinos , radio Cherenkov1 Introduction
Gamma-ray bursts (GRBs) are the most powerful explosions in the Universe. They emit high-energy gamma rays that are observable on Earth up to energies of 100 GeV, and are candidate sources of ultra-high-energy cosmic rays (UHECRs, above GeV), whose origin remains a mystery, and of neutrinos. The detection of neutrinos from GRBs would shine light on the ability of GRBs to accelerate hadrons to the highest energies, and therefore on the possibility that they are the sources of the observed UHECRs.
The widely accepted phenomenological interpretation of particle acceleration in GRBs is the fireball model [1, 2, 3, 4, 5]. In this model, the energy carried by the electrons and hadrons in a jet of relativistic, expanding plasma wind — the fireball — may be dissipated through internal shocks between regions of plasma overdensity [6, 7]. These shocks convert a substantial part of the kinetic energy to internal energy by accelerating the particles in the plasma. Accelerated electrons dissipate the internal energy as prompt gamma rays from synchrotron and inverse-Compton emission. Accelerated protons may dissipate the internal energy by interacting with the prompt gamma rays and producing neutrinos in the – GeV range via a number of intermediate resonances [8, 9]. Later — typically, a few minutes after the prompt phase — the fireball collides with its surrounding medium, giving rise to reverse and forward shocks. The latter are believed to be responsible for the GRB afterglow emission [10, 11], which may include neutrinos of energies comparable to the prompt ones [12].
Thus, GRBs might conceivably produce high-energy neutrinos copiously. However, due to the immense distances separating us from the bursts — tens of Mpc to a few Gpc — the flux of neutrinos that arrives at Earth is expected to be low. Moreover, the flux is expected to decrease with rising neutrino energy, due to the rising scarcity of protons of progressively higher energies at the sources. Over the last half-century, neutrino astronomy has steadily progressed in its ability to detect low fluxes, culminating in the recent detection of a diffuse astrophysical neutrino flux, up to a few PeV, by the km-scale IceCube neutrino telescope [13, 14, 15, 16, 17, 18]. IceCube detects the optical Cherenkov light induced by neutrino interactions using 5000 photomultipliers buried 1.5 km deep in the Antarctic ice.
Significant sensitivity to higher neutrino energies requires larger detectors. While it can be cost-prohibitive to scale detectors that use techniques established for smaller scales up to volumes of order 100 km3, an alternative is to utilize techniques that target a larger volume with less instrumentation.
One of the most promising methods to detect neutrinos in the UHE range of – GeV in a large volume is the radio-Cherenkov technique [19]. The interaction of a UHE neutrino in dense media induces an electromagnetic shower which develops a charge asymmetry. Because of this charge asymmetry, when the wavelength of the Cherenkov radiation is larger than the transverse size of the shower, the emission is coherent. This is known as the Askaryan effect [20, 21, 22, 23, 24, 25, 26]. For showers in ice, this process produces a radio frequency (RF) impulse at 1 GHz which can be observed by antenna arrays read out with GHz sampling rates. In this frequency range, the attenuation length in Antarctic ice is 1 km [27, 28], allowing a sparsely distributed array of detector units to observe volumes of 100 km3. This is the strategy adopted by the Askaryan Radio Array (ARA) [27, 29, 30]. In contrast, detectors that use optical Cherenkov signals are restricted by the 100 m lengths over which attenuation, absorption, and scattering diminish the signal, and thus require many more detector units to instrument the same volume [31].
In this paper, we report on a search for UHE neutrinos from GRBs using the 2011–2012 data set collected by the ARA Testbed station. Previous experiments have searched for neutrinos from GRBs using different techniques. However, they have either been sensitive to lower energies [32, 33] or only reported limits on the individual fluences of a handful of bursts [34]. Instead, we present an upper limit on the stacked fluence of UHE prompt neutrinos from 57 selected GRBs and the first limit on the prompt UHE GRB quasi-diffuse neutrino flux in the range – GeV.
This paper is organized as follows. In Section 2, we summarize previous GRB neutrino searches. In Section 3, we describe ARA and the Testbed station. In Section 4, we introduce our reference GRB emission model, NeuCosmA, and the AraSim detector simulation. In Section 5, we detail our data analysis pipeline. In Section 6, we present our results. In Section 7, we postulate future detection and analysis improvements. We conclude in Section 8.
2 Previous GRB Neutrino Analyses
There have been many complementary GRB neutrino searches reported by IceCube [32, 35, 36, 37, 38], ANTARES [33, 39], RICE [40], and ANITA [34].
IceCube [41] is an in-ice, km3 optical-Cherenkov detector located at the South Pole. It has reported the most stringent limit on the GRB quasi-diffuse neutrino flux from to GeV [36]. IceCube initially used an analytical GRB neutrino model by Guetta et al. [9], based on the Waxman-Bahcall (WB) model [42], but now uses a numerical flux calculation [37, 38] that is compatible with the one used in the present analysis, NeuCosmA [43].
ANTARES [44] is an optical-Cherenkov detector, similar to IceCube, but located in the Mediterranean Sea, and instrumenting a volume of only km3. It is sensitive to a similar range of neutrino energies as IceCube. The latest GRB neutrino analysis by ANTARES was based on NeuCosmA; its GRB neutrino flux limit is approximately an order of magnitude weaker than the limit from IceCube [39].
RICE [45] was an in-ice radio-Cherenkov detector located in the South Pole, operational until 2011, that instrumented a volume of km3. The GRB neutrino analysis by RICE was based on an analytical neutrino flux model and set individual fluence limits on five GRBs, from to GeV [40].
ANITA [46] is a balloon-borne Antarctic experiment that has flown three times under the NASA long-duration balloon program, searching for neutrinos using the radio-Cherenkov technique. From an altitude of km, ANITA can monitor an extremely large volume of Antarctic ice, [47]. The ANITA GRB neutrino analysis [34] was based on the analytic WB GRB neutrino flux model [42] and set fluence limits for 12 individual GRBs that occurred in low-background analyzable time periods during its 31-day flight. ANITA provided the most recent GRB neutrino fluence limit from to GeV. The limited livetime of a balloon experiment constrains the maximum number of analyzable GRBs for ANITA and thus they could not set a quasi-diffuse flux limit, but instead set fluence limits for each individual GRB.
3 The ARA Instrument
The full proposed ARA detector, ARA37, would consist of 37 stations spaced 2 km apart at a depth of 200 m. The first three design ARA stations (A1, A2, A3) were deployed in the 2011-2012 and 2012-2013 seasons, while a prototype Testbed station, which we used for this GRB neutrino search, was deployed in the 2010-2011 season.
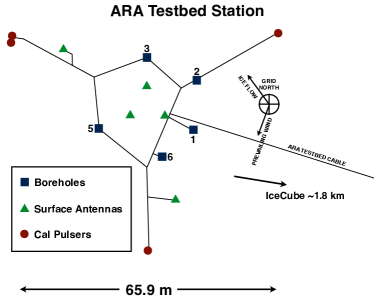
Figure 1 shows the layout of the Testbed with the positions of the five boreholes. Boreholes 1 through 3 and Borehole 5 each contain a pair of antennas consisting of one vertically polarized (Vpol) bicone antenna and one horizontally polarized (Hpol) bowtie-slotted cylinder antenna. Borehole 6, instead, has two Hpol quad-slotted cylinder (QSC) antennas which were deployed in the Testbed to test the antenna design before deploying them in the deep stations. All borehole antennas have bandwidths from 150 MHz to 850 GHz. For the trigger and data analysis, we utilized only antennas in Boreholes 1–3 and 5. The maximum depth of the borehole antennas in the Testbed is approximately 30 m. There are also three calibration pulser VPol and HPol antenna pairs that were installed at a distance of 30 m from the center of the Testbed array to provide in situ timing calibration and other valuable cross checks related to simulations and analysis. A more detailed description of the Testbed station is in Refs. [27, 29].
4 Analysis Tools
In order to estimate the expected GRB neutrino spectra, we use the NeuCosmA GRB neutrino model. In order to estimate the efficiency of the ARA Testbed, we use AraSim, the ARA detector simulation software. Highlights of NeuCosmA and AraSim are described in the following sections.
4.1 GRB Neutrino Model: NeuCosmA
NeuCosmA [48, 43] is a state-of-the art computer code to calculate the neutrino fluence from cosmic accelerators such as GRBs. It performs detailed and fast computation of neutrino production in photohadronic interactions, via -resonance, higher resonances, decay channels, multi-pion processes, and direct production modes, and includes energy-loss processes of the secondaries and neutrino flavor oscillations during propagation to Earth. NeuCosmA provides fast calculation of neutrino yields beyond simple analytical estimates, which are typically limited in the number of production modes. For each GRB, it provides the energy-dependent flavor composition of the neutrino fluence at Earth, i.e., the ratio of each flavor to the total fluence, .
We use NeuCosmA with model parameter values inferred from the observed gamma-ray signal of a GRB to calculate its neutrino spectrum. These parameters are (the time in which of the gamma-ray fluence is collected), and (spectral indices of the Band function [49] at low and high energies), (the peak energy of the gamma-ray spectrum), (the integrated gamma-ray fluence), and (the minimum and maximum energy of the fluence), and (redshift). We extract parameter values from the Gamma-ray Coordinates Network (GCN) catalog [50, 51]. For unmeasured parameters, we use their default values from the GRB-web database [52, 32]. For all GRBs, we assume that the bulk Lorentz factor of the fireball , the energy in electrons and photons is equal to the energy in magnetic fields, and the ratio of energy in protons to energy in electrons — the baryonic loading — [32, 43]. These are the same choices as in previous analyses [32, 35, 36, 37, 39, 38].
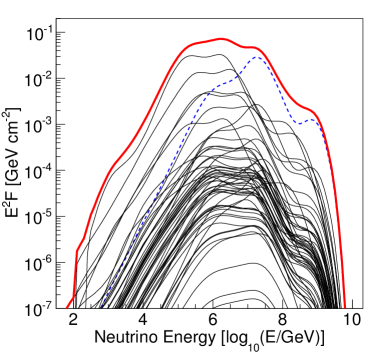
Synchrotron energy losses of secondary , , , and in the magnetic field of the source [53, 54] affect the shape and flavor composition of the neutrino fluence [55]. The onset of synchrotron losses for muons, pions, and kaons, at progressively higher energies, leads to GRB neutrino spectra that, in general, exhibit three distinctive kinks; see curves for individual bursts in Fig. 5. These effects, together with the energy dependence of the proton mean free path and the interaction of protons with the full photon spectrum, result in a quasi-diffuse neutrino flux — the “numerical fireball calculation” in Ref. [43] — that is up to one order of magnitude smaller than the analytical estimates [9] used in the first IceCube GRB neutrino search [32].
Contributions from different modes are performed via “response functions,” which contain the relevant kinematics, multiplicities, and cross sections, encoded in fast-access look-up tables. This method is fast and accurate up to PeV energies. At higher energies, relevant for the present analysis, this approach has problems treating the rising complexity in interaction final states, and QCD-based Monte Carlo methods like those implemented in SOPHIA [56] would give more accurate results. However, we expect that the impact of the particle-physics uncertainties is smaller than that coming from ambiguities in the astrophysical modeling of GRBs, even after reduction of errors due to averaging over the distribution of astrophysical parameter values. We discuss these effects more below. We use NeuCosmA in the entire energy range of our analysis to obtain limits that are methodologically comparable to those found by other experiments.
Our neutrino production model assumes that protons are perfectly confined by the magnetic field at the source, and that only the neutrons produced in interactions contribute to the flux of UHECRs. This “neutron model” results in a strong correspondence between the UHECR flux and the neutrino flux, which is in tension with the non-observation of neutrinos from GRBs by IceCube [32, 35, 36, 37]. All previous GRB neutrino searches have assumed the neutron model, so we adopt it to allow direct comparison of our results to theirs. We have not considered neutrino production models where protons can leak out of the source without interacting. They can yield neutrino fluxes lower by as much as an order of magnitude [57, 58]. So can models where multiple shell collisions occur in the jet, each one with different emission parameters [59, 60, 61].
4.2 Detector simulation: AraSim
AraSim [29] is a Monte-Carlo simulation software package used within the ARA Collaboration to simulate neutrino signals as they would be observed by the detector. It simulates the full chain of neutrino events, such as the passage of the neutrino through the Earth, radio-Cherenkov emission, the path and response of the emitted signal in the ice, and the trigger and data acquisition mechanisms of the detector, as described below.
AraSim was used in this search to model the neutrino interactions and detector response in the same manner that it was used in the ARA Testbed diffuse search, but we provide relevant details here for completeness. AraSim generates neutrino events with uniformly distributed neutrino directions and interaction point locations chosen with a uniform density in the ice. At each energy, we take the average flavor ratio of all GRBs given by NeuCosmA, weighted by their relative fluence. To properly account for the directional dependence of the sensitivity, the event is weighted by the probability that the neutrino survived its passage through the Earth and reached the interaction point. Once a neutrino interaction location is chosen in the ice, an in-ice ray tracing algorithm (RaySolver) derives multiple source-to-target ray-trace solutions giving signal arrival times. From each ray-trace solution, the radio-Cherenkov signal, including a phase response, is then calculated with a custom parameterized radio-Cherenkov emission model inspired by Ref. [62]. The modeled signal is generated for both the hadronic and electromagnetic portions of the shower separately, as they have different characteristic shower profiles. We do not currently model the Landau-Pomeranchuk-Migdal (LPM) [63, 64, 65] effect in our RF emission model. Instead, we apply a correction factor to the effective volume for each energy bin based on the impact of the LPM effect on the sensitivity, using the simpler RF emission model from Ref. [66].
We then apply detector properties to the signal, such as antenna responses, amplifier and filter responses, noise figure, and trigger mechanism. The antenna, amplifier, and filter responses are modeled based on simulation and measurements, while the noise figure and the trigger mechanism are calibrated to the Testbed data. When a simulated event passes the trigger, the waveforms are written into the same format as the data so that the simulated events can be analyzed with identical software.
5 Data Analysis
For this GRB neutrino search, we selected for analysis only those GRBs that occurred during clean data-taking periods and in a region of the sky that is observable by our detector. After the GRBs are selected, we use the same selection criteria for the RF neutrino candidate events as in the ARA diffuse neutrino search [29], but we search in a narrow time window around each GRB event, and thus we can loosen some cuts. We use a blinding technique that draws on both the ones used for the ARA diffuse neutrino search and the ANITA GRB neutrino analysis [34].
Our analysis consists of three stages. First, we use a 10% subset from the full ARA Testbed data set for the preliminary background analysis. To estimate the background, we use two 55-minute time windows on either side of each GRB event that excludes a 10-minute signal window centered on that event. We optimize the cuts in the background analysis windows for the best expected limit in the signal windows. Second, we look at the number of events in the background analysis windows in the remaining 90% of the data set to check the consistency with the estimate based on the 10% subset. Third, we search for neutrino events in the signal windows in the entire (10%+90%) data set (note that the signal windows in the 10% set were not used for background studies).
5.1 GRB Selection
We started with the 589 GRBs that occurred from January 2011 to December 2012 over the entire sky. For this analysis, we selected those that occurred during periods of clean data-taking and that fell within the field of view of our detector. We used the IceCube GRB catalog [52], which is based on the GCN [50, 51], to find GRBs during the time period of interest.
From the 589 GRBs, we first rejected GRBs that failed the Effective Livetime Cuts. The Effective Livetime Cuts consist of three cuts which require a low background level and stable data-taking. The first cut is a simple time window cut which rejected GRBs that occurred during periods of high levels of activity at the South Pole station in the 2011 to 2013 seasons, in order to avoid strong anthropogenic backgrounds: for each year, we rejected GRBs that occurred from October to February . The second cut requires that the data is not contaminated by any strong continuous waveform (CW) source by rejecting any GRBs that occurred within an hour of any run where or more events are highly correlated with each other. The third and final timing cut is a livetime cut which requires the detector to be running and stably storing data within an hour of each GRB. The livetime represents the fraction of a second that the trigger was available. If there was any second when the livetime of the detector was lower than during the hour before or after a GRB, we reject that GRB from our analysis. After applying the Effective Livetime Cuts, 257 GRBs survived from 224 days of analyzable period of data taking.
To these surviving GRBs, we applied an additional cut which requires that the GRB should be included in the field of view of the Testbed. In order to define a field of view for the Testbed, we first found the energy bin which is the most sensitive to neutrinos from GRBs.
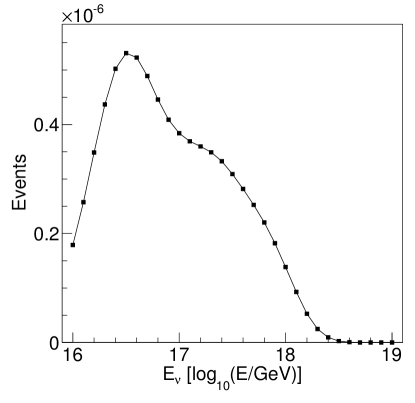
Figure 2 is the expected event spectrum from the 257 GRBs after applying analysis cuts that are used for the diffuse neutrino search [29]. It shows that the Testbed is most sensitive to NeuCosmA-generated neutrino fluences from these GRBs at GeV. We used a simulation set with the full range of incident angles of neutrinos at GeV, and obtained the effective volume as a function of neutrino direction.
The effective volume is obtained for each energy bin and each neutrino direction bin by
| (1) |
where is a volume of ice where ice-neutrino interactions are generated uniformly, is the total number of events thrown ( for each simulation set), and is the weighted sum of the number of events that triggered. The weight is the probability that the neutrino was not absorbed in the Earth, given its direction and the position of the interaction
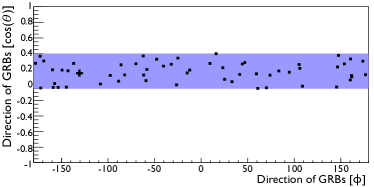
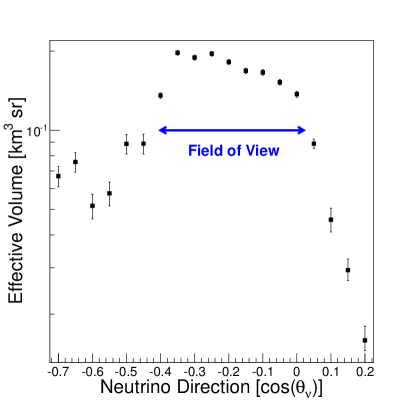
Figure 3 shows the effective volume versus zenith angle of the neutrino travel direction. The field of view of the Testbed is defined as the Full Width Half Maximum (FWHM) of the effective volume (arrow shown in Fig. 3), which is . Earth absorption reduces the effective volume at high (right-hand side of the plot), while the shadowing effect from the ray-tracing in ice causes the cut-off at low (left-hand side of the plot) [29].
Figure 4 shows the distribution of the 57 GRBs that remain after applying a cut requiring that each GRB is within the field of view. They are shown in Testbed local coordinates, where points along the direction of ice flow and points along the tangent to the surface of the geoid shape of the Earth.
Figure 5 shows the fluences of all 57 selected GRBs generated with the NeuCosmA software. Among them, one was brighter than the others: GRB110426A. Its fluence was higher than the others by an order of magnitude for energies above GeV. Its location on the sky is marked as a cross in Fig. 4 and its parameters values are shown in Table 1. The long duration and high spectral indices of GRB110426A made its expected neutrino fluence significantly higher than for other GRBs at energies above GeV.
| GRB | [sec] | [keV] | [erg cm-2] | [MeV] | [MeV] | |||
|---|---|---|---|---|---|---|---|---|
| GRB110426A | 376.05 | 2.28 | 3.28 | 200 | 0.01 | 1 | 2.15 |
5.2 Neutrino search optimization
This analysis uses the same set of cuts as in the Interferometric Map Analysis in the ARA diffuse neutrino search [29]. The analysis uses relative timing information to reconstruct the location of the source of the RF emission. The interferometric map is constructed from the sum of cross-correlations between the different pairs of antennas — a strong peak on the map indicates a high correlation among waveforms after correcting for the arrival times of the signals. We perform an optimization of the cuts for this analysis, which differs from the diffuse search by using the summed GRB fluence over the 57 GRBs for the expected signal, and only searching in the 10 minute window surrounding each GRB.
When optimizing our cuts, we use average, energy-dependent flavor ratios at Earth, which are calculated using the individual flavor ratios of each GRB in our sample, as output by NeuCosmA — the contribution of each GRB is weighted by its relative neutrino fluence. This is important, since electron neutrinos are more likely than other flavors to pass our trigger and analysis cuts due to charged-current events depositing the full neutrino energy in the particle shower. See Section 6.2.
Among the set of analysis cuts described in the diffuse neutrino search, the Delay Difference Cut, the Reconstruction Quality Cuts, and the Peak/Correlation Cut were re-optimized for this search. The three cuts that were re-optimized are all based on the quality of the directional reconstruction while the rest of the cuts are designed to reject specific types of backgrounds such as CW and calibration pulser events. The Delay Difference Cut ensures that the reconstruction direction derived from all the borehole antennas of the same polarization is consistent with the delay observed between the signals in the two antennas with the strongest signals. The Reconstruction Quality Cuts ensure that the event can be characterized by a single well-defined pointing direction on the interferometric reconstruction map. The Peak/Correlation Cut requires that events have strong correlation between the signal strength and the cross-correlation value from the interferometric map, which is expected from impulsive events.
A total of four cut parameters or options from these three cuts are allowed to vary to give the best expected limit on the dominant GRB event from the NeuCosmA model. For the Delay Difference Cut, we only consider whether to remove the cut, since it is largely redundant with other cuts. The Reconstruction Quality Cuts have two cut parameter values, and , which ensure that the reconstruction direction is well-defined and unique, respectively. Parameter is the maximum allowed area in square degrees on the interferometric map surrounding the best reconstruction direction where the correlation remains high. Parameter is the maximum allowed ratio between the high-correlation area around the best reconstruction direction and the high-correlation area from the entire map. The last parameter that was included in the optimization was the Peak/Correlation Cut Value, which is a unitless parameter that defines the minimum required value of a linear combination of the signal strength and the peak correlation value on the interferometric map.
| Cut | Delay Difference Cut | Reconstruction Quality Cut | Peak/Correlation Cut | |
|---|---|---|---|---|
| Parameter | On/Off | Peak/Corr. Cut Value | ||
| Diffuse Neutrino Search | On | deg2 | ||
| GRB Neutrino Search | Off | deg2 | ||
The expected number of neutrinos from each GRB and the background expectation based on the time of each GRB are obtained using the re-optimized cuts. For each GRB, we use its direction and predicted energy-dependent flavor ratio to obtain the analysis-level effective area of the Testbed as a function of energy. The effective area of the GRB is obtained from the effective volume using the assumption that the dimensions of the detector are significantly smaller than the interaction lengths [67]:
| (2) |
where is the effective volume, calculated using Eq. (1), and is the neutrino interaction length. The latter is given by
| (3) |
where is the density of ice, is the cross-section of neutrino-nucleon interactions derived in Ref. [68], and is the nucleon mass.
The total expected number of neutrino events is
| (4) |
where is the index of the GRB (total 57 GRBs) and is the neutrino fluence of the GRB . The factor in Eq. (4) is obtained by substituting linear energy integration for logarithmic integration, .
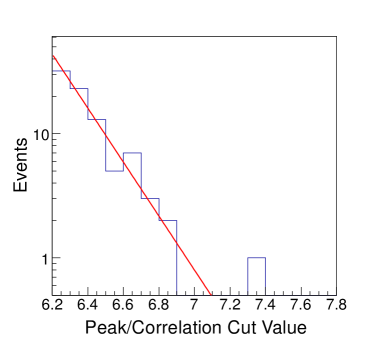
Figure 6 shows the differential distribution of background events as a function of the final Peak/Correlation cut. We estimate the expected number of background events by fitting an exponential function to this distribution.
As described at the beginning of the section, we derive the background estimate from the background analysis window for each GRB, which is distinct from the signal window. We consider the background analysis window to be the hour on either side of each GRB time, minus the 10 minutes surrounding each GRB. The 55 minutes on either side of a GRB (total 110 minutes) is a background analysis window and 5 minutes before and after the GRB is a neutrino signal window. A 10-minute period centered around the middle of the window should be sufficient to encompass the expected emission period for all the GRBs examined in this study if we assume that gamma rays and neutrinos are produced simultaneously. The 110-minute background period provides sufficient statistics for a study of the background around the times of each GRB. This is the same method used in the ANITA GRB analysis [34].
Using the data in the background analysis windows, we optimize our analysis cuts to give us the best expected limit, and, using these optimized cuts, we obtain the expected number of events from the background and signal windows. We compute the best expected 90% confidence level (C.L.) upper limit on the neutrino fluence by minimizing
| (5) |
where is the sum of the neutrino fluences from the 57 GRBs, is the expected number of neutrinos that pass the cuts, and is the 90% C.L. upper limit on the number of signal events given the number of expected background events.
Table 2 summarizes the final set of cut parameters after the optimization. After the optimization, we expect 0.072 events in the signal windows in the entire data set. This background expectation in the signal windows is at approximately the same level as the expected background events in the diffuse neutrino search, but now we achieve a factor of 2.4 improvement in the overall analysis cut efficiency for the summed fluence from the 57 GRBs due to changing the analyzable time by a factor of 566. To obtain the background expectations for the background windows in the 10% and 90% sets, we simply scale the 0.072 events by the livetime in each sample. In the background analysis windows in the 10% subset, we expect 0.079 background events and no events survived.
In the second stage of analysis, we look at the number of events in the background analysis windows in the remaining 90% of the data set. This is to make sure that the background estimation derived from the 10% subset is consistent with what we see in the remaining 90% of the data. In the 57 GRB background analysis windows in the 90% data set we expected 0.72 events and two events survive.
In the final stage of the analysis, we search in the entire data set for neutrino events in the signal windows surrounding the 57 GRBs over a total of 570 minutes. We used the same optimized analysis cuts defined in the first analysis stage.
6 Results
6.1 Upper limits on GRB neutrinos
We expected 0.072 background events in the signal region in the entire data set and found no events. From NeuCosmA, the expected number of neutrino events from the 57 GRBs is . From simulation, the analysis efficiency for triggered events from the fluence calculated for GRB110426A is 6%. We placed a 90% C.L. limit on the combined fluence from the 57 GRBs.
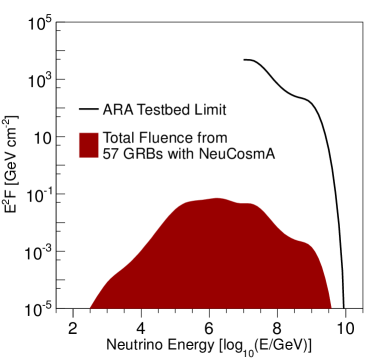
Figure 7 shows the total, or stacked, fluence from the 57 GRBs calculated with NeuCosmA, and the GRB neutrino fluence limit that we set from to GeV. At lower energies, the ARA Testbed sensitivity drops, and GeV is the maximum energy with which NeuCosmA emits neutrinos.
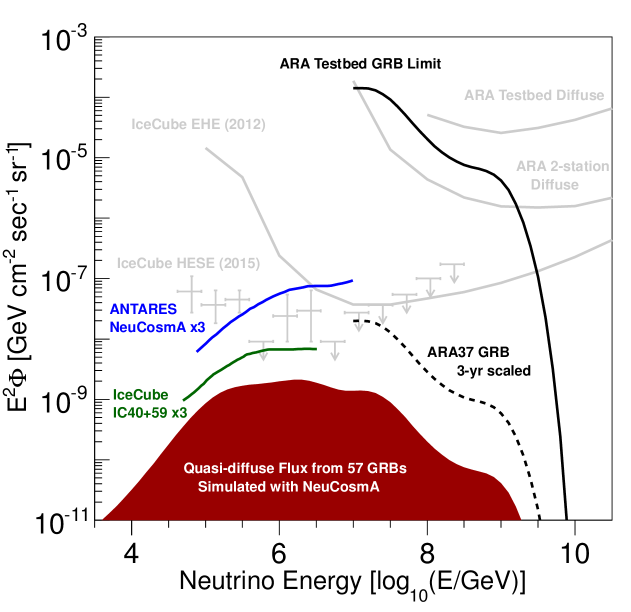
In order to compare our limit with those from other experiments that used a different set of GRBs for their analyses, we also provide the inferred quasi-diffuse all-flavor neutrino flux limit. This assumes that the average fluence of the 57 analyzed GRBs is representative of the average fluence from GRBs for any other extended period. With this assumption, the quasi-diffuse neutrino flux limit is
| (6) |
where is the fluence limit, is the number of analyzed GRBs, and is the average number of GRBs that are potentially observable by satellites per unit time [35], and is chosen as 667/year to be consistent with the IceCube and ANTARES GRB neutrino searches [33, 36].
Figure 8 shows the quasi-diffuse neutrino flux limit from ARA and other experiments. Our limit is the first UHE GRB neutrino quasi-diffuse flux limit at energies above GeV. The sensitivity of IceCube extends to this energy region, but their quasi-diffuse limit is published only below GeV, where their sensitivity is greatest.
6.2 Effects of uncertainties and model parameters
Our calculations are unavoidably affected by uncertainties in the values of astrophysical parameters — on which we expand below — and of particle-physics parameters, including cross sections, multiplicities, and lepton mixing parameters. Astrophysical uncertainties affect each source in a different way, and, in a source sample, partially average out. Particle-physics uncertainties systematically affect the fluxes from all sources in the same way, but are considerably smaller than astrophysical uncertainties; see, e.g., Fig. 19 in Ref. [72] for the effect of the uncertainty on the mixing parameters. We have therefore assumed in our calculations the central values of the particle-physics parameters.
In the calculation of our limits, we assumed nominal values of the astrophysical model parameters. We now comment on the effect of varying these values. Ref. [72] showed the effect on the shape and flavor composition of the diffuse GRB neutrino flux of assuming distributions of values for the magnetic field intensity, bulk Lorentz factor, and shape of the source photon spectrum. In stacking analyses, the combined uncertainties on astrophysical model parameters can lower or raise the quasi-diffuse flux by one order of magnitude [43]. The baryonic loading is particularly poorly known; in our analysis, we adopted the commonly used value of 10 for all bursts [32, 43]. In reality, it could be lower or higher by a factor of 10. Since the baryonic loading linearly scales the neutrino flux, this would shift the flux down or up by one order of magnitude [43].
Another source of uncertainty is the finite size of the GRB sample used to derive the quasi-diffuse flux. For instance, the uncertainty associated to the discrete sampling of the underlying redshift distribution of GRBs ranges from 56%–72%, for a sample of 50 bursts (the present analysis uses 57 bursts), to 25%–28%, for a sample of 1000 bursts (90% C.L.) [72].
While we have considered GRB jets whose baryonic content is dominated by protons, GRBs might be able to synthesize [73, 74, 75] and accelerate [76, 77, 78, 79, 59, 60] nuclei. If nuclei can reach energies as high as protons, neutrino fluxes are comparable [59]; otherwise, neutrino yields from nuclei could be up to two orders of magnitude lower [77]. An exploration of GRB neutrino limits assuming different jet mass compositions is beyond the scope of this paper.
Alternative fireball emission models, such as sub-photospheric [80, 81, 82, 83, 84, 85] and magnetic reconnection [86, 87, 88, 89] models, may result in quasi-diffuse neutrino fluxes up to one order of magnitude lower than the flux from the internal-collision model we adopted [37, 38].
While our results in Figs. 7 and 8 use average, energy-dependent flavor ratios at Earth (see Section 5.2), we considered the impact of variations in flavor ratios. In Ref. [90], it is argued that for flavor ratios at the source, high-energy neutrinos from astrophysical sources can reach Earth with ratios where , and Ref. [91] finds an electron fraction between 20% and 59%, corresponding to the range . For ratios in the incident flux, at the trigger level the ratios of detected neutrinos become , and, at the analysis level, they become . Due to this effect, neutrino fluxes with flavor ratios of and , with the same all-flavor normalization, would result in a 25% lower and 50% higher number of neutrinos passing the trigger and analysis cuts, respectively, and a corresponding weakening or strengthening of the limits.
7 Future prospects
For future analyses using two ARA deep stations, we expect to have at least a factor of 6 improvement in sensitivity compared to this one using Testbed data assuming the same analysis with similar cuts. There is a factor of 3 expected increase going from the shallow Testbed station to a 200 m deep-station and another factor of 2 for the number of deep stations currently operating. In addition, we plan to increase the number of deep stations. Fig. 8 shows the expected ARA37 trigger-level limit based on these and other improvement factors similar to those described for the diffuse neutrino search [29]. Below, we motivate an expectation for a high analysis efficiency in future ARA GRB analyses. Furthermore, the implementation of a phased array trigger design, as described in Ref. [92], currently funded for an initial deployment in 2017-2018, would decrease the trigger threshold and improve the sensitivity to neutrinos from GRBs.
In the future, by restricting our GRB searches in direction (so as not to include the South Pole direction), and by improving the way we reject CW backgrounds, we expect that we may eliminate all cuts but those designed to reject thermal noise. ARA has the ability to reconstruct the directions of RF signals, and we plan to develop the capability of reconstructing neutrino directions also, using polarization and spectral information. In addition, we are working to replace our CW cuts with filters. Keeping only cuts designed to reject thermal noise would leave the Reconstruction Quality Cut and the Peak/Correlation Cut as those with an important impact on our sensitivity. With only these cuts, we find that the analysis efficiency for the dominant GRB fluence in this paper increases from 6% to 14%, a factor of 2.3 increase beyond the increases mentioned above due to expansion of the array.
Improvements in the reconstruction by using an algorithm that solves for event distance and additional antennas in design stations are expected to lead to improvements in the analysis efficiency by an additional factor of a few. Although the Reconstruction Quality Cut was significantly relaxed here compared to the diffuse analysis [29], its efficiency against simulated triggered events was , primarily rejecting events with a low signal-to-noise ratio (SNR). Improvements to the reconstruction method under development will be able to increase the efficiency of reconstructing these low-SNR events. Additionally, in the design stations, the number of pairs of antennas of each polarization contributing to the interferometric map increases from 6 to 28, which is expected to improve the efficiency, in particular, by giving low-SNR events a higher peak correlation value to differentiate it from noise.
8 Conclusions
Using data from the ARA Testbed station from January 2011 to December 2012, we have searched for UHE neutrinos from GRBs. We selected 57 GRBs that occurred during this period within the field of view of the Testbed. We searched for GRB neutrinos in a time window around each burst. The resulting reduced background allowed us to loosen our analysis cuts and improve our analysis efficiency for neutrinos from the 57 GRBs by a factor of 2.4. The GRB neutrino spectra were calculated using NeuCosmA, an advanced high-energy astrophysical neutrino fluence generator.
We found zero events passing the cuts for our search, which is consistent with the expectation. We obtained a GRB neutrino fluence limit and the first quasi-diffuse GRB neutrino flux limit for energies above GeV.
Future analyses from two ARA deep stations are expected to have at least a factor-of-6 improvement in sensitivity compared to the present analysis with the ARA Testbed, assuming the same cuts. Another factor of about 10 is feasible from planned developments in reconstruction and CW filtering capabilities at the analysis stage with the current deep station design.
9 Acknowledgements
We thank Chris Weaver from the University of Wisconsin for his work developing the RaySolver algorithm used in AraSim. We thank the National Science Foundation for their support through NSF Grant 1404266, Grant NSF OPP-1002483 and Grant NSF OPP-1359535, Taiwan National Science Councils Vanguard Program: NSC 102-2628-M-002-010 and the the FRSFNRS (Belgium). A. Connolly would like to thank the National Science Foundation for their support through CAREER award 1255557. A. Connolly, H. Landsman, D. Guetta and D. Besson would like to thank the United States-Israel Binational Science Foundation for their support through Grant 2012077. A. Connolly, A. Karle and J. Kelley would also like to thank the National Science Foundation for the support through BIGDATA Grant 1250720. K. Hoffman would like to thank the National Science Foundation for their support through CAREER award 0847658. We also acknowledge the University of Wisconsin Alumni Research Foundation, the University of Maryland and the Ohio State University for their support. We are grateful to the U.S. National Science Foundation-Office of Polar Programs, the U.S. National Science Foundation-Physics Division, and the Ohio Supercomputer Center. M. Bustamante was partially supported by NSF Grant PHY-1404311 to J. F. Beacom.
References
- [1] M. J. Rees, P. Meszaros, Relativistic fireballs - energy conversion and time - scales, Mon. Not. Roy. Astron. Soc. 258 (1992) 41–43.
- [2] P. Meszaros, M. J. Rees, High entropy fireballs and jets in gamma-ray burst sources, Mon. Not. Roy. Astron. Soc. 257 (1992) 29–31.
- [3] P. Meszaros, M. J. Rees, Relativistic fireballs and their impact on external matter - Models for cosmological gamma-ray bursts, Astrophys. J. 405 (1993) 278. doi:10.1086/172360.
- [4] T. Piran, Gamma-ray bursts and the fireball model, Phys. Rept. 314 (1999) 575–667. arXiv:astro-ph/9810256, doi:10.1016/S0370-1573(98)00127-6.
- [5] E. Waxman, Gamma-ray bursts: The Underlying model, Lect. Notes Phys. 598 (2003) 393. arXiv:astro-ph/0303517.
- [6] M. J. Rees, P. Meszaros, Unsteady outflow models for cosmological gamma-ray bursts, Astrophys. J. 430 (1994) L93–L96. arXiv:astro-ph/9404038, doi:10.1086/187446.
- [7] R. Sari, T. Piran, Variability in GRBs: A Clue, Astrophys. J. 485 (1997) 270. arXiv:astro-ph/9701002, doi:10.1086/304428.
- [8] E. Waxman, J. N. Bahcall, High-energy neutrinos from cosmological gamma-ray burst fireballs, Phys. Rev. Lett. 78 (1997) 2292–2295. arXiv:astro-ph/9701231, doi:10.1103/PhysRevLett.78.2292.
- [9] D. Guetta, D. Hooper, J. Alvarez-Muniz, F. Halzen, E. Reuveni, Neutrinos from individual gamma-ray bursts in the BATSE catalog, Astropart. Phys. 20 (2004) 429–455. arXiv:astro-ph/0302524, doi:10.1016/S0927-6505(03)00211-1.
- [10] R. Sari, T. Piran, R. Narayan, Spectra and light curves of gamma-ray burst afterglows, Astrophys. J. 497 (1998) L17. arXiv:astro-ph/9712005, doi:10.1086/311269.
- [11] P. Meszaros, Gamma-ray burst afterglows and their implications, Astron. Astrophys. Suppl. Ser. 138 (1999) 533–536. arXiv:astro-ph/9812478, doi:10.1051/aas:1999341.
- [12] E. Waxman, J. N. Bahcall, Neutrino afterglow from gamma-ray bursts: Similar to eV, Astrophys. J. 541 (2000) 707–711. arXiv:hep-ph/9909286, doi:10.1086/309462.
- [13] M. Aartsen, et al., Phys. Rev. Lett. 111 (2013) 021103. arXiv:1304.5356, doi:10.1103/PhysRevLett.111.021103.
- [14] M. Aartsen, et al., Evidence for High-Energy Extraterrestrial Neutrinos at the IceCube Detector, Science 342 (6161) (2013) 1242856. arXiv:1311.5238, doi:10.1126/science.1242856.
- [15] M. G. Aartsen, et al., Search for a diffuse flux of astrophysical muon neutrinos with the IceCube 59-string configuration, Phys. Rev. D 89 (6) (2014) 062007. arXiv:1311.7048, doi:10.1103/PhysRevD.89.062007.
- [16] M. Aartsen, et al., Observation of High-Energy Astrophysical Neutrinos in Three Years of IceCube Data, Phys. Rev. Lett. 113 (2014) 101101. arXiv:1405.5303, doi:10.1103/PhysRevLett.113.101101.
- [17] M. G. Aartsen, et al., A combined maximum-likelihood analysis of the high-energy astrophysical neutrino flux measured with IceCube, Astrophys. J. 809 (1) (2015) 98. arXiv:1507.03991, doi:10.1088/0004-637X/809/1/98.
- [18] M. G. Aartsen, et al., Evidence for Astrophysical Muon Neutrinos from the Northern Sky with IceCube, Phys. Rev. Lett. 115 (8) (2015) 081102. arXiv:1507.04005, doi:10.1103/PhysRevLett.115.081102.
- [19] A. L. Connolly, A. G. Vieregg, Radio Detection of High Energy NeutrinosarXiv:1607.08232.
- [20] G. A. Askaryan, Excess Negative Charge of an Electron-Photon Shower And Its Coherent Radio Emission, JETP 14 (1962) 441.
- [21] G. A. Askaryan, Coherent Radio Emission from Cosmic Showers in Air and in Dense Media, JETP 21 (1965) 658.
- [22] E. Zas, F. Halzen, T. Stanev, Electromagnetic pulses from high-energy showers: Implications for neutrino detection, Phys. Rev. D 45 (1992) 362–376. doi:10.1103/PhysRevD.45.362.
- [23] P. Gorham, et al., Radio-frequency measurements of coherent transition and Cherenkov radiation: Implications for high-energy neutrino detection, Phys. Rev. E 62 (2000) 8590–8605. arXiv:hep-ex/0004007, doi:10.1103/PhysRevE.62.8590.
- [24] D. Saltzberg, et al., Observation of the Askaryan effect, AIP Conf. Proc. 579 (2001) 225–233. doi:10.1063/1.1398175.
- [25] P. W. Gorham, et al., Accelerator measurements of the Askaryan effect in rock salt: A roadmap toward Teraton underground neutrino detectors, Phys. Rev. D 72 (2005) 023002. arXiv:astro-ph/0412128, doi:10.1103/PhysRevD.72.023002.
- [26] P. W. Gorham, et al., Observations of the Askaryan effect in ice, Phys. Rev. Lett. 99 (2007) 171101. arXiv:hep-ex/0611008, doi:10.1103/PhysRevLett.99.171101.
- [27] P. Allison, J. Auffenberg, R. Bard, J. Beatty, D. Besson, et al., Design and Initial Performance of the Askaryan Radio Array Prototype EeV Neutrino Detector at the South Pole, Astropart. Phys. 35 (2012) 457–477. arXiv:1105.2854, doi:10.1016/j.astropartphys.2011.11.010.
- [28] S. Barwick, D. Besson, P. Gorham, D. Saltzberg, South Polar in situ radio-frequency ice attenuation, J. Glaciol. 51 (2005) 231–238. doi:10.3189/172756505781829467.
- [29] P. Allison, et al., First Constraints on the Ultra-High Energy Neutrino Flux from a Prototype Station of the Askaryan Radio Array, Astropart. Phys. 70 (2015) 62–80. arXiv:1404.5285, doi:10.1016/j.astropartphys.2015.04.006.
- [30] P. Allison, et al., Performance of two Askaryan Radio Array stations and first results in the search for ultrahigh energy neutrinos, Phys. Rev. D 93 (8) (2016) 082003. arXiv:1507.08991, doi:10.1103/PhysRevD.93.082003.
- [31] M. Ackermann, et al., Optical properties of deep glacial ice at the South Pole, Journal of Geophysical Research 111 (2006) D13203. doi:10.1029/2005JD006687.
- [32] R. Abbasi, et al., Search for muon neutrinos from Gamma-Ray Bursts with the IceCube neutrino telescope, Astrophys. J. 710 (2010) 346–359. arXiv:0907.2227, doi:10.1088/0004-637X/710/1/346.
- [33] S. Adrian-Martinez, et al., Search for Cosmic Neutrino Point Sources with Four Year Data of the ANTARES Telescope, Astrophys. J. 760 (2012) 53. arXiv:1207.3105, doi:10.1088/0004-637X/760/1/53.
- [34] A. Vieregg, K. Palladino, P. Allison, B. Baughman, J. Beatty, et al., The First Limits on the Ultra-high Energy Neutrino Fluence from Gamma-ray Bursts, Astrophys. J. 736 (2011) 50. arXiv:1102.3206, doi:10.1088/0004-637X/736/1/50.
- [35] R. Abbasi, et al., Limits on Neutrino Emission from Gamma-Ray Bursts with the 40 String IceCube Detector, Phys. Rev. Lett. 106 (2011) 141101. arXiv:1101.1448, doi:10.1103/PhysRevLett.106.141101.
- [36] R. Abbasi, et al., An absence of neutrinos associated with cosmic-ray acceleration in -ray bursts, Nature 484 (2012) 351–353. arXiv:1204.4219, doi:10.1038/nature11068.
- [37] M. Aartsen, et al., Search for Prompt Neutrino Emission from Gamma-Ray Bursts with IceCube, Astrophys. J. 805 (1) (2015) L5. arXiv:1412.6510, doi:10.1088/2041-8205/805/1/L5.
- [38] M. G. Aartsen, et al., An All-Sky Search for Three Flavors of Neutrinos from Gamma-Ray Bursts with the IceCube Neutrino ObservatoryarXiv:1601.06484.
- [39] S. Adrian-Martinez, et al., Search for muon neutrinos from gamma-ray bursts with the ANTARES neutrino telescope using 2008 to 2011 data, Astron. Astrophys. 559 (2013) A9. arXiv:1307.0304, doi:10.1051/0004-6361/201322169.
- [40] S. Razzaque, J. A. Adams, P. Harris, D. Besson, Limits on the Transient Ultrahigh Energy Neutrino Flux from Gamma-Ray Bursts (GRB) Derived from RICE Data, Astropart. Phys. 26 (2007) 367–377. arXiv:astro-ph/0605480, doi:10.1016/j.astropartphys.2006.07.008.
- [41] M. G. Aartsen, et al., Energy Reconstruction Methods in the IceCube Neutrino Telescope, JINST 9 (2014) P03009. arXiv:1311.4767, doi:10.1088/1748-0221/9/03/P03009.
- [42] E. Waxman, J. N. Bahcall, High-energy neutrinos from astrophysical sources: An Upper bound, Phys. Rev. D 59 (1999) 023002. arXiv:hep-ph/9807282, doi:10.1103/PhysRevD.59.023002.
- [43] S. Hummer, P. Baerwald, W. Winter, Neutrino Emission from Gamma-Ray Burst Fireballs, Revised, Phys. Rev. Lett. 108 (2012) 231101. arXiv:1112.1076, doi:10.1103/PhysRevLett.108.231101.
- [44] M. Ageron, J. Aguilar, I. Al Samarai, A. Albert, F. Ameli, et al., ANTARES: the first undersea neutrino telescope, Nucl. Instrum. Meth. A 656 (2011) 11–38. arXiv:1104.1607, doi:10.1016/j.nima.2011.06.103.
- [45] I. Kravchenko, S. Hussain, D. Seckel, D. Besson, E. Fensholt, J. Ralston, J. Taylor, K. Ratzlaff, R. Young, Updated Results from the RICE Experiment and Future Prospects for Ultra-High Energy Neutrino Detection at the South Pole, Phys. Rev. D 85 (2012) 062004. arXiv:1106.1164, doi:10.1103/PhysRevD.85.062004.
- [46] S. Hoover, et al., Observation of Ultra-high-energy Cosmic Rays with the ANITA Balloon-borne Radio Interferometer, Phys. Rev. Lett. 105 (2010) 151101. arXiv:1005.0035, doi:10.1103/PhysRevLett.105.151101.
- [47] P. Gorham, et al., Erratum: Observational Constraints on the Ultra-high Energy Cosmic Neutrino Flux from the Second Flight of the ANITA Experiment, Phys. Rev. D 85 (2012) 049901. arXiv:1011.5004, doi:10.1103/PhysRevD.82.022004,10.1103/PhysRevD.85.049901.
- [48] S. Hummer, M. Ruger, F. Spanier, W. Winter, Simplified models for photohadronic interactions in cosmic accelerators, Astrophys. J. 721 (2010) 630–652. arXiv:1002.1310, doi:10.1088/0004-637X/721/1/630.
- [49] D. Band, J. Matteson, L. Ford, B. Schaefer, D. Palmer, et al., BATSE observations of gamma-ray burst spectra. 1. Spectral diversity., Astrophys. J. 413 (1993) 281–292. doi:10.1086/172995.
- [50] J. A. Aguilar, Online Gamma-Ray Burst catalog for neutrino telescopes, in: Proceedings, 32nd International Cosmic Ray Conference (ICRC 2011), Vol. 8, 2011, p. 235. arXiv:1110.5946, doi:10.7529/ICRC2011/V08/1063.
- [51] http://gcn.gsfc.nasa.gov.
- [52] http://icecube.wisc.edu/science/tools.
- [53] J. P. Rachen, P. Meszaros, Photohadronic neutrinos from transients in astrophysical sources, Phys. Rev. D 58 (1998) 123005. arXiv:astro-ph/9802280, doi:10.1103/PhysRevD.58.123005.
- [54] P. Lipari, M. Lusignoli, D. Meloni, Flavor Composition and Energy Spectrum of Astrophysical Neutrinos, Phys. Rev. D 75 (2007) 123005. arXiv:0704.0718, doi:10.1103/PhysRevD.75.123005.
- [55] P. Baerwald, S. Hummer, W. Winter, Magnetic Field and Flavor Effects on the Gamma-Ray Burst Neutrino Flux, Phys. Rev. D 83 (2011) 067303. arXiv:1009.4010, doi:10.1103/PhysRevD.83.067303.
- [56] A. Mucke, R. Engel, J. Rachen, R. Protheroe, T. Stanev, SOPHIA: Monte Carlo simulations of photohadronic processes in astrophysics, Comput. Phys. Commun. 124 (2000) 290–314. arXiv:astro-ph/9903478, doi:10.1016/S0010-4655(99)00446-4.
- [57] P. Baerwald, M. Bustamante, W. Winter, UHECR escape mechanisms for protons and neutrons from GRBs, and the cosmic ray-neutrino connection, Astrophys. J. 768 (2013) 186. arXiv:1301.6163, doi:10.1088/0004-637X/768/2/186.
- [58] P. Baerwald, M. Bustamante, W. Winter, Are gamma-ray bursts the sources of ultra-high energy cosmic rays?, Astropart. Phys. 62 (2015) 66–91. arXiv:1401.1820, doi:10.1016/j.astropartphys.2014.07.007.
- [59] N. Globus, D. Allard, R. Mochkovitch, E. Parizot, UHECR acceleration at GRB internal shocks, Mon. Not. Roy. Astron. Soc. 451 (1) (2015) 751–790. arXiv:1409.1271, doi:10.1093/mnras/stv893.
- [60] M. Bustamante, P. Baerwald, K. Murase, W. Winter, Neutrino and cosmic-ray emission from multiple internal shocks in gamma-ray bursts, Nature Commun. 6 (2015) 6783. arXiv:1409.2874, doi:10.1038/ncomms7783.
- [61] M. Bustamante, K. Murase, W. Winter, Multi-messenger light curves from gamma-ray bursts in the internal shock model arXiv:1606.02325.
- [62] J. Alvarez-Muniz, A. Romero-Wolf, E. Zas, Practical and accurate calculations of Askaryan radiation, Phys. Rev. D 84 (2011) 103003. arXiv:1106.6283, doi:10.1103/PhysRevD.84.103003.
- [63] L. Landau, I. Pomeranchuk, Limits of applicability of the theory of bremsstrahlung electrons and pair production at high-energies, Dokl. Akad. Nauk Ser. Fiz. 92 (1953) 535–536.
- [64] L. Landau, I. Pomeranchuk, Electron cascade process at very high-energies, Dokl. Akad. Nauk Ser. Fiz. 92 (1953) 735–738.
- [65] A. B. Migdal, Bremsstrahlung and pair production in condensed media at high-energies, Phys. Rev. 103 (1956) 1811–1820. doi:10.1103/PhysRev.103.1811.
- [66] J. Alvarez-Muniz, E. Zas, Cherenkov radio pulses from Eev neutrino interactions: The LPM effect, Phys. Lett. B 411 (1997) 218–224. arXiv:astro-ph/9706064, doi:10.1016/S0370-2693(97)01009-5.
- [67] D. R. Williams, The Askar’yan effect and detection of extremely high energy neutrinos in the lunar regolith and salt, Ph.D. thesis, UCLA.
- [68] A. Connolly, R. S. Thorne, D. Waters, Calculation of High Energy Neutrino-Nucleon Cross Sections and Uncertainties Using the MSTW Parton Distribution Functions and Implications for Future Experiments, Phys. Rev. D 83 (2011) 113009. arXiv:1102.0691, doi:10.1103/PhysRevD.83.113009.
- [69] M. Aartsen, et al., Probing the origin of cosmic-rays with extremely high energy neutrinos using the IceCube Observatory, Phys.Rev. D88 (2013) 112008. arXiv:1310.5477.
- [70] M. G. Aartsen, et al., The IceCube Neutrino Observatory - Contributions to ICRC 2015 Part II: Atmospheric and Astrophysical Diffuse Neutrino Searches of All Flavors, in: Proceedings, 34th International Cosmic Ray Conference (ICRC 2015): The Hague, The Netherlands, July 30-August 6, 2015, 2015. arXiv:1510.05223.
- [71] E. Waxman, The origin of IceCube’s neutrinos: Cosmic ray accelerators embedded in star forming calorimetersarXiv:1511.00815.
- [72] P. Baerwald, S. Hummer, W. Winter, Systematics in the Interpretation of Aggregated Neutrino Flux Limits and Flavor Ratios from Gamma-Ray Bursts, Astropart. Phys. 35 (2012) 508–529. arXiv:1107.5583, doi:10.1016/j.astropartphys.2011.11.005.
- [73] M. Lemoine, Nucleosynthesis in gamma-ray bursts outflows, Astron. Astrophys. 390 (2002) L31. arXiv:astro-ph/0205093, doi:10.1051/0004-6361:20020939.
- [74] A. M. Beloborodov, Nuclear composition of gamma-ray burst fireballs, Astrophys. J. 588 (2003) 931–944. arXiv:astro-ph/0210522, doi:10.1086/374217.
- [75] B. D. Metzger, D. Giannios, S. Horiuchi, Heavy Nuclei Synthesized in Gamma-Ray Burst Outflows as the Source of UHECRs, Mon. Not. Roy. Astron. Soc. 415 (2011) 2495. arXiv:1101.4019, doi:10.1111/j.1365-2966.2011.18873.x.
- [76] M. Vietri, On the acceleration of ultrahigh-energy cosmic rays in gamma-ray bursts, Astrophys. J. 453 (1995) 883–889. arXiv:astro-ph/9506081, doi:10.1086/176448.
- [77] K. Murase, K. Ioka, S. Nagataki, T. Nakamura, High-energy cosmic-ray nuclei from high- and low-luminosity gamma-ray bursts and implications for multi-messenger astronomy, Phys. Rev. D 78 (2008) 023005. arXiv:0801.2861, doi:10.1103/PhysRevD.78.023005.
- [78] K. Murase, J. F. Beacom, Very-High-Energy Gamma-Ray Signal from Nuclear Photodisintegration as a Probe of Extragalactic Sources of Ultrahigh-Energy Nuclei, Phys. Rev. D 82 (2010) 043008. arXiv:1002.3980, doi:10.1103/PhysRevD.82.043008.
- [79] S. Horiuchi, K. Murase, K. Ioka, P. Meszaros, The survival of nuclei in jets associated with core-collapse supernovae and gamma-ray bursts, Astrophys. J. 753 (2012) 69. arXiv:1203.0296, doi:10.1088/0004-637X/753/1/69.
- [80] M. J. Rees, P. Meszaros, Dissipative photosphere models of gamma-ray bursts and x-ray flashes, Astrophys. J. 628 (2005) 847–852. arXiv:astro-ph/0412702, doi:10.1086/430818.
- [81] A. Pe’er, P. Meszaros, M. J. Rees, Peak energy clustering and efficiency in compact objects, Astrophys. J. 635 (2005) 476–480. arXiv:astro-ph/0504346, doi:10.1086/497360.
- [82] A. M. Beloborodov, Collisional mechanism for GRB emission, Mon. Not. Roy. Astron. Soc. 407 (2010) 1033. arXiv:0907.0732, doi:10.1111/j.1365-2966.2010.16770.x.
- [83] F. Ryde, et al., Observational evidence of dissipative photospheres in gamma-ray bursts, Mon. Not. Roy. Astron. Soc. 415 (2011) 3693. arXiv:1103.0708, doi:10.1111/j.1365-2966.2011.18985.x.
- [84] A. Levinson, Observational signatures of sub-photospheric radiation mediated shocks in the prompt phase of GRBs, Astrophys. J. 756 (2012) 174. arXiv:1205.3227, doi:10.1088/0004-637X/756/2/174.
- [85] S. Keren, A. Levinson, Sub-photospheric, radiation-mediated shocks in Gamma-Ray Busts: Multiple shock emission and the Band spectrum, Astrophys. J. 789 (2014) 128. arXiv:1404.7274, doi:10.1088/0004-637X/789/2/128.
- [86] D. Giannios, The peak energy of dissipative GRB photospheres, Mon. Not. Roy. Astron. Soc. 422 (2012) 3092. arXiv:1111.4258, doi:10.1111/j.1365-2966.2012.20825.x.
- [87] J. C. McKinney, D. A. Uzdensky, A Reconnection Switch to Trigger Gamma-Ray Burst Jet Dissipation, Mon. Not. Roy. Astron. Soc. 419 (2012) 573–607. arXiv:1011.1904, doi:10.1111/j.1365-2966.2011.19721.x.
- [88] F. Yuan, B. Zhang, Episodic Jets as the Central Engine of Gamma-Ray Bursts, Astrophys. J. 757 (2012) 56. arXiv:1207.6153, doi:10.1088/0004-637X/757/1/56.
- [89] B. Zhang, B. Zhang, Gamma-Ray Burst Prompt Emission Light Curves and Power Density Spectra in the ICMART Model, Astrophys. J. 782 (2014) 92. arXiv:1312.7701, doi:10.1088/0004-637X/782/2/92.
- [90] S. Pakvasa, Neutrino Flavor Goniometry by High Energy Astrophysical Beams, Mod. Phys. Lett. A 23 (2008) 1313–1324. arXiv:0803.1701, doi:10.1142/S0217732308027680.
- [91] M. Bustamante, J. F. Beacom, W. Winter, Theoretically palatable flavor combinations of astrophysical neutrinos, Phys. Rev. Lett. 115 (16) (2015) 161302. arXiv:1506.02645, doi:10.1103/PhysRevLett.115.161302.
- [92] A. G. Vieregg, K. Bechtol, A. Romero-Wolf, A Technique for Detection of PeV Neutrinos Using a Phased Radio Array, JCAP 1602 (02) (2016) 005. arXiv:1504.08006, doi:10.1088/1475-7516/2016/02/005.