A dark incompressible dipolar liquid of excitons
Abstract
The possible phases and the nano-scale particle correlations of two-dimensional interacting dipolar particles is a long-sought problem in many-body physics. Here we observe a spontaneous condensation of trapped two-dimensional dipolar excitons with internal spin degrees of freedom from an interacting gas into a high density, closely packed liquid state made mostly of dark dipoles. Another phase transition, into a bright, highly repulsive plasma is observed at even higher excitation powers. The dark liquid state is formed below a critical temperature , and it is manifested by a clear spontaneous spatial condensation to a smaller and denser cloud, suggesting an attractive part to the interaction which goes beyond the purely repulsive dipole-dipole forces. Contributions from quantum mechanical fluctuations are expected to be significant in this strongly correlated, long living dark liquid. This is a new example of a two-dimensional atomic-like interacting dipolar quantum liquid, but where the coupling of light to its internal spin degrees of freedom plays a crucial role in the dynamical formation and the nature of resulting ground state.
Cold two-dimensional dipolar gases are an intriguing and theoretically challenging example of many-body interacting quantum fluids. Theoretical attempts to understand the phases and correlations of such dipolar fluids revealed a very rich behavior, with predictions of several exotic quantum and classical phases and correlation regimes Santos et al. (2000); Büchler et al. (2007); Lahaye et al. (2009); Astrakharchik et al. (2007); Laikhtman and Rapaport (2009a, b); Moroni and Boninsegni (2014) that are absent in weakly interacting Bose gases. These predictions sparked intensive experimental efforts in both atomic and molecular systems Lu et al. (2011); Gaj et al. (2014); Firstenberg et al. (2013); Jin and Ye (2011); Yan et al. (2013), as well as in two dimensional (2D) dipolar excitons in semiconductor bilayer systems (also known as indirect excitons - IXs) Eisenstein and MacDonald (2004); High et al. (2012a); Shilo et al. (2013); Kazimierczuk et al. (2014). These IXs are composed of a coulomb-bounded, yet spatially separated electron-hole pairs in an electrically biased semiconductor double quantum well (DQW) structure Butov (2004); Rapaport and Chen (2007). Recent theoretical analysis of the correlations in such a dipolar IX system predicts that in a very large range of densities the onset of quantum degeneracy is accompanied by the set-in of multi-particle interactions and correlations, so that dipolar IXs should behave as a strongly-interacting liquid rather than as a weakly interacting Bose-Einstein condensate (BEC) Laikhtman and Rapaport (2009a, b). What makes this IX system even more unique is the additional internal spin degrees of freedom of excitons in GaAs-based DQWs, allowing to explore the effect of spin on quantum correlations. The IX can be found in four different spin states, namely . The IXs with are optically active and are named ”bright” while the ones with are optically inactive and are named ”dark” Poem et al. (2010). This dark IX thus have a much longer lifetime. Due to spin-dependent exchange interaction between electrons and holes, the dark IXs are slightly lower in energy than the bright IXs Maialle et al. (1993), and therefore it was predicted that the ground state of the dipolar exciton fluid is dark and that a macroscopic phase transition to a dark BEC should be observed Combescot et al. (2007).
From the theoretical point of view, it seems that the picture is still incomplete, as no theory takes into account both dipolar interactions and the internal spin degrees of freedom to predict the origin and nature of the ground state of the IX fluid. On the experimental side, there are reports on the onset of coherent phenomena expected from a quantum degenerate dilute gas of IXs High et al. (2012a, b, 2013); Alloing et al. (2014), but other works show experimental evidence for a formation of a highly correlated interacting fluid Shilo et al. (2013) and for an exciton liquid Stern et al. (2014) and of a notable spontaneous darkening of a correlated dipolar exciton fluid below a certain temperature Shilo et al. (2013). It is therefore an open challenge to fully and unambiguously determine the formation mechanism and properties of the low temperature highly correlated collective dipolar state. Can the combination of the strong dipolar interactions, quantum degeneracy, together with the very long lifetime of the dark particles lead to a long lived, dark quantum dipolar liquid?
In this paper we report on the first observation of a spontaneous gas-liquid-plasma transitions of a trapped IX cloud at low temperatures, and show that the liquid phase is made up of mostly condensed dark particles, that it has the characteristic parameter range of an incompressible closely-packed quantum liquid, and that the underlying physics probably does not result from purely dipolar forces, but from more complex interactions at high densities, which have to do with the short range interactions due to the internal spin degrees of freedom.
To have a well defined and highly controlled system, we trap a cloud of IXs, optically excited in a GaAs based DQW structure under an electrostatic trap gate Rapaport et al. (2005), as is depicted schematically in Fig.1. The IXs are excited non-resonantly at the center of this quasi-parabolic electrostatic trap (denoted Xtrap), and its photoluminescence (PL) is measured under steady-state conditions (see Fig.2(a,b) for the Xtrap geometry and its energy profile respectively).
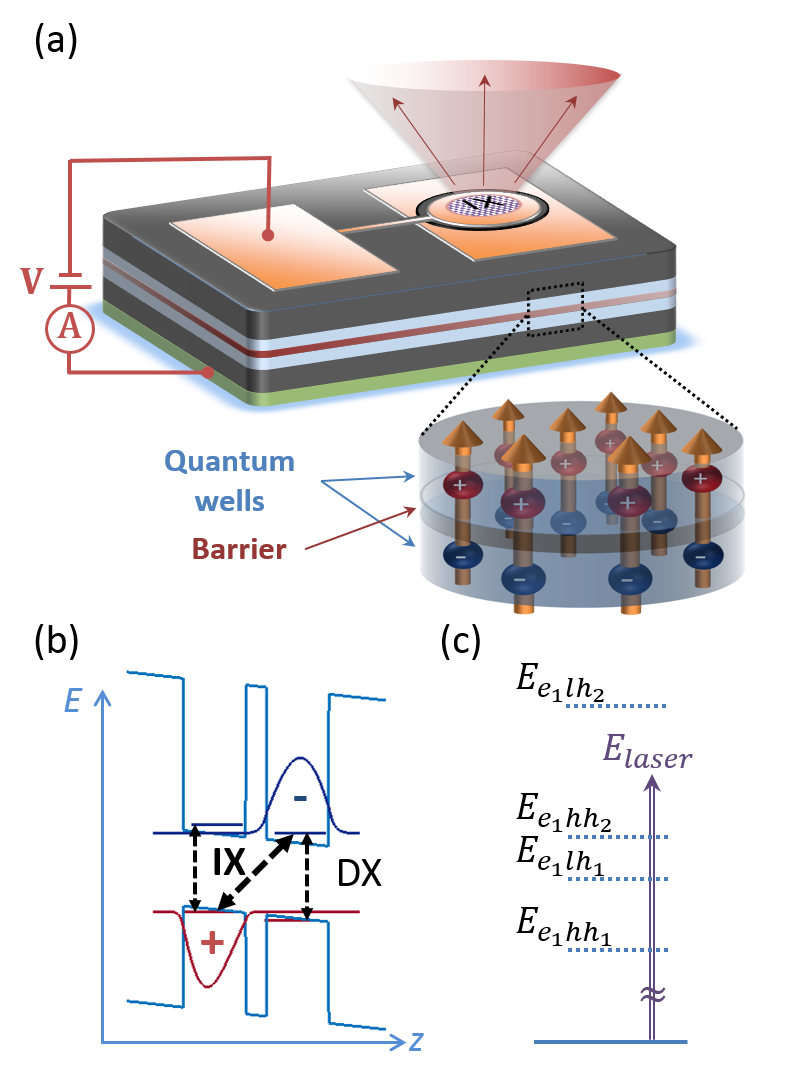
The spatial-spectral emission profile of the IXs is imaged on a CCD, allowing us to follow the size and shape of the IX cloud. Furthermore, we use a constant energy line method (CEL, see Shilo (2014) and SI) in which we can keep the energetic and electric environment of the exciton fluid fixed. This is achieved by adjusting the magnitude of the applied electric field on the DQW to keep the band tilting and thus the difference between the direct exciton (DX) and the IX transition energies, fixed while varying the optical excitation power and temperature. With this method we can extract information on the relations between the energy resulting from the many-body interactions between the IXs - Shilo et al. (2013) and their density, while fixing the single-particle properties of an IX (either bright or dark). This is because these single IX properties, such as its radiative and non-radiative lifetimes and its effective dipole size are determined by the same band tilting which also uniquely determines .
Four exemplary spatially resolved PL (along a central cross-section of the circular Xtrap) are shown in Fig.2(c-f) for non-resonant excitation at the center of the Xtrap. These measurements show two different temperatures and excitation powers, while the applied voltage was adjusted in each of the measurements to maintain a constant energy () for all of them. Two excitonic PL lines are observed for all the spectra, the high energy line (very weak) corresponds to the DX while the low energy line correspond to the IX.
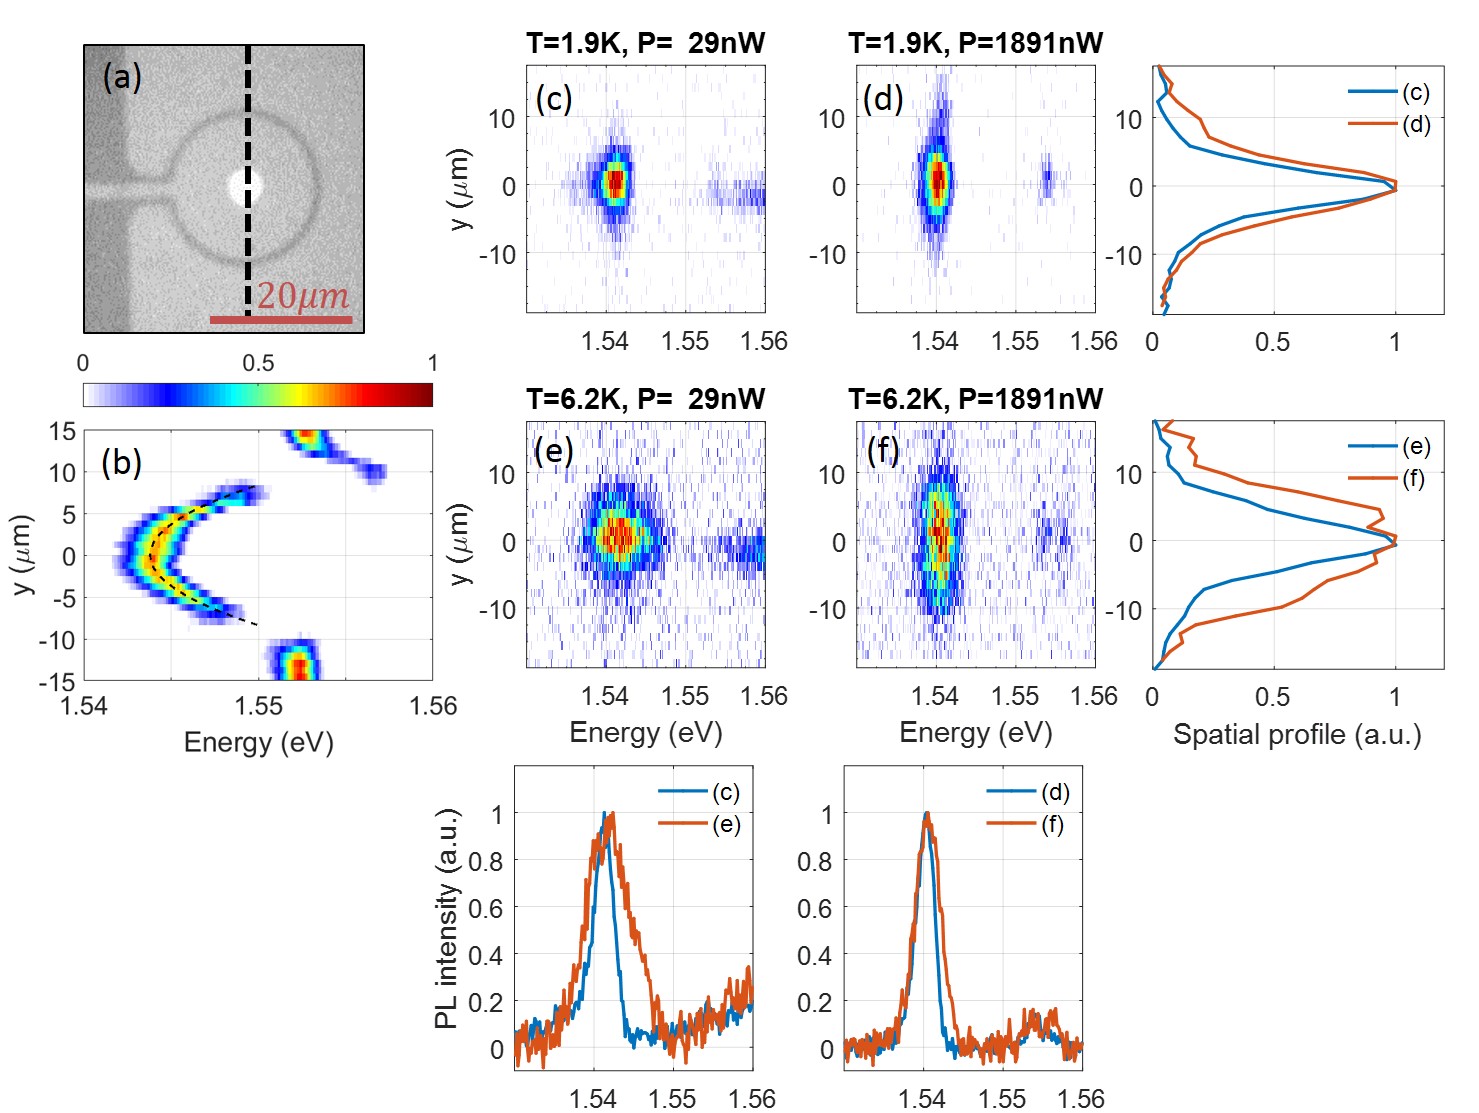
The PL is then spectrally integrated to obtain spatial profiles of the emission (Fig.2 right) and spatially integrated to obtain a single spectrum for each measurement (Fig.2 bottom). Such spectra are obtained and analyzed for different experimental conditions as is described next.
Figure 3(a) shows the total intensity extracted from the area under the spectral line of the IXs, obtained at different temperatures for a fixed excitation power () on a CEL with a fixed . Also shown is the applied electric field that was required in order to maintain the CEL at the aforementioned energy. By performing such CEL experiments for excitation powers spanning almost two orders of magnitude for each , we extract the many-body interaction term in a straightforward way: where is the applied field required for a fixed at a given , and is the effective distance between the centers of the two QWs (see SI for more detailed information on this method). These values and the spectral linewidth of the IXs PL are plotted as a function of for different values in Fig.3(b,c).
In the higher temperature range (, shown in Fig.3(b) decreases with decreasing temperature but increases with increasing excitation power. The increase of with is not surprising: the magnitude of the repulsive dipole-dipole interactions increase with increasing total density , i.e., (where is the interaction-induced particle correlation function Laikhtman and Rapaport (2009a)), and increases with increasing . The decrease of with decreasing (for a fixed ) at this temperature range was also predicted theoretically Laikhtman and Rapaport (2009b, a); Zimmermann and Schindler (2007) and observed experimentally Shilo et al. (2013), and it arises from increased interaction-induced particle correlations as the IXs become colder, resulting with a reduction of and thus of . Already at this higher temperature range a reduction of the IX linewidth with increasing for all temperatures above is observed, as seen in Fig.3(c). Such a strong linewidth reduction with increasing particle density indicates that the increase of density reduces the fluctuations of the interaction energy around its average value. This density-induced linewidth narrowing is a strong indication for multi-particle interactions and for deviation from a gas behavior Stern et al. (2014).
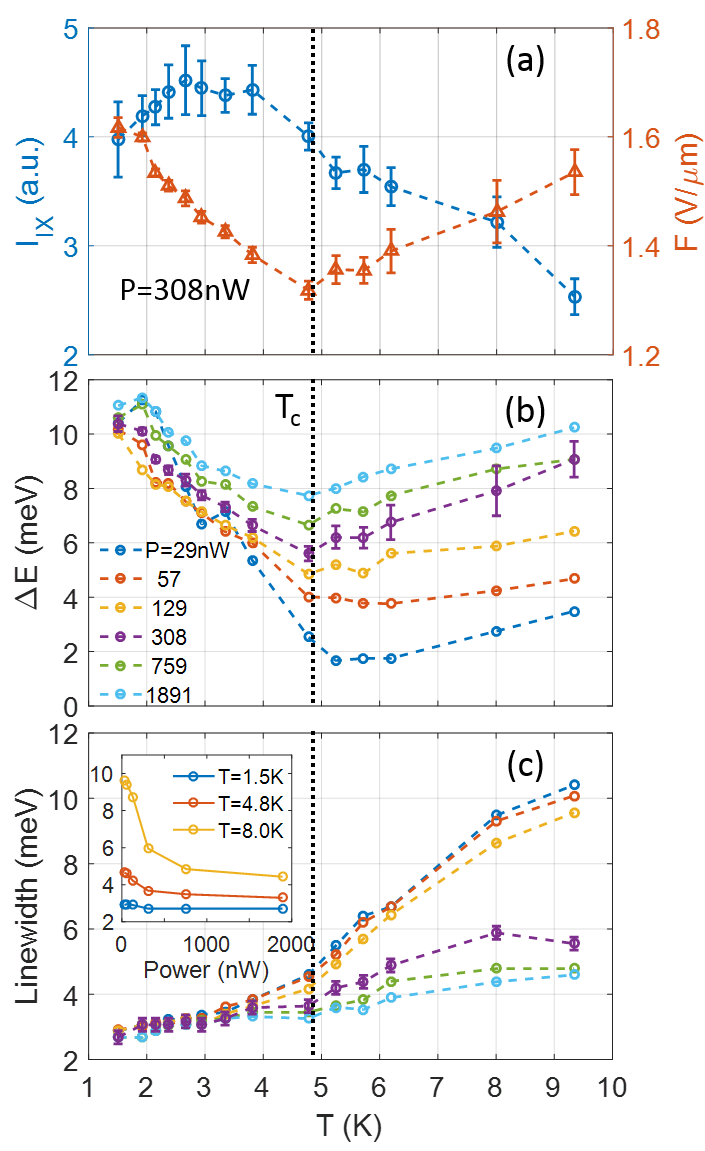
Surprisingly, moving to the low- range (), changes its trend and sharply rises with decreasing , as can be seen in Fig.3(b). slightly ”overshoots” to a maximum at and then slightly decreases and reaches a constant value, , at the lowest measured temperature, for all excitation powers . The PL linewidth also converge below to a constant low value at the lowest measured temperature, as can be seen in Fig.3(c). At this temperature, the linewidth also becomes independent of the excitation power, as is seen in the inset. The sharp increase of below indicates an increase of the total dipolar fluid density 111This increase cannot be due to a sudden increase in , since particles at lower temperatures have lower kinetic energies, higher spatial correlation, and thus smaller values of . Furthermore, the fact that at the lowest measured , together with a reduction of the PL linewidth to a small, fixed value suggests that the trapped fluid reaches a fixed density regardless of the excitation power. This observation is consistent with a transition into a condensed liquid state, that has a high density, fixed by the constraints of the physical system.
Perhaps the most striking evidence for the condensed phase formation and its properties can be seen in Fig.4. Since in Fig.3 the condensation at low temperatures was observed for all the measured excitation powers, we expanded the excitation power range even further to cover five orders of magnitude, and capture how the phase transitions are driven by the increased rate of optical excitation. The top-right panels of Fig.4 show the spatial-spectral emission profile of the IXs at . Initially, increasing the power results in an expansion of the IX cloud in the trap, as is expected from the mutual repulsive interactions between IXs. However, above a certain threshold power, the cloud shrinks with increasing excitation power and reaches a fixed size which almost does not vary over about two orders of magnitude of excitation powers. This marks the condensation to the fixed density liquid phase. When the power is further increased above another threshold value, the cloud starts to expand again in a fast rate. This fast expansion is a signature of a transition to an e-h plasma, driven outwards by the intra-layer e-e and h-h Coulomb repulsion. The spatial profile FWHM and the corresponding dependence on the excitation power at are shown by the blue symbols in Fig.4(a,b) respectively. It can be seen that the initial low power expansion turns into a very strong contraction that is accompanied by a large increase of , indicating a spontaneous large increase of density (which we will discuss later on). This is followed by an intermediate power regime (corresponding exactly to the two orders of magnitude power range of Fig. 3), in which both the spatial FWHM and are nearly constant, corresponding to an almost fixed density, regardless of excitation power. The high power regime shows a sudden and sharp increase of both the spatial FWHM and of , consistent with the picture of a strongly driven indirect e-h plasma. The orange symbols show the behavior at , above the condensation temperature. Indeed, non of the features of the condensation are observed, and the IXs expand and increase their density monotonically, consistent with a repulsive dipolar gas phase.
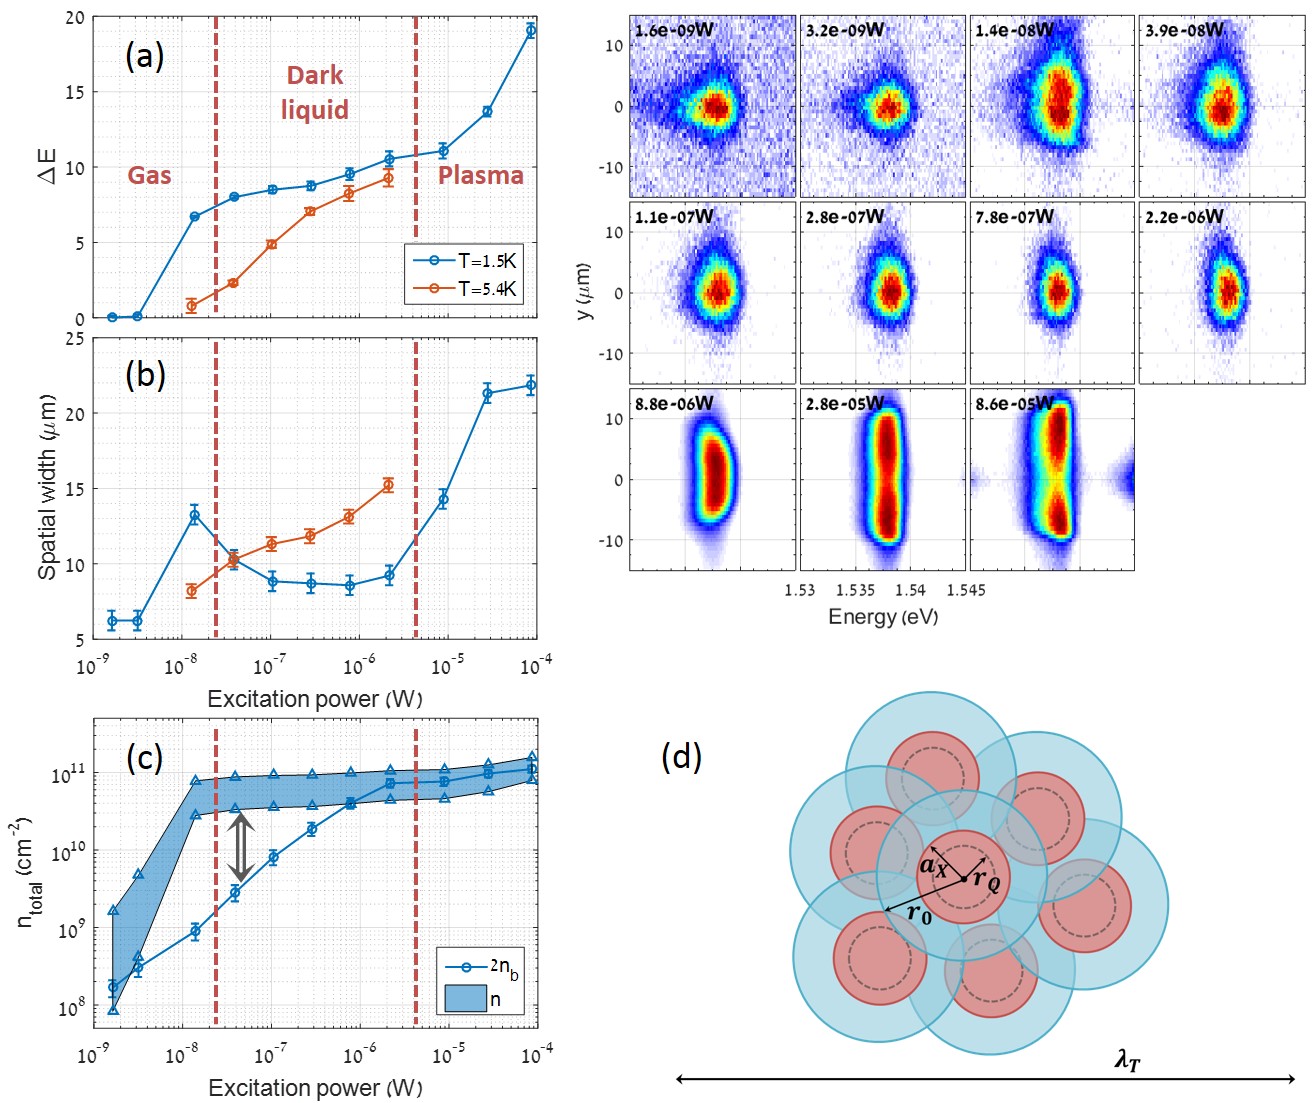
We can now estimate the saturated density of the condensed phase, , from the saturated value . Such an estimate requires a knowledge of the spatial particle correlations and . In Ref. Laikhtman and Rapaport (2009b) a theoretical estimate for was given for a dipolar exciton liquid. The density estimated from this liquid model yields , by setting the experimental value and the dielectric constant . A more self-consistent estimate, taking into account the kinetic energy from quantum motion (see SI), gives . This density corresponds to an average inter-particle distance . This average inter particle distance is smaller than the effective interaction radius of the dipolar exciton Laikhtman and Rapaport (2009b) at , which means that at this density the fluid is deeply inside the multi-particle interaction regime, thus the picture of a dipolar liquid state is self-consistent.
Remarkably, is between twice to three times the exciton Bohr radius (), namely . Therefore, at this density the IXs are almost closely packed and any further increase in the density significantly increases the overlap of the excitons wave functions. Such an increased overlap should result in a large deviations from the pure dipolar repulsion due to short-range direct and exchange coulomb terms. This specific inter-particle distance might point to the physical mechanism which both drives the spontaneous spatial shrinkage and determines the almost fixed density and thus the low compressibility of the condensed liquid. Recent numerical simulations of the two-body interactions of dipolar excitons have suggested that the interaction of two dipolar excitons can become slightly attractive as the inter-particle distances approach , and then strongly repulsive scaling as at even shorter distances Lee et al. (2009). This inter-particle distance is similar to the estimate of the current experiment.
A natural question now is what can be the mechanism responsible for the observed sharp increase in the IX cloud density as the excitation power increases above the critical power? In principle, a sharp increase in the total density under a fixed excitation power can result from a sharp increase in the radiative lifetime of the particles. Noting however that the whole experiment was done under single CEL, where the radiative lifetime of a single IX is kept constant, such an increase is not plausible. The other option is thus that the thermal equality between the populations of dark and bright IXs breaks, and that there is a spontaneous macroscopic accumulation of dark IXs above the critical excitation power. As dark IXs are optically inactive and have much longer lifetimes Shilo et al. (2013), this should result in a sharp increase of the total density for a fixed excitation power, as is indeed observed in the experiment.
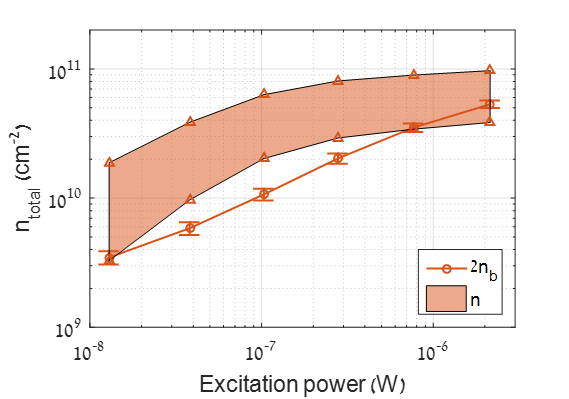
To check this latter picture, we extracted the total particle density, , from the interaction energy , as plotted in Fig.4(c). To avoid any model assumption about the relation between and through the unknown correlation parameter , the shaded blue region covers all possible values of , where the lower boundary is given by the uncorrelated gas limit (mean-field) and the upper boundary by the highest correlated limit of a dipolar crystal Laikhtman and Rapaport (2009a); Rapaport and Chen (2007). The sharp increase of at the critical power of the gas-liquid phase transition and its saturation up to the second critical power are clear. This behavior of extracted from is then compared with the total density estimated from the bright IX density alone, which we very carefully extracted from the intensity of IX emission (see SI for details). If we assume a thermal equality between bright and dark IX populations, i.e., then . This total density is plotted by the blue circles in Fig. 4(c). As can be seen, the density of bright IX smoothly increases with excitation power and does not exhibit any sharp increase at the phase transition, and thus it gives a much lower density than the density inferred from . Since inherently depends on the total density , while an assumption of thermal equality of bright and dark IXs population was used to extract from the PL intensity, it is clear that this assumption strongly underestimates the total density all the way to the second critical power where the transition to a plasma is observed, As such a strong underestimate is not observed for the data above (see SI), this strongly supports the picture of condensation of the IXs population into a dark state Combescot et al. (2007). It is interesting to note that the thermal de-Broglie wavelength of excitons at this temperature is estimated to be . Therefore, so that the IX cloud is quantum degenerate and this should support the condensation of dark IXs 222We note however that this estimate is for a non-interacting Bose gas, while as mentioned in Ref.Laikhtman and Rapaport (2009b) quantum degeneracy could be suppressed down to lower temperatures due to multi-particle correlations.
Finally, another important length scale that characterizes the liquid phase the is the quantum radius of the IX. This quantum radius, , is the ground-state wavefunction radius of an exciton confined in the parabolic-like potential resulting from the interaction with its surrounding excitons in the liquid. With a density given above, we can estimate (see SI and Ref. Laikhtman and Rapaport (2009b) for the calculation of ). Such a comparison yields . This result suggests that the quantum mechanical motion of the dipoles due to the uncertainty principle (their zero-point motion) is of the order of the inter-particle distance. Two important properties of the liquid can be inferred from this ratio: the first is that quantum mechanical fluctuations prevent formation of long range order and crystallization. The second is that it might suggest that the IX liquid has strong quantum mechanical properties, similarly to liquid for example. Indeed, the same calculation (see SI) shows that the kinetic energy due to the quantum motion is much larger than the classical kinetic energy , and that it contributes about 25% of the total liquid energy.
In conclusion, we observed phase transitions of a dipolar exciton fluid from a gas to a highly correlated dark liquid, and then to an e-h plasma, as the excitation power is increased at low enough temperatures. The liquid state, which results from a condensation of dark IX particles, has a well defined density, indicating a significant reduction in its compressibility. The analysis of the liquid’s energy and other properties suggests that the inter-particle distance approximately corresponds to a close-packing of the dipolar excitons, and that the liquid might have a significant quantum uncertainty energy contribution, quite similar to liquid . This is a new and exciting example of a collective state of a two-dimensional interacting system with internal spin degrees of freedom. Furthermore, this artificial atomic-like fluid resides inside a low-dimensional semiconductor structure, and it is a unique example where coupling of light to internal spin transitions plays a crucial role in the formation dynamics and in determining the collective ground state properties.
Acknowledgements.
We would like to acknowledge financial support from the German DFG (grant No. SA-598/9), from the German- Israeli Foundation (GIF I-1277-303.10/2014), and from the Israeli Science Foundation (grant No. 1319/12). The work at Princeton University was funded by the Gordon and Betty Moore Foundation through the EPiQS initiative Grant GBMF4420, and by the National Science Foundation MRSEC Grant DMR-1420541.References
- Santos et al. (2000) L. Santos, G. V. Shlyapnikov, P. Zoller, and M. Lewenstein, Phys. Rev. Lett. 85, 1791 (2000).
- Büchler et al. (2007) H. P. Büchler, E. Demler, M. Lukin, A. Micheli, N. Prokof’ev, G. Pupillo, and P. Zoller, Phys. Rev. Lett. 98, 060404 (2007).
- Lahaye et al. (2009) T. Lahaye, C. Menotti, L. Santos, M. Lewenstein, and T. Pfau, Rep. Prog. Phys. 72, 126401 (2009).
- Astrakharchik et al. (2007) G. E. Astrakharchik, J. Boronat, I. L. Kurbakov, and Y. E. Lozovik, Phys. Rev. Lett. 98, 060405 (2007).
- Laikhtman and Rapaport (2009a) B. Laikhtman and R. Rapaport, EPL 87, 27010 (2009a).
- Laikhtman and Rapaport (2009b) B. Laikhtman and R. Rapaport, Phys. Rev. B 80, 195313 (2009b).
- Moroni and Boninsegni (2014) S. Moroni and M. Boninsegni, Phys. Rev. Lett. 113, 240407 (2014).
- Lu et al. (2011) M. Lu, N. Q. Burdick, S. H. Youn, and B. L. Lev, Phys. Rev. Lett. 107, 190401 (2011).
- Gaj et al. (2014) A. Gaj, A. T. Krupp, J. B. Balewski, R. Löw, S. Hofferberth, and T. Pfau, Nat Commun 5 (2014), 10.1038/ncomms5546.
- Firstenberg et al. (2013) O. Firstenberg, T. Peyronel, Q.-Y. Liang, A. V. Gorshkov, M. D. Lukin, and V. Vuletić, Nature 502, 71 (2013).
- Jin and Ye (2011) D. S. Jin and J. Ye, Physics Today 64, 27 (2011).
- Yan et al. (2013) B. Yan, S. A. Moses, B. Gadway, J. P. Covey, K. R. A. Hazzard, A. M. Rey, D. S. Jin, and J. Ye, Nature 501, 521 (2013).
- Eisenstein and MacDonald (2004) J. P. Eisenstein and A. H. MacDonald, Nature 432, 691 (2004).
- High et al. (2012a) A. A. High, J. R. Leonard, A. T. Hammack, M. M. Fogler, L. V. Butov, A. V. Kavokin, K. L. Campman, and A. C. Gossard, Nature 483, 584 (2012a).
- Shilo et al. (2013) Y. Shilo, K. Cohen, B. Laikhtman, K. West, L. Pfeiffer, and R. Rapaport, Nat Commun 4 (2013), 10.1038/ncomms3335.
- Kazimierczuk et al. (2014) T. Kazimierczuk, D. Fröhlich, S. Scheel, H. Stolz, and M. Bayer, Nature 514, 343 (2014).
- Butov (2004) L. V. Butov, J. Phys.: Condens. Matter 16, R1577 (2004).
- Rapaport and Chen (2007) R. Rapaport and G. Chen, J. Phys.: Condens. Matter 19, 295207 (2007).
- Poem et al. (2010) E. Poem, Y. Kodriano, C. Tradonsky, N. H. Lindner, B. D. Gerardot, P. M. Petroff, and D. Gershoni, Nat Phys 6, 993 (2010).
- Maialle et al. (1993) M. Z. Maialle, E. A. de Andrada e Silva, and L. J. Sham, Phys. Rev. B 47, 15776 (1993).
- Combescot et al. (2007) M. Combescot, O. Betbeder-Matibet, and R. Combescot, Phys. Rev. Lett. 99, 176403 (2007).
- High et al. (2012b) A. A. High, J. R. Leonard, M. Remeika, L. V. Butov, M. Hanson, and A. C. Gossard, Nano Lett. 12, 2605 (2012b).
- High et al. (2013) A. A. High, A. T. Hammack, J. R. Leonard, S. Yang, L. V. Butov, T. Ostatnický, M. Vladimirova, A. V. Kavokin, T. C. H. Liew, K. L. Campman, and A. C. Gossard, Phys. Rev. Lett. 110, 246403 (2013).
- Alloing et al. (2014) M. Alloing, M. Beian, M. Lewenstein, D. Fuster, Y. González, L. González, R. Combescot, M. Combescot, and F. Dubin, EPL 107, 10012 (2014).
- Stern et al. (2014) M. Stern, V. Umansky, and I. Bar-Joseph, Science 343, 55 (2014).
- Rapaport et al. (2005) R. Rapaport, G. Chen, S. Simon, O. Mitrofanov, L. Pfeiffer, and P. M. Platzman, Phys. Rev. B 72, 075428 (2005).
- Shilo (2014) Y. Shilo, Optical study of two dimensional dipolar exciton fluids, Ph.D. thesis, Hebrew University of Jerusalem (2014).
- Zimmermann and Schindler (2007) R. Zimmermann and C. Schindler, Solid State Communications 144, 395 (2007).
- Note (1) This increase cannot be due to a sudden increase in , since particles at lower temperatures have lower kinetic energies, higher spatial correlation, and thus smaller values of .
- Lee et al. (2009) R. M. Lee, N. D. Drummond, and R. J. Needs, Phys. Rev. B 79, 125308 (2009).
- Note (2) We note however that this estimate is for a non-interacting Bose gas, while as mentioned in Ref.Laikhtman and Rapaport (2009b) quantum degeneracy could be suppressed down to lower temperatures due to multi-particle correlations.
- Kasprzak et al. (2006) J. Kasprzak, M. Richard, S. Kundermann, A. Baas, P. Jeambrun, J. M. J. Keeling, F. M. Marchetti, M. H. Szymanska, R. Andre, J. L. Staehli, V. Savona, P. B. Littlewood, B. Deveaud, and L. S. Dang, Nature 443, 409 (2006).
- Repp et al. (2014) J. Repp, G. J. Schinner, E. Schubert, A. K. Rai, D. Reuter, A. D. Wieck, U. Wurstbauer, J. P. Kotthaus, and A. W. Holleitner, Applied Physics Letters 105, 241101 (2014).
Supplementary Information
Supplementary Note 1 - Raw data for different temperatures and excitation powers
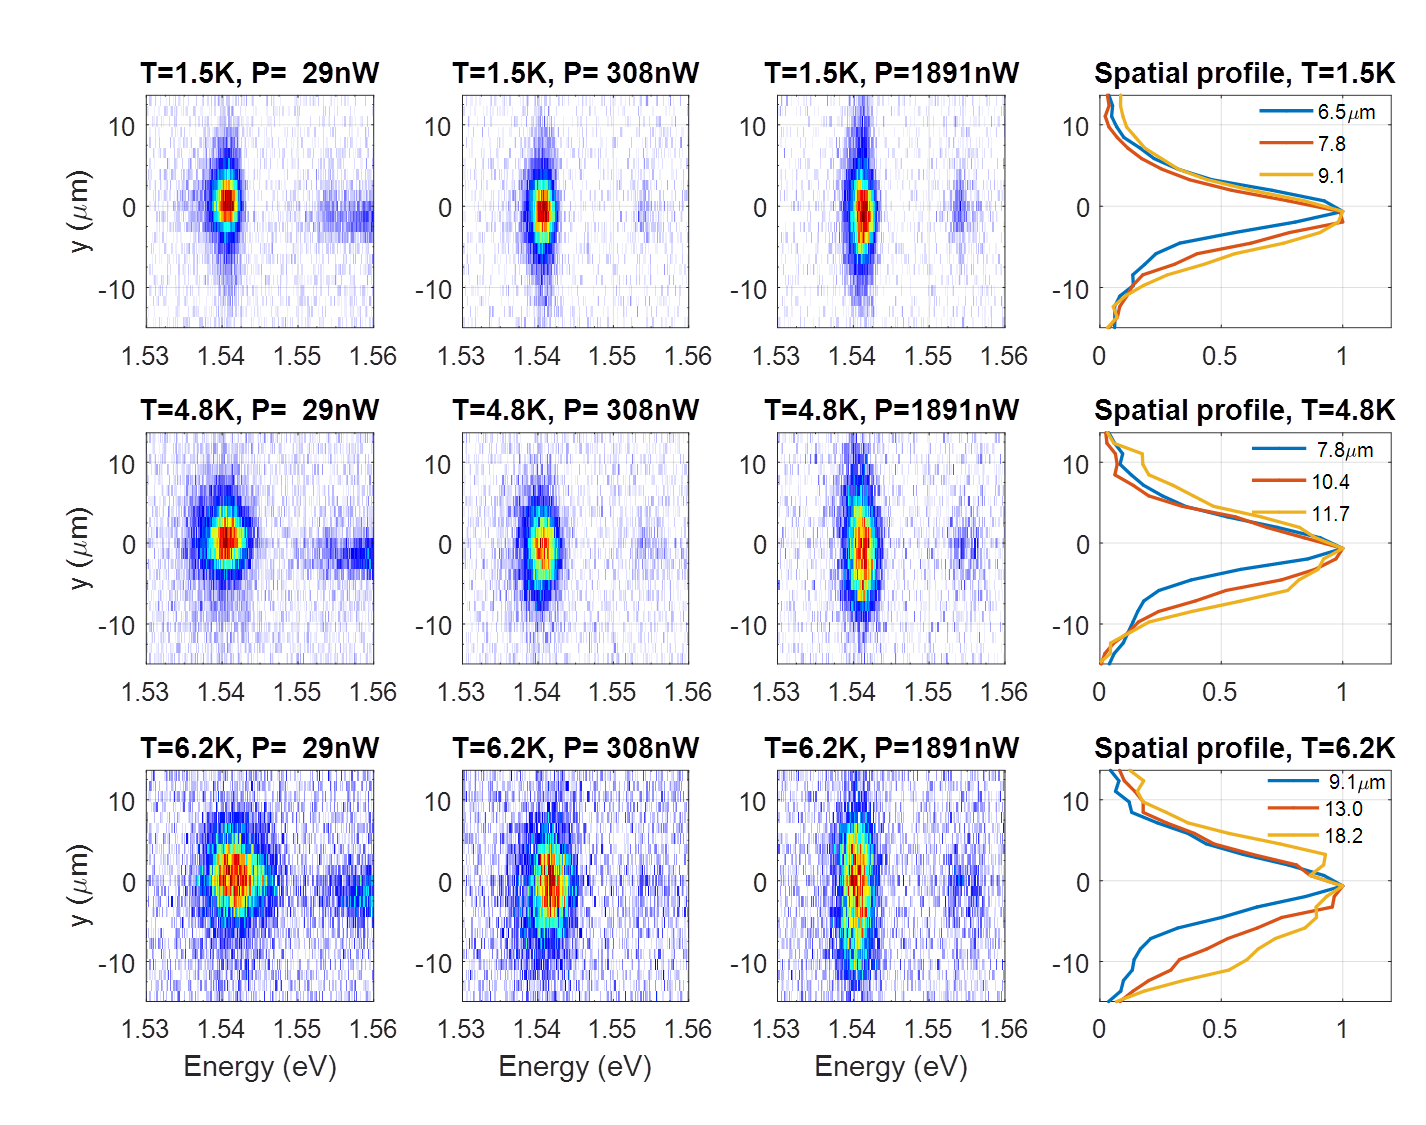
Figure S1 shows some raw data of photoluminescence, obtained at different temperatures and excitation powers, all for a constant energy line . One can see a very minor increase along the Xtrap spatial cross-section for the highest excitation power at , which translates into a slightly increased trap area by a factor of less than 1.4.
Supplementary Note 2 - Extraction of the blue-shift energy from the applied field
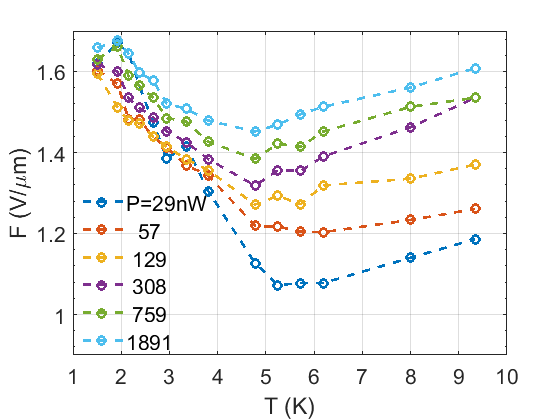
The electric field that is needed in order to maintain a specific constant energy line (i.e. a fixed ) is calculated using , where is the applied voltage and is the active sample thickness. Such data is shown in Fig. S2 as a function of temperatures for several different excitation powers.
In order to extract the blue shift energy from , we note that
| (S1) |
where the direct exciton energy has a very weak dependent on the density, temperature and the applied field (quadratic stark shift) in the measured parameters range. Now, in the limit of a very weak excitation power the indirect exciton gas in the trap becomes very dilute, and the blue shift energy is negligible: so one gets
| (S2) |
For a fixed (i.e. on a given CEL) we can combine the above equations and get that
| (S3) |
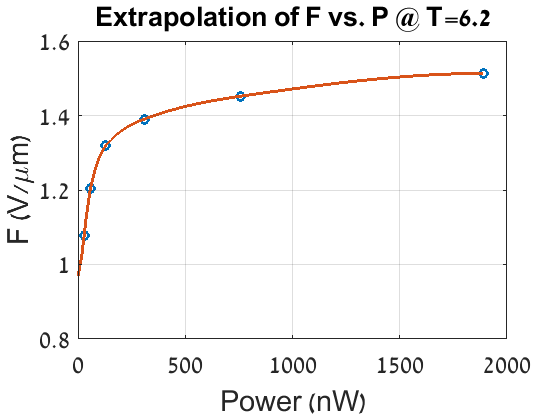
Next, we extrapolate the data of electric field vs. excitation power towards zero to extract in the limit of zero excitation power, as is shown in Fig. S3.
The temperature dependence of is expected to be negligible since the band gap dependence with is essentially flat in this temperature range and there are no multi-particle interactions in this limiting low density. Therefore we chose the data of for the extrapolation process and the same electric field is used to deduce the blue shift energy for all temperatures. This temperature is chosen since for there is a clear power dependence of , and no accumulation of dark particles is expected. The extrapolation of towards for other temperatures above gives similar results within less than error.
Supplementary Note 3 - Intensity and blue-shift energy for different constant energy lines (CELs)
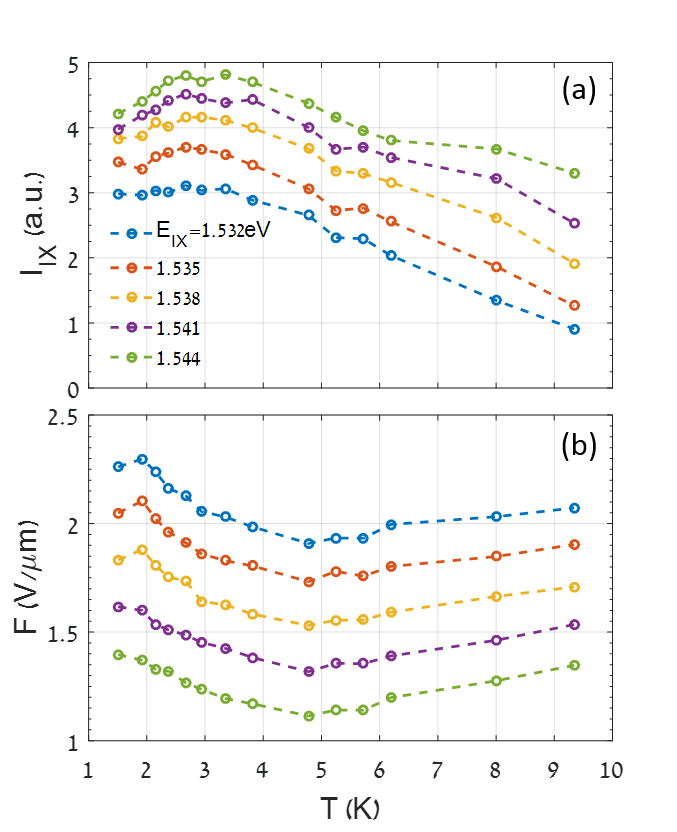
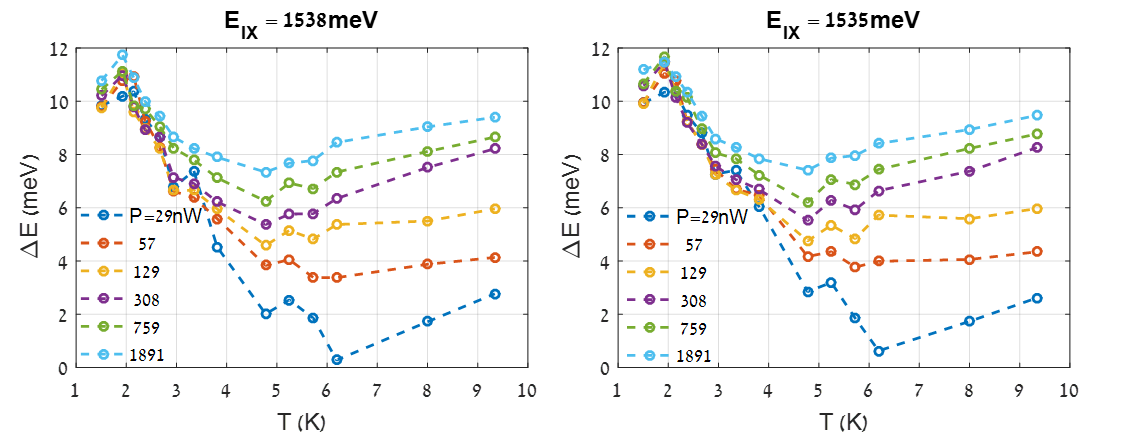
The results presented in the paper are not restricted to a specific choice of indirect exciton energy , but rather show similar features for the whole range of energies that was measured. Figure S4(a) shows the recorded PL intensity as a function of temperature for different values (at fixed excitation power). Figure S4(b) shows the applied electric field needed to maintain the CEL as a function of temperature. As one can expect, lower requires stronger electric field in agreement with the linear Stark effect.
We can then extract the blue-shift energy as is described in Supplementary Note 2. These results are shown in Figure S5, and display essentially the same features as shown in the main text.
Supplementary Note 4 - Photoluminescence intensity vs. tunneling current
While maintaining a constant energy line of , we recorded the total IX photoluminescence (PL) and tunneling current as a function of temperature for different excitation powers. The results are shown in Fig. S6, where we plot the PL intensity and tunneling current normalized by the excitation power. One can see an increasing PL intensity as the temperature is lowered down to about , where the intensity begins to decrease (darken). The tunneling current shows roughly an opposite pattern (except for the two lowest excitation powers, where the actual values are within or below our measurement resolution). These findings can be explained in light of the competing nature of radiative and non-radiative decay mechanisms. At high temperatures, there is a lower fraction of excitons occupying the light cone, and thus non-radiative mechanisms such as tunneling current are more dominant. As we cool down, more excitons enter the light cone and become radiative, so the intensity increases and the current decreases.
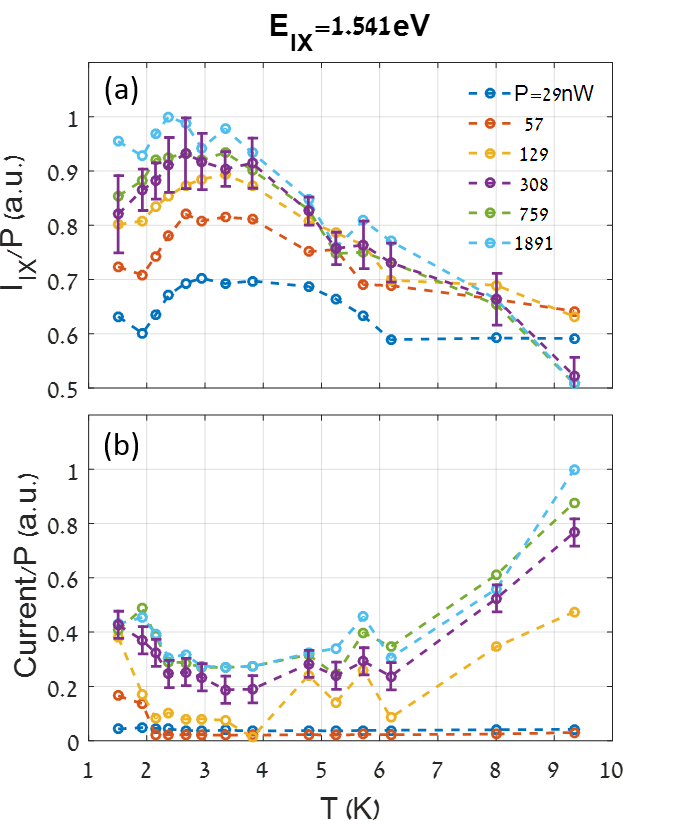
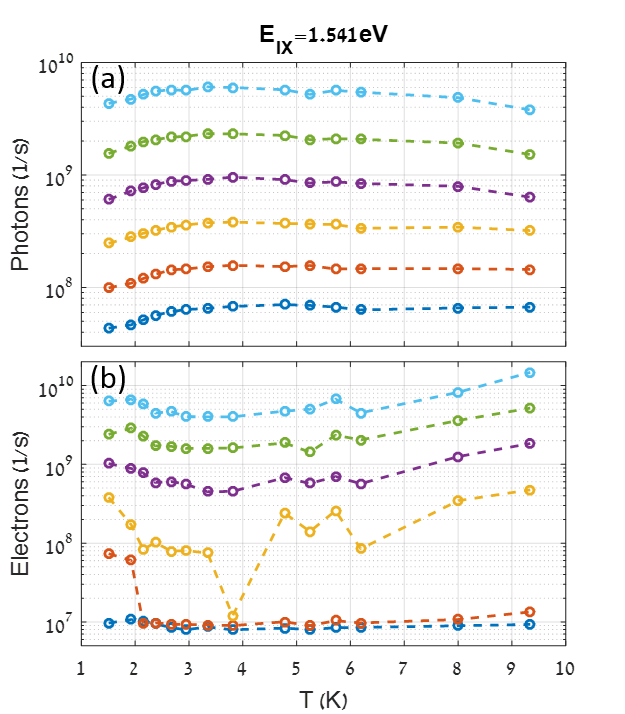
However, there is a clear change of trend below , from increasing to decreasing intensity as we lower the temperature. This suggests that radiative processes become less probable, as more excitons reside in dark states, and are thus compensated by an increasing tunneling current. To check this hypothesis, we carried out a careful and detailed analysis of the data which allowed us to compare the total number of emitted photons to that of electrons tunneling through the sample (for details see supplementary note 5 next). The results are presented in Fig. S7 and indeed show a very good agreement between the decrease of the photons’ rate at the lower temperature range and the increase of charge carriers rate. This indicates that the ”loss” of photons is accounted for by the increase of e-h pairs in the current (each exciton contributes one e-h pair if it tunnels out non-radiatively), so conservation of particles is maintained.
Supplementary Note 5 - Bright excitons density estimation
In order to calculate the bright exciton density from the measured photoluminescence, we assume a thermal distribution of excitons with uniform density across the trap area. In this case, we can write a rate equation for of the following form:
| (S4) |
where is the fraction of bright excitons occupying the light cone ( is temperature-dependent) Shilo et al. (2013), is the single exciton radiative lifetime, is exciton generation rate and is a bi-molecular recombination coefficient describing radiative emission due to two-particles processes (where ). In addition, due to the limited numerical aperture of our experimental apparatus, only a relatively small fraction of photons that are emitted from recombining bright excitons are collected and reach the detector (CCD). We denote this fraction by .
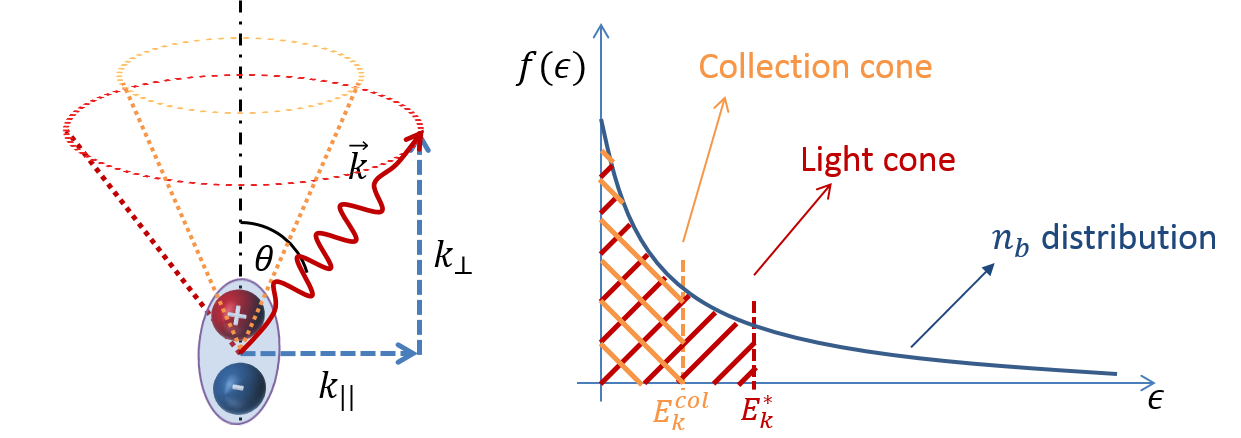
In general, these ratios depend on the distribution of excitons as a function of energy since they arise from conservation of energy and in-plane momentum (see Fig. S8). Figure S9 shows for example for the case of a uniform emission distribution (which means no in-plane momentum conservation) compared with a thermal Maxwell-Boltzmann distribution of excitons with momentum conservation. The error bars in the following estimations and those presented in Fig. 4(c) of the main text account for both limiting cases.

The intensity (counts/unit time) recorded by our detector is given by
| (S5) |
where is the exciton cloud area which is imaged onto the CCD, and is the combined loss of our experimental setup and the conversion efficiency of photons into counts. After measuring and accounting for all losses incurred by the optical elements of our setup and carefully calibrating the photons/count ratio in our system, we can extract the bright exciton density. was measured independently using a time resolved measurement described in detail in Ref. Shilo et al. (2013) so the only fitting parameter (i.e. the unknown parameter) in our model is , which is determined by the best agreement between the total density as extracted from and that of for , as shown in Fig. S10. We note however that the fit weakly depends on , since assuming only slightly changes the quality of the fit.
Supplementary Note 6 - Density estimation using an interacting quantum liquid expression
In the main text, we used the theoretical classical liquid interaction energy adopted from Ref. Laikhtman and Rapaport (2009b) (see Eq. 5.5 of this reference) to deduce the exciton density. However, this expression neglects the contribution from quantum confinement energy that comes from ”caging” the particle and thus adding a zero-point energy term which becomes not negligible in this density range. In order to have a more accurate density estimation, we can add the quantum correction to the interaction energy (Eq. 5.2 of Ref. Laikhtman and Rapaport (2009b)) to have:
| (S6) |
Solving this equation numerically for a value of , one gets a density . Plugging back this density into the equation yields and , so indeed the kinetic quantum confinement energy is significant.
Supplementary Note 7 - Spatial coherence measurements
We performed spatial coherence measurements on the same IX system discussed in this work, covering a wide range of excitation powers and temperatures, using a flip-image interferometry Kasprzak et al. (2006), and were unable to detect any spatial coherence of the PL over distances larger than the spatial resolution of the measurement system (), even at excitation powers and temperatures where the anomalous behavior reported in this work was found. We used a Michelson flip-image interferometer, shown in Fig. S11, to measure the spatial coherence of PL emitted from indirect excitons in the trap. The spatial resolution of the optical system as given by for our parameters and .
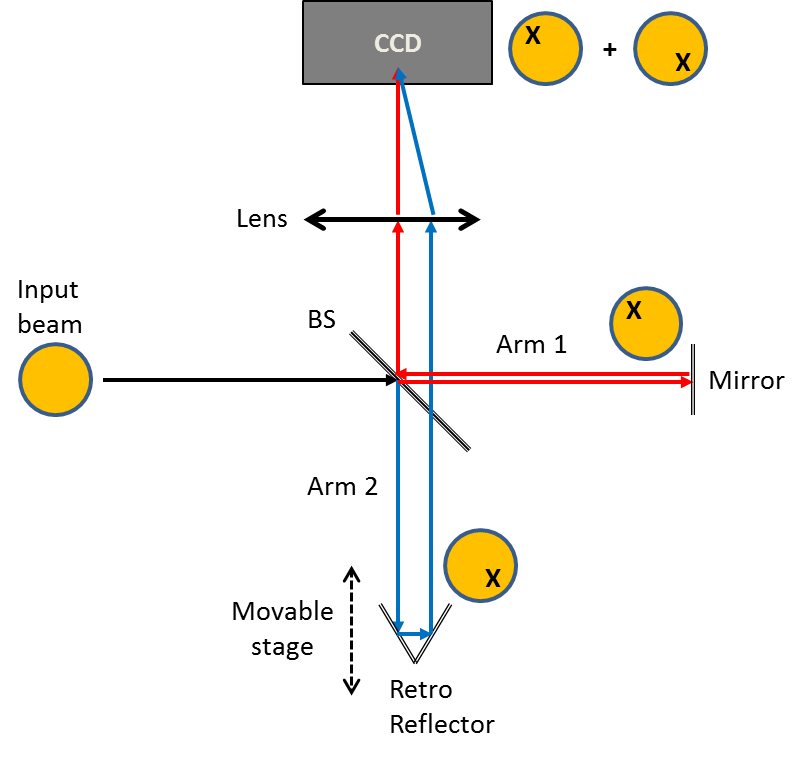
The experimental method is as follows:
-
•
Aligning the two arms of the interferometer to a sub-picosecond time delay using an ultra fast laser source (to ensure coherence time longer than the reciprocal of the PL linewidth).
-
•
Passing the PL from the sample through this configuration.
-
•
Scanning the phase of one arm for few times while recording images, and detecting the oscillation frequency in each pixel due to the movement of the fringes.
-
•
Using Fourier analysis to obtain the amplitude of oscillation in the detected frequency which, after background substraction and proper normalization, represents the degree of coherence.
The above procedure was performed over a range of experimental conditions similar to those shown in the main text. Nevertheless, no extended spatial coherence was detected, as illustrated in Fig. S12.
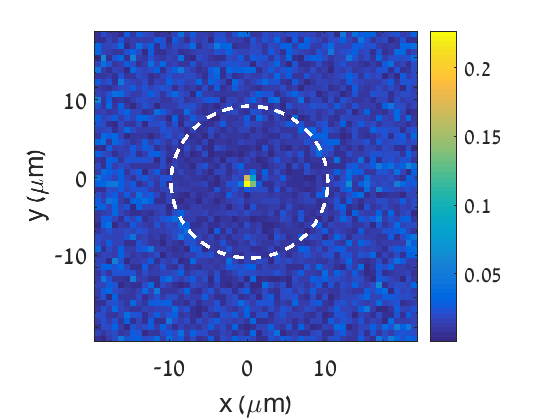
This lack of coherence can be consistent with a formation of a dark liquid, where even if the coherence is not strongly suppressed by the strong interactions, it is mostly manifested in the dark exciton part and therefore no spatial coherence is observed in the bright, emitting part. We note that other experiment on cold IX fluids were also unable to detect any spatial coherence down to very low fluid temperatures Stern et al. (2014); Repp et al. (2014).