Bayesian model averaging in model-based clustering and density estimation
Niamh Russell1,2∗, Thomas Brendan Murphy1,3, Adrian E. Raftery4
1 School of Mathematical Sciences, University College Dublin, Ireland
2Complex and Adaptive Systems Laboratory, UCD, Ireland.
3Insight Research Centre, UCD, Ireland.
4Department of Statistics, University of Washington, Seattle, Washington, USA
∗Email: niamh.russell.1@ucdconnect.ie
Abstract: We propose Bayesian model averaging (BMA) as a method for postprocessing the results of model-based clustering. Given a number of competing models, appropriate model summaries are averaged, using the posterior model probabilities, instead of being taken from a single “best” model. We demonstrate the use of BMA in model-based clustering for a number of datasets. We show that BMA provides a useful summary of the clustering of observations while taking model uncertainty into account. Further, we show that BMA in conjunction with model-based clustering gives a competitive method for density estimation in a multivariate setting. Applying BMA in the model-based context is fast and can give enhanced modeling performance.
Keywords: Bayesian model averaging Cluster analysis Density estimation High-dimensional data Model-based clustering Model uncertainty
1 Introduction
Model-based clustering methods are based on the assumption that the population can be modeled using the finite mixture model (e.g. Banfield and Raftery, 1993; Celeux and Govaert, 1995; Fraley and Raftery, 2002). Within this paradigm, it is assumed that the data come from subpopulations, which correspond to the mixture components, and within each subpopulation the data are modeled using a single parametric component distribution. The most common finite mixture model that is used for model-based clustering is the finite normal mixture, but many alternatives exist (e.g. McLachlan and Peel, 2000; Lee and McLachlan, 2013b).
Model selection is an intrinsic part of model-based clustering. In particular, the number of clusters (component densities), , is unknown and a number of competing choices for component densities may also be under consideration. Each combination of component density and number of clusters can be viewed as a separate model, and a model selection approach can be used to select both at the same time (e.g. Fraley and Raftery, 2002). In most implementations of model-based clustering, the “best” model is chosen by using some criterion and clustering is based on the “best” single model. A number of methods have been proposed for selecting the “best” model including choosing the model with the highest Bayesian Information Criterion (BIC) (Schwarz, 1978) or the highest Integrated Complete Likelihood (ICL) (Biernacki et al., 2000).
The approach of reporting the results of model-based clustering based on a single model ignores the uncertainty that arises from the model selection. Consequently, the uncertainty about quantities of interest may be underestimated. We propose basing the results of model-based clustering on a combination of the results from all candidate models rather than on those from a single model. We propose taking a weighted average of the model summaries, where the weights are approximate posterior model probabilities. Thus we propose using Bayesian Model Averaging (BMA) (Hoeting et al., 1999) within the model-based clustering paradigm.
To obtain valid inference using BMA, the quantity of interest should have the same meaning in each model under consideration. In model-based clustering, the quantities of interest must have the same meaning for all values of and must be invariant to the labeling of the clusters in the finite mixture model. This is because finite mixture models are identifiable only up to permutations of the cluster labels. Here we focus on inference about the clustering consensus matrix. This has the same meaning for all values of and is invariant to the cluster labeling.
We also consider using model-based clustering as a method for multivariate density estimation, following Fraley and Raftery (2002). In this case, the estimated density has the same meaning in all models, so we again use the posterior model probabilities as weights to offer an alternative density estimation procedure to multivariate kernel density estimation (e.g., Scott, 1992; Duong, 2007) or to model-based clustering density estimation methods based on a single model (Fraley and Raftery, 2002).
The paper is organized as follows. In Section 2, we briefly review the model-based clustering paradigm. In Section 3, we outline how the BMA approach can be used to deal with model uncertainty. In Section 4, we describe how we can create a matrix for each model that is invariant to the number and labeling of the clusters. In Section 5, we provide an assessment of clustering performance for BMA in conjunction with model-based clustering. In Section 6, we describe the background for density estimation and introduce a framework for combining BMA and model-based clustering for multivariate density estimation. We illustrate this with a number of simulations. We conclude, in Section 7, with a discussion of related work and suggest future directions.
2 Model-based clustering
Model-based clustering (Banfield and Raftery, 1993; Celeux and Govaert, 1995; Fraley and Raftery, 2002, 2007) is used for clustering data into groups, where the number of groups is typically unknown. Here we focus on model-based clustering based on the finite normal mixture model as described in Fraley and Raftery (2002).
We assume that there are clusters, where each cluster arises with probability . Data within each cluster follow a normal distribution with cluster-specific mean and covariance , so that the data are characterized by a finite mixture of normal distributions. The density of each observation is
where is a multivariate normal density. In practice, the number of clusters, , is usually unknown and needs to be determined as part of the model inference.
The assumption of multivariate normal distributed clusters implies that the clusters are elliptical in shape. Banfield and Raftery (1993) proposed that constraints be placed on the covariance matrices to gain parsimony. These are specified using a modified eigenvalue decomposition of , namely
where is a constant which controls the cluster volume, is an orthogonal matrix of eigenvectors which control the orientation of the clusters, and a diagonal matrix, with entries proportional to the eigenvalues, which control the shape of the cluster.
We can restrict each property of the covariance (volume, shape, orientation) in different ways, resulting in fourteen different possible models (Biernacki et al., 2006). Throughout this paper, we will consider the ten covariance structures implemented in the mclust software (Fraley et al., 2012), as displayed in Figure 1. Each letter in the name of a model corresponds to the constraint placed on the volume, shape and orientation respectively. The constraint can be equal (E), variable (V) or identity (I). For example, in the EEV model, each cluster has the same volume and the same shape but the orientations of the clusters can differ. Other parametrizations of covariance matrices are useful in the context of model-based cluster analysis (e.g. McNicholas and Murphy, 2008, 2010; Biernacki and Lourme, 2014), but we do not consider them further here.

Based on choosing a covariance constraint and the number of groups , we can fit the finite mixture of normal distributions using the EM algorithm (Dempster et al., 1977) to yield the maximum likelihood estimates of the model parameters and an estimate of the posterior probability that each observation belongs to group . The resulting matrix of probabilities, denoted by , has typical entry , which is the estimated conditional posterior probability that observation belongs to group . This is
| (1) |
where are the maximum likelihood estimates of the model parameters. The probability matrix, , can be converted into group labels for the observations and thus the observations can be clustered.
In a clustering problem where several possible values for are considered (e.g. ) and when all ten model types are also considered, we have to choose between about 83 different models. However, we would expect only a small number of these models to be strongly supported by the data. A frequently-used model selection approach is to choose the “best” model using the Bayesian Information Criterion (BIC), (Schwarz, 1978) where the BIC for model is given by
| (2) |
In Equation 2, is the maximized likelihood of the data, is the number of estimated model parameters for model , and is the number of observations. This approach was proposed for clustering by Dasgupta and Raftery (1998), and has been found to perform well (e.g. Steele and Raftery, 2010).
Once the model has been chosen, the cluster membership matrix is based on the parameters for that model alone. The other competing models are then discarded and model uncertainty is ignored.
3 Model Uncertainty and Bayesian model averaging
Basing inferences on a single “best” model ignores uncertainty about what the best model is. This can result in underestimating uncertainty about quantities of interest such as cluster membership or the estimated density.
We address this using Bayesian model averaging (BMA) (Leamer, 1978; Madigan and Raftery, 1994; Hoeting et al., 1999), which proceeds as follows. If denotes the set of all models being considered and if is the quantity of interest, then the posterior distribution of given the data is
| (3) |
This is an average of the posterior distributions under each model weighted by the corresponding posterior model probabilities.
In Equation 3, the posterior probability of model is given by
where
| (4) |
is the marginal likelihood of model , is the vector of parameters of model , is the likelihood for model , is the prior density of the parameter in model and is the prior probability of model . All probabilities are conditional on the set of all models being considered. Madigan and Raftery (1994) argued that averaging over all of the models, as in Equation 3, provides better predictive ability than using any single model.
One difficulty is that the integral in Equation 4 is intractable in most cases and so an approximation to the posterior model probability is required. We use the Bayesian Information Criterion (BIC) to derive approximate posterior model probabilities for Bayesian model averaging for model-based clustering (Dasgupta and Raftery, 1998). If all the models are equally likely a priori, so that , this yields
| (5) |
4 Bayesian model averaging for clustering
An important point when implementing BMA is that the quantity of interest, , must have a consistent definition across all models. Care should be taken when implementing BMA in the clustering setting because the labeling of clusters (components) within a model is arbitrary, so the labeling of clusters under one model may not correspond to the labeling under another model. Also, the number of clusters can vary from model to model.
4.1 Similarity matrix
Strehl and Ghosh (2003) introduced the concept of a binary similarity matrix in the context of clustering. This matrix is and for any pair of observations , the th entry in the matrix is 1 if the th and th observations are in the same cluster in a given model, and 0 if they are not. They used this structure to form what they call pairwise cluster ensembles; Monti et al. (2003) and Kuncheva and Hadjitodorov (2004) also exploited this idea in a clustering context. In these articles, weights were given to various clustering methods and the similarity matrices were combined using these weights. The resulting matrix was described by Kuncheva and Hadjitodorov (2004) as a consensus matrix.
Fern and Brodley (2003) extended the binary similarity matrix to soft-clustering techniques, which return a probability vector for an observation , representing the probability that belongs to each cluster under model . The values are analogous to the values, as defined in Equation 1. Fern and Brodley (2003) used model-based clustering to cluster high-dimensional data by randomly projecting the data into a low-dimensional space and clustering the data in the low-dimensional space. The data are projected multiple times and the consensus matrices are averaged across all projections.
Fern and Brodley (2003) defined as the probability that observations and belong to the same cluster under model . This can be calculated as
because is an estimate of the probability that observation belongs to cluster in model .
We can construct the similarity matrix for each model as follows:
| (6) |
We propose using the matrix of probabilities that any pair of observations belong to the same cluster, when implementing BMA for model-based clustering. This ensures that we are averaging a quantity that has the same meaning across differing number of clusters and is invariant to cluster labeling.
4.2 Properties of the similarity matrix
The matrix for any model will be where is the number of observations. It is invariant to label switching, and its dimension is invariant to the number of clusters in the model. It can therefore be used to combine models with different numbers of clusters. It can be viewed as a similarity matrix between the data points .
The element of the matrix represents the probability that and belong to the same cluster. We can also define a quantity as the probability that they are not in the same cluster. So, , where can be thought of as a dissimilarity matrix. Therefore, can be used with any clustering algorithm which operates directly on a dissimilarity matrix.
We define as the minimum probability that two observations and in a set belong together, which we can think of as the minimum probability that two elements in belong to the same cluster. If we define as , we obtain the following result:
Thus the maximum probability that two elements of do not appear in the same cluster is . It follows that can be used in hierarchical clustering with complete linkage (Sokal and Sneath, 1963) and the results will have an intuitive interpretation. In complete linkage, the dissimilarity between two groups and is the largest dissimilarity between opposite groups, that is, the maximum distance between an element of and an element of , namely
Hierarchical complete-linkage clustering will then merge the groups with the smallest . This continues until all the groups are merged.
The results can be shown on a dendrogram which can be cut at any level. There is an intuitive interpretation of the level of cut. If we cut the dendrogram at a particular probability level, any observations clustered together at that level have a probability of at least that value of all being in the same cluster.
We illustrate this with a toy example. Suppose we have six data points and two equally likely clustering results. The first clustering attempt puts in one cluster and in the other, while the second attempt puts in one cluster and in the other. For simplicity we will use hard clustering where the probability of cluster membership is either 0 or 1 for each observation. If both models have equal probability, the matrix will be
If we proceed to implement hierarchical clustering on the corresponding dissimilarity matrix, with complete linkage, we get the dendrogram shown in Figure 2.

Averaging the two models and cutting the resulting dendogram at any probability level above 0.5 leads to a four-cluster solution. This makes sense. Both clusterings agree that and belong in the same cluster as do and . However, they disagree on and . This dendrogram gives a probabilistic representation of this situation. If we cut the dendogram in Figure 2 at 0.2, we see that , and have at least a probability 0.2 of being in the same group, but cutting at 0.8 shows that and have at least a probability of 0.8 of being in the same group.
4.3 Summary of method
5 Results
The proposed methodology is demonstrated using two well known data sets: Fisher’s iris data (Fisher, 1936) and Forina’s wine data (Forina et al., 1986).
We clustered the datasets using the mclust software (Version 4.4) (Fraley et al., 2012) and R (R Core Team, 2014). Where appropriate we have ordered the observations using the gclus R package (Version 1.3.1) (Hurley, 2012) and the seriation R package (Version 1.0-14) (Hahsler et al., 2014).
When using the default settings in mclust, a total of 83 candidate models were fitted. These include three one-cluster models () and the ten possible covariance structures (Figure 1) for each number of clusters . One can of course fit a larger or smaller set of models if desired.
5.1 Clustering Fisher’s iris data
The iris data (Fisher, 1936) gives the measurements in centimetres of the variables sepal length and width and petal length and width for 150 observations with 50 of each of three species of iris: versicolor, setosa and virginica. Table 1 shows the model-based clustering models with the highest BIC values for the iris data. These results show that the VEV model with two clusters has the highest BIC, but that there is considerable uncertainty about whether this is the best model. In a single model scenario, the VEV model with two clusters would be selected and clustering would be based solely on this model.
| Model | No of | BIC | Posterior |
|---|---|---|---|
| Type | Clusters | Model Probability | |
| VEV | 2 | -561.73 | 0.601 |
| VEV | 3 | -562.55 | 0.398 |
| VVV | 2 | -574.028 | 0.001 |
| Others |
However, it can be seen from Table 1, that the BIC value for the three-cluster VEV solution is similar to that for the selected model. The posterior model probabilities in the table are estimated using Equation 5 and we see that the posterior probability for this second best model is almost 40%.
In order to visualize the observations that are likely to be in the same cluster, we use a heatmap to represent the similarity matrix. The ordering of the observations in the heatmap is important. Here we present the data in species order, which yields an intuitive heatmap, as shown in Figure 3. However, in many applications this will not be the case, but the structure may be easier to see if the data are ordered using some seriation method.
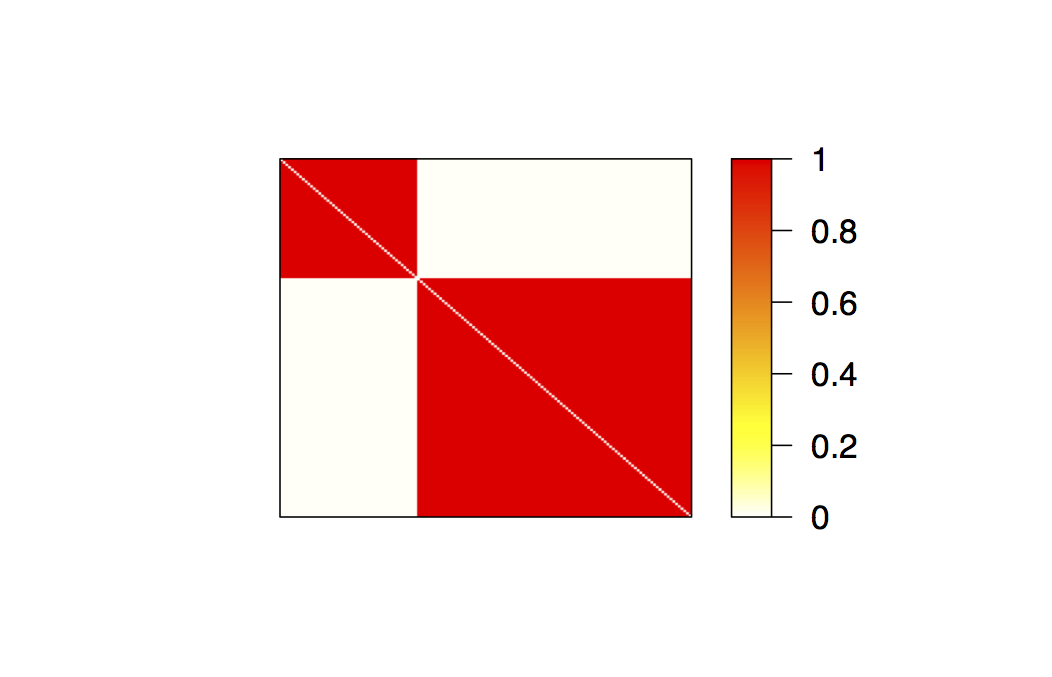
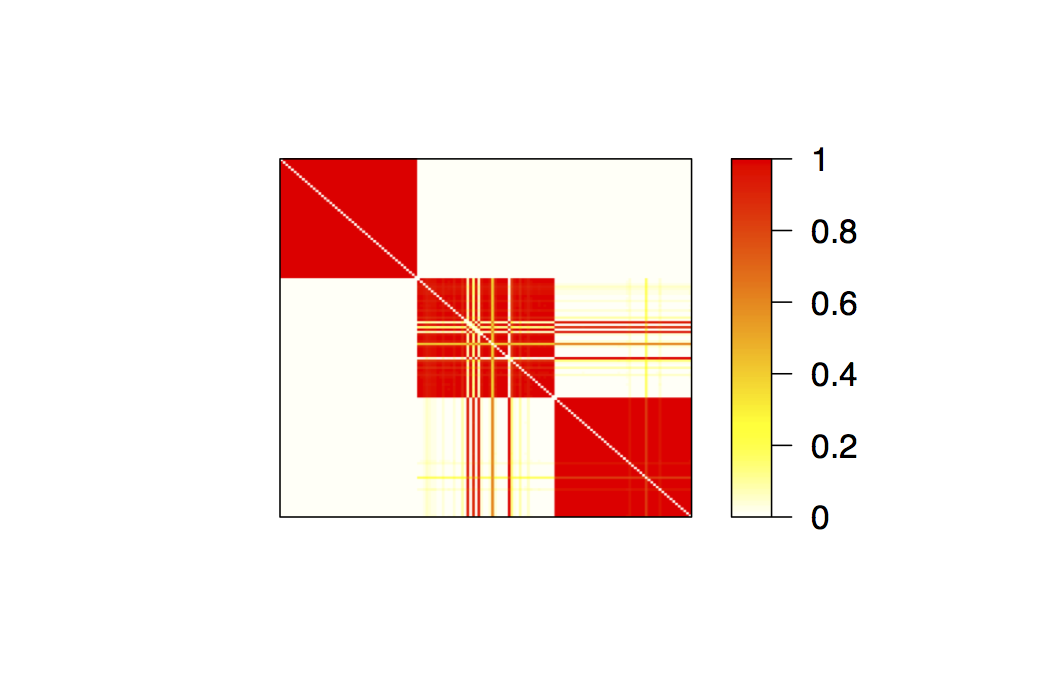
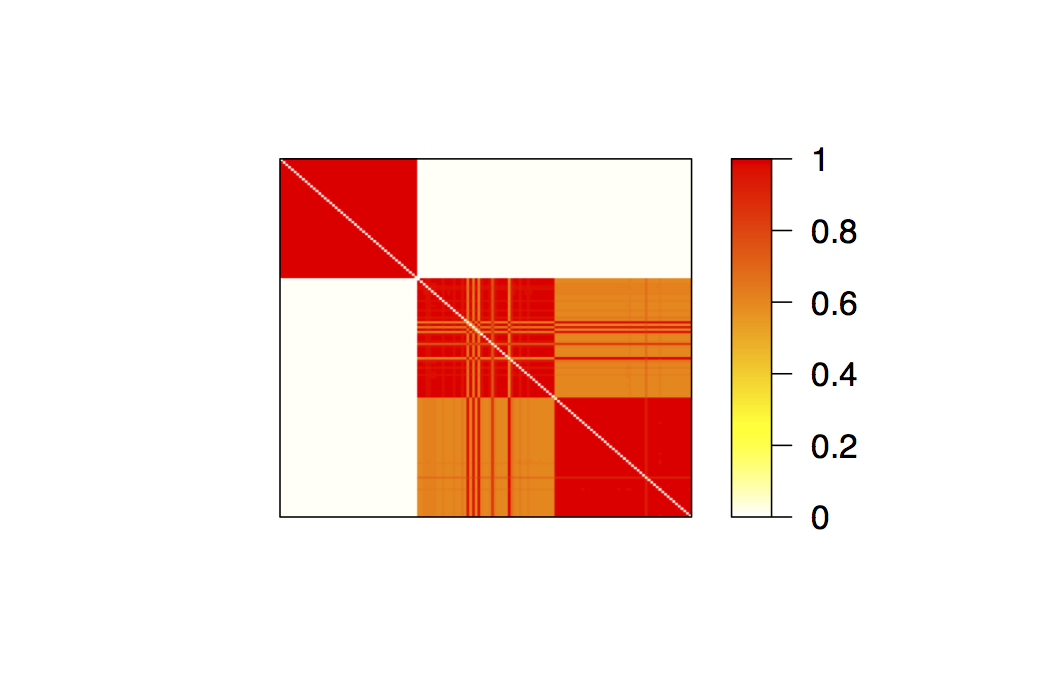
Figure 3 shows the heatmap for the similarity matrix for the two-cluster VEV model, while Figure 3 shows the three-cluster model; these are the two models with the highest BIC values. The red sections of the figure represent clusters of pairs that have a high probability of being in the same cluster, which the white areas show pairs that are unlikely to be in the same cluster. The clusters are isolated along the diagonal of the heatmap.
The model that would be selected by BIC separates the setosa species very well from the other two species but it merges the two other species into one cluster. It can be seen also that the probabilities assigned to the co-clustering pairs are very high. The fact that there is large uncertainty associated with the two-cluster solution is not clear in the single model results.
The second most likely model shows separation between the three clusters with high probability, as we see in Figure 3. Thus the argument can be made that this model should contribute to the final clustering result.
Figure 3 shows the heatmap for the similarity matrix produced from the Bayesian model averaging process. The method separates the large cluster into two clusters which approximate the known species groups quite well, but also reflect the uncertainty about whether there are really three species.
We can also present these results using dendrograms, as detailed in Section 4.2, and these are shown in Figure 4. The dendrograms show that the single model results cluster the observations into two clear groups, whereas the BMA results show the possibility of both a two-cluster and/or three-cluster solution, depending on the cutoff used.


5.2 Clustering Italian wines data
We now apply the methodology to a well-known dataset consisting of 27 chemical measurements on each of 178 wine samples belonging to three cultivars of wine (Barolo, Grignolino and Barbera) produced in the Piedmont region of Italy (Forina et al., 1986). Table 2 shows the number of samples collected in each vintage year for the three cultivars.
| Samples per year | ||||||||||||
| Cat.index | Cat.name | ’70 | ’71 | ’72 | ’73 | ’74 | ’75 | ’76 | ’77 | ’78 | ’79 | Total |
| 1 | Barolo | 19 | 20 | 20 | 59 | |||||||
| 2 | Grignolino | 9 | 9 | 7 | 9 | 16 | 9 | 12 | 71 | |||
| 3 | Barbera | 9 | 5 | 29 | 5 | 48 | ||||||
Table 3 shows the candidate models with the highest BIC and hence the highest approximate posterior probability; all other models had negligible posterior probability. Although the data consist of samples from three different cultivars, a seven-cluster model was preferred to any of the three-cluster models. The seven clusters successfully separate the three cultivars, and also partly reflect the different vintage years shown in Table 2 (McNicholas and Murphy, 2008).
| Model | No of | BIC | Posterior |
|---|---|---|---|
| Type | Clusters | Model Probability | |
| VEI | 7 | -23951.91 | 0.600 |
| EVI | 3 | -23953.87 | 0.225 |
| VVI | 3 | -23954.37 | 0.175 |
| others |
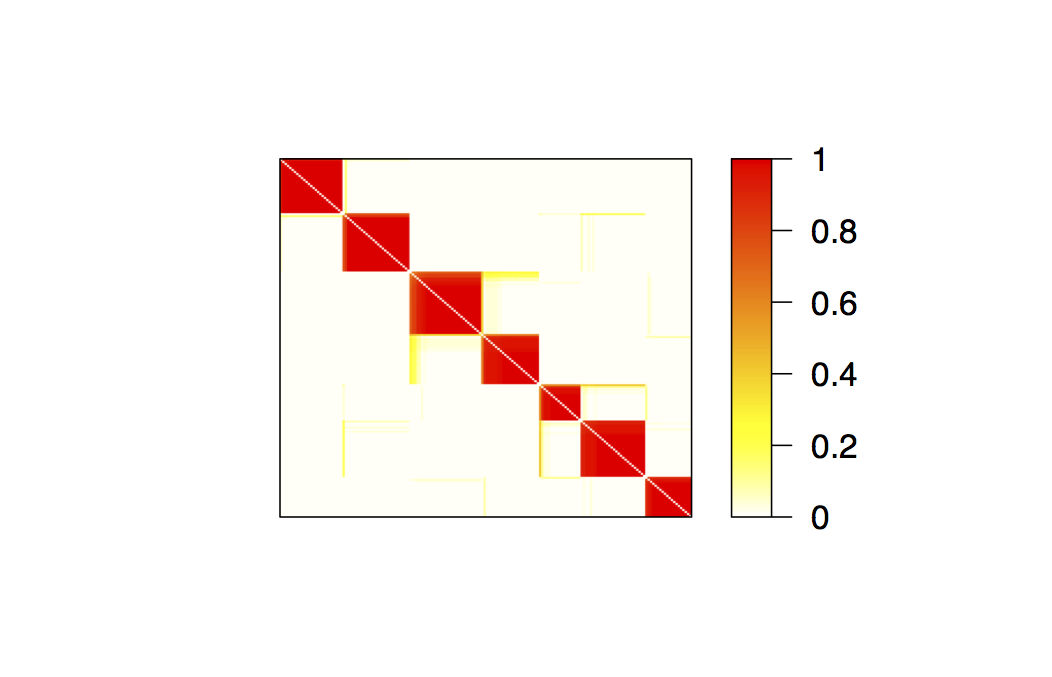
The heatmap of the similarity matrix of the optimal model is presented in Figure 5. Here the observations are shown in order of vintage year within cultivar. It appears that the clustering results partly reflect the vintage years as well as the cultivars.
We seriated the data to reorder the observations, using the order of the leaf nodes in a dendrogram produced by hierarchical clustering with complete linkage. In hierarchical displays, a decision is needed at each merge to specify which subtree should go to the left and which to the right (Hurley, 2012). We used the order suggested in Gruvaeus and Wainer (1972), which ensures that objects at the boundaries of each class were located next to objects outside the class which they most resembled (Gordon, 1987). At a merge of clusters and , the new cluster is one of , , , , where denotes in reverse order. The new cluster is chosen to minimize the distance between the object in placed adjacent to an object from . The reordered similarity matrix, shown in Figure 5, has seven clear clusters, with uncertainty about the group membership of some of the observations.
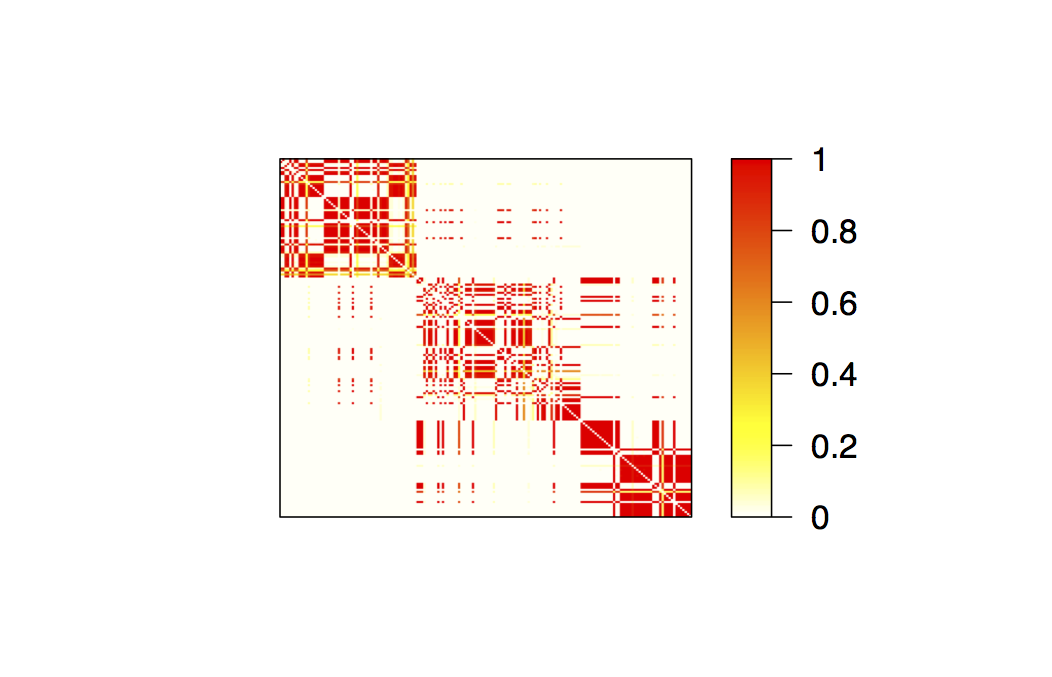
From Table 3 we see that the combined posterior probability of the two three-cluster models (EVI and VVI) is high, at just under 40%. We use BMA to average the similarity matrices across the candidate models and show the results in Figure 6. Figure 6 shows the clustering in the originally presented order, after BMA has been carried out. It gives a clearer picture of the cultivar clustering, although there is some uncertainty, shown by the yellow colors. Figure 6 shows the seriated version, where the smaller clusters group naturally into three larger clusters, but with one small cluster that could belong to either of two cultivars.
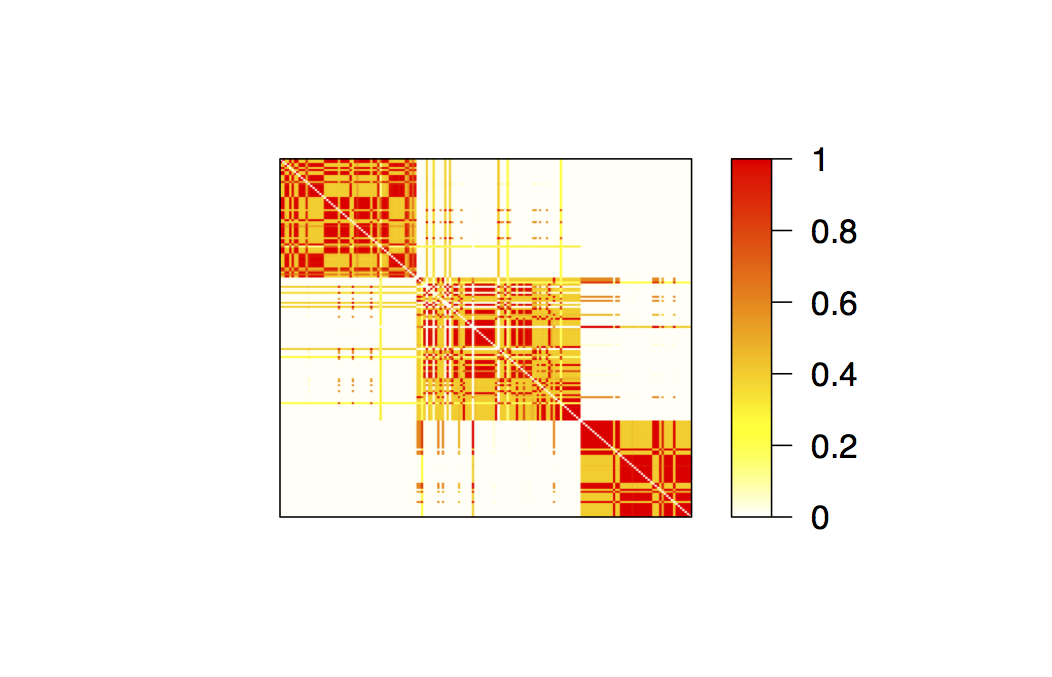
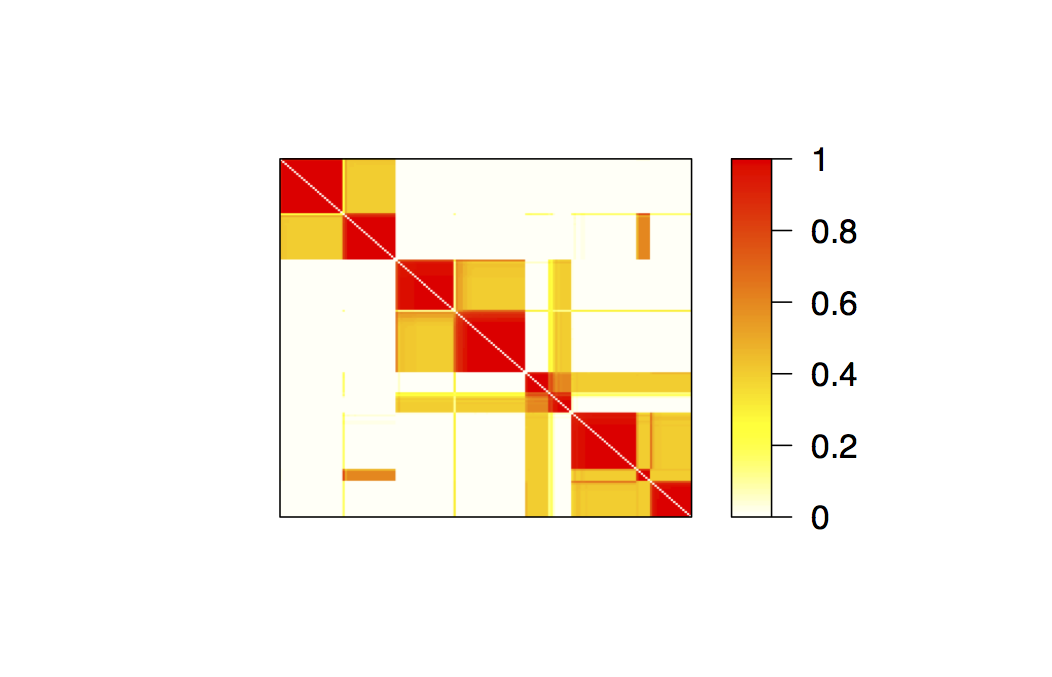
Figure 7 shows the dendrogram of the complete-linkage clustering of the consensus matrices according to (a) the best model and (b) BMA. The dendogram for the best model (VEI with seven clusters) reproduces the model’s seven clusters quite clearly if the dendogram is cut at any level above about 0.5, as expected. The BMA dendogram reflects more uncertainty, as one would expect. It divides the data into four groups if cut at 0.1.
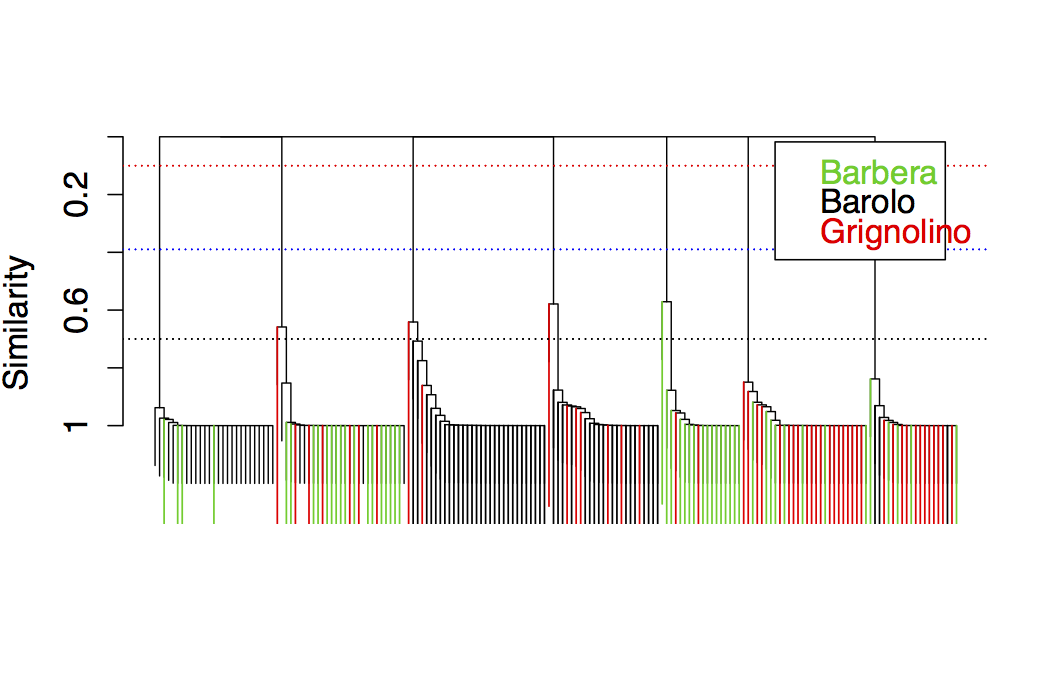
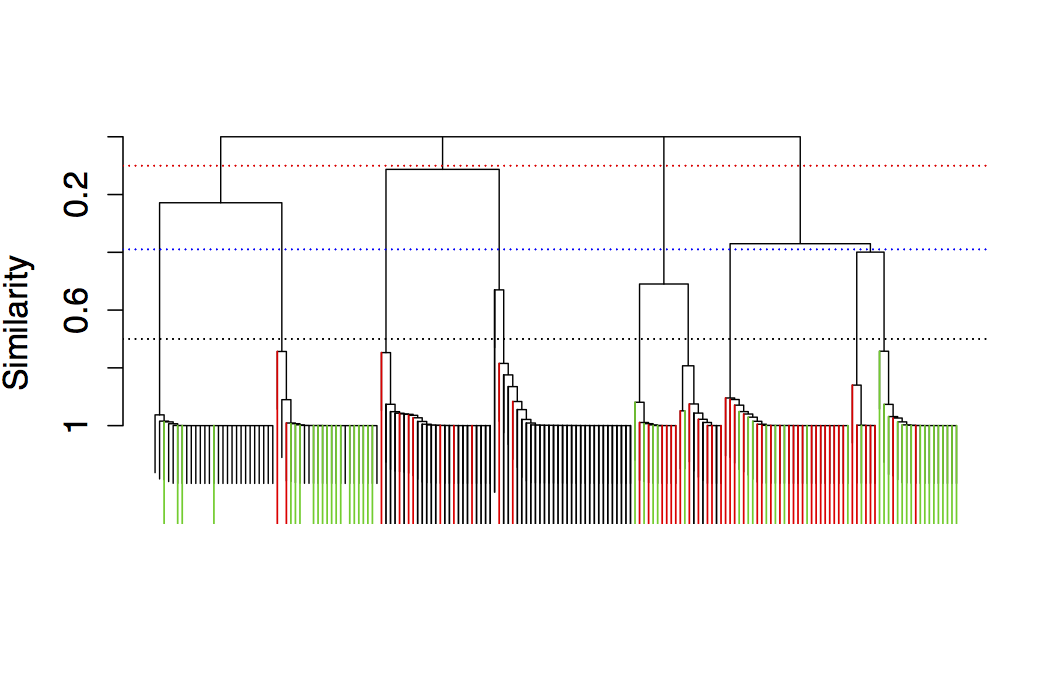
The two three-cluster solutions give similar clustering results. In the seven-cluster solution, three of the clusters are for the Grignolino observations, and two each for the Barbera and Barolo observations. The Barolo and Barbera clusters break down by vintage year, whereas for the Grignolino observations the clusters correspond less clearly to vintage years.
6 Bayesian model averaging for density estimation.
The fitted mixture model produced by model-based clustering provides an overall density estimate for the data generation process. Ferguson (1983) showed that finite mixtures of normal distributions can approximate any distribution on the real line to within any given accuracy. Thus the density estimate produced by model-based clustering can be used as a density estimation method. The performance of densities fitted in this way was assessed by Roeder and Wasserman (1997) for the univariate case and by Fraley and Raftery (2002) for the bivariate case. Both of these studies showed model-based clustering to be competitive with state of the art kernel density estimation methods.
We propose using Bayesian model averaging of the density estimates for each model using the posterior model probabilities from Equation 5. So, given model-based density estimates , for , we have
We compare the BMA results with kernel density estimation methods. Kernel density estimation has long been used for density estimation and visualization of univariate data (Rosenblatt, 1956; Parzen, 1962; Jones et al., 1996). The kernel density estimate of a univariate density based on a random sample of size is
where for a kernel function , assumed to be a symmetric probability density and a bandwidth (the smoothing parameter). We also compare with the single-model estimate , where
where is the model with the highest value of BIC. (SM stands for “single model”.)
Wand and Jones (1994) described the extension of the method to the bivariate case. The multivariate kernel density estimate is
where is now a positive definite matrix and is a -variate spherically symmetric density function; a common simplification is to use a diagonal (e.g., Wand and Jones, 1994, Chapter 4.2).
The performance of density estimation procedures can be compared using mean integrated squared error (MISE) or expected Kullback-Leibler divergence (KL), defined as follows:
| MISE | (7) | ||||
| MKL | (8) |
where the expected value is taken with respect to the resulting density estimate, , computed from a random sample, , drawn from . For both criteria, smaller is better. MISE (Equation 7) is the most commonly used measure of performance, while Kullback-Leibler divergence (Equation 8) provides an alternative which considers the differences in densities on a logarithmic scale; this places more emphasis on differences in regions of low density.
The asymptotic performance of kernel density estimation under the MISE criterion was described by Silverman (1986) and Scott (1992) and the form of the optimal bandwidth for the kernel was derived. Hall (1987) studied the asymptotic performance of kernel density estimation under Kullback-Leibler divergence and showed that the optimal bandwidth in this case leads to a smoother density estimate than under MISE. The optimal bandwidths differ because Kullback-Leibler puts a larger penalty on regions where a density estimate has low density but the true density has high density. Wand and Jones (1993) and Duong and Hazelton (2003) investigated the use of unconstrained parametrisations of the matrix as opposed to diagonal ones on simulated target densities, and concluded that this can improve efficiency.
We use the extended version of multivariate kernel density estimation as described in Duong and Hazelton (2003) and Duong (2007) as a benchmark for comparison with the model-based clustering density estimates. This approach uses a two-stage estimation procedure, where a pilot density estimate is used to get an improved estimate of the optimal bandwidth compared to the standard plug-in estimates (e.g. Silverman, 1986, Section 3.4.2). Duong (2007) used kernels with non-diagonal matrices.
6.1 Density estimation results
6.1.1 Simulation study for bivariate density estimation
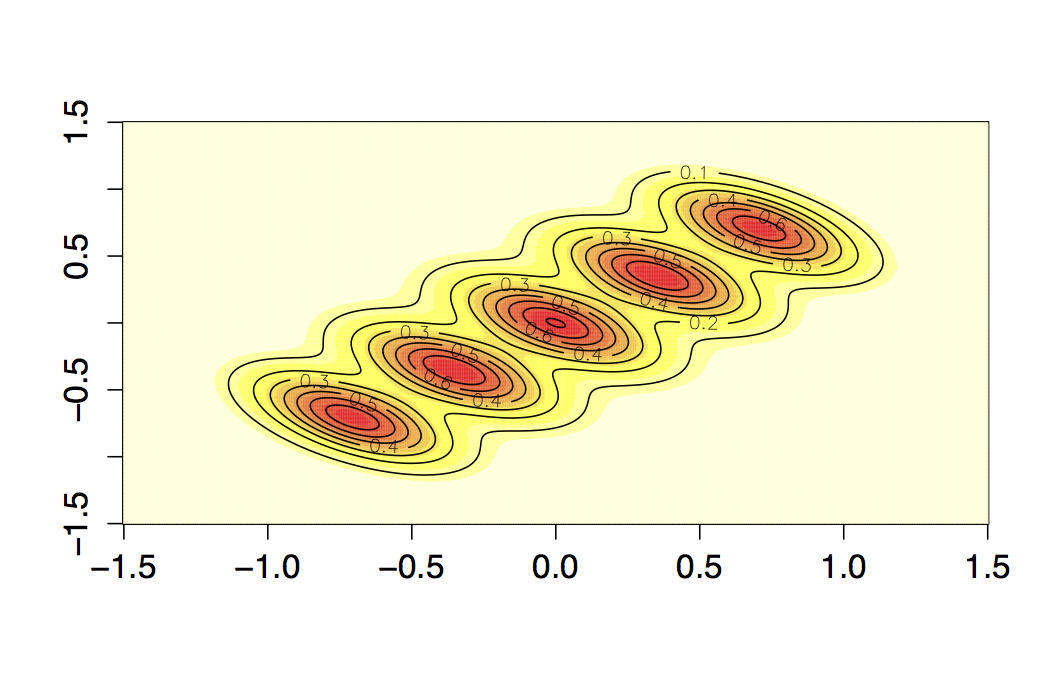
Fraley and Raftery (2002) defined bivariate analogs of the first ten of the univariate datasets defined in Marron and Wand (1992) to compare the performance of the fitted model-based clustering density with multivariate kernel density estimation. Contour plots of the densities are shown in Appendix A as well as the parameter settings for the actual densities we used.
We produced 250 simulations of 250 observations from each of the same ten distributions and compared density estimation using model-based clustering with the Bayesian model averaged result in terms of the mean integrated squared error and the Kullback-Leibler distance. We compared the performance of the model-based clustering approaches to the extended kernel density estimaton method described in Duong and Hazelton (2003) as implemented in the ks R package (Duong, 2007, 2014).
The results of the simulation study are shown in Table 4 where the numbers in the MISE columns are the MISE for kernel density estimation and for the single model respectively divided by the MISE for the BMA method. Similarly, for the Kullback-Leibler column, we divide the Kullback-Leibler distance for kernel density estimation and for the single model by the Kullback-Leibler distance for the BMA method.
| Model | KS/BMA | SM/BMA | ||
|---|---|---|---|---|
| MISE | KL | MISE | KL | |
| Single Gaussian | 6.19 | 4.86 | 1.00 | 1.00 |
| Skewed unimodal | 1.06 | 1.53 | 1.03 | 1.03 |
| Strongly skewed | 2.75 | 11.4 | 1.04 | 1.05 |
| Kurtotic unimodal | 0.45 | 11.7 | 1.00 | 1.00 |
| Outlier | 1.81 | 1.68 | 1.00 | 1.00 |
| Bimodal | 1.12 | 1.46 | 1.08 | 1.08 |
| Separated bimodal | 3.10 | 3.74 | 1.01 | 1.01 |
| Asymmetric bimodal | 0.55 | 2.63 | 1.00 | 1.00 |
| Trimodal | 0.98 | 0.99 | 1.01 | 1.03 |
| Claw (Bart Simpson) | 0.91 | 1.37 | 1.09 | 1.19 |
Density estimation using model-based clustering with BMA compares very favorably with kernel density estimation according to the KL criterion, while it compares favorably in the majority of cases by the MISE criterion. It also compares favorably with density estimation using model-based clustering with a single model in all cases and by both criteria, although the gains are more modest.
6.1.2 Simulation study for higher dimensional density estimation
We also investigated density estimation for higher dimensional data. We first added dimensions consisting of observations from the standard normal distribution to the existing distributions used in Section 6.1.1. The first three rows in Table 5 refer to bivariate distributions with one extra such dimension added, while the next three rows refer to the same distributions with four extra standard normal dimensions. We also implemented three- and six-dimensional versions of the bimodal distribution. We allowed for variable separation of the modes as in the bimodal case, and the results are in rows seven to twelve of Table 5. The settings used for all these simulations are in Appendix A.2.
| Model | KS/BMA | SM/BMA | ||
|---|---|---|---|---|
| MISE | KL | MISE | KL | |
| Strongly skewed 3D | 2.46 | 7.47 | 1.03 | 1.04 |
| Separated bimodal 3D | 5.08 | 6.39 | 1.00 | 1.02 |
| Asymmetric bimodal 3D | 0.75 | 3.53 | 1.01 | 1.00 |
| Strongly skewed 6D | 2.66 | 4.95 | 1.03 | 1.04 |
| Separated bimodal 6D | 8.18 | 11.0 | 1.03 | 1.03 |
| Asymmetric bimodal 6D | 1.41 | 4.31 | 1.06 | 1.04 |
| Bimodal 3D (sep of 1.5) | 6.51 | 6.45 | 1.00 | 1.03 |
| Bimodal 3D (sep of 3) | 1.94 | 3.13 | 1.03 | 1.05 |
| Bimodal 3D (sep of 5) | 5.34 | 6.30 | 1.00 | 1.00 |
| Bimodal 6D (sep of 1.5) | 12.3 | 10.56 | 1.06 | 1.04 |
| Bimodal 6D (sep of 3) | 10.8 | 13.61 | 1.03 | 1.04 |
| Bimodal 6D (sep of 5) | 8.41 | 11.9 | 1.11 | 1.08 |
Model-based clustering with BMA strongly outperformed kernel density estimation in all cases except one for both three-dimensional and six-dimensional data, according to both criteria, MISE and KL. Model-based clustering with BMA also uniformly outperformed single-model model-based clustering, although the gain was more modest.
Density estimation using model-based clustering can be carried out for higher dimensions, and performs well. However, we limited ourselves to six dimensions because the ks R package provides results for at most six dimensions. We conjecture that model-based clustering’s gain in performance would be even greater for higher dimensions.
6.1.3 Lansing maples
We now consider the Lansing trees data set (Gerrard, 1969) where we are interested in the density of the maple trees in a forest. The models with the highest BIC are shown in Table 6 and we can see that three models have non-negligible posterior probability.
| Model | No of | BIC | Posterior |
|---|---|---|---|
| Type | Clusters | Model Probability | |
| VII | 7 | 154.339 | 0.49462 |
| VEI | 7 | 153.569 | 0.33655 |
| VII | 6 | 152.081 | 0.15998 |
| others |
A six-cluster solution has approximately 16% posterior model probability with two seven-cluster solutions having approximately 83% between them. There are very small probabilities associated with five and eight cluster solutions respectively. However, the best model that would be chosen according to BIC is VII with seven clusters.
We can compare graphically the contour plots for the models with the highest BIC and the plot for the density estmation after BIC (Figure 8). Figures 8(a), 8(b) and 8(c) show the three most likely models according to BIC, while Figure 8(d) shows the BMA density estimate. We can see that the high density region at approximately in Figures 8(a) and 8(a) does not appear in Figure 8(c). Further, the density of this region is smaller in Figure 8(d). Thus the BMA density estimate takes into account the possibility that the model density plotted in Figure 8(c) is appropriate.
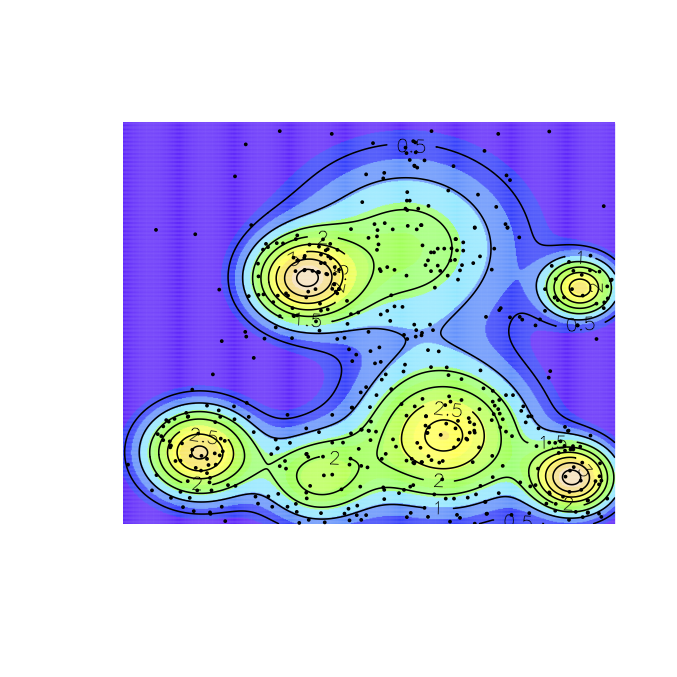
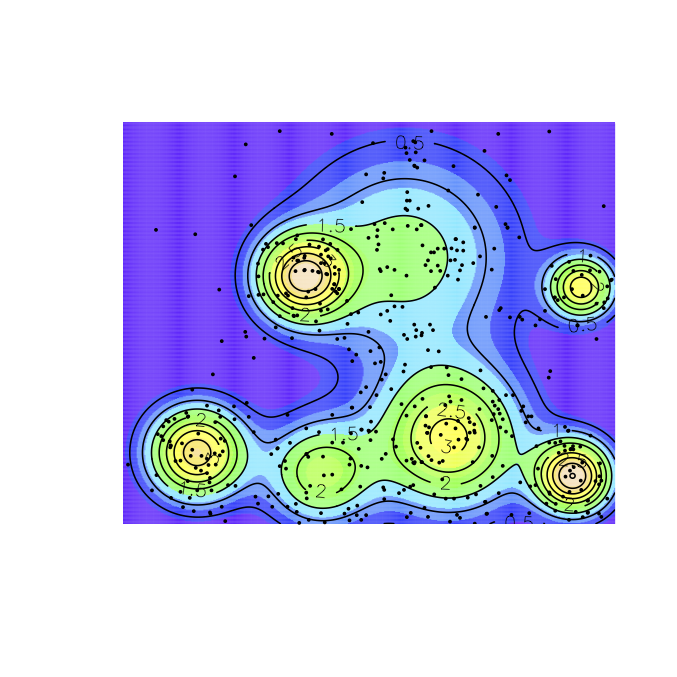
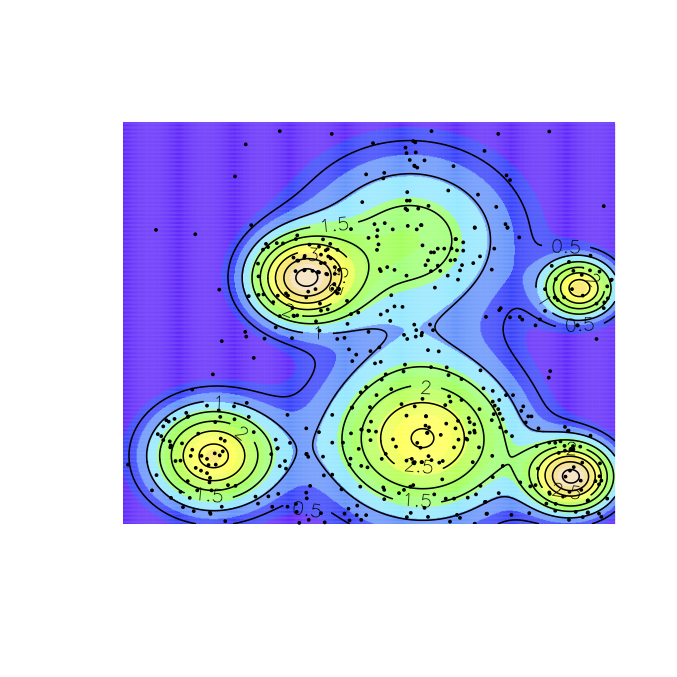
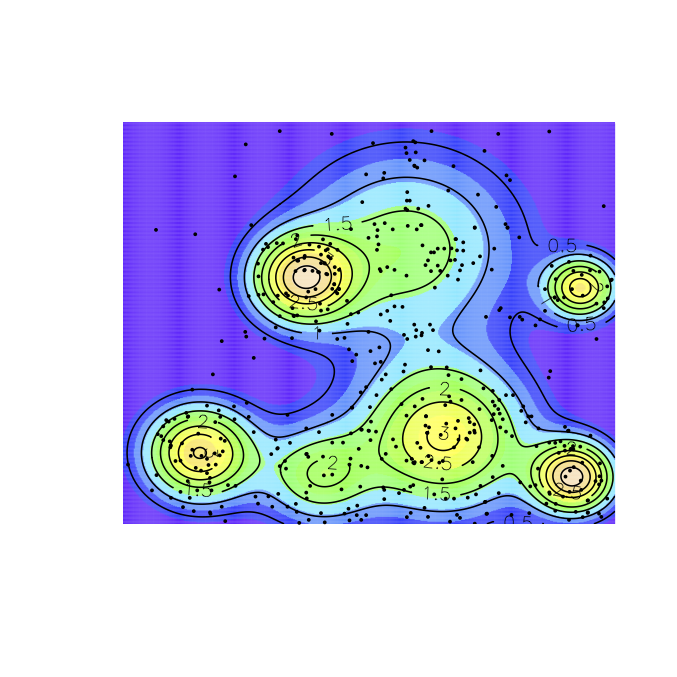
Figure 9 shows the differences between the density estimates produced by BMA and the density estimate for the VII model with seven clusters. Again, the difference in probability density around the cluster at is evident. There are some other small areas of smoothing denoted in blue. The brown peaks are higher densities to compensate for the lower density at .

7 Discussion
We have implemented Bayesian model averaging for model-based clustering and density estimation. The results show that the BMA assesses the model uncertainty better than the single best model approach.
We have proposed similarity matrices as a way of representing ensembles of clustering solutions. They provide an intuitive way of visualising clustering solutions and are consistent across models with different numbers of clusters. They are also invariant to label switching between models. Similar ideas were put forward by Strehl and Ghosh (2003) and Monti et al. (2003) using binary classification matrices, while Fern and Brodley (2003) extended the idea to soft classifications when proposing their random projection clustering method. All of these papers use different ways of combining the matrices than BMA.
Kuncheva and Hadjitodorov (2004) suggested that “cutting” the matrix at a certain threshold is equivalent to running the single link algorithm and cutting the dendrogram at that level. We argue that using complete linkage gives a more intuitive interpretation.
We have shown how to apply Bayesian model averaging to clustering solutions using the similarity matrix. This provides a statistical postprocessing method which takes account of model uncertainty. When used on datasets with well-documented structure or a known ground truth, results achieved with Bayesian model averaging are consistent with the ground truth. We have shown that carrying out BMA on datasets that have no ground truth might give additional information than using model-based clustering alone and at little computational cost.
The model-based density estimation method described in Fraley and Raftery (2002) gives better results in many cases than those given by well-known kernel density estimation methods for the simulated datasets analysed here. With the addition of the Bayesian model averaging described in this paper, even more improvement can be seen, and this becomes more pronounced in higher dimensions.
In the case where the derivative of the density estimate is of interest (e.g. Jones (1994) and others), a separate bandwidth is needed for each order derivative (Chacón and Duong, 2013). An advantage of the finite mixture density estimate and the BMA mixture density estimate is that a single estimate is produced which can be used for estimating derivatives of any order.
The proposed methodology could also be used when more than one family of component distributions is under consideration. For example, the normal mixture models with eigendecomposed covariances used in mclust (Fraley and Raftery, 2002), the normal mixtures with factor analytic covariance structure used in pgmm (McNicholas and Murphy, 2008), the multivariate mixtures used in EMMIX (McLachlan and Peel, 1999) and the skew- mixtures used in EMMIXuskew (Lee and McLachlan, 2013a) could be combined using the BMA procedure.
One previous approach to Bayesian model averaging within model-based clustering (Wei and McNicholas, 2014) considers noninvariance of model-based clustering results to cluster labeling by matching the clusterings for competing models using an cluster agreement criterion. Further, they combine the clusters in the larger model so that the models being combined have the same number of clusters, . We have proposed a very different approach for Bayesian model averaging for model-based clustering by choosing a quantity of interest, , that is invariant to cluster labeling and that has a common meaning for all values of .
Overall, our results suggest that Bayesian model averaging is a useful postprocessing tool for model-based clustering and density estimation. It often helps and seldom disimproves the results, so it could be used routinely as part of model-based clustering.
Acknowledgements
This research is supported by the Programme for Research In Third Level Institutions (PRTLI) Cycle 5 and co-funded by the European Regional Development Fund, the Science Foundation Ireland Research Walton Fellowship (11/W.1/I2079), the Science Foundation Ireland funded Insight Research Center (SFI/12/RC/2289), and NIH grants R01-HD054511, R01-HD070936 and U54-HL127624.
References
- Banfield and Raftery (1993) Banfield, J. D. and Raftery, A. E. (1993). Model-based Gaussian and non-Gaussian clustering. Biometrics, 49 803–821.
- Biernacki et al. (2000) Biernacki, C., Celeux, G. and Govaert, G. (2000). Assessing a mixture model for clustering with the integrated completed likelihood. IEEE Transactions on Pattern Analysis & Machine Intelligence, 22 719–725.
- Biernacki et al. (2006) Biernacki, C., Celeux, G., Govaert, G. and Langrognet, F. (2006). Model-based cluster and discriminant analysis with the MIXMOD software. Computational Statistics & Data Analysis, 51 587–600.
- Biernacki and Lourme (2014) Biernacki, C. and Lourme, A. (2014). Stable and visualizable Gaussian parsimonious clustering models. Statistics and Computing, 24 953–969.
- Bowman and Azzalini (1997) Bowman, A. and Azzalini, A. (1997). Applied smoothing techniques for data analysis. Oxford University Press, Oxford, UK.
- Celeux and Govaert (1995) Celeux, G. and Govaert, G. (1995). Gaussian parsimonious clustering models. Pattern Recognition, 28 781–793.
- Chacón and Duong (2013) Chacón, J. E. and Duong, T. (2013). Data-driven density derivative estimation, with applications to nonparametric clustering and bump hunting. Electronic Journal of Statistics, 7 499–532.
- Dasgupta and Raftery (1998) Dasgupta, A. and Raftery, A. E. (1998). Detecting features in spatial point processes with clutter via model-based clustering. Journal of the American Statistical Association, 93 294–302.
- Dempster et al. (1977) Dempster, A. P., Laird, N. M. and Rubin, D. B. (1977). Maximum likelihood from incomplete data via the EM algorithm. Journal of the Royal Statistical Society. Series B. Methodological, 39 1–38. With Discussion.
- Duong (2007) Duong, T. (2007). ks: Kernel density estimation and kernel discriminant analysis for multivariate data in R. Journal of Statistical Software, 21 1–16.
- Duong (2014) Duong, T. (2014). ks: Kernel smoothing. R package version 1.9.3, URL http://CRAN.R-project.org/package=ks.
- Duong and Hazelton (2003) Duong, T. and Hazelton, M. (2003). Plug-in bandwidth matrices for bivariate kernel density estimation. Journal of Nonparametric Statistics, 15 17–30.
- Ferguson (1983) Ferguson, T. S. (1983). Bayesian density estimation by mixtures of normal distributions. In Recent advances in statistics (M. H. Rizvi, J. S. Rustagi and D. Siegmund, eds.). Academic Press, New York, 287–302.
- Fern and Brodley (2003) Fern, X. Z. and Brodley, C. E. (2003). Random projection for high dimensional data clustering: A cluster ensemble approach. In Proceedings of the Twentieth International Conference on Machine Learning (ICML 2003) (T. Fawcett and N. Mishra, eds.). AAAI Press, 186–193.
- Fisher (1936) Fisher, R. A. (1936). The use of multiple measurements in taxonomic problems. Annals of Eugenics, 7 179–188.
- Forina et al. (1986) Forina, M., Armanino, C., Castino, M. and Ubigli, M. (1986). Multivariate data analysis as a discriminating method of the origin of wines. Vitis, 25 189–214.
- Fraley and Raftery (2007) Fraley, C. and Raftery, A. (2007). Model-based methods of classification: Using the mclust software in chemometrics. Journal of Statistical Software, 18 1–13.
- Fraley and Raftery (2002) Fraley, C. and Raftery, A. E. (2002). Model-based clustering, discriminant analysis, and density estimation. Journal of the American Statistical Association, 97 611–631.
- Fraley et al. (2012) Fraley, C., Raftery, A. E., Murphy, T. B. and Scrucca, L. (2012). mclust version 4 for R: Normal mixture modeling for model-based clustering, classification, and density estimation. Tech. Rep. 597, Department of Statistics, University of Washington. URL http://CRAN.R-project.org/package=mclust.
- Gerrard (1969) Gerrard, D. J. (1969). Competition quotient: a new measure of the competition affecting individual forest trees, vol. 20. Agricultural Experiment Station, Michigan State University.
- Gordon (1987) Gordon, A. D. (1987). A review of hierarchical classification. Journal of the Royal Statistical Society. Series A (General), 150 pp. 119–137.
- Gruvaeus and Wainer (1972) Gruvaeus, G. and Wainer, H. (1972). Two additions to hierarchical cluster analysis. British Journal of Mathematical and Statistical Psychology, 25 200–206.
- Hahsler et al. (2014) Hahsler, M., Buchta, C. and Hornik, K. (2014). Infrastructure for seriation. R package version 1.0-13., URL http://CRAN.R-project.org/.
- Hall (1987) Hall, P. (1987). On Kullback-Leibler loss and density estimation. Annals of Statistics, 15 1491–1519.
- Hoeting et al. (1999) Hoeting, J. A., Madigan, D., Raftery, A. E. and Volinsky, C. T. (1999). Bayesian model averaging: A tutorial. Statistical Science, 14 382–417.
- Hurley (2012) Hurley, C. (2012). gclus: Clustering graphics, R package version 1.3. 1. URL http://CRAN.R-project.org/package=gclus.
- Jones (1994) Jones, M. (1994). On kernel density derivative estimation. Communications in Statistics-Theory and Methods, 23 2133–2139.
- Jones et al. (1996) Jones, M. C., Marron, J. S. and Sheather, S. J. (1996). A brief survey of bandwidth selection for density estimation. Journal of the American Statistical Association, 91 pp. 401–407.
- Kuncheva and Hadjitodorov (2004) Kuncheva, L. I. and Hadjitodorov, S. T. (2004). Using diversity in cluster ensembles. In IEEE International Conference on Systems, Man and Cybernetics, 2004, vol. 2. IEEE, 1214–1219.
- Leamer (1978) Leamer, E. E. (1978). Specification Searches. Wiley, New York.
- Lee and McLachlan (2013a) Lee, S. X. and McLachlan, G. J. (2013a). EMMIXuskew: An R package for fitting mixtures of multivariate skew distributions via the EM algorithm. Journal of Statistical Software, 55 1–22.
- Lee and McLachlan (2013b) Lee, S. X. and McLachlan, G. J. (2013b). Model-based clustering and classification with non-normal mixture distributions (with discussion). Statistical Methods & Applications, 22 427–479.
- Madigan and Raftery (1994) Madigan, D. M. and Raftery, A. E. (1994). Model selection and accounting for model uncertainty in graphical models using Occam’s window. Journal of the American Statistical Association, 89 1335–1346.
- Marron and Wand (1992) Marron, J. S. and Wand, M. P. (1992). Exact mean integrated squared error. Annals of Statistics, 20 712–736.
- McLachlan and Peel (1999) McLachlan, G. and Peel, D. (1999). The EMMIX algorithm for the fitting of normal and t-components. Journal of Statistical Software, 4 1–14.
- McLachlan and Peel (2000) McLachlan, G. J. and Peel, D. (2000). Finite Mixture Models. John Wiley & Sons, New York.
- McNicholas and Murphy (2008) McNicholas, P. D. and Murphy, T. B. (2008). Parsimonious Gaussian mixture models. Statistics and Computing, 18 285–296.
- McNicholas and Murphy (2010) McNicholas, P. D. and Murphy, T. B. (2010). Model-based clustering of longitudinal data. Canadian Journal of Statistics, 38 153–168.
- Monti et al. (2003) Monti, S., Tamayo, P., Mesirov, J. and Golub, T. (2003). Consensus clustering: a resampling-based method for class discovery and visualization of gene expression microarray data. Machine Learning, 52 91–118.
- Parzen (1962) Parzen, E. (1962). On estimation of a probability density function and mode. Ann. Math. Statist., 33 1065–1076.
- R Core Team (2014) R Core Team (2014). R: A Language and Environment for Statistical Computing. R Foundation for Statistical Computing, Vienna, Austria. URL http://www.R-project.org/.
- Roeder and Wasserman (1997) Roeder, K. and Wasserman, L. (1997). Practical Bayesian density estimation using mixtures of normals. Journal of the American Statistical Association, 92 894–902.
- Rosenblatt (1956) Rosenblatt, M. (1956). Remarks on some nonparametric estimates of a density function. The Annals of Mathematical Statistics, 27 832–837.
- Schwarz (1978) Schwarz, G. (1978). Estimating the dimension of a model. Annals of Statistics, 6 461–464.
- Scott (1992) Scott, D. W. (1992). Multivariate Density Estimation: Theory, Practice, and Visualization. Wiley.
- Silverman (1986) Silverman, B. W. (1986). Density estimation for statistics and data analysis. Chapman & Hall, London.
- Sokal and Sneath (1963) Sokal, R. R. and Sneath, P. H. A. (1963). Principles of numerical taxonomy. WH Freeman, San Francisco.
- Steele and Raftery (2010) Steele, R. J. and Raftery, A. E. (2010). Performance of Bayesian model selection criteria for Gaussian mixture models. In Frontiers of Statistical Decision Making and Bayesian Analysis (M.-H. Chen, P. Müller, D. Sun, K. Ye and D. K. Dey, eds.). Springer, New York, 113–130.
- Strehl and Ghosh (2003) Strehl, A. and Ghosh, J. (2003). Cluster ensembles—a knowledge reuse framework for combining multiple partitions. ‘Journal of Machine Learning Research, 3 583–617.
- Wand and Jones (1993) Wand, M. and Jones, M. (1993). Comparison of smoothing parameterizations in bivariate kernel density estimation. Journal of the American Statistical Association, 88 520–528.
- Wand and Jones (1994) Wand, M. and Jones, M. (1994). Multivariate plug-in bandwidth selection. Computational Statistics, 9 97–116.
- Wei and McNicholas (2014) Wei, Y. and McNicholas, P. D. (2014). Mixture model averaging for clustering. Advances in Data Analysis and Classification To appear.
Appendix A Settings used for density simulations
A.1 Bivariate extensions of the Marron and Wand distributions as used in Fraley et al. (2002)
A.1.1 Single Gaussian


| Cluster | Prop | Mean | Covariance |
|---|---|---|---|
| 1 | 1 |
A.1.2 Skewed unimodal


| Cluster | Prop | Mean | Covariance |
|---|---|---|---|
| 1 | 1/5 | ||
| 2 | 1/5 | ||
| 3 | 3/5 |
A.1.3 Strongly skewed


| Cluster | Prop | Mean | Covariance |
|---|---|---|---|
| 1 | 1/8 | ||
| 2 | 1/8 | ||
| 3 | 1/8 | ||
| 4 | 1/8 | ||
| 5 | 1/8 | ||
| 6 | 1/8 | ||
| 7 | 1/8 | ||
| 8 | 1/8 |
A.1.4 Kurtotic unimodal


| Cluster | Prop | Mean | Covariance |
|---|---|---|---|
| 1 | 2/3 | ||
| 2 | 1/3 |
A.1.5 Outlier


| Cluster | Prop | Mean | Covariance |
|---|---|---|---|
| 1 | 1/10 | ||
| 2 | 9/10 |
A.1.6 Bimodal


| Cluster | Prop | Mean | Covariance |
|---|---|---|---|
| 1 | 1/2 | ||
| 2 | 1/2 |
A.1.7 Separated bimodal


| Cluster | Prop | Mean | Covariance |
|---|---|---|---|
| 1 | 1/2 | ||
| 2 | 1/2 |
A.1.8 Asymmetric bimodal


| Cluster | Prop | Mean | Covariance |
|---|---|---|---|
| 1 | 3/4 | ||
| 2 | 1/4 |
A.1.9 Trimodal


| Cluster | Prop | Mean | Covariance |
|---|---|---|---|
| 1 | 2/5 | ||
| 2 | 2/5 | ||
| 3 | 1/5 |
A.1.10 Claw (Bart Simpson)

| Cluster | Prop | Mean | Covariance |
|---|---|---|---|
| 1 | 2/7 | ||
| 2 | 1/7 | ||
| 3 | 1/7 | ||
| 4 | 1/7 | ||
| 5 | 1/7 | ||
| 6 | 1/7 |
A.2 Higher dimensional distribution settings
A.2.1 Additional standard normal columns
For these results we merely added standard normal observations to the simulated bivariate clusters. We did not differentiate between the clusters as cluster membership is not important in this setting.
A.2.2 Three- and six-dimensional extensions
| Cluster | Separation | Prop | Mean | Covariance |
| 1 | 1.5 | 1/2 | ||
| 2 | 1/2 | |||
| 1 | 3 | 1/2 | ||
| 2 | 1/2 | |||
| 1 | 5 | 1/2 | ||
| 2 | 1/2 |
| Cluster | Displacement | Prop | Mean | Covariance |
|---|---|---|---|---|
| 1 | 0.75 | 1/2 | ||
| 2 | 1/2 | |||
| 1 | 1.5 | 1/2 | ||
| 2 | 1/2 | |||
| 1 | 2.5 | 1/2 | ||
| 2 | 1/2 |