Chain-like transitions in Wigner crystals: Sequential or non-sequential?
Abstract
The structural transitions of the ground state of a system of repulsively interacting particles confined in a quasi-one-dimensional channel, and the effect of the interparticle interaction as well as the functional form of the confinement potential on those transitions are investigated. Although the non-sequential ordering of transitions (non-SOT), i.e. ------- sequence of chain configurations with increasing density, is widely robust as predicted in a number of theoretical studies, the sequential ordering of transitions (SOT), i.e. ------ chain, is found as the ground state for long-ranged interparticle interaction and hard-wall-like confinement potentials. We found an energy barrier between every two different phases around its transition point, which plays an important role in the preference of the system to follow either a SOT or a non-SOT. However, that preferential transition requires also the stability of the phases during the transition. Additionally, we analyze the effect of a small structural disorder on the transition between the two phases around its transition point. Our results show that a small deformation of the triangular structure, change dramatically the picture of the transition between two phases, removing in a considerable region the non-SOT in the system. This feature could explain the fact that the non-SOT is, up to now, not observed in experimental systems, and suggests a more advanced experimental set-up to detect the non-SOT.
pacs:
81.30.-t, 37.10.Ty, 82.70.Dd, 52.27.LwI Introduction
At low temperatures, a classical system of charged particles arranges itself in a close packet structure, also known as Wigner crystalWigner (1934); Shikin (1971); Grimes and Adams (1979). This organization of particles allows the lowest energy configuration and, due to the absence of kinetic energy, the arrangement of particles results in a stable crystalline structure. In a two-dimensional system, Wigner crystals have a hexagonal lattice structure.Schweigert and Peeters (1995); Partoens et al. (1997); Meyer and Matveev (2009).
For a quasi-one-dimensional (Q1D) system of classical charged particles confined in a parabolic channel, Piacente et al.Piacente et al. (2003); *003_piacente predicted a non-sequential ordering of transitions (non-SOT) between ground state (GS) configurations: ------- chain-like structures with increasing particle density. They found that the range of the interaction between particles does not affect the ordering of the transition, when the particles are confined by a parabolic potentialPiacente and Peeters (2005); Piacente et al. (2010); Galván-Moya and Peeters (2011). The structural transition from two- to four-chain configuration () occurs, in the case of a non-SOT, through a zigzag transition of each of the two chains and a simultaneous small shift along the chain, which makes it a discontinuous transitionPiacente et al. (2004).
Although this non-SOT has been found as the GS in a number of theoretical worksPiacente et al. (2003, 2004); Köppl et al. (2006); Klironomos and Meyer (2011), it was not, to the best of our knowledge, observed in experiments so far. Instead, in the experiments they observed a direct transition from two- to three-chain configuration (), allowing the system the follow a usual sequential order of transitions (SOT), with increasing linear density, as reported in the case of electrons on liquid He at low temperaturesIkegami et al. (2012); Rees and Kono (2014); Rees et al. (2011) and even in dusty plasma clusters Sheridan and Wells (2010). The SOT in a system of electrons on liquid He has been indirectly measured by interpreting the step-like increment of the conductance of a channel, while an electrical force guides the motion for the particles in the structureIkegami et al. (2012); Rees and Kono (2014). Theoretical works have modeled this system, evidencing the SOT during that dynamical processAraki and Hayakawa (2012); Vasylenko and Misko (2014, 2015), although modifying the shape (i.e., increasing the length) of the confining constriction was shown to facilitate the observations of the non-SOTVasylenko and Misko (2015). Similarly, a SOT has been predicted theoretically for a binary mixture of repulsive particles trapped in a channel Ferreira et al. (2008), and for an Abrikosov-vortex arrangement in a superconducting slab for low temperatures Guimpel et al. (1988); Brongersma et al. (1993); Carneiro (1998); Sardella et al. (1999); Barba-Ortega et al. (2010), as well as for Pearl vortices Bronson et al. (2006).
Ikegami et al.Ikegami et al. (2012) observed a periodic change of melted and ordered states as a function of linear density, i.e. re-entrant melting. However, in that work melting temperature was just a measure of disorder of the system. In terms of structural transitions, they always observed SOT, in agreement with Ref. [Piacente et al., 2004] if temperature is above a certain value. However, following the results of Piacente et al.Piacente et al. (2004) one might expect that lowering temperature would result in the non-SOT, which was not seen experimentally within the attainable temperature rangeIkegami et al. (2012); Rees and Kono (2014). Thus the important question rises: how to optimize experimental set-ups in order to realize the observation of the non-SOT?
Previous theoretical works have shown the robustness of the non-SOT for a system of particles trapped in a perfect parabolic channel irrespective of the range of the interaction between the particlesPiacente et al. (2004), and also for a system of particles with a fixed interparticle interaction, confined in Q1D channels with potentials of various functional form.Galván-Moya et al. (2014) However, it has been recently proven that it is possible to find a SOT region by tuning the parameters of the confinement potential, e.g. by invoking a profile similar to the Bean-Livingston barrier for vortices in a superconductorGalván-Moya et al. (2014). At first glance, we note that two extreme cases of this problem have been analyzed: a fixed confinement varying the range of the interaction, and a fixed interaction range varying the profile of the confinement channel. From these results a trend of the ordering of the transitions was revealed, but it still did not resolve two important issues: why the system prefers following a non-SOT rather than SOT? And, most importantly, why experiments did not find a non-SOT if it is a preferable scenario? In this work, we present an in-depth analysis which answers these questions.
The present paper is organized as follows. We first give, in Sec. II, an overview of the model and the perspective of the current work done in this area. Sec. III is devoted to the analytical study of the effect of the interaction range on the ordering of the structural transitions, for different confinement potentials. In Sec. IV, we induce transitions from two- to three-chain () and from two- to four-chain (), and calculate the energy barrier for each transition, analyzing the stability of the configurations formed in the vicinity of the transition point. The effect of small imperfections on the energy barrier and on the ordering of the transitions are analyzed in Sec. V. Finally, our conclusions are given in Sec. VI
II Model System
First, we consider a two-dimensional infinite system of identical interacting particles with electric charge and mass , which move in the -plane. The particles are confined by a one-dimensional potential limiting their motion in the -direction, forming a quasi-one-dimensional channel along the -axis []. The total energy of the system is given by:
| (1) |
where is the relative position of the -th particle in the system, while represents the pairwise inter-particle interaction, which is taken as a screened power-law potential, which will allow for the simulations of both short- and long-range interactions, as follows:
| (2) |
where the parameters and allows us to tune the range of the interaction between particles in the system, is the dielectric constant of the medium the particles are moving in, and is an arbitrary length parameter which we introduced to guarantee the right units.
Due to the importance of the profile of the confinement potential on the ordering of the transitions, as shown in Ref. [Galván-Moya et al., 2014], we use the following two different functional form of the confinement potential, which allows us to vary the profile of the channel continuously from a parabolic-like to a hard-wall potential:
| (3) | |||||
| (4) |
where and control the sharpness, the strength, and the effective width of the confining channel. In the following, we refer to [] as exponential [Gaussian] confinement.
In dimensionless form, the interaction and the confinement potentials in our model become:
| (5) | |||||
| (6) | |||||
| (7) |
where the energy is expressed in units of and all distances are expressed in units of . The dimensionless frequencies are given by and , while measures the strength of the confinement potential, and the screening of the pairwise interaction is . The dimensionless linear density is defined as the number of particles per unit of length along the unconfined direction.
Concerning the sequence of the GS configuration for increasing system density, previous works have shown that: 1) In case of parabolic confinement, the GS follows the non-SOT irrespective of the range of the interparticle interactionPiacente et al. (2004). 2) In case of the interaction potential given by and in Eq. (5), and varying the profile of the channel, the GS follows the non-SOT in the limiting cases of hard-wall and parabolic-like profileGalván-Moya et al. (2014). The latter study also showed that non-SOT is present in all systems for intermediate values of the shape parameter, evidencing that the non-SOT is extremely robust for a broad range of possible profiles and shape parameters. However, in case of Gaussian confinement, SOT for the GS was found within a small window of the shape parametersGalván-Moya et al. (2014), indicating that the shape of the channel profile is of crucial importance when one is looking for a SOT in the system.
These results bring in evidence the strong relation between the range of the interparticle interaction and the confinement profile. Due to the fact that in experiments it is very common to observe the SOT but not the non-SOT, a complete and detailed study about the effects of the range of the interparticle interaction and the profile of the confinement channel on the ordering of the transitions, are needed, as well as a trustable recipe for the experimentalist about the regions where the non-SOT could be observed. The present paper will address those problems.
III Interaction range vs. confinement profile
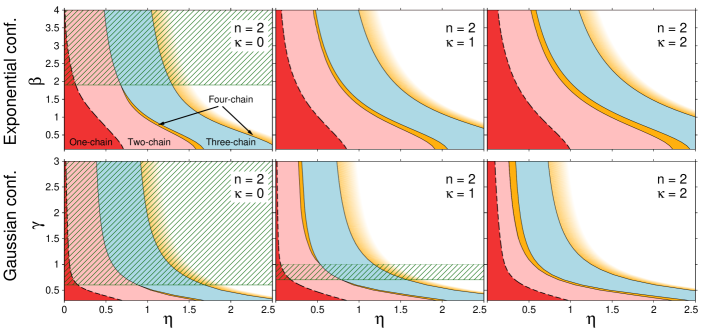
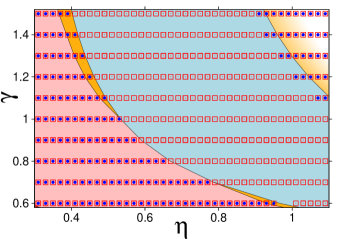
Analytical calculation of the energy of a system of different chain-like structures, is performed by following the model proposed in Ref. [Galván-Moya et al., 2014]. As a result, we found ”shape parameter vs. density” phase diagrams for different confinement potentials and different ranges of the interaction between particles, as shown in Fig. 1. The phase diagrams are the zero temperature GS configuration as function of the shape parameters and the linear particle density . All the transitions are of first order, except the zigzag transition between one- and two-chain which is of second order. Interestingly, these results show the appearance of a region where the GS is guided by a SOT, for three of the model systems, as highlighted by the patterned region in each phase diagram. These results evidence the complementing behavior between the confinement and the interaction potential. PreviouslyGalván-Moya et al. (2014), SOT had been reported theoretically only in case of Gaussian confinement for the interaction parameters and . In that case, the SOT was found within a small window of (including which models the Bean-Livingston barrier for superconducting vortices).
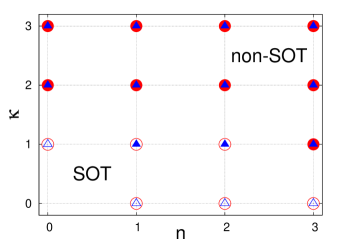
An extended phase diagram for the ordering of the transitions is plotted in Fig. 2, as a function of the parameters of the interparticle interaction and , which control the range of the interaction (see Eq. (5)). The solid symbols (triangles for exponential and circles for Gaussian confinement) indicate the case when the GS configuration always follows a non-SOT irrespective of the shape parameters, while the open symbols indicate the case when the SOT has been found. From Fig. 2 one can see that, the non-SOT is robust for a vast range of shape parameters of both confinement potentials studied. This behavior allows one to interpret the non-SOT as the ”natural” mechanism, which determines the behavior of a system of classical particles with increasing particle density, irrespective of the interaction between them or the shape of the confinement potential of the channel. This result is a generalization of previous theoretical worksPiacente et al. (2004); Galván-Moya and Peeters (2011); Galván-Moya et al. (2014) to a large set of different interparticle interactions and confinement potentials.
Note that the SOT has been found in some regions of the shape parameters, when the interaction potential is long-range. However, the range of the interaction to observe a SOT must be even longer in case of exponential confinement as compared to Gaussian confinement. This finding is very interesting because the experimental observation of SOT in systems of electrons floating on the surface of liquid He, assume a Coulomb-like interaction between particlesIkegami et al. (2012), which is clearly a long-range interaction.
IV Energy barrier at the transition point
In order to understand why the system prefers to follow one ordering (SOT versus non-SOT) instead of the other one, we compare the energy barrier the system has to overcome during the transitions and .
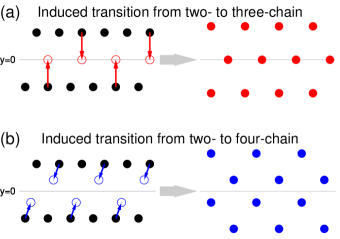
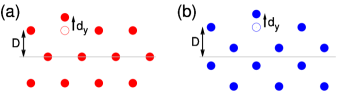
For this purpose, we will focus on the case of the interaction parameters and , for the Gaussian confinement potential given by Eq. (7), because in this case the SOT is present in a small window of values of the parameter . In order to calculate the energy barrier between the configurations, we set the two-chain structure, which was found as metastable or GS configuration close to the transition point (), as initial configuration. We induce the transitions and , at a given density (), by forcing the displacement of some selected particles, allowing the rest of the particles to adjust themselves in order to reach the most energetically favorable configuration. The selected particles are dragged along straight trajectories as shown in Fig. 3(a) and Fig. 3(b) for the transitions and , correspondingly. The straight paths are expected to be close to the real trajectories of the selected particles taking into account the symmetry of the initial and the final configurations during the transitions and .
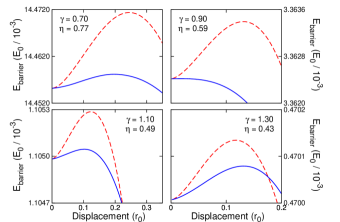
Following the displacements shown in Fig. 3, we found that an energy barrier is formed very close to the transition point (), and at , the barrier for transition is always higher than the barrier for transition , as shown in Fig. 4. This behavior shows that, in terms of energy cost, the system always prefers the transition rather than the transition . This result provides an understanding, why the system prefers to follow the non-SOT which appears to be a straightforward mechanism for the transition from a two-chain to a four-chain configuration, due to the minimum energy cost for the system.
Now, we extend the calculation of the induced transition not only around , but to the whole region of parameters. For every displacement during these induced transitions, we calculate the dynamical matrix of the system, and by using the Newton optimizationSchweigert and Peeters (1995), we calculate the most energetically favorable configurations, together with their vibrational eigenfrequencies. From the symmetry of our system, we know that it has one translational symmetry, which is numerically evidenced by the existence of only one vanishing eigenfrequency. This condition is important in our case, due to the fact that it allows us to define the stability of the different configurations found, after the induced transition is performed. In Fig. 5 we show, with symbols, the regions where the induced transitions and are stable; at the same time we plot the analytical results for the phase diagram of the GS (see Fig. 1).
From Fig. 5 one can see that, while the induced transition is stable irrespective of the value of , the stability of the transition is restricted to two different regions of . We can observe that our numerical results show a perfect match with the transition point analytically calculated in Section III. It is worth noting that the SOT formed in the window (), as found analytically, arises from the fact that the transition is not stable at the intermediate points ( and ). Summarizing, the system ”naturally” evolves following the non-SOT with increasing density, since, in all the cases the transition is more energetically favorable than the transition . However, the window of non-stability of the configurations during the transition , opens the door for the transition as the GS, and therefore the SOT takes place.
V The role of fluctuations
In the above analysis, we assumed that there is no disorder. As long as a small amount of disorder does not affect the above findings, these can be considered as robust and reliable. The goal of this section is to analyze the effect of disorder.
Typically, disorder is produced by thermal fluctuations or by imperfections of the geometry of the channels. While the geometry can be made nearly perfect, thermal fluctuations are inevitable. Also, when thinking of experimental measurements of electrons moving on the surface of He in micro-channels, we should keep in mind that the experimental methods Ikegami et al. (2012) do not allow to control the electron structure itself. The structure is detected indirectly, via measuring the electron current through a narrow constriction. Therefore, one cannot judge whether the electrons were perfectly ordered or not before they entered the constriction. Of course, the limiting cases of a crystal and liquid can be distinguished by the appearance of typical oscillations in the -curves in case of a Wigner crystal Ikegami et al. (2012); Rees and Kono (2014); Rees et al. (2011); Vasylenko and Misko (2015, 2014). On the other hand, one can expect that weak disorder cannot be detected in the electron current measurements, i.e., these measurements cannot distinguish a perfect Wigner crystal from a slightly disordered one. However, it is not known whether the order of transitions studied above is sensitive to weak disorder.
In order to analyze the effect of disorder, we introduce a small displacement of one particle (per simulation cell) from its symmetric GS configuration, as shown in Fig. 6. Note that in the general case this procedure is equivalent to the effect of non-zero temperature (see, e.g., Ref. [Piacente et al., 2004]). In particular, a displacement of of the lattice constant from its equilibrium position, according to the Lindemann criterion, is treated as (local) melting of the crystal.
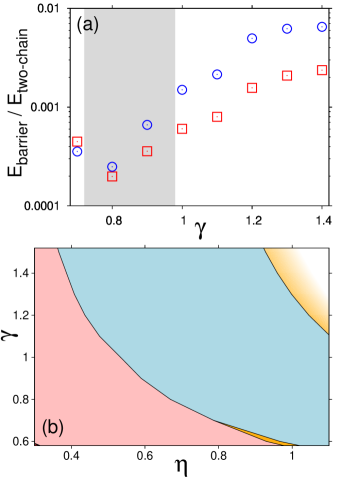
Following the procedure described above, we increase the particle’s density and analyze the structural transitions. We calculate the relative energy barrier of the transition from two- to the imperfect three-chain () and to the imperfect four-chain () configurations. Fig. 7(a) shows this barrier plotted as a function of at the transition point, circles and squares represent the energy barrier for and , respectively. One can see that the energy barrier of decreases as compared to the one of , resulting in the shrinking of the region where the transition to three-chain is more favorable than to the four-chain configuration. Therefore, the GS of the system follows the SOT in a wide range of parameters, as clearly shown in Figs. 7(a,b). In the highlighted gray region in Fig. 7(a), the SOT guides the GS due to the instability of the transition configuration, as discussed in previous section. However, just a small imperfection, as the one modeled in the present analysis, breaks the robustness of the transition , allowing the system to evolve following the SOT for a region of much wider than in case of perfect chain-like structures (cf. Fig. 5).
Using these results we re-plot the phase diagram for the above studied system ( and ) i.e., shown in Fig. 5. In the new phase diagram (Fig. 7(b)) the GS of the system follows the SOT for a broad range of densities, starting from and higher. Therefore, even a small amount of disorder changes dramatically the picture of the ordering of the transition in the GS configuration of the system. The non-SOT earlier considered as a “robust” feature (since it survived under various transformations of the confinement potential and the inter-particle interaction) turns out to be fragile against a small deformation in the lattice, for low particle density. This fragility of the non-SOT explains, why experimentally the non-SOT has never been observed under real experimental conditions (e.g., non-zero temperature).
VI Conclusions
The existence of the so-called non-sequential ordering of structural transitions (non-SOT), when increasing the particles density, in a system of repulsive particles confined in a quasi-one-dimensional potential was theoretically predicted in a number of works. The non-SOT, when the number of chains follows the sequence 1-2-4-3-4…, was shown to be the “natural” sequence of transitions for a broad range of the interaction and confinement parameters. However, in spite of the theoretically predicted robustness of the non-SOT, experiments with various interacting particles including electrons on the surface of liquid He in micro-channels, colloids in narrow channels, and superconducting vortices in narrow stripes, did not reveal the non-SOT. Instead, the transitions followed the SOT, i.e., 1-2-3-4…
In an attempt to investigate this controversial behavior, we studied in detail the effect of boundaries on the sequence of the structural transitions Galván-Moya et al. (2014). It was shown, in particular, that in case of a Bean-Livingston-type barrier, which appears in case of vortices in a superconductor, one observes SOT rather than non-SOT. In this work, we took a deeper insight in this problem, by generalizing our study to interparticle interactions of very different range. In addition, we analyzed the effect of fluctuations which provided us with a deeper understanding why real systems display SOT rather than the theoretically predicted non-SOT.
In particular, we investigated the structural transitions for the ground state (GS) of a classical system of particles confined in a channel. The inter-particle interaction was modeled as a screened power-law potential, and the profile of the channel confining potential was modeled by two different functional forms, both being gradually tunable from a parabolic- to a hard-wall-like confinement. In this context all the GS configurations are presented by chain-like structures, which correspond to Wigner crystal structures.
The effect of the interaction between particles on the ordering of transitions of the GS configurations, was investigated for different values of the interaction parameters, varying from a short-range to a long-range interaction potential. We analytically calculated the energy of the chain-like structures at zero temperature, and analyzed the results obtained for different confinement potentials. We found that the non-SOT is present in all cases studied and it was found irrespective of the range of the interaction and for different energy profiles of the confining channel.
On the other hand, our calculations show that a region where the SOT guides the transitions of the GS by increasing particle density, emerges in case of a long-range interaction potential (i.e., when approaching the limit of unscreened Coulomb interaction), and this region is extended for longer-range interactions: The longer the range of the interaction, the higher probability to find the SOT as a sequence of the GS of the system.
Two different types of trapping potentials, which control the profile of the channel where the particles are confined, were studied: exponential and Gaussian confinement. In both cases the shape parameter allows us to control the shape of the channel, varying it from a parabolic-like to a hard-wall-like channel by increasing the shape parameter. We found that for a hard-wall-like confinement, the transitions between different configurations occur at lower particle linear density, and the ordering of the transitions is related to the range of the interaction potential. Oppositely, in case of a parabolic-like confinement, we found in all studied cases, that the transitions between the different phases are always given by a non-SOT.
The existence of the sequential or non-sequential ordering of transitions between phases in the GS is determined by the existence or absence of the four-chain GS configuration “inserted” in the direct transition . We investigated the ability of the system to follow either the transition or the , by calculating the energy barrier which the system has to overcome in order to reach the final state. We found that, irrespective of the confinement profile and the interaction potential, the barrier for the transition is higher than that for the , thus making the non-SOT as the most “natural” ordering of transitions for the GS of the system.
However, when analyzing the stability of the configuration during this transition (), we found that if this transition is not allowed as the GS, the reason for this behavior is the instability of that state. Our numerical results obtained from the analysis of the stability of the states perfectly confirm the behavior of the transitions and the phase diagram calculated analytically for this system. The analysis of the stability explains that the robustness of the non-SOT is not just due to the energetically favorable arrangement of the particles, but due to the instability of the transition .
As further follows from our analysis, the effect of weak fluctuations in the chain-like structure can lead to the SOT behavior. Thus our simulations showed that even a small imperfection could change dramatically the ordering of transitions facilitating the appearance of the SOT and considerably increasing the window of parameters to observe it. This results in a remarkable finding: The robustness of the non-SOT in the system can be eliminated by a weak disorder of the Wigner crystal, e.g., due to a non-zero temperature.
Our results manifested that small fluctuations destroy the intermediate four-chain configuration (i.e., the hallmark of the non-SOT), facilitating the experimental observation of the SOT instead of the earlier predicted non-SOT as the most “natural” sequence of transitions. At the same time, an important result of our analysis is that we found the window of parameters where the non-SOT still can be potentially found, even in the presence of weak fluctuations (e.g., for non-zero but relatively low temperature). In particular, our analysis showed that the non-SOT is “protected” against small fluctuations in the regime of high linear density and smooth confinement, therefore, we expect that the non-SOT would be experimentally observed in that region, rather than for low density of particles confined in a hard-wall channel.
Acknowledgements.
This work was supported by the Flemish Science Foundation (FWO-Vl) and the Odysseus and Methusalem programmes of the Flemish government. Computational resources were provided by HPC infrastructure of the University of Antwerp (CalcUA) a division of the Flemish Supercomputer Center (VSC).References
- Wigner (1934) E. Wigner, Phys. Rev. 46, 1002 (1934).
- Shikin (1971) V. B. Shikin, J. Exp. Theor. Phys. 33, 387 (1971).
- Grimes and Adams (1979) C. C. Grimes and G. Adams, Phys. Rev. Lett. 42, 795 (1979).
- Schweigert and Peeters (1995) V. A. Schweigert and F. M. Peeters, Phys. Rev. B 51, 7700 (1995).
- Partoens et al. (1997) B. Partoens, V. A. Schweigert, and F. M. Peeters, Phys. Rev. Lett. 79, 3990 (1997).
- Meyer and Matveev (2009) J. S. Meyer and K. A. Matveev, J. Phys.: Condens. Matter 21, 023203 (2009).
- Piacente et al. (2003) G. Piacente, I. V. Schweigert, J. J. Betouras, and F. M. Peeters, Solid State Commun. 128, 57 (2003).
- Piacente et al. (2004) G. Piacente, I. V. Schweigert, J. J. Betouras, and F. M. Peeters, Phys. Rev. B 69, 045324 (2004).
- Piacente and Peeters (2005) G. Piacente and F. M. Peeters, Phys. Rev. B 72, 205208 (2005).
- Piacente et al. (2010) G. Piacente, G. Q. Hai, and F. M. Peeters, Phys. Rev. B 81, 024108 (2010).
- Galván-Moya and Peeters (2011) J. E. Galván-Moya and F. M. Peeters, Phys. Rev. B 84, 134106 (2011).
- Köppl et al. (2006) M. Köppl, P. Henseler, A. Erbe, P. Nielaba, and P. Leiderer, Phys. Rev. Lett. 97, 208302 (2006).
- Klironomos and Meyer (2011) A. D. Klironomos and J. S. Meyer, Phys. Rev. B 84, 024117 (2011).
- Ikegami et al. (2012) H. Ikegami, H. Akimoto, D. G. Rees, and K. Kono, Phys. Rev. Lett. 109, 236802 (2012).
- Rees and Kono (2014) D. G. Rees and K. Kono, Biophys. Rev. Lett. 9, 397 (2014).
- Rees et al. (2011) D. G. Rees, I. Kuroda, C. A. Marrache-Kikuchi, M. Höfer, P. Leiderer, and K. Kono, Phys. Rev. Lett. 106, 026803 (2011).
- Sheridan and Wells (2010) T. E. Sheridan and K. D. Wells, Phys. Rev. E 81, 016404 (2010).
- Araki and Hayakawa (2012) M. Araki and H. Hayakawa, Phys. Rev. B 86, 165412 (2012).
- Vasylenko and Misko (2014) A. A. Vasylenko and V. R. Misko, Biophys. Rev. Lett. 9, 349 (2014).
- Vasylenko and Misko (2015) A. A. Vasylenko and V. R. Misko, Eur. Phys. J. B. 88, 105 (2015).
- Ferreira et al. (2008) W. P. Ferreira, J. C. N. Carvalho, P. W. S. Oliveira, G. A. Farias, and F. M. Peeters, Phys. Rev. B 77, 014112 (2008).
- Guimpel et al. (1988) J. Guimpel, L. Civale, F. de la Cruz, J. M. Murduck, and I. K. Schuller, Phys. Rev. B 38, 2342 (1988).
- Brongersma et al. (1993) S. H. Brongersma, E. Verweij, N. J. Koeman, D. G. de Groot, and R. Griessen, Phys. Rev. Lett. 71, 2319 (1993).
- Carneiro (1998) G. Carneiro, Phys. Rev. B 57, 6077 (1998).
- Sardella et al. (1999) E. Sardella, M. M. Doria, and P. R. S. Netto, Phys. Rev. B 60, 13159 (1999).
- Barba-Ortega et al. (2010) J. Barba-Ortega, A. Becerra, and J. A. Aguiar, Physica C 470, 225 (2010).
- Bronson et al. (2006) E. Bronson, M. P. Gelfand, and S. B. Field, Phys. Rev. B 73, 144501 (2006).
- Galván-Moya et al. (2014) J. E. Galván-Moya, V. R. Misko, and F. M. Peeters, Phys. Rev. B 90, 094111 (2014).