Oscillating red giants observed during Campaign 1 of the Kepler K2 mission: New prospects for galactic archaeology
Abstract
NASA’s re-purposed Kepler mission – dubbed K2 – has brought new scientific opportunities that were not anticipated for the original Kepler mission. One science goal that makes optimal use of K2’s capabilities, in particular its 360-degree ecliptic field of view, is galactic archaeology – the study of the evolution of the Galaxy from the fossil stellar record. The thrust of this research is to exploit high-precision, time-resolved photometry from K2 in order to detect oscillations in red giant stars. This asteroseismic information can provide estimates of stellar radius (hence distance), mass and age of vast numbers of stars across the Galaxy. Here we present the initial analysis of a subset of red giants, observed towards the North Galactic Gap, during the mission’s first full science campaign. We investigate the feasibility of using K2 data for detecting oscillations in red giants that span a range in apparent magnitude and evolutionary state (hence intrinsic luminosity). We demonstrate that oscillations are detectable for essentially all cool giants within the range –3.2. Our detection is complete down to , which results in a seismic sample with little or no detection bias. This sample is ideally suited to stellar population studies that seek to investigate potential shortcomings of contemporary Galaxy models.
Subject headings:
stars: fundamental parameters — stars: oscillations — stars: interiors1. Introduction
The study of red giant stars has arguably been one of the greatest success stories of NASA’s Kepler mission (e.g., García & Stello, 2015, and references herein). However, a failure of the second of four momentum wheels ended the mission in 2013 because the spacecraft could no longer acquire stable pointing towards its original field of view. Fortunately, ingenious use of the remaining spacecraft capabilities by NASA and Ball Aerospace engineers rejuvenated the mission as K2 – a mission capable of stable pointing at any field along the ecliptic for up to approximately three months per pointing (Howell et al., 2014). In this configuration, the Kepler roll angle drifts due to a torque applied by solar radiation pressure, but this can be counteracted by thruster firings every six hours to maintain the spacecraft pointing. The K2 mission has enabled a broad range of new science including stellar clusters (Nardiello et al., 2015), planets around bright cool stars (Crossfield et al., 2015; Sanchis-Ojeda et al., 2015; Vanderburg et al., 2015; Montet et al., 2015), solar system objects (Szabó et al., 2015), stellar activity (Ramsay & Doyle, 2015), eclipsing binaries (Conroy et al., 2014), asteroseismology (Jeffery & Ramsay, 2014; Lund et al., 2015; Chaplin, 2015) and, in particular, asteroseismological studies of the Galaxy.
The potential for asteroseismic investigations of large populations of red giants aimed at Galactic studies was recently demonstrated using data from CoRoT and Kepler (Miglio et al., 2009; Chaplin et al., 2011; Miglio et al., 2013; Casagrande, 2015). However, the scope of these early studies was limited for two reasons: the small number of distinct direction in the Galaxy probed by those missions, and the highly complex (and, at some level, not fully documented) selection function of the observed red giants (Sharma et al. in preparation). With K2’s 360-degree coverage of the ecliptic the collated efforts from the K2 observing campaigns, provide a unique opportunity to probe different regions of the Galaxy, including the thin and thick disks, the halo, and the bulge, based on a purpose-built selection approach suitable for population studies.
In this Letter, we present initial results from the K2 Campaign 1 data. Based on a sample of red giants specifically selected to study stellar populations on a galactic scale, our aim is to determine if we can obtain an unbiased sample of stars showing oscillations – a crucial first step if these stars are to be used for galactic archaeology studies.
2. Observations and light curve preparation
We used observations obtained as part of the K2 Galactic Archaeology Program Campaign 1 (C1 proposal GO1059)111http://keplerscience.arc.nasa.gov/K2/index.shtml. For the purpose of this Letter, we focused on a targeted set of red giant candidates based on their spectroscopic values () drawn from APOGEE (Majewski et al., 2010), part of the Sloan Digital Sky Survey III (Eisenstein et al., 2011). The APOGEE survey used a wide-field multi-object H-band spectrograph (Wilson et al., 2010) on the 2.5-meter Sloan Foundation telescope at Apache Point Observatory (Gunn et al., 2006). The red giants discussed here were observed as part of the main survey (Zasowski et al., 2013). The spectra were reduced, wavelength-calibrated, and co-added as described by Nidever et al. (2015). The determination of stellar parameters from the the automated pipeline is described by Garcia-Perez et al, in preparation). We used the parameters from Data Release 12 (Alam et al., 2015); the calibration and verification of the APOGEE DR 12 results is described by Holtzman et al. (2015). Of the 121 red giant candidates that satisfy the above-mentioned cut, 117 were observed in the K2 campaign. The stars span 2.8 dex in and seven magnitudes in apparent magnitude (), and hence serve as a suitable benchmark set to characterize the K2 data fidelity, including the ability to detect oscillations for different levels of intrinsic and apparent brightness.
The photometric time series (light curves) from the raw K2 pixel data are currently not available from NASA. However, light curves created by Vanderburg & Johnson (2014) (VJ hereafter) are publicly available222https://www.cfa.harvard.edu/~avanderb/k2.html and we used these data in our study. Power spectra of the light curves denoted ‘corrected’ by VJ are shown in Fig. 1 (black curves) for three stars.
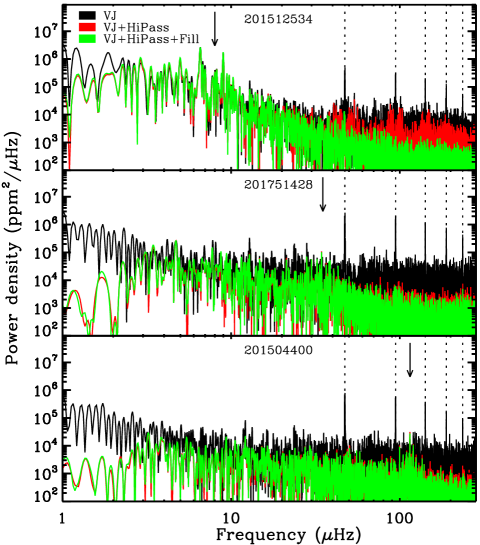
The 80-day duration of the light curves provides a nominal frequency resolution of Hz, which imposes a lower limit on the frequency separation between overtone modes, , that we can reliably determine (Huber et al., 2010; Hekker et al., 2012). Through the tight correlation between and (Stello et al., 2009), this translates into a lower limit of about 10Hz in , and hence to the frequency range in which we can fully characterise the oscillations. By restricting our attention to higher-frequency stars, we are then free to apply a high-pass filter without compromising the oscillation signal. We chose a boxcar filter with a width of two days, resulting in a cut-off frequency of about 3Hz (Fig. 1, red spectra), without affecting the oscillation signal of our target stars. Applying a high-pass filter gives a significant reduction in the noise floor at all frequencies because it reduces spectral leakage of low-frequency power to higher frequencies, as seen by comparing the black and the red spectra in Fig. 1.
Due to the roughly 6-hour drift and repointing cycle, K2 data generally show trends on that time scale, and typically one data point is flagged unsuitable during the repointing (see Vanderburg & Johnson, 2014). The resulting regular gaps, combined with the slow drifts, can result in significant leakage of power towards higher frequencies in the power spectra. This offset can be avoided if the gaps are filled (García et al., 2014; Pires et al., 2015), for which we used linear interpolation for all gaps of up to three consecutive data points. Larger gaps were not filled. The interpolation used only the two points that bracketed each gap. In agreement with García et al. (2014); Pires et al. (2015), we found that the stellar signal was not markedly affected. However, our ability to detect the oscillations was increased, particularly for stars oscillating at relatively high frequencies. This improvement is illustrated by comparing the red and green spectra in Fig. 1. While gap filling should be used with caution, it is generally safe when the gaps are short and few compared to the total number of data points in the light curve (García et al., 2014; Pires et al., 2015). Here, we filled 3–4% of all data points.
For these K2 data, the gap filling results in almost complete removal of peaks in the power spectra at the re-positioning frequency and its harmonics (Fig. 1, dotted lines), which are otherwise disruptive for the automated detection of oscillations and extraction of the global seismic properties. In the following analysis, we use the high-pass filtered, gap-filled light curves.
In future work, we will explore other schemes for directly modelling instrumental variability. In particular, Angus et al. (2015) have recently proposed a scheme that alleviates the need for gap filling in time series data to produce K2 power spectra that are less sensitive to systematic effects.
3. Oscillation analysis
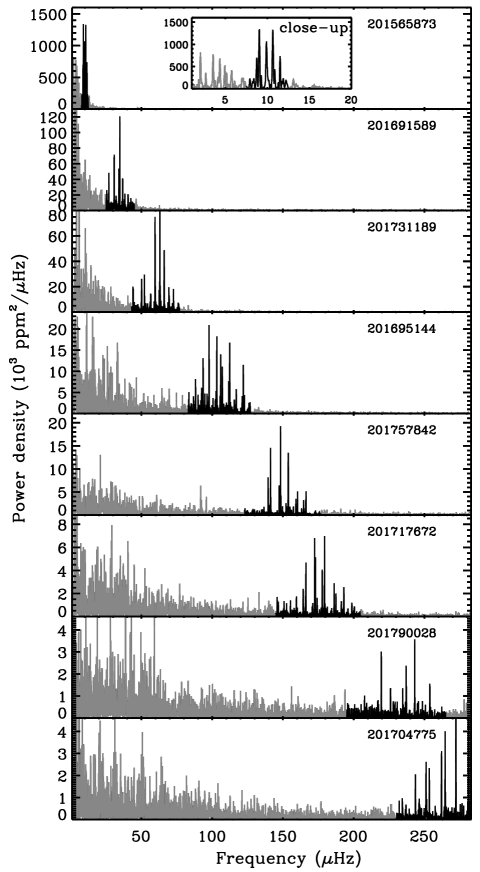
The power spectra of many stars in our sample reveal clear oscillations ranging from low-luminosity giants near the bottom of the red giant branch to stars more luminous than the red clump. The detected oscillations cover the same frequency range as early Kepler light curves of similar length (Huber et al., 2010). Fig. 2 presents power spectra of a representative subset of our sample. In each star, we see the oscillation power excess forming a near regular series of peaks from overtone modes within a broad envelope, from which and can be measured.
We carried out a systematic search for oscillations using the pipeline developed by Huber et al. (2009). After inspecting the power spectra and the diagnostic output from the automated detection algorithm, we classified the stars into three groups. A total of 59 stars provided clear detections of both and , 14 stars were classified marginal, and 44 were non-detections. Marginal detections refer to stars where either or were not determined unambiguously. Non-detections are mostly those stars where we did not find any evidence of oscillations. Some were slowly pulsating (very luminous) giants, which in some cases did show evidence of oscillation power, but due to the small and we are not confident in claiming those as marginal detections. Based on previous experience with Kepler data, most of the marginal detections and almost all of the non-detections extend over regions in - space that render them unlikely to result in measurable and values.
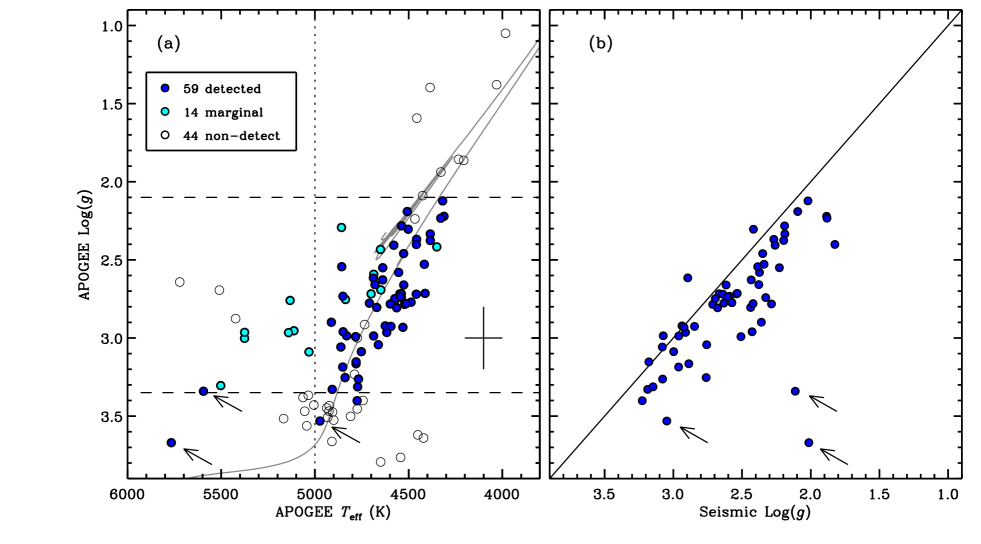
To illustrate this property, we show and from APOGEE in Fig. 3a of all 117 stars in our sample superimposed on a stellar evolutionary track (gray curve) of a 1.2M⊙, roughly solar metallicity MESA model (Paxton et al., 2011, 2013) taken from Stello et al. (2013). From stellar evolution models, we would generally not expect to find giants hotter than K (except for rare extremely metal-poor and/or massive stars. Indeed, previous results from long-term observations by Kepler, showed only two oscillating giants hotter than APOGEE K (Pinsonneault et al., 2014); one on the lower red giant branch and one red clump star out of 1916 stars in total. Our K2 results appear to be in line with those results, and we should therefore discount stars that appear to be hotter than this threshold when assessing our detectability capabilities (Fig. 3a, vertical dotted line). However, we do not advice to apply a selection for future large scale population studies, and only do so here to remove what appears as somewhat incompatible measurements of a few stars in our sample. As mentioned in Section 2, oscillations of stars with Hz cannot be reliably characterized with 80-day time series – the typical length of a K2 campaign. From the 1/2 relation (Brown et al., 1991), this essentially translates into a lower limit on , as indicated by the upper horizontal dashed line (Fig. 3a). Similarly, the cadence of the data (min) results in a Nyquist frequency of about 283Hz, which defines an upper limit on of about 270Hz, and hence on (Fig. 3a, lower horizontal dashed line). Oscillation frequencies above this limit will be too close to the Nyquist frequency, compromising automated robust measurement of both and (Stello et al., 2013). This includes stars oscillating beyond the Nyquist frequency. Again, our K2 results confirm these boundaries, with all but three detected oscillating stars falling within the APOGEE range 2.1–3.35.
Comparing the APOGEE with the asteroseismic values, we see in Fig. 3b that there is an offset of about 0.2 dex between the two, in agreement with the findings of Holtzman et al. (2015). Note that we derived the seismic using the above scaling relation with from APOGEE. We also note a large scatter, and in some cases a very large deviation (stars indicated by arrows). The seismic has a typical internal uncertainty of about 0.03 dex for the length of data used here (Huber et al., 2010), much smaller than can be obtained from spectroscopy. Hence we attribute the scatter in Fig. 3b to the uncertainties in the spectroscopic determinations. This suggests an RMS scatter of 0.2 dex of the spectroscopic , in agreement with Pinsonneault et al. (2014); for a few stars a deviation of up to 1.5 dex is seen. The latter extreme cases could potentially be blends in the K2 data, where a more evolved, intrinsically brighter star with lower is detected seismically, while a less evolved star is the source in the APOGEE spectra. If they are not blends, the two hottest stars marked by arrows must also be much cooler given their seismic signal, which indicates they are evolved red giants more luminous than the red clump. With these uncertainties in mind, we would expect that and in Fig. 3a for some stars are not necessarily representative of their true values. Hence, even in the scenario where we have 100% detection rates, we should find some stars with detected oscillations outside the - region of expected detectable oscillations (Fig. 3a, middle-left region bracketed by the dashed and dotted lines), and some non-detections inside this region; this indeed appears to be the case.
Finally, we examine our success rate in detecting oscillations which, based on the above considerations, needs to be evaluated only for the stars expected to show oscillations. Within the - region of expected detectable oscillations, there are 67 stars, of which 55 are clear detections, 7 are marginal detections, and 5 are non-detections. We note that it is not inconceivable that all 5 non-detections have true values of and that would make them fall outside the detectable region given that we find a similar number of detections outside the detectable region. However, some of these stars could be genuinely non-oscillating red giants suppressed by strong binary interactions (Derekas et al., 2011; Gaulme et al., 2014).
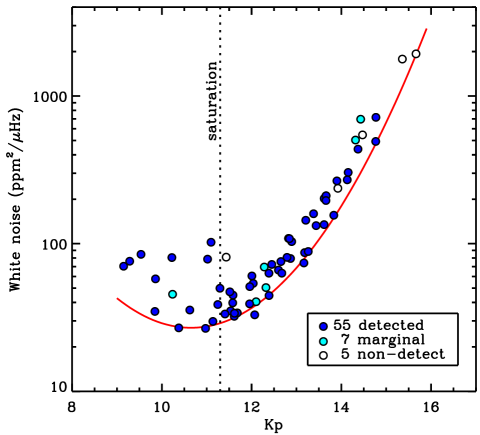
To judge whether the non-detections are simply caused by poor photometry, we show the white noise level versus apparent brightness for all 67 stars in Fig. 4. We see no clear trend between the detection category and the apparent magnitude, and hence noise level, which suggests that the non-detections are not generally caused by noisy photometry. We do see a possible hint of a faint limit at Kp15 mag, but the low number of faint stars prevents any definitive conclusion. However, for the stars with detected oscillations, we calculated the correlation between Kp and seismic and found it to be essentially zero (). Hence, even our least-evolved giants (highest ), which have the smallest oscillation amplitudes, span the entire magnitude range down to . Taking the uncertainty in into account and being conservative, this result suggests that we will be able to detect oscillations in any red giant down to , as long as they are within the required range, which for the seismic is 1.9 – 3.2.
4. Summary and outlook
We have performed initial asteroseismic analyzes of K2 C1 data for over one hundred stars expected to be red giants based on their spectroscopically determined and . We detect oscillations in almost all stars cooler than K within 2.1–3.35 in (on the scale of the ‘raw’ data in Holtzman et al., 2015), which comprise the target stars of ongoing K2-based galactic archaeology studies. The results indicate that our detection rate is complete down to , represented by the faintest oscillating star in our sample () – a low-luminosity and hence low-intrinsic-amplitude giant with a detected of 150Hz. More stars fainter than need to be analyzed in order to determine the true faint limit, which will set the limit for a magnitude-complete sample of red giants within the 1.9–3.2 range in seismic . Knowing this selection function is crucial for galactic archaeology.
We note that the characteristic timescale for the spacecraft attitude control system to react to pointing errors was adjusted from C3 onwards to obtain lower pointing jitter (by about a factor of 3-4), which is expected to result in a total noise level only 30% higher than in the original Kepler mission (Doug Caldwell, private communication). We anticipate that this would push the faint end of the detection limit to even fainter stars than the C1 results reported here.
Looking ahead, the prospects for characterizing oscillations in red giants using K2 data are very promising. We can expect to be magnitude complete in our detection rates down to , and possibly fainter in future campaigns, which is strong affirmation for using red giants as distant probes of the Galaxy’s structure and evolution out to at least kpc. Of order 5000–10000 targets have already been observed during each of the first five K2 observing campaigns, and similar numbers are expected to follow throughout its mission, providing several tens of thousands of red giants with detected oscillations. This sample will grow even further with the launch of NASA’s next all-sky planet-finding mission, TESS (Ricker et al., 2014), and on the time scale of a decade we can expect significant boosts in sample size from missions like WFIRST (Gould et al., 2015a), Euclid (Gould et al., 2015b), and PLATO (Rauer et al., 2014).
References
- Alam et al. (2015) Alam, S., et al. 2015, ArXiv e-prints
- Angus et al. (2015) Angus, R., Foreman-Mackey, D., & Johnson, J. A. 2015, ArXiv e-prints
- Brown et al. (1991) Brown, T. M., Gilliland, R. L., Noyes, R. W., & Ramsey, L. W. 1991, ApJ, 368, 599
- Casagrande (2015) Casagrande. 2015, apJ, in press
- Chaplin (2015) Chaplin. 2015, pASP, in press
- Chaplin et al. (2011) Chaplin, W. J., et al. 2011, Science, 332, 213
- Conroy et al. (2014) Conroy, K. E., et al. 2014, PASP, 126, 914
- Crossfield et al. (2015) Crossfield, I. J. M., et al. 2015, ApJ, 804, 10
- Derekas et al. (2011) Derekas, A., et al. 2011, Science, 332, 216
- Eisenstein et al. (2011) Eisenstein, D. J., et al. 2011, AJ, 142, 72
- García & Stello (2015) García, R. A., & Stello, D. 2015, in Extraterrestrial Seismology, V. C. H. Tong, R. A. García (eds.) 2015 Cambridge: Cambridge University Press
- García et al. (2014) García, R. A., et al. 2014, A&A, 568, A10
- Gaulme et al. (2014) Gaulme, P., Jackiewicz, J., Appourchaux, T., & Mosser, B. 2014, ApJ, 785, 5
- Gould et al. (2015a) Gould, A., Huber, D., Penny, M., & Stello, D. 2015a, Journal of Korean Astronomical Society, 48, 93
- Gould et al. (2015b) Gould, A., Huber, D., & Stello, D. 2015b, ArXiv e-prints
- Gunn et al. (2006) Gunn, J. E., et al. 2006, AJ, 131, 2332
- Hekker et al. (2012) Hekker, S., et al. 2012, A&A, 544, A90
- Holtzman et al. (2015) Holtzman, J. A., et al. 2015, ArXiv e-prints
- Howell et al. (2014) Howell, S. B., et al. 2014, PASP, 126, 398
- Huber et al. (2009) Huber, D., Stello, D., Bedding, T. R., Chaplin, W. J., Arentoft, T., Quirion, P., & Kjeldsen, H. 2009, Communications in Asteroseismology, 160, 74
- Huber et al. (2010) Huber, D., et al. 2010, ApJ, 723, 1607
- Jeffery & Ramsay (2014) Jeffery, C. S., & Ramsay, G. 2014, MNRAS, 442, L61
- Lund et al. (2015) Lund, M. N., Handberg, R., Davies, G. R., Chaplin, W. J., & Jones, C. D. 2015, ApJ, 806, 30
- Majewski et al. (2010) Majewski, S. R., Wilson, J. C., Hearty, F., Schiavon, R. R., & Skrutskie, M. F. 2010, in IAU Symposium, Vol. 265, IAU Symposium, ed. K. Cunha, M. Spite, & B. Barbuy, 480–481
- Miglio et al. (2009) Miglio, A., et al. 2009, A&A, 503, L21
- Miglio et al. (2013) —. 2013, MNRAS, 429, 423
- Montet et al. (2015) Montet, B. T., et al. 2015, ArXiv e-prints
- Nardiello et al. (2015) Nardiello, D., et al. 2015, MNRAS, 447, 3536
- Nidever et al. (2015) Nidever, D. L., et al. 2015, ArXiv e-prints
- Paxton et al. (2011) Paxton, B., Bildsten, L., Dotter, A., Herwig, F., Lesaffre, P., & Timmes, F. 2011, ApJS, 192, 3
- Paxton et al. (2013) Paxton, B., et al. 2013, ApJS, 208, 4
- Pinsonneault et al. (2014) Pinsonneault, M. H., et al. 2014, ApJS, 215, 19
- Pires et al. (2015) Pires, S., Mathur, S., García, R. A., Ballot, J., Stello, D., & Sato, K. 2015, A&A, 574, A18
- Ramsay & Doyle (2015) Ramsay, G., & Doyle, J. G. 2015, MNRAS, 449, 3015
- Rauer et al. (2014) Rauer, H., et al. 2014, Experimental Astronomy, 38, 249
- Ricker et al. (2014) Ricker, G. R., et al. 2014, in Society of Photo-Optical Instrumentation Engineers (SPIE) Conference Series, Vol. 9143, Society of Photo-Optical Instrumentation Engineers (SPIE) Conference Series, 20
- Sanchis-Ojeda et al. (2015) Sanchis-Ojeda, R., et al. 2015, ArXiv e-prints
- Stello et al. (2009) Stello, D., Chaplin, W. J., Basu, S., Elsworth, Y., & Bedding, T. R. 2009, MNRAS, 400, L80
- Stello et al. (2013) Stello, D., et al. 2013, ApJ, 765, L41
- Szabó et al. (2015) Szabó, R., et al. 2015, AJ, 149, 112
- Vanderburg & Johnson (2014) Vanderburg, A., & Johnson, J. A. 2014, PASP, 126, 948
- Vanderburg et al. (2015) Vanderburg, A., et al. 2015, ApJ, 800, 59
- Wilson et al. (2010) Wilson, J. C., et al. 2010, in Society of Photo-Optical Instrumentation Engineers (SPIE) Conference Series, Vol. 7735, Society of Photo-Optical Instrumentation Engineers (SPIE) Conference Series, 1
- Zasowski et al. (2013) Zasowski, G., et al. 2013, AJ, 146, 81