Pulsed excitation of Rydberg-atom–pair states in an ultracold Cs gas
Abstract
Pulsed laser excitation of a dense ultracold Cs vapor has been used to study the pairwise interactions between Cs atoms excited to p3/2 Rydberg states of principal quantum numbers in the range . Molecular resonances were observed that correspond to excitation of Rydberg-atom–pair states correlated not only to the pp3/2 dissociation asymptotes, but also to ss1/2, sfj, and ff dissociation asymptotes. These pair resonances are interpreted as arising from dipole-dipole, and higher-order long-range-interaction terms between the Rydberg atoms on the basis of i) their spectral positions, ii) their response to static and pulsed electric fields, and iii) millimeter-wave spectra between pair states correlated to different pair-dissociation asymptotes. The Rydberg-atom–pair states were found to spontaneously decay by Penning ionization and the dynamics of the ionization process were investigated during the first 15 s following initial photoexcitation. To interpret the experimental observations, a potential model was derived that is based on the numerical determination of the eigenvalues and eigenfunctions of the long-range interaction Hamiltonian. With this potential model, which does not include adjustable parameters, all experimental observations could be accounted for, and the results demonstrate that long-range-interaction models provide a global and accurate description of interactions in ultracold Rydberg gases and that they correctly account for, and enable the analysis of, phenomena as diverse as the formation of Rydberg macrodimers, Penning ionization in dense Rydberg gases, and Rydberg-excitation blockade effects.
I Introduction
Long-range interactions between atoms in high Rydberg states are the origin of many scientific applications involving Rydberg excitation of ultracold atoms. The long-range van der Waals and resonant dipole-dipole interactions between high- Rydberg states lead to effects such as the Rydberg excitation blockade Singer et al. (2004); Tong et al. (2004); Vogt et al. (2006); Urban et al. (2009) that might be utilized in realizing scalable quantum gates for quantum information processing Lukin et al. (2001); Møller et al. (2008); Isenhower et al. (2010); Saffman et al. (2010), the evolution of ultracold Rydberg gases to ultracold plasmas Li et al. (2004), as well as strongly nonlinear optical processes Peyronel et al. (2012); Dudin and Kuzmich (2012), e.g., to generate single photons. While many of the recent experiments with ultracold Rydberg atoms rely on the interactions between the excited atoms, few experiments directly probe the potential-energy structure of the interacting Rydberg gas.
Rydberg-Rydberg interactions were first observed as density-dependent line broadening in the excitation of Cs atoms in a beam Raimond et al. (1981). The effects of these interactions became easier to observe in experiments on ultracold atoms because these enable much longer interaction times under conditions where the interatomic potential energy dominates the dynamics of the system. Asymmetric line shapes and interaction-induced shifts have been observed, e.g., in millimeter-wave spectra of transitions between Rydberg states Han and Gallagher (2009). Direct measurements of the long-range van der Waals and the resonant dipole-dipole interaction between two localized Rydberg atoms as a function of the interatomic separation were only reported recently Ravets et al. (2014); Béguin et al. (2013).
We present experiments in which Cs Rydberg-atom pairs are detected as sharp resonances in laser-excitation spectra of ultracold, dense samples of Cs. The resonances are assigned and quantitatively analyzed using a model describing the interactions between Cs Rydberg atoms using long-range molecular potential curves that do not involve any adjustable parameters. Our experiments involve the pulsed excitation of pairs of interacting Cs Rydberg atoms with intense laser fields and enable the observation of molecular states connected to different pair-dissociation asymptotes. Whereas in our experiments only p Rydberg states are accessible by selection rules for isolated atoms, Rydberg states can be observed as resonances near ss1/2, sfj, and ffj asymptotes as a result of dipole-dipole, dipole-quadrupole Deiglmayr et al. (2014), and higher-order terms of the multipole expansion series. Our observations are related to earlier work describing similar phenomena in ultracold Rydberg gases of rubidium Farooqi et al. (2003); Stanojevic et al. (2006, 2008); Samboy and Côté (2011) and cesium Overstreet et al. (2007, 2009) at values of the principal quantum number around 70. Compared to these previous investigations of molecular resonances, we study these resonances, referred to as pair resonances hereafter, at lower principal quantum numbers in the range . Additionally to pair resonances observed in the immediate vicinity of dissociation thresholds, we also observe sharp spectral structures originating from local maxima in the molecular potentials and from avoided crossings between different potential curves for . The positions, widths and relative intensities of these resonances are sensitive to the details of the molecular potentials at long range. We exploit this sensitivity to validate our Rydberg-atom–pair interaction model, which we then use to describe the Penning ionization processes that take place in our dense Rydberg gas on timescales of several hundreds of nanoseconds, and the asymmetric broadening observed in millimeter-wave transitions between pairs of Rydberg atoms.
This paper is organized as follows: The experimental apparatus and the measurement techniques are described in Section II. The experimental results are presented in Section III. The Rydberg-pair-interaction model we developed to account for the experimental observations is presented in Section IV. The main aspects of the paper are summarized in Section V and details concerning the calculations are presented in the appendix.
II Experimental
All experiments are performed on ultracold samples of cesium atoms at a density of , a particle number of , and a translational temperature of K. The samples are released from a far-detuned crossed optical dipole trap ( nm, Watt, m 1/ radius) which is loaded from a magneto-optical trap (MOT) Saßmannshausen et al. (2013). The transfer from the MOT to the dipole trap proceeds as follows: After a MOT-loading phase of ms, the fiber laser used for the dipole trap is turned on and, simultaneously, the magnetic-field gradient is ramped up, compressing the MOT for 10 ms. The magnetic field is then turned off and the atoms are cooled in an optical-molasses phase for 5 ms. The MOT lasers are then turned off and the atoms are optically pumped into the lower hyperfine component of the 6s1/2 electronic ground state. The atoms are held in the dipole trap for 10 ms, during which time the noncaptured atoms can leave the photoexcitation region. The power of the optical-dipole-trap laser is reduced to its minimum value of 300 mW after the cesium atoms in the optical dipole trap have been selectively pumped optically into the upper hyperfine state of the 6s1/2 ground state, from where they are photoexcited in single-photon transitions to p3/2 Rydberg states. The experimental cycle is repeated at a rate of 10 Hz.
The excitation laser is a frequency-doubled pulse-amplified ring dye laser (Coherent 899-21) delivering 4.4-ns-long Fourier-transform-limited UV pulses ( nm, 140 MHz bandwidth) with pulse energies of up to 100 J. The laser is focused to a spot size of m (1/e2 radius) resulting in peak irradiances of up to 100 MW/cm2. The laser frequency is calibrated with a wavemeter (High Finesse WS6-200). We have also employed single-color two-photon excitation of ss1/2 transitions using the pulse-amplified fundamental output of the ring laser at a wavelength of nm and a pulse energy of mJ.
Transitions are detected by monitoring the Cs+ ion signal using a microchannel-plate (MCP) detector after state-selective pulsed-field ionization (PFI). For PFI, we employ a pulsed electric field with a rise time of 1 s and maximal field strength kV/cm. Only p Rydberg states with can be field ionized under these conditions. We also observe the formation of ions on molecular resonances for Rydberg states with , but only after introducing some delay between laser and electric-field pulse. After PFI and before the next MOT-loading phase, the atom cloud is characterized by saturated-absorption imaging. From the images, values for the particle numbers and densities are derived. On the atomic resonances the trap is fully depleted and the resulting ion signals strongly saturate our detection system, which is designed to be sensitive to single ions. The spectral positions of the atomic transitions are obtained from trap-loss spectra based on the saturated-absorption images.
Millimeter-wave transitions between Rydberg states excited on atomic or pair resonances are measured using a millimeter-wave source consisting of a swept frequency synthesizer (Wiltron, Model 6769B) connected to an amplifier-multiplier chain (Virginia Diodes, WR6.5AMC, tunable range 110 - 170 GHz). Typical interaction times with the millimeter-wave radiation are s and the transitions are detected using state-selective PFI and separating initial and final Rydberg states in the Cs+-ion time-of-flight (TOF) traces.
Regular measurement and compensation of the stray electric and magnetic fields during the data acquisition period ensured that the magnitude of the stray electric and magnetic fields never exceeded 20 mV/cm and 20 mG, respectively, which is sufficiently low that these fields do not influence the behavior of the Rydberg states we study. The electric field was compensated by measuring and minimizing the quadratic Stark effect of high p3/2 Rydberg states Saßmannshausen et al. (2013) and the magnetic field was compensated by measuring the Zeeman splitting of the clock transition of the 6s1/2 state using microwave spectroscopy.
III Experimental results and discussion
III.1 Excitation of dipole-coupled pair states
The experimental spectra presented in this section were recorded by monitoring the Cs+-ion yield resulting from the spontaneous ionization of the Rydberg atoms taking place in the first 5 s following photoexcitation in the dense ultracold sample as a function of the UV-laser frequency. Because of a Cooper minimum in the photoexcitation cross section from the 6s1/2 ground state of Cs to the p1/2 (p1/2) states (continuum) with center located just above the ionization threshold Raimond et al. (1978), transitions to p1/2 Rydberg states are more than 500 times weaker than to the corresponding p3/2 Rydberg states. Consequently, the experiments focus on the p3/2 states. To facilitate the comparison between spectra recorded in the vicinity of different ps1/2 transitions, the origins of the frequency scale of the different spectra presented in the following are always set at the positions of the atomic resonances.
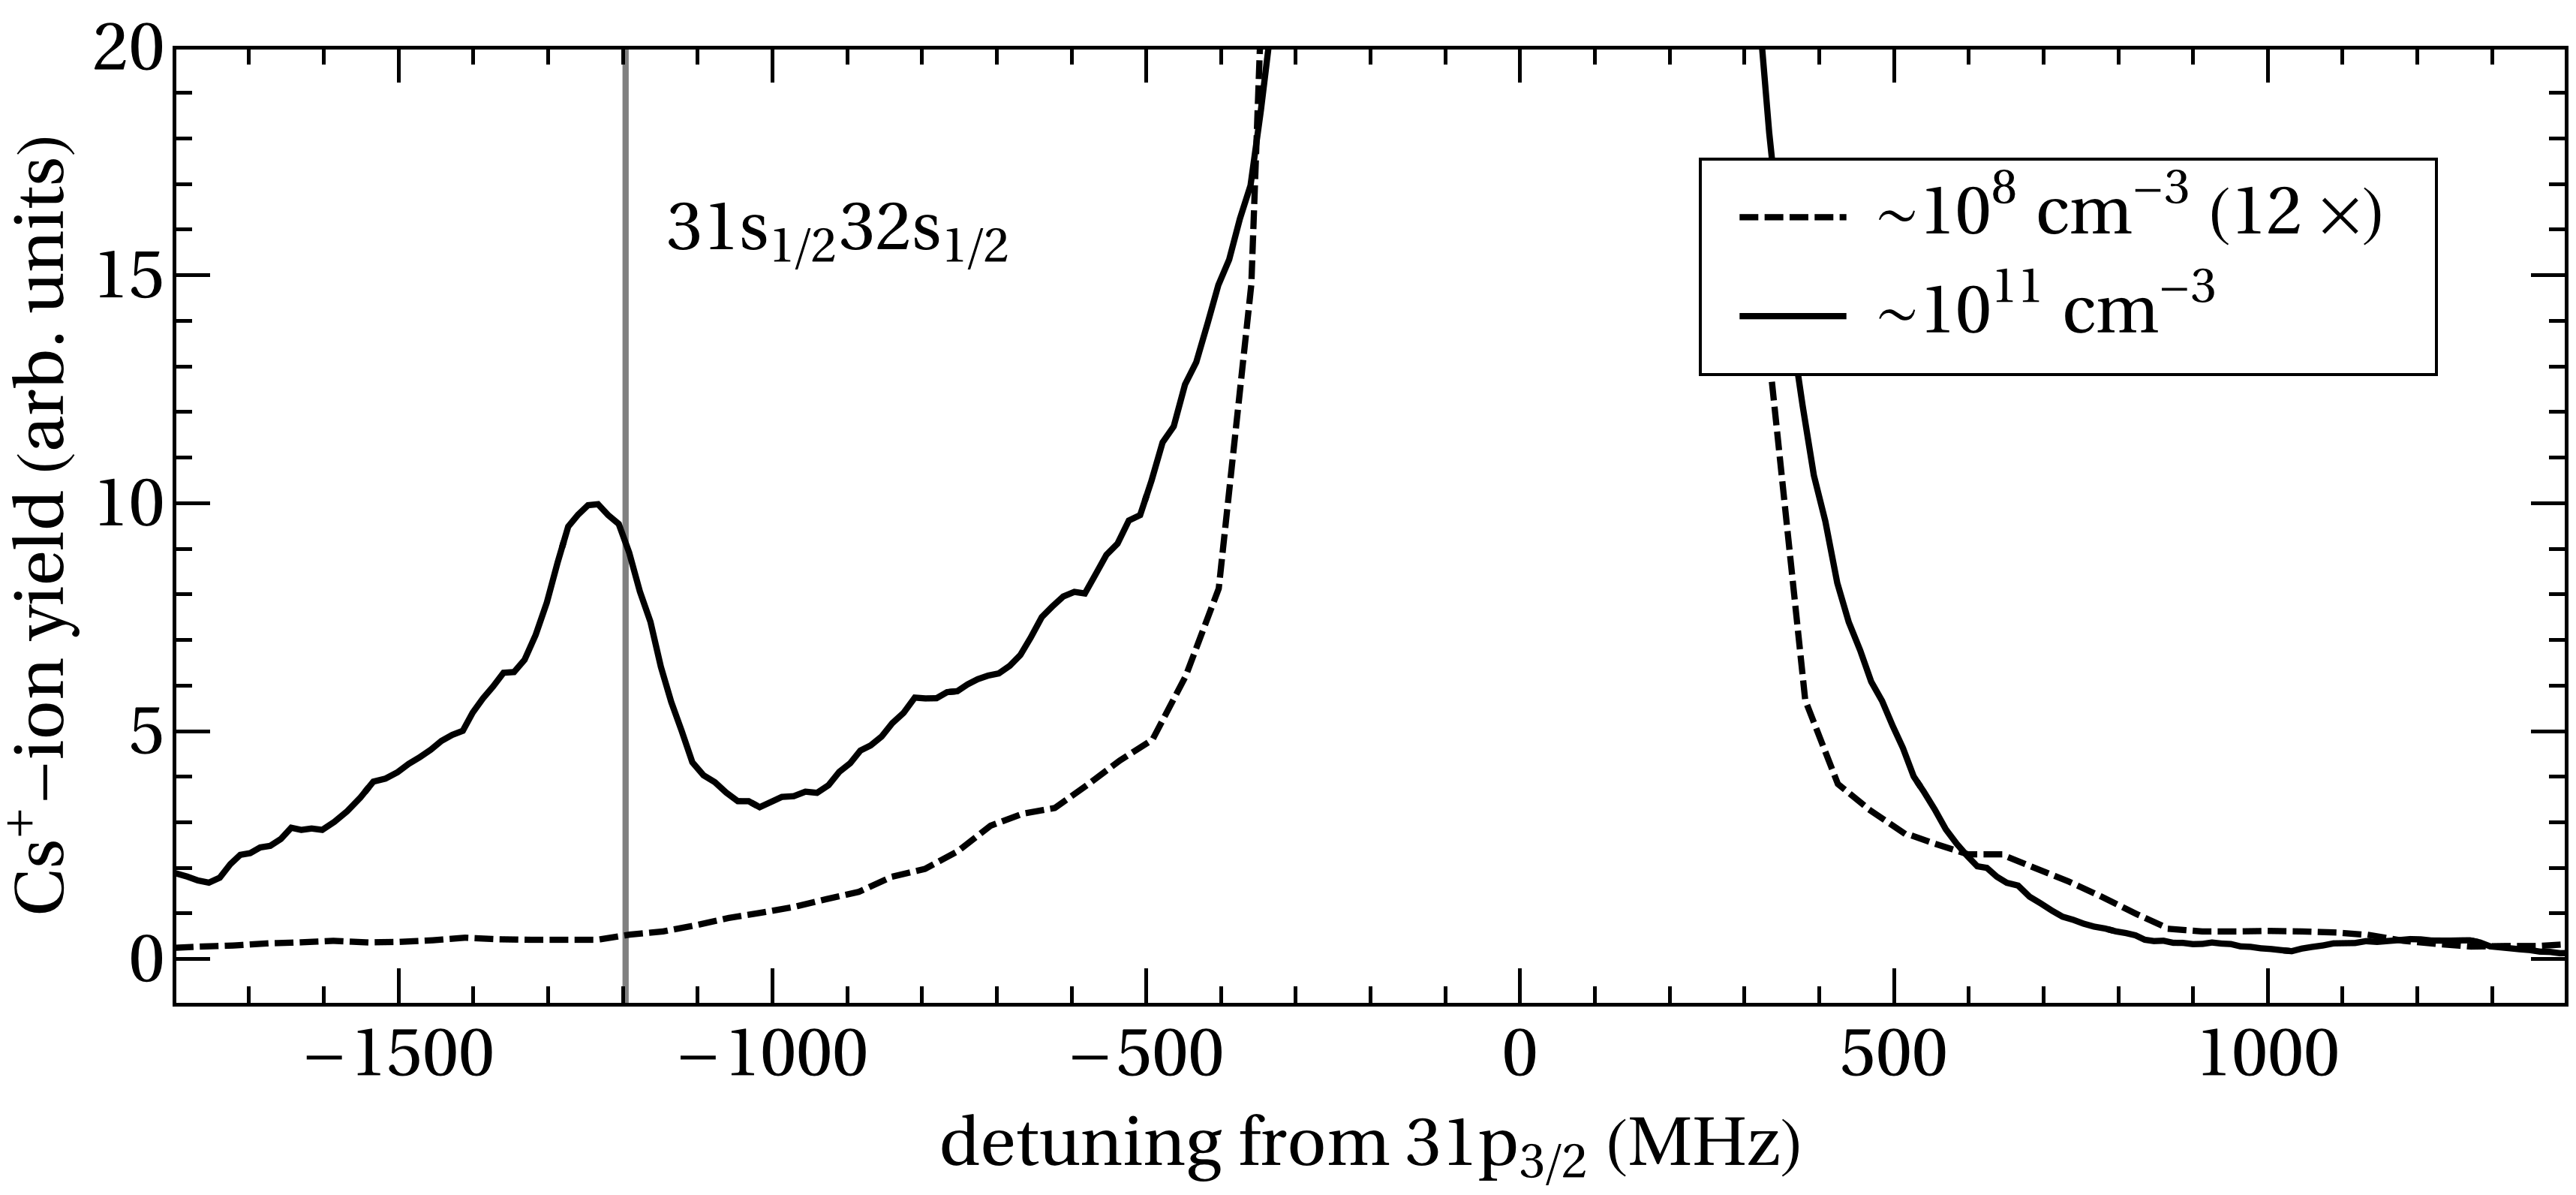
Fig. 1 compares two spectra of the 31ps1/2 transition recorded at a ground-state–atom density of atoms/cm3 (dashed line, sample obtained by releasing the atoms from the MOT and letting them expand) and of atoms/cm3 (full line, sample obtained after release from the optical dipole trap). In both spectra, the atomic 31ps1/2 transition is strongly saturated. The spectrum measured at lower atom density has been scaled up to match the wings of the 31ps1/2 transition recorded at higher atom density. In the latter spectrum, an additional resonance is observed at a detuning of MHz. The spectral position of this resonance cannot be assigned to any isolated-atom transition in Cs but matches closely the asymptotic energy of the 31ss1/2 pair state if one assumes a two-photon excitation, for which the actual detuning is MHz). The resonance has a red-degraded asymmetric line shape and a full width at half maximum (FWHM) of MHz.
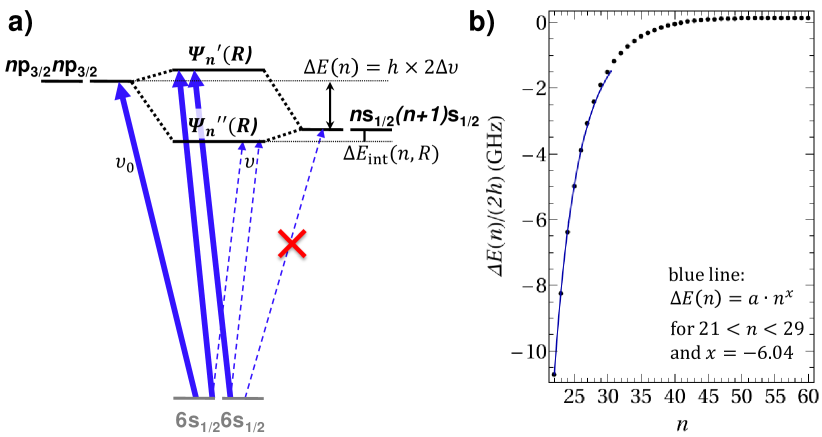
In the absence of interactions between the Rydberg atoms, the single-color two-photon excitation of the 31ssss1/2 transition is prohibited because pure transitions are forbidden by the Laporte rule. However, under our experimental conditions, long-range interactions between the Rydberg atoms can lead to state mixing, especially between energetically close-lying dipole-dipole-coupled pair states such as the ss1/2 and the pp3/2 states, as schematically depicted in Fig. 2a. The molecular shifts induced by the long-range interactions are expected to be small and resonances occur close to the ss1/2 asymptotes. The dependence of the pair-state asymptote positions with respect to the atomic p3/2 resonance positions can be calculated as
| (1) |
with
| (2) |
In Equation (2), MHz is the Rydberg constant of Cs and are the - and weakly - and -dependent quantum defects. The dependence of the quantum defects can be expressed with the Ritz formula Ritz (1908)
| (3) |
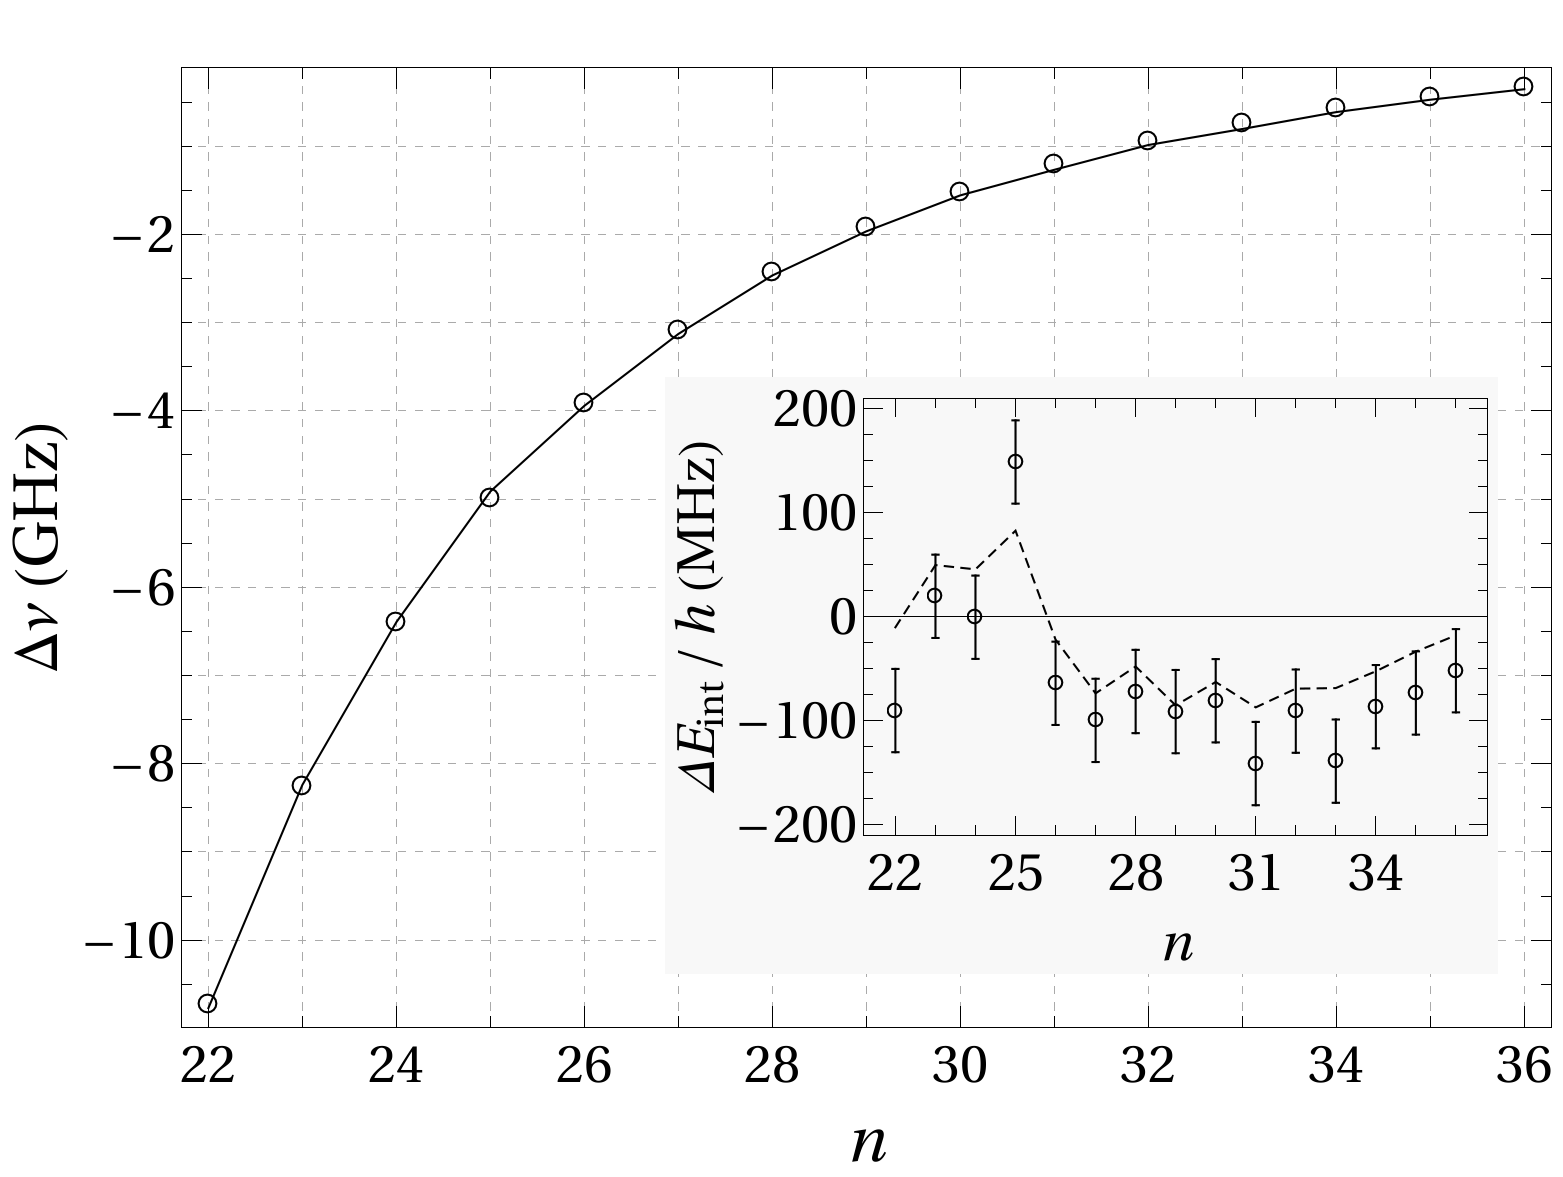
The parameters and are taken from the literature Goy et al. (1982). The detuning of the pair asymptotes decreases rapidly in the range from to , where the detuning changes sign. In the range of values investigated, approximately scales as (see fit shown as blue line in Fig. 2b).
Because the frequency required for the two-photon excitation of the pair resonance is detuned from the atomic ps1/2 resonance, the two-photon resonance can only be observed at the high laser power achievable with a pulse-amplified laser system. It is also necessary to have a high ground-state-atom density to have a sufficient number of atom pairs at distances where the dipole-dipole interaction is strong enough to induce the state mixing illustrated in a simplified 2-level model in Fig. 2a). No pair resonances could be observed in spectra recorded with a 100 mW continuous-wave UV laser under otherwise similar experimental conditions Saßmannshausen et al. (2015).
Rydberg-excitation spectra in the vicinity of p transitions for are displayed in Fig. 3. At each value, we observe resonances on the low-frequency side of the atomic transitions that can be attributed to the two-photon excitation of two atoms to interacting pair states correlated to the ss1/2 asymptotes. The positions of these asymptotes calculated with Eq. (2) are marked by vertical gray lines in Fig. 3.
For all values for which measurements could be performed, i.e., for , pair resonances are observed within MHz of the positions of the ss1/2 asymptotes. The deviations are displayed on a magnified scale in the inset of Fig. 4 (open circles). In most cases, the deviations are negative, which indicates that the pair resonances are typically located on the low-frequency side of the asymptotes, which is characteristic of attractive molecular potentials. The measurement at represents an exception and reveals a pair resonance located MHz above the 25ss1/2 asymptote. These shifts from the asymptotes, though small, are real and will be discussed in more detail in Section IV.
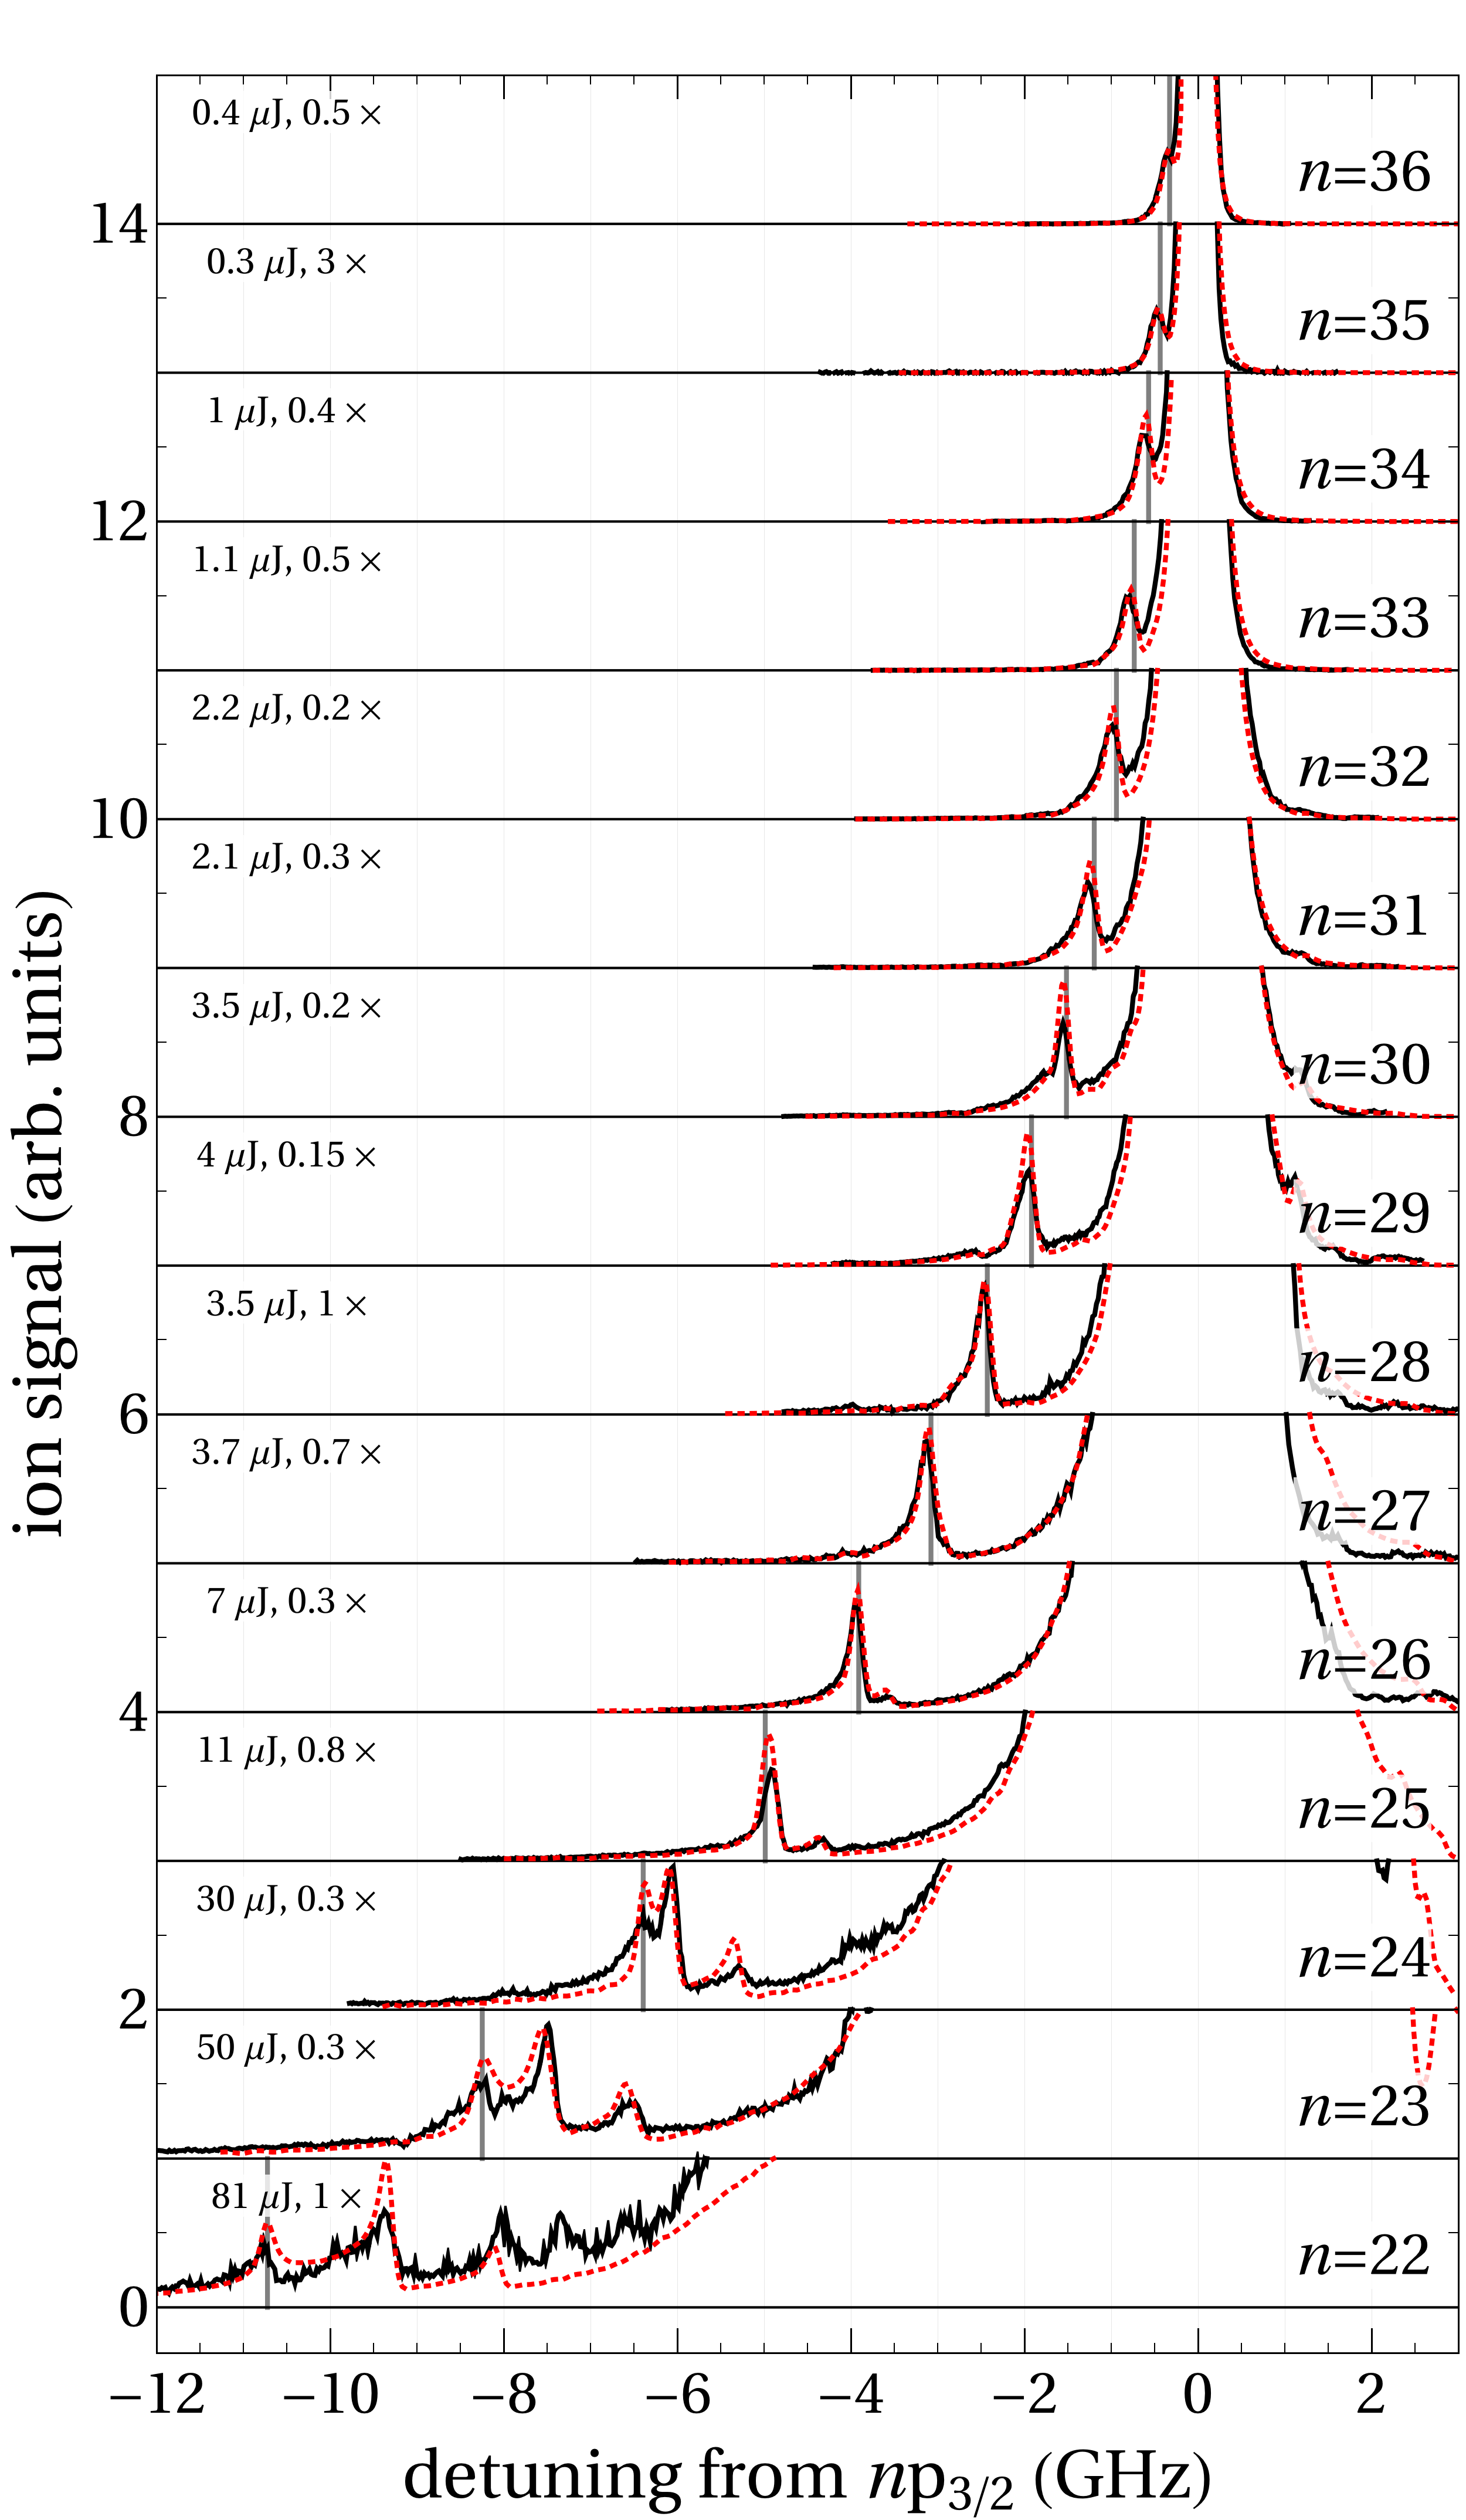
The increasing detuning of the pair resonances from the atomic transitions (Fig. 2) and the decreasing interaction strength with decreasing values lead to significantly smaller pair-state signals at lower values. This effect is compensated by using higher pulse energies in the excitation, as indicated on the left-hand side of Fig. 3. At the lowest values for which the Rydberg-atom–pair resonances could be observed ( in Fig. 3), we also observe additional structures on their high-frequency side. These structures are discussed in more detail in Section IV. The dipole-quadrupole pair resonances presented in Ref. Deiglmayr et al. (2014) are located at smaller detunings and are off the vertical scale of the panels of Fig. 3.
The close agreement between the positions of the ss1/2 asymptotes and the molecular resonances near the ps1/2 atomic transitions in high-density samples (see Figs. 1 and 3) strongly suggests that the mechanism responsible for their observation is the dipole-dipole-coupling mechanism illustrated schematically in Fig. 2a). Further evidence for this mechanism was obtained from the measurement of the Stark effect and of millimeter-wave transitions discussed in the next subsections.
III.2 Stark effect of the ss1/2 and pp3/2 pair states
The atomic s and p Rydberg states of Cs exhibit quadratic Stark shifts in small external electric fields because these states have large quantum defects and are well separated from other Rydberg states of opposite parity. Therefore, when a small external electric field of strength is applied, one expects the positions of the ps1/2 transitions (and hence the positions of the pp3/2 asymptotes) to be shifted by and the positions of the ss1/2 asymptotes to be shifted by in UV spectra of the type depicted in Figs. 1 and 3. The polarizabilities are negative and much larger for p3/2 Rydberg states than for s1/2 Rydberg states of the same value. Consequently, a measurement of the Stark shifts of the pair resonances at low fields, for which the Stark shift is quadratic, enables one to distinguish between pair states of pp3/2 and ss1/2 character. The different polarizabilities of these two pair states can also be used to bring them into resonance with electric fields and to observe effects of resonant dipole-dipole interactions, which scale as Westermann et al. (2006); Vogt et al. (2006); Gurian et al. (2012). For the measurements relevant for this investigation, the dipole-dipole interaction between pp3/2 and ss1/2 pair states is nonresonant and of shorter range (scaling with ) so that the measurement of the pair-state Stark shifts necessitates high laser intensities and high atom densities.
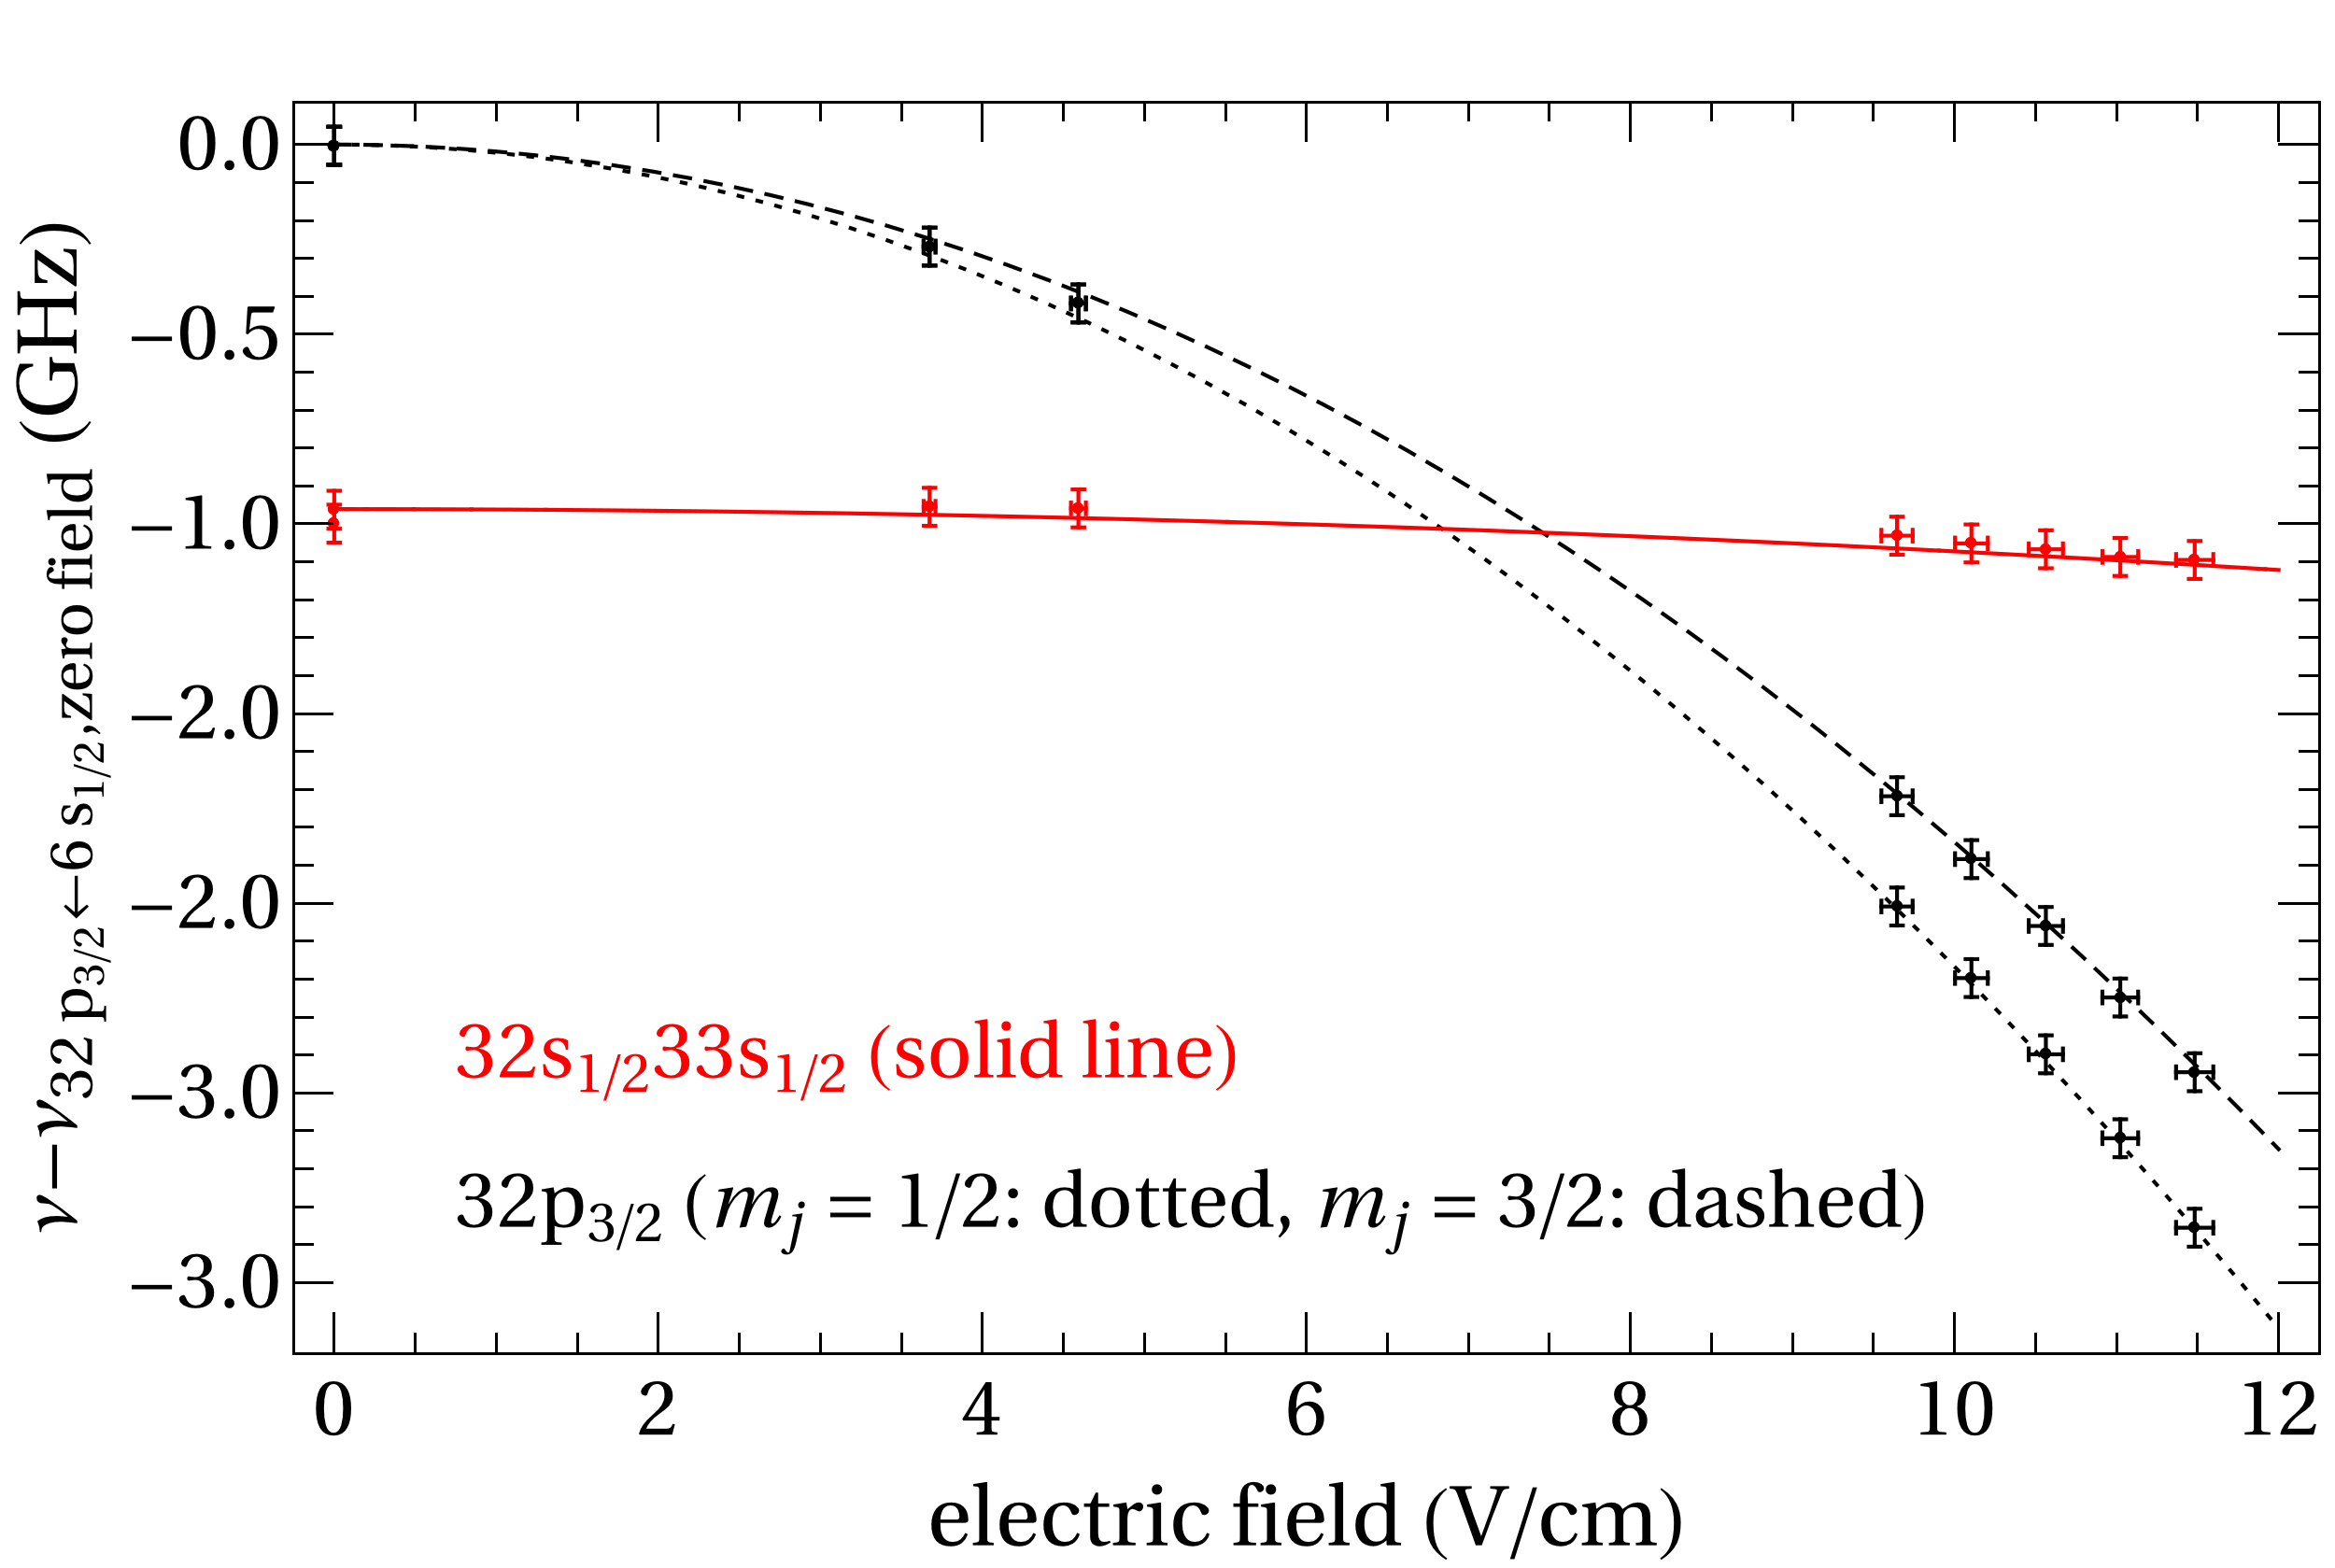
We have measured Rydberg excitation spectra of Cs in the vicinity of the 32ps1/2 transition in weak external electric fields between 0 V/cm and 12 V/cm. The electric-field strength was varied by applying different electric potentials to sets of electrodes surrounding the ultracold atoms, as described in Ref. Saßmannshausen et al. (2013). The measured spectra have the same general appearance as the spectra depicted in Fig. 3, but the strong atomic and weak pair resonances are shifted by the quadratic Stark effect, and the atomic resonance splits into the two magnetic components with and . All measured positions with respect to the field-free 32ps1/2 atomic transition frequency are plotted as a function of the applied electric field in Fig. 5, where the black and red dots correspond to the atomic and pair resonances, respectively. The observed quadratic Stark shift and splitting of the 32p3/2 Rydberg state was used to calibrate the applied electric field by comparison to the calculated Stark shifts of the (dashed line) and (dotted line) components of the 32p3/2 state. The Stark shift of the 32ss1/2 pair state is much smaller and matches the average of the calculated Stark shifts of two noninteracting atoms in the 32s1/2 and 33s1/2 states (red line in Fig. 5) within the experimental uncertainty. The 32pp3/2 and the 32ss1/2 asymptotic energies are degenerate at an electric field of V/cm. At higher electric-field strengths, we observe the 32ss1/2 resonance on the high-frequency side of the transitions to the 32p states. The agreement between measured and calculated Stark shifts indicates that the Rydberg atoms excited at the positions of the pair resonances have predominantly s1/2 character and that the pairs are excited close to their asymptote, at long range.
III.3 Millimeter-wave spectroscopy of transitions between Rydberg-atom–pair states

The ability to observe well-resolved transitions to ss1/2 dipole-dipole-coupled pair states with good signal-to-noise ratio offers the possibility to further characterize these states by studying transitions to neighboring dipole-dipole-coupled states using millimeter-wave radiation. In a similar fashion microwave transitions between pairs of Rb Rydberg atoms were studied by Y. Yu et al. Yu et al. (2013).
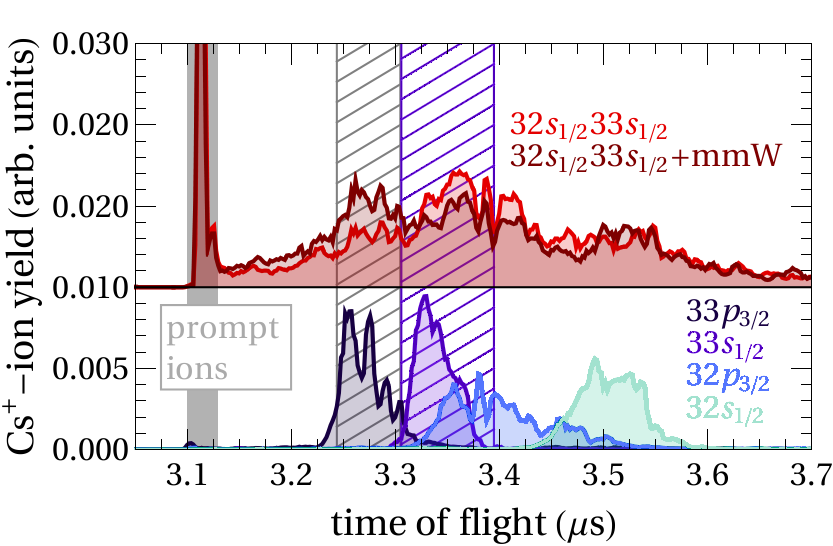
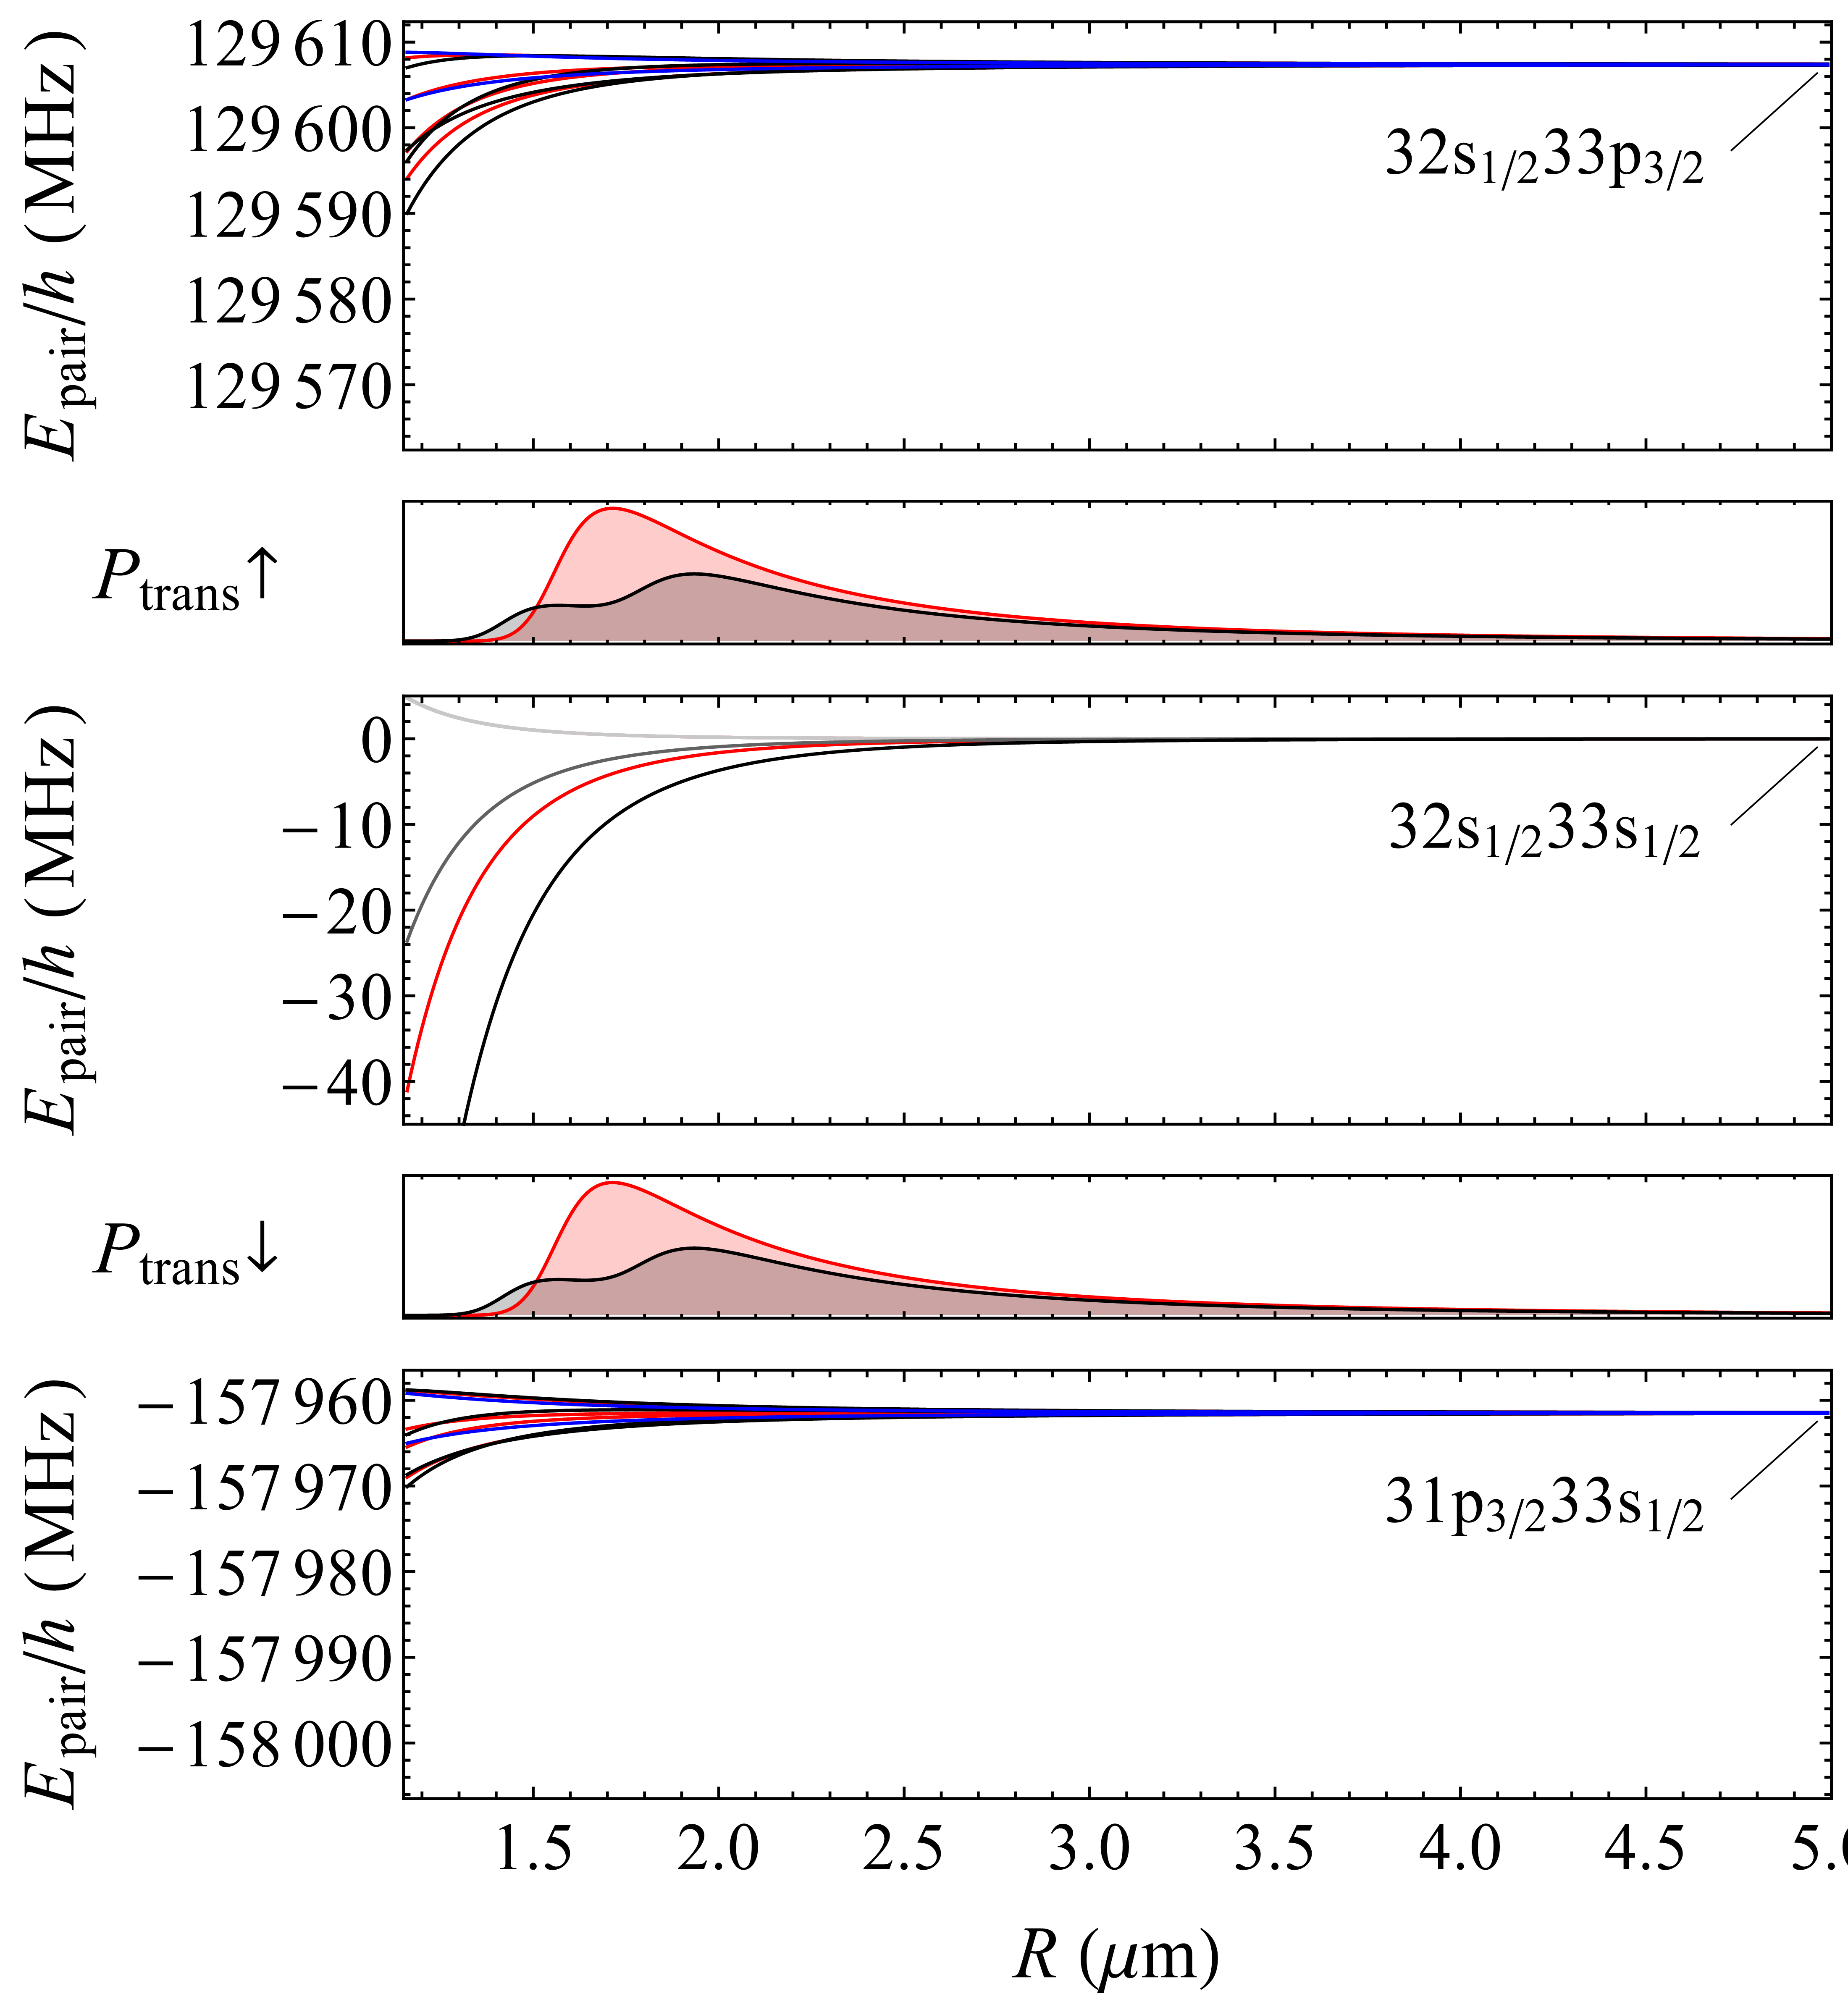
At large internuclear distances, one expects the most intense transitions to be those to pair states located near spj and ps1/2 asymptotes, where the values of the principal quantum numbers and are close to the value of . Our investigation focused on the 32ss1/2 pair state and on the millimeter-wave transitions to the pair states near the 32sp3/2 and 31ps1/2 asymptotes, which lie 129611 MHz above, and 157962 MHz below the 32ss1/2 asymptote, respectively (see Fig. 6a)). The detection of the millimeter-wave transitions was achieved by delayed pulsed-field ionization with a slowly rising electric-field ramp (rise time 1 s) and monitoring the Cs+-ion time-of-flight (TOF) spectra. To calibrate the TOF spectra, experiments were first performed in low-density samples following single-photon laser excitation to the p3/2 () and nonresonant single-color two-photon excitation to the s1/2 () Rydberg states of Cs. The resulting Cs+ TOF traces are displayed in the lower panel of Fig. 7 and reveal distinct maxima for the four Cs Rydberg states. This state selectivity makes it possible to record millimeter-wave spectra of the 33ps1/2 and 32sp3/2 transitions by monitoring the Cs+-ion signal at the corresponding TOF positions as illustrated by the spectra displayed as dotted lines in Fig. 6b) and c), respectively. The lines in these spectra have a near-Fourier-transform-limited width of 2 MHz.
The Cs+-ion TOF spectrum obtained at the position of the 32ss1/2 pair resonance and a delay of 1 s between the laser and the electric-field pulse is displayed as red trace in the upper panel of Fig. 7. It consists of an intense sharp peak at early times which is attributed to Cs+ ions produced before the electric-field pulse (the dynamics of the ionization process is discussed in Section III D), and a broad distribution with only weak maxima at the positions expected for the pulsed-field ionization of the atomic 32s1/2 and 33s1/2 states.
Compared to the TOF spectra recorded for the noninteracting Cs Rydberg gas, the state selectivity of the pulsed-field-ionization process is reduced. The reduction is attributed at least in part to adiabatic traversals of the curve crossings between different pair states, e.g. between the 32ss1/2 and 32pp3/2 states (see Fig. 5) before and as the electric field is ramped up. A similar observation was made by Han and Gallagher in their study of the field-ionization dynamics in an ultracold Rb Rydberg gas (see in particular their Fig. 4 in Ref. Han and Gallagher (2008)). The reduced state selectivity of the field ionization causes a millimeter-wave-radiation-independent background signal at the TOF positions corresponding to the 31p3/2 and 33p3/2 Rydberg states, which makes the recording of millimeter-wave spectra of the psspss1/2 transitions difficult. However, comparing the Cs+-ion TOF spectrum recorded with and without millimeter-wave radiation under otherwise identical conditions reveals a weak enhancement of the 33p3/2 PFI signal and a weak depletion of the 33s1/2 PFI signal when the millimeter-wave frequency is tuned to the 33ps1/2 resonance (see Fig. 7).
The ion-signal ratios at the TOF positions of the 33p3/2 and 33s1/2 states and at the positions of the 31p3/2 and 32s1/2 states were used to record millimeter-wave spectra of the transitions from the 32ss1/2 pair state to regions near the 32sp3/2 and 31ps1/2 asymptotes, respectively. These spectra are presented as solid lines in Fig. 6. The observation of a millimeter-wave-dependent PFI signal corresponding to the 31p3/2 and the 33p3/2 Rydberg states represents a further experimental verification of the 32ss1/2 nature of the laser-excited pair resonance. Compared to the millimeter-wave spectra recorded in the noninteracting Rydberg gas, the transitions are broadened and degraded toward lower (higher) frequencies in the case of the 32ssps1/2 (32spss1/2) transition. Although the large background signal and the poor signal-to-noise ratio of the millimeter-wave spectra of the pair states prevents a quantitative analysis, the spectra enable us to draw the following qualitative conclusions: i) The weak line broadenings and frequency shifts compared to the transitions recorded in the noninteracting Rydberg gas suggest that the Rydberg-atom pairs contributing to the spectra have a large interatomic separation. ii) The red (blue) shift of the transitions to the 31ps1/2 (32sp3/2) pair state reveals that the potential curves of the ps1/2 pair states are less strongly attractive, at long range, than is the case for the 32ss1/2 pair state, despite the fact that the dipole-dipole interaction is resonant, because spj and ps1/2 are degenerate when . This aspect is discussed in more detail in Section IV D.
The observation of a prompt ionization signal further shows that an important fraction of the initial population in the 32ss1/2 pair state decays by ionization on the sub-microsecond timescale and therefore does not contribute to the millimeter-wave spectra. The millimeter-wave spectra can be adequately modeled (see red dashed traces in Fig. 6) by taking into account the motion of the Rydberg-atom pairs on their potential-energy curves, as explained in Section IV D.
III.4 Penning ionization of the 32ss1/2 pair state
The spontaneous ionization of Rydberg atoms in the gas phase is the first step in the evolution of a dense Rydberg gas towards a plasma. Spontaneous ionization of a Rydberg gas was first reported by Vitrant et al. Vitrant et al. (1982), who pointed out that it reduces the lifetimes of Rydberg states in dense samples. Interest in the ionization process was renewed with experiments on ultracold atoms which provided detailed information on the evolution from an ultracold Rydberg gas to an ultracold plasma Robinson et al. (2000). This evolution can be described by an avalanche-ionization model Pohl et al. (2003) that involves an initial seed ionization process, during which ions are produced in the ultracold gas and the free electrons escape. Once the positive space charge of the ions is sufficiently high to trap low-energy electrons, the remaining Rydberg atoms are rapidly ionized by collisions with the electrons. For the seed-ionization process, experiments pointed at the importance of a small fraction of hot Rydberg atoms and blackbody-radiation-induced photoionization Robinson et al. (2000), static orbital overlap between close-lying Rydberg-atom pairs, sequences of quasiresonant dipole-dipole transitions Li et al. (2004); Tanner et al. (2008), and interaction-induced motion leading to Rydberg-Rydberg collisions and Penning ionization Li et al. (2005); Viteau et al. (2008); Reinhard et al. (2008).
The dynamics leading to the seed ionization depends on the density of the excited Rydberg atoms, on the Rydberg state and on the details of the interaction between the Rydberg atoms. At high values () and high Rydberg-atom densities ( cm-3), the complete ionization of the Rydberg gas occurs in less than 100 ns, as reported in Ref. Han and Gallagher (2008) and confirmed in the present work (not shown). The theoretical understanding of this fast ionization process is still incomplete, but a classical simulation Robicheaux et al. (2014) sugggests that many-body interactions and excitation of closely-spaced pairs of Rydberg atoms play an important role under these conditions. At lower densities and values, Penning-ionization processes Penning (1927); Li et al. (2005); Amthor et al. (2007); Viteau et al. (2008); Reinhard et al. (2008) involving two Rydberg atoms, one atom undergoing a transition to a lower state and the other being ionized, have been identified as the dominant seed-ionization mechanism.
To characterize the processes leading to the strong prompt Cs+ ionization signal in our studies of millimeter-wave transitions between Rydberg-pair states (see upper panel of Fig. 7), the ionization dynamics of the 32ss1/2 pair state was studied at a time resolution of 100 ns limited by the temporal resolution of our Cs+-ion–TOF spectra. The experiments consisted in monitoring the yield of Cs+ ions produced spontaneously during the delay time between the laser excitation pulse and the application of the pulsed electric field as a function of the UV-laser frequency. The spontaneously formed ions are accelerated from the beginning of the electric-field ramp used for the field-ionization and thus arrive first on the detector, see the integration-windows labeled “prompt ions” in Fig. 7.
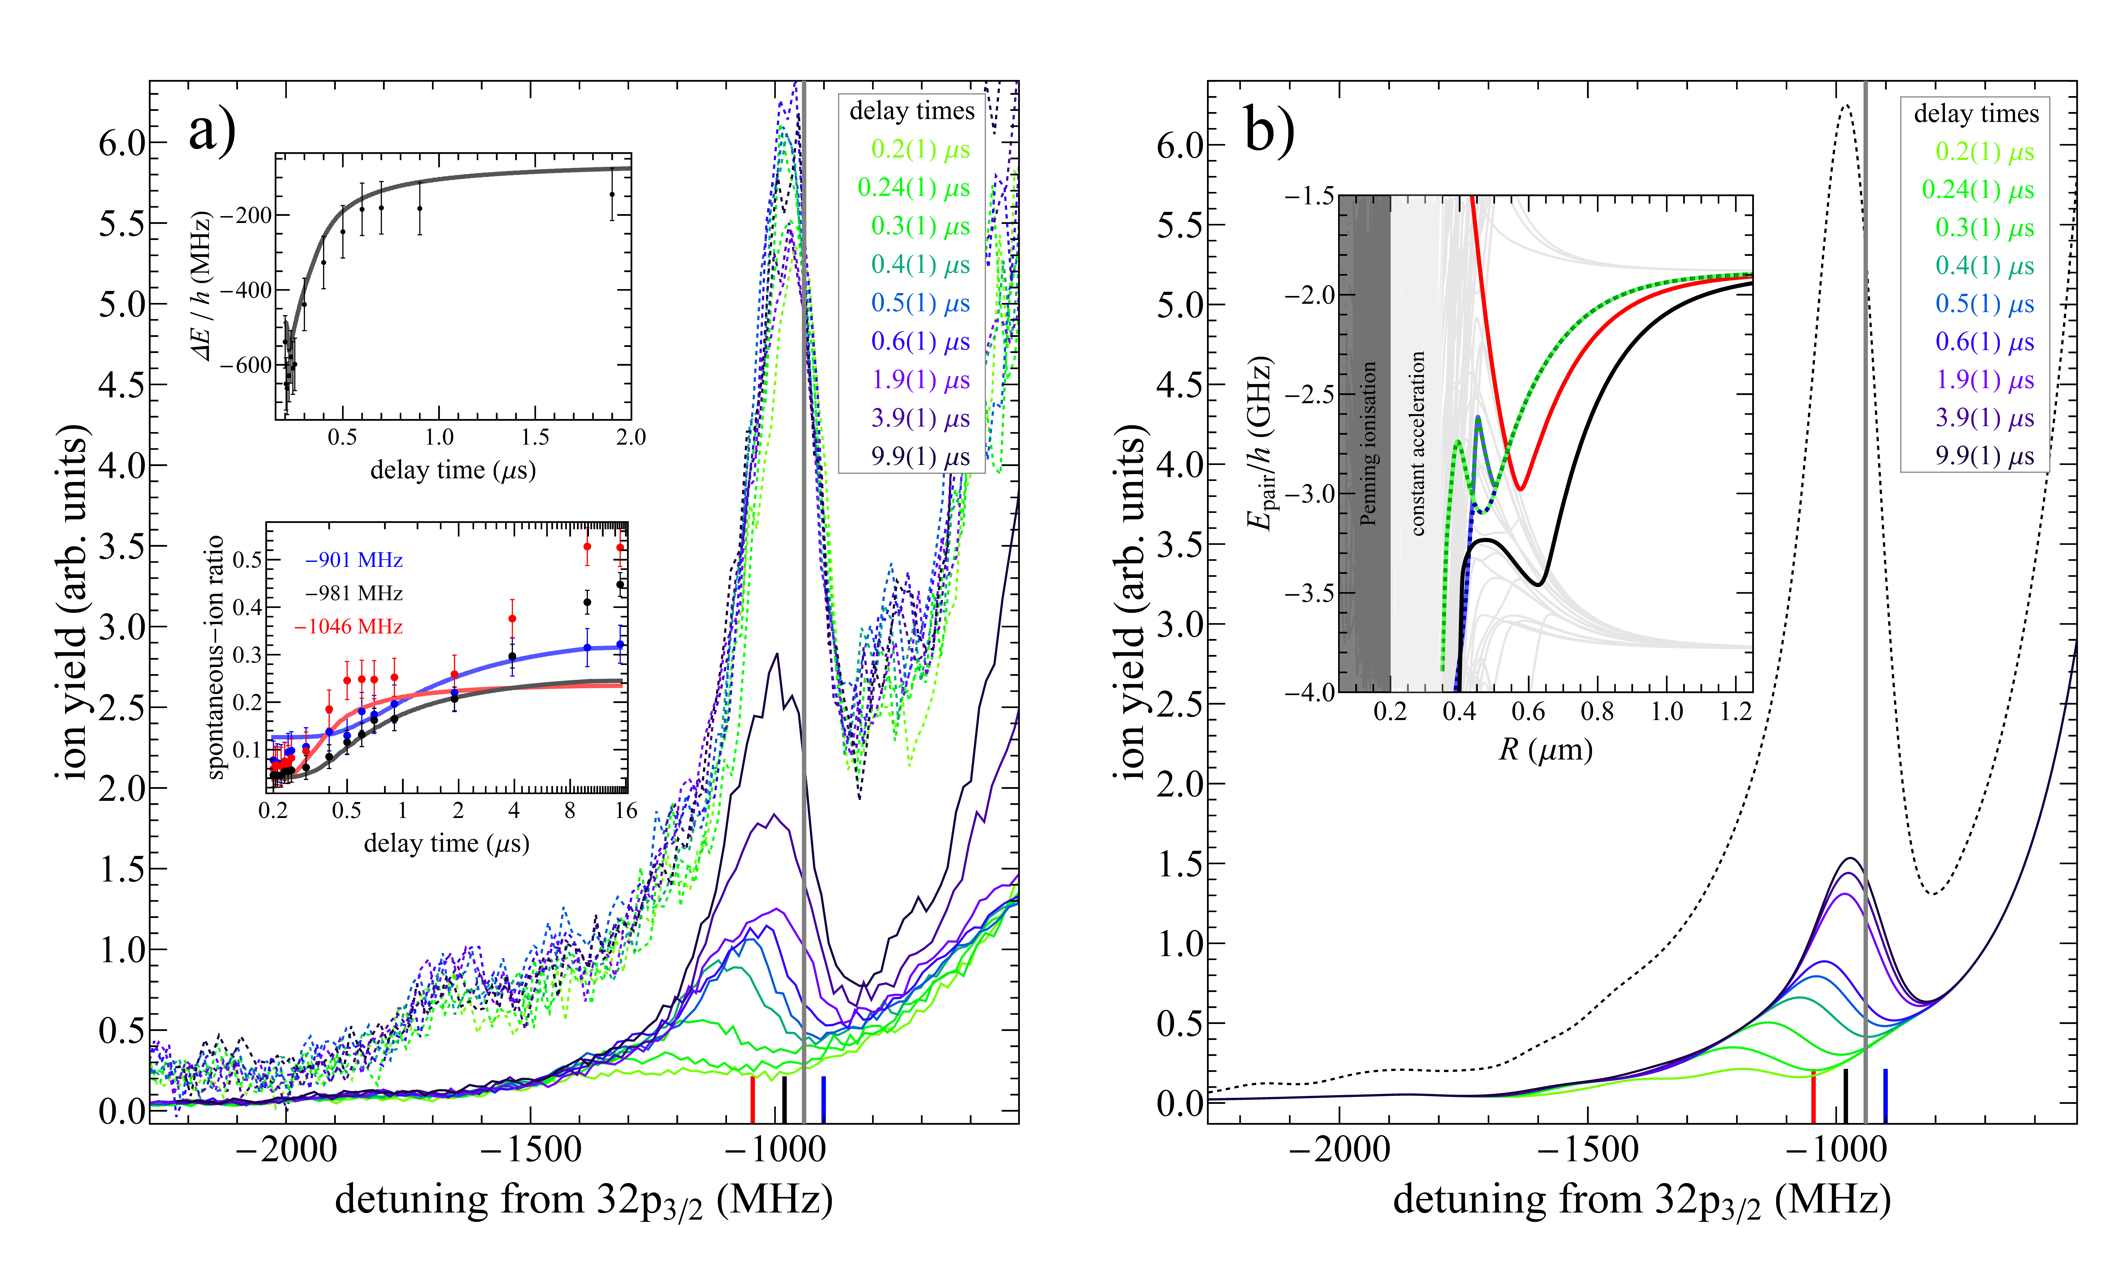
The results of this investigation are presented in Fig. 8a), which compares spectra of the 32ss1/2 pair resonance recorded for several delay times between 200 ns and 9.9 s. At the shortest delay times, the peaks in the prompt-ion signal are observed MHz below the 32ss1/2 asymptote and are very weak. The intensity of the resonance grows with increasing delay time and its position gradually shifts toward the 32ss1/2 asymptote, and stabilizes at MHz below this asymptote at delay times beyond 1 s. This deviation from the asymptotic pair energy is the interaction-induced shift discussed in section III.1 and shown in the inset of Fig. 4. The time dependence of the resonance position is displayed in the upper left inset of Fig. 8.
Because the total density of Rydberg atoms in our experiments is still very low (on the order of atoms/cm3), the experimental observations can be qualitatively understood as resulting from the purely pair-wise Penning-ionization mechanism. Pairs of Rydberg atoms are excited at well-defined initial separations given by the detuning of the excitation laser from the dissociation asymptote and are accelerated on the attractive potential-energy curves. The first pairs that ionize are those characterized by the strongest shifts, i.e., those that correspond to the shortest internuclear distances and are thus subject to the strongest attractive interactions. As the delay time increases, atom pairs subject to smaller shifts and thus weaker attractive interactions start contributing to the prompt-ion signal in the TOF spectra. These pairs have larger initial internuclear separations and require longer times before the motion on the attractive potential leads to ionizing collisions. A more quantitative analysis of this process is presented in Section IV C.
III.5 Spectral structures originating from pair states on the high-frequency side of the pp3/2 pair-dissociation asymptotes
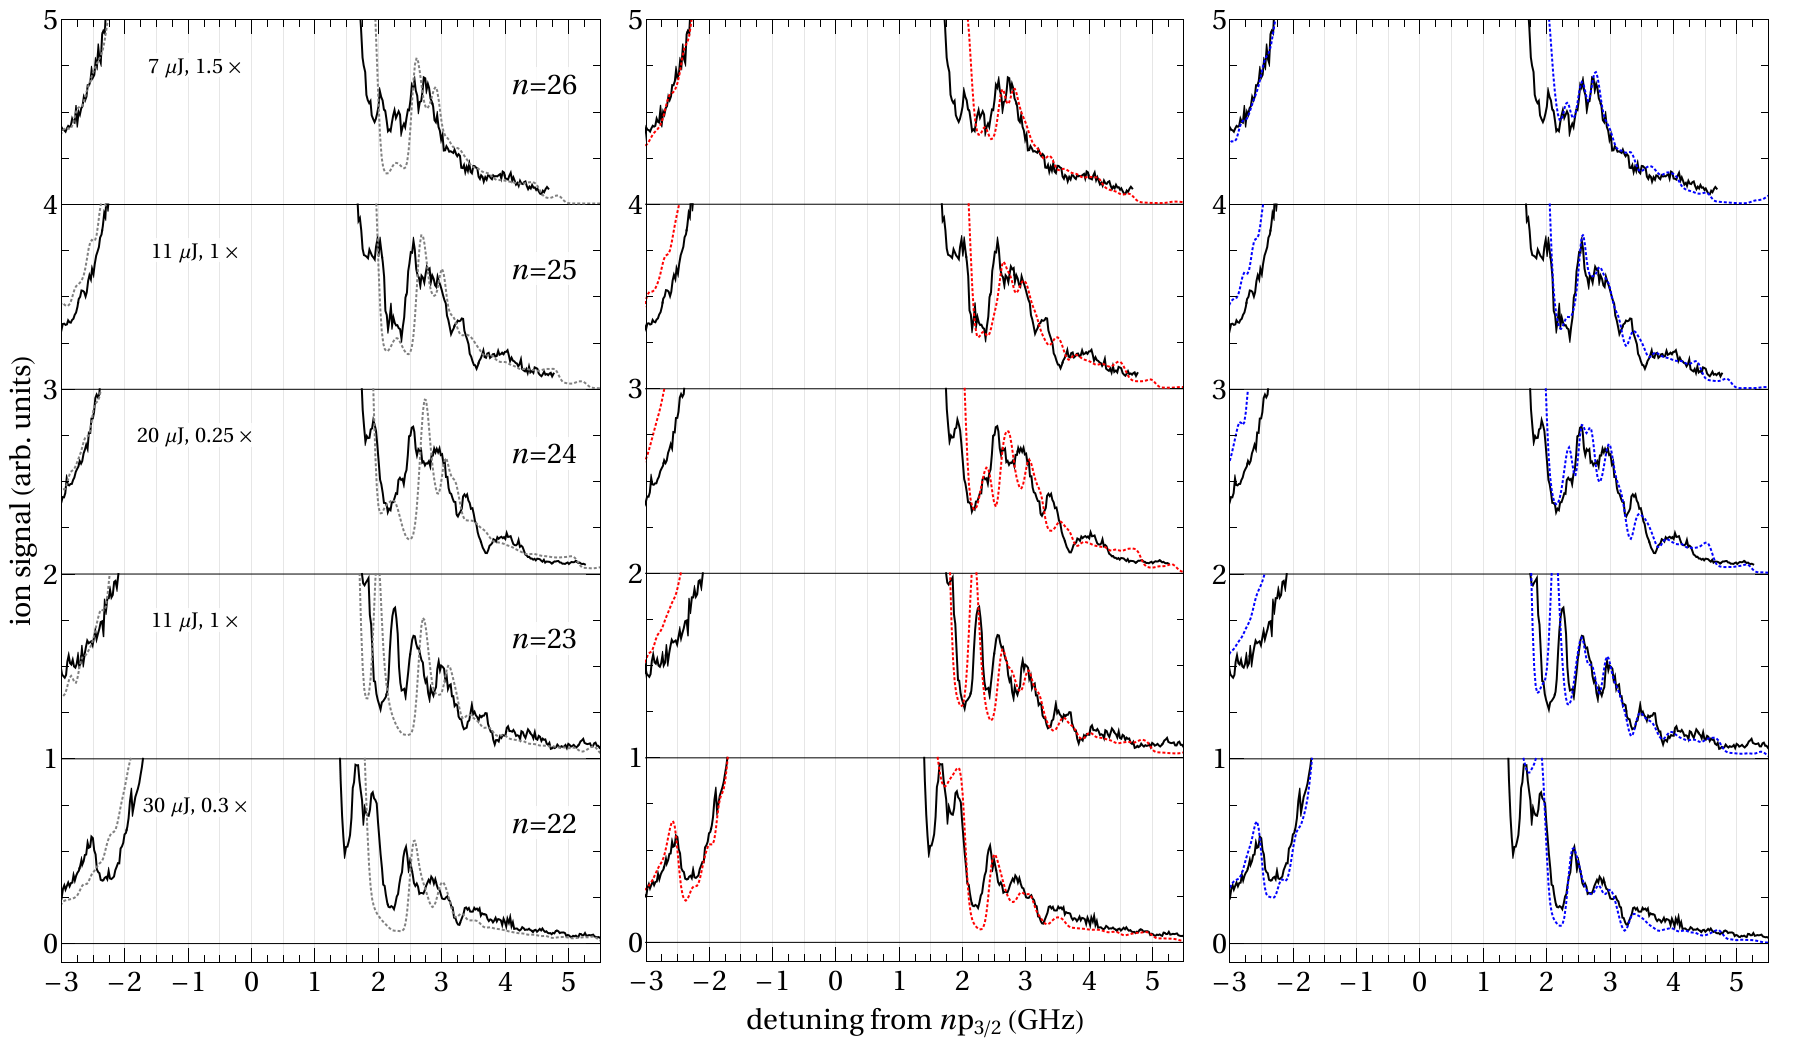
The interaction between the pp3/2 and the ss1/2 pair states schematically represented in Fig. 2a) leads to predominantly attractive potential-energy functions correlated to the ss1/2 dissociation asymptotes and repulsive potential-energy functions correlated to the pp3/2 asymptotes for the considered range of principal quantum numbers . Whereas the former lead to isolated resonances on the low-frequency side of the strong atomic resonances (see, e.g., Figs. 1 and 3), the latter lead to dense and complex spectral structures on the high-frequency side of the atomic resonances, which are partially resolved at the lowest values studied (). The corresponding spectra are displayed on an expanded scale in Fig. 9, where they are compared to numerical simulations performed using the interaction model presented in Section IV A.
The observed spectral patterns, which are perfectly reproducible in the experiments, are more complex than those observed on the low frequency side and do not reveal any obvious scaling with the principal quantum number. They originate from the interactions of the repulsive pp3/2 pair states with attractive ffj pair states which have their dissociation asymptotes located just above the pp3/2 asymptote. The numerical simulations of the spectra in these regions indicate that the spectral structures do not only arise from an accumulation of spectral intensity in regions where the potential-energy functions are flat as in case of the ss1/2 resonances, but also from a reduction of spectral intensity centered around avoided crossings between states correlated to the pp3/2 and ffj dissociation asymptotes. This aspect will be discussed in more detail in Section IV B.
IV Potential model for interacting Rydberg-atom pairs and interpretation of experimental results
IV.1 Model of long-range potential-energy curves
The potential model we have developed to analyze the results presented in Section III was briefly introduced in Ref. Deiglmayr et al. (2014) and is presented in detail here. We describe the long-range interaction between the two neutral atoms A and B in the frame of the nonrotating molecule AB using a multipole expansion of the form Flannery et al. (2005)
| (4) | ||||
| (5) | ||||
| (6) |
where is the position of the Rydberg electron bound to atom with respect to its core, the interatomic separation, the atomic multipole of -th order ( being the smaller of two values), and is the quantum number associated with the projection of the angular momentum onto the molecular axis. This expansion is valid in the absence of retardation effects, which are negligible in the systems discussed here, and for interatomic separations exceeding the LeRoy-radius Le Roy (1973), a criterion specifying the internuclear distance beyond which orbital overlap between the two atoms becomes negligible. The atomic multipoles are expressed in terms of spherical harmonics (see Eq. (5)). To account for the experimental observations, we found it sufficient to restrict the multipole expansion to contributions up to the octupole-octupole () term. The Hamiltonian
| (7) |
consists of the Hamiltonians of the two isolated atoms taking into account the quantum defects of all states with (from Refs. Goy et al. (1982); Weber and Sansonetti (1987)) and the truncated multipole expansion term .
To obtain the adiabatic potential-energy curves of the interacting Rydberg-atom pairs at distances larger than the LeRoy radius, is determined in matrix form using the product basis , following the approach described in Refs. Stanojevic et al. (2008, 2006); Samboy and Côté (2011). Here, represent the projections of the Rydberg-electron angular momentum onto the internuclear axis, with . We neglect the hyperfine structure of the Rydberg states because the largest hyperfine splittings for the low- s1/2 states are still more than one order of magnitude smaller than our laser bandwidth Saßmannshausen et al. (2013). The angular and radial parts of the matrix elements of can be separated and the angular matrix elements are calculated analytically, whereas the radial matrix elements are obtained by numerical integration Zimmerman et al. (1979) using experimental quantum defects Goy et al. (1982); Weber and Sansonetti (1987) and an ab-initio model potential Marinescu et al. (1994). The details of the calculation of the matrix elements are presented in the appendix.
The quantum number associated with the projection of the total electronic angular momentum onto the molecular axis is a good quantum number. As pointed out in Ref. Deiglmayr et al. (2014), although coupling terms with , such as the dipole-quadrupole coupling term, do not conserve the parity of the electronic wave function, they nevertheless lead to observable interactions because the coupling of quasi-degenerate rotational levels ensures the conservation of the total (rovibronic) parity. In Ref. Deiglmayr et al. (2014), we erroneously also stated that such terms can be accompanied by a mixing of states of gerade (g) and ungerade (u) electronic symmetry in homonuclear dimers. The g-u mixing in Cs is actually induced by hyperfine interactions, which are neglected in our model. The eigenvalues of the Hamiltonian are determined in an unsymmetrized basis independently for the different values of that are optically accessible, and for different values of the internuclear separation . The molecular eigenfunctions and the molecular eigenenergies are determined as a function of the interatomic separation . Exemplary potential-energy curves describing the long-range interaction between two Cs Rydberg atoms are displayed in Figs. 10 and 11.
The density of Rydberg-atom pair states is very high because of the large number of pair dissociation asymptotes and because several potential-energy functions correlate to each asymptote. Only a few of the multitude of molecular pair states are accessible optically in our experiments. The excitation probability of a molecular eigenstate at a pair separation is proportional to the square of the mixing coefficients of the pp3/2 basis states. The optically accessible states (for pp3/2 we take ,,) are conveniently expressed in the laboratory-fixed frame as
| (8) |
To account for our experimental conditions, we assume an isotropic distribution of 6s1/2 ground-state Cs atoms (). polarized transitions thus lead to the excitation of four different states corresponding to and and with equal weights. The intensity is obtained as the squared overlap between the optically accessible function and the function expressed in the molecule-fixed frame with the internuclear axis forming an angle with the laboratory-fixed axis. To calculate , we transform the atomic functions into the molecule-fixed frame using the Wigner d rotation matrices and obtain
| (9) |
We average over all orientations of the molecular axis relative to the axis and obtain , which is directly proportional to the spectral intensity resulting from excitation of a molecular pair state at the interatomic separation . The corresponding spectral line profile is then determined as
| (10) |
where is the Rabi frequency of the atomic ps1/2 transition, the asymptotic energy of the pp3/2 state, and the term accounts for the two-photon excitation of the pair-state with an off-resonant intermediate ps1/2 (or 6sp3/2) state at a detuning of Stanojevic et al. (2008). The delta function ensures resonance with the molecular state with the energy and intensity . Assuming a gas of homogeneous density, the number of atom pairs at a separation is proportional to . For comparison with experimental spectra, the line profile is convoluted with the laser line profile and summed over all molecular states to obtain the full spectrum as
| (11) |
The laser line profile is assumed to be a Gaussian function with the experimentally determined full width at half maximum of 140 MHz. The atomic Rabi frequencies of the single-photon ps1/2 transitions act only as distance- and energy-independent overall scaling factors and are not taken explicitly into account when fitting the global amplitude of the simulated spectra to the experimental data (see Figs. 3 and 9).
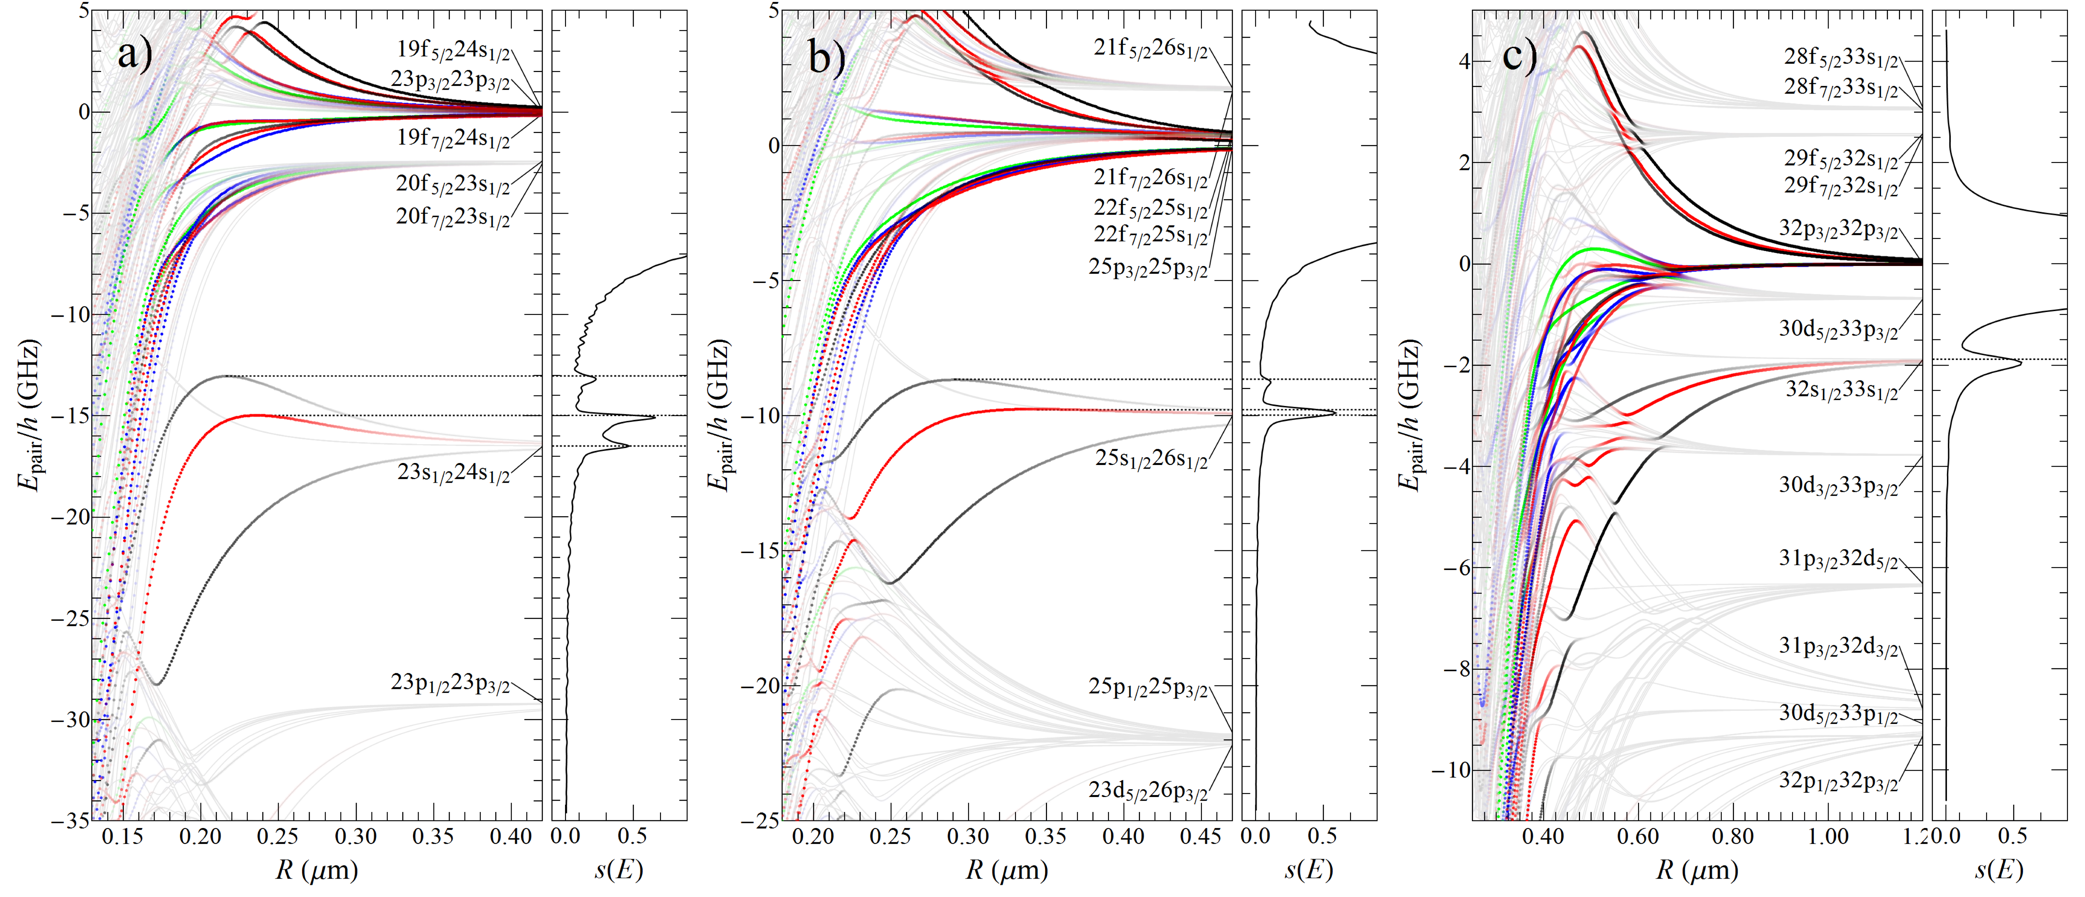
The intensity of the color used to draw the potential-energy functions in Fig. 10 represents the value of the function , gray corresponding to a negligible contribution of the optically accessible pp3/2 component and full color to a pp3/2 contribution of at least 1%.
At large distances, the only nonvanishing contributions are located in the immediate vicinity of the pp3/2 asymptotes. At shorter distances, many more potential curves contribute to the spectral intensity. However, most potential curves are strongly attractive and the large gradients spread the overall intensity over broad spectral ranges, which renders the observation of pair states impossible. From the general appearance of the curves depicted in Fig. 10, one expects sharp spectral structures to arise from regions where the potential curves that possess some pp3/2 character are flat. Such regions of enhanced intensity are encountered where the curves have a local maximum (a clear example of such a situation is given by the red and black curves correlated to the 23ssp1/2 asymptote in the left panel of Fig. 10) or closely approach their asymptotic value (all three curves correlated to ss1/2 at large values in Fig. 10).
Sharp spectral structures are also encountered in regions where avoided crossings reduce the spectral density, leading to intensity minima. Characteristic examples of this situation are the minima observed in the high-frequency wings of the pp3/2 resonances for in Fig. 9.
IV.2 Interpretation of the UV-laser spectra
The procedure we followed to interpret the experimental UV-laser spectra of Rydberg-atom pairs such as those presented in Figs. 1, 3 and 9 was to evaluate the spectrum using Eq. (IV.1) retaining successively higher terms of the long-range interaction series (Eq. (5)), which, in turn, necessitated the extension of the basis set to include pair states with and values up to 6. Convergence of the eigenvalue calculations was checked by increasing the range of principal quantum numbers and . Because the atomic radial transition matrix elements rapidly decrease with the value of , only states differing in effective principal quantum number by no more than 1 were considered in the calculations. It further turned out to be sufficient to only consider the pair states with asymptotes located within an energy window of around the relevant pp3/2 asymptote. States located outside this range only approach the pp3/2 potential curves at short range, where the gradients of the potential-energy curves are large and spectral structures are broad and weak.
As explained in Section IV A, the model does not include adjustable parameters, but relies on the known quantum defects of the Cs-atom Rydberg states. The structures of the spectra in the regions located below the pp3/2 dissociation asymptote (see Fig. 3) are primarily determined by the dipole-dipole interaction term which couples the pp3/2 and pp3/2 pair states with the ss1/2 pair states. The potential-energy functions that give the ss1/2 resonances their characteristic interaction-induced shifts (see inset of Fig. 4) and fine structures (see Fig. 3) are depicted in Fig. 10 for , 25 and 32. The calculated spectra are depicted on the right-hand side of each panel, and dashed horizontal lines highlight the origins of the sharp spectral structures.
Three states correlating to the ss1/2 asymptotes possess a significant admixture of the optically accessible pp3/2 pair state, two of which are (black lines) and the third (red line) is a state. At the highest values studied experimentally (), for which the results obtained at are representative (see Fig. 10), all three states are attractive. In the range of internuclear distances where the pp3/2 character is significant, the dipole-dipole interaction with the pp3/2 state is the dominant interaction for all three states. The interaction with the pp3/2 pair state, which is located more than 10 GHz below the pp3/2 asymptote at , does not significantly affect the ss1/2 potential curves in this range of values. The calculations predict a red detuning of the pair resonance with respect to the ss1/2 asymptote and a red-degraded line shape, in excellent agreement with the experimental observations (see Fig. 3).
As decreases below , the position of the ss1/2 asymptotes rapidly shifts away from the pp3/2 asymptote and toward the pp3/2 asymptote. Consequently, the effect of the dipole-dipole interaction with the pp3/2 pair state becomes important: The and one of the two potential functions become repulsive at intermediate distances beyond about 0.3 m at and beyond about 0.20 m at . At shorter range, the interaction with the pp3/2 pair state is always dominant and makes the ss1/2 potentials attractive, resulting in local maxima in these two curves. These two maxima give rise to two peaks in the calculated spectra located on the high-frequency side of the ss1/2 asymptotes. The third peak, which corresponds to the position of the asymptote, is well resolved below . The calculated spectra accurately reproduce the experimental spectra at all values investigated (see Fig. 3). The interaction-induced shifts of the pair resonances extracted from simulated and experimental spectra agree within the experimental uncertainty, as shown in the inset of Fig. 4. Even the positive interaction-induced shift of the pair resonance with respect to the 25ss1/2 asymptote (see Fig. 4) is accounted for by the calculations, which indicate that it results from the overlap of signals originating from the long-range part of the potentials and from the flat potential region near the maximum of the curve (red trace in Fig. 10b)).
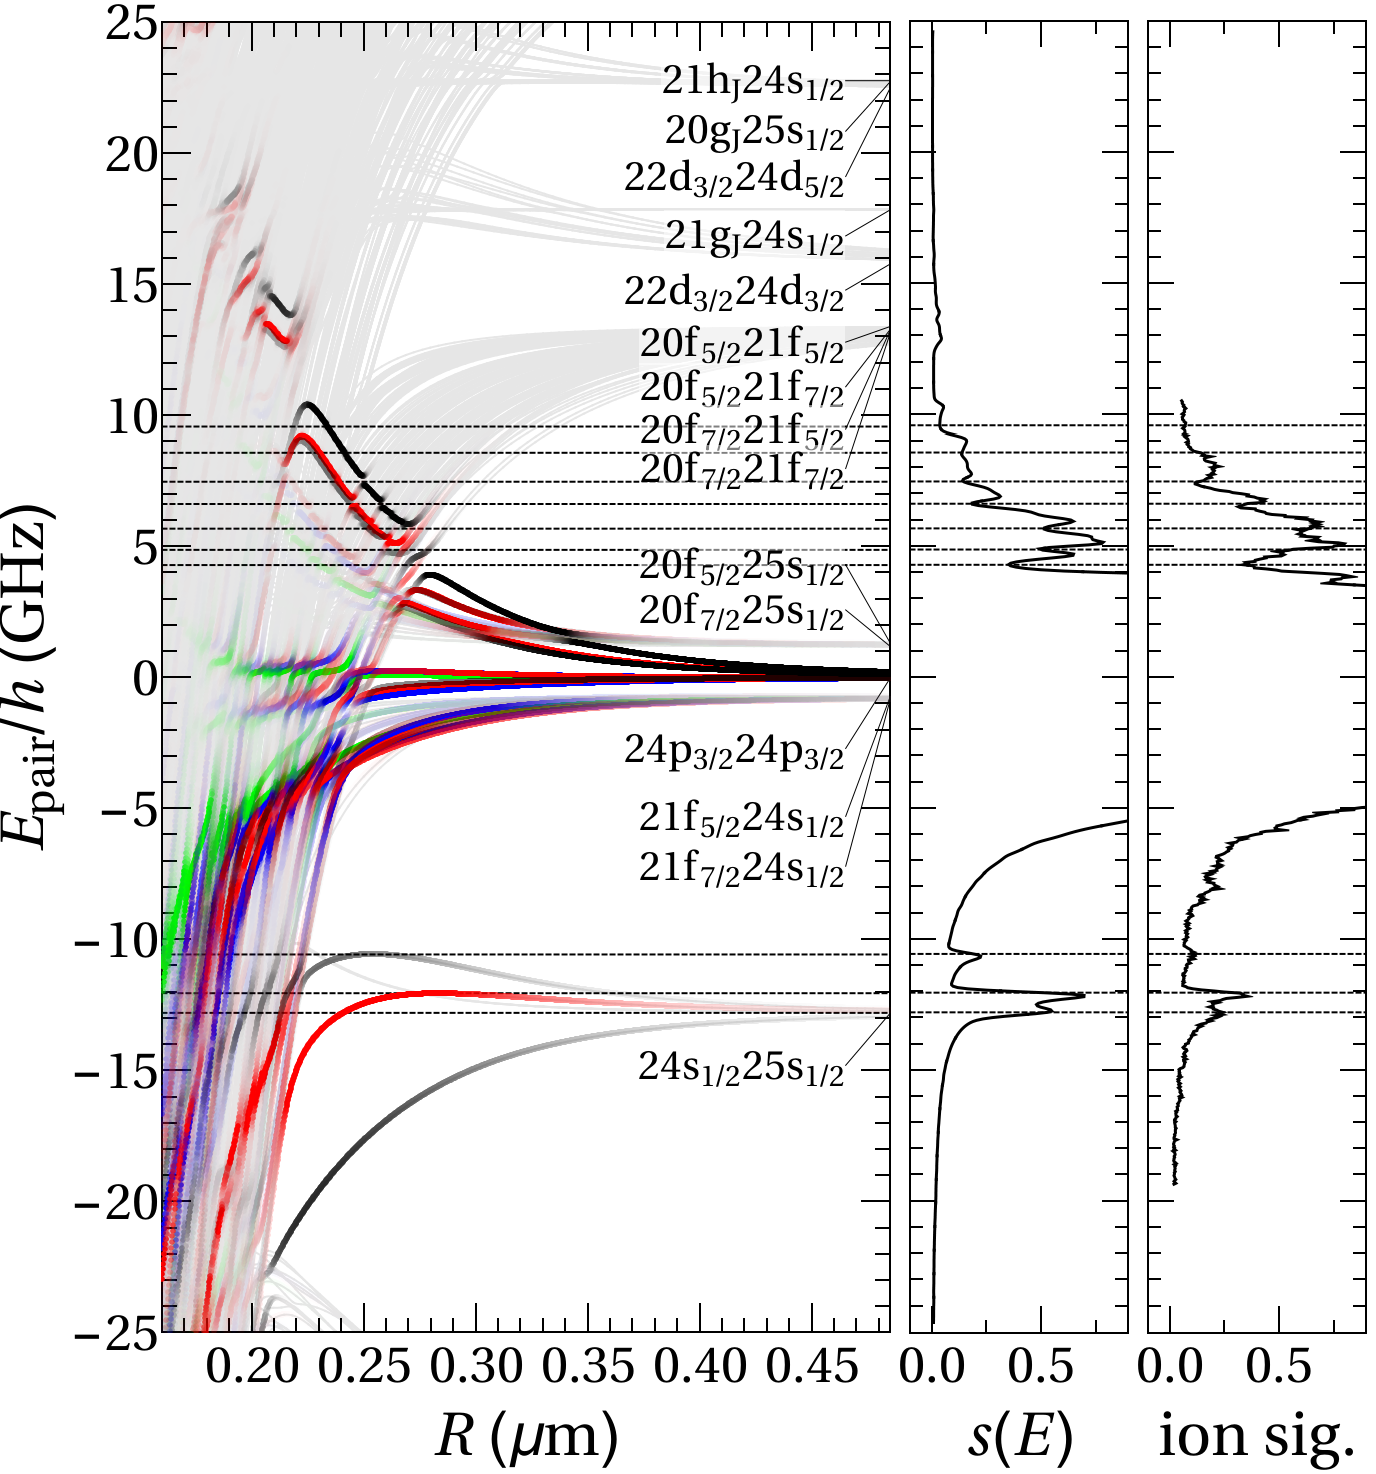
The potential-energy functions of the (black), 1 (red), 2 (blue), and 3 (green) states required to interpret the spectral structures located on the high-frequency side of the 24pp3/2 asymptotes are depicted in Fig. 11. Many pair states correlating to the 20fs1/2, 20ff5/2,7/2, 22dd3/2,5/2, 21gs1/2, 20gs1/2 and 21hs1/2 asymptotes are located in this region, but they only possess 24pp3/2 character near avoided crossings with the pp3/2 () states. In the absence of these crossings, the repulsive curves associated with the 24pp3/2 asymptote would lead to a broad and structureless high-frequency wing of the atomic transition. At the avoided crossings no curve possesses significant 24pp3/2 character. Consequently, the spectral excitation function has minima that can be directly linked to the avoided crossings, as indicated by the horizontal dashed lines in Fig. 11.
The simulations of the spectra presented in Fig. 9 indicate that a potential model restricted to the dipole-dipole interaction fails to reproduce the details of the spectral structures (left panel) on the high-frequency side of the atomic transitions and that the successive inclusion of interaction terms up to the octupole-octupole term gradually improves the agreement between measured and calculated spectra.
The fact that the calculations almost perfectly reproduce the experimental spectra (see Figs. 3 and 9) is remarkable and clearly reveals that (i) the long-range adiabatic potential model is adequate both with respect to the multipole expansion and the basis set, and (ii) pairwise interactions are sufficient to fully describe the behavior of the Rydberg gas at the time scale probed by our laser pulses ( ns) under the experimental conditions used to record the spectra.
It may appear surprising at first sight that adiabatic potential-energy functions can be used to accurately describe the spectra of Rydberg-atom pairs. Indeed, the high density of electronic states implies slow electronic dynamics, which in general tends to be accompanied by a breakdown of the Born-Oppenheimer and adiabatic approximations. The reason why the potential-energy curves provide an accurate description of the spectra is that the electronic dynamics, though slow, is still several orders of magnitude faster than the nuclear dynamics. For any given value of , the state density of electronic Rydberg-atom pairs is approximately GHz-1 at which implies that the timescale of the electronic motion is about 1 ns. At the translational temperature of 40 K of the Cs vapor, the mean velocity of the Cs atoms is about 10 cm/s, so that they can be considered stationary on the timescale of the electronic motion, and also during the UV-laser pulse. At internuclear distances beyond nm, the gradients of the potential curves are less than 500 GHz/m so that the relative velocity acquired by the atoms in 1 ns is less than 2 m/s which is also negligible. Over longer timescales, the acceleration of the atoms in the attractive potentials inevitably leads to nonadiabatic effects and eventually to Penning ionization.
IV.3 Simulation of Penning ionization
To analyze the Penning-ionization experiments described in Section III D (see in particular Fig. 8a), we use a simple model which relies on the spectral excitation function and treats the relative motion of the atoms on the two and the potential curves associated with the 32ss1/2 asymptote classically. All other pair states are excited at short range (i.e., at values below 0.4 m) and only contribute to the spectra weakly on the low-frequency side of the resonance. The potential curves of the relevant molecular states are drawn in color in Fig. 8b). Below 0.7 m, the potential-energy curves reveal several avoided crossings. Following photoexcitation, the two interacting Rydberg atoms are accelerated towards each other until Penning ionization takes place, which is assumed, for simplicity, to happen at an interatomic distance of 200 nm. The probabilities of adiabatic traversals of the avoided crossings are estimated with the Landau-Zener formula
| (12) |
where represents the minimal distance between the potential curves and the slew rate is determined from the relative motion of the two atoms on the potential curves. The first avoided crossing of the state (see red curve in Fig. 8b)) is traversed adiabatically (). The adiabatic potential has a minimum at m and the state therefore does not rapidly reach the region where Penning ionization takes place. The motion on the two potential curves (black and blue/green lines in Fig. 8b)) is such that the regions of short internuclear distances where Penning ionization takes place is reached rapidly despite several avoided crossings. The simulation of the ionization dynamics of the states adequately reproduces both the rise of the spontaneous-ionization signal and the gradual shift of the peak position (see insets of Fig. 8a)) observed experimentally for delay times up to s. For longer delay times a slower rise of the spontaneous-ionization signal up to s is observed, which is not explained by our model (see lower inset of Fig. 8a)). We attribute this additional ion signal to the ionization of pairs of atoms in the state. A possible mechanism could be a weak mixing of and states (e.g. by a residual electric field), which would lead to a small avoided crossing of the two symmetries (see red and green/blue traces in the inset of Fig. 8b) at m) and open a path for ionization of pairs in the metastable state. The probability for an adiabatic crossing is inversely proportional to the velocity of the two colliding atoms at the crossing (see Eq. (12)). For pairs excited at lower frequencies, this velocity decreases and the ionization probability thus increases. This is consistent with the observed increase of the deviation between experimental and simulated ionization signals at longer delays when the excitation laser is tuned to lower frequencies (see lower inset in Fig. 8a)). For long delay times, the experimental spontaneous-ion signal approaches approximately 50% of the initial total-ion signal, which indicates that every pair of atoms eventually undergoes a Penning ionization process.
The model discussed in this section predicts the correct qualitative behavior of fast and slow spontaneous ionization processes, but does not satisfactorily explain the observation of an almost constant total-ion signal for all experimental delay times (see dashed-colored traces in Fig. 8a)). Indeed, we predict that the Rydberg atom undergoing a transition to a lower Rydberg state in the Penning ionization process must end in a level with , whereas the amplitude of the pulsed electric field used for field ionization (1250 V/cm) should only ionize Rydberg states with .
IV.4 Simulation of millimeter-wave spectra between Rydberg-atom–pair states
The potential model and the spectral distribution function presented in Section IV A were also used to calculate the millimeter-wave spectra of the 32s1/233ps1/233s1/2 and 32s1/233sp3/233s1/2 transitions displayed in Figs. 6b) and c). To this end, we used, as initial distribution of Rydberg-atom–pair states the relative population in the two and the states that are accessed optically at the peak of the 32s1/233s1/2 resonance, and consider transitions from these states to the pair states correlating to the 31p3/233s1/2 and 32s1/233p3/2 asymptotes that are accessible in a single-photon millimeter-wave transition. The relevant potential-energy functions are displayed in Fig. 12.
The attractive nature of the three potential functions associated with the 32s1/233s1/2 asymptote implies, in a classical description of the nuclear motion, that the internuclear separation decreases with time. Because the potential curves of the states associated with the 31p3/233s1/2 and 32s1/233p3/2 asymptotes are less attractive than those of the states associated with the 32s1/233s1/2 asymptote, the frequency of the 32s1/233sp3/233s1/2 transition decreases, and that of the 32s1/233ps1/233s1/2 increases, with time. This evolution (chirp) of the transition frequencies reduces the transition probabilities. The narrow bandwidth (1 MHz) of the millimeter-wave radiation implies that the main contribution to the millimeter-wave spectra originate from pairs with large internuclear separation , for which the evolution (chirp) of the transition frequency is slow.
To model the intensity distribution, we introduce a cut-off chirp of 2 MHz/s, beyond which we assume that the transitions are too weak and broad to be observed and determine the range of internuclear separations contributing to the millimeter-wave transition intensities accordingly. In this range, we calculate the distribution of transition frequencies from the potential-energy curves. For each frequency, we determine the spectral intensities as sum over products of the initial populations in the and 1 states correlated to the 32s1/233s1/2 asymptote and the relative transition probabilities
| (13) |
where is the cutoff function described above, is the sum of and electric-dipole transition operators, and the double sum runs over all initially excited pair-state for a fixed value of and all dipole-coupled final states .
The calculated spectra, convoluted with the experimental line-shape function of the corresponding atomic transitions, are displayed as dashed red lines in Figs. 6b) and c) and are in qualitative agreement with the experimental ones. In particular, the shifts from the asymptotic transition frequencies, which correspond to the spectra of the isolated atoms displayed as lower traces, and the asymmetric line shapes (red-degraded for the 32ssp3/233s1/2 transition and blue degraded for the 32s1/233ps1/233s1/2) are well described by the calculations. This agreement represents a further illustration of the ability of our potential model to describe the spectral and dynamical properties of Rydberg-atom pairs.
V Conclusions
In this article we have presented a comprehensive survey of the Rydberg excitation spectrum in a dense (density atoms/cm3), ultracold ( K) Cs gas recorded using an intense (peak intensity W/cm2) narrow-band (bandwidth 140 MHz) UV laser source.
Next to the strong lines corresponding to the atomic s transitions, the spectra also exhibit a very rich structure of weaker, sharp spectral features, which are attributed to pairs of Rydberg atoms, also known as Rydberg macrodimers Boisseau et al. (2002); Samboy and Côté (2011), interacting through long-range electrostatic forces. Sharp features of three different origins have been identified: (i) lines with maxima at positions located very close to ss1/2 and sf dissociation asymptotes and which correspond to the formation of weakly interacting Rydberg-atom pairs at long range, (ii) lines with maxima located above the ss1/2 dissociation asymptotes and which correspond to excitation to flat potential regions near local maxima of the potentials of and 1 molecular states correlated with ss1/2 dissociation asymptotes, and (iii) ”window” resonances located on the high-frequency side of the atomic transitions, which arise from avoided crossings between repulsive molecular potential curves correlated to pp3/2 dissociation asymptotes and attractive potentials near ff () dissociation asymptotes. The first category of resonances had been observed in earlier studies (see, e.g. Refs. Farooqi et al. (2003); Stanojevic et al. (2006, 2008); Overstreet et al. (2007, 2009)). The observation of the latter two categories (ii) and (iii) represents the first major result of our investigation.
The second major result is the demonstration, on the basis of a rigorous comparison of experimental and calculated spectra, that long-range molecular potential models provide a quantitatively correct and accurate description of the behavior of interacting Rydberg atoms in ultracold gases, provided that a sufficient number of channels and long-range interaction terms are considered. The potential model derived to describe Cs Rydberg-atom pairs adequately reproduces experimental UV-laser photoassociation spectra, millimeter-wave spectra of transitions between different Rydberg-atom–pair states, and the observed Penning-ionization dynamics of the Rydberg-atom pairs. Given the very high density of electronic states, it first appears astonishing that adiabatic potential models are at all adequate to describe the spectral and dynamical properties of interacting Rydberg-atom pairs. The reason for the usefulness of such models is that, in the range of interaction strengths and internuclear distances that are relevant for most experiments in ultracold Rydberg gases, the heavy nuclei are almost stationary on the time scale associated with the electronic motion, taken as the inverse state density, i.e., about 1 ns at .
In the discussion of dipole- and van der Waals-blockade effects in the excitation of Rydberg states, the attractive and repulsive potentials arising from the dipole-dipole interaction near the asymptotes of Rydberg-atom–pair states, are often represented, for clarity and simplicity, as two-level systems of the kind depicted in Fig. 2a. The present analysis of Rydberg-atom–pair states of Cs in the range of principal quantum number , which includes all relevant potential curves and long-range interaction terms, demonstrates the limits of two-level Rydberg-blockade models. Indeed, many interacting molecular potentials give rise to a multitude of avoided crossings, resonances and level shifts. The range of observable phenomena is thus much wider than two-level blockade models predict, which on the one hand reduces their range of applicability, but on the other also offers new opportunities for scientific investigations and applications.
Acknowledgements.
This work is supported financially by the Swiss National Science Foundation under Project Nr. 200020-159848, the NCCR QSIT, and the EU Initial Training Network COHERENCE under grant FP7-PEOPLE-2010-ITN-265031. We acknowledge the European Union H2020 FET Proactive project RySQ (grant N. 640378).*
Appendix A Calculation of matrix elements of
In this appendix, explicit expressions for the matrix elements of the atomic multipoles contributing to (see Eq. (IV.1)) are derived in the product basis .
The matrix elements of an atomic multipole
| (14) |
in this basis are given by
| (15) |
where the radial matrix elements
| (16) |
are evaluated numerically using the Numerov method Zimmerman et al. (1979) and a model core potential Marinescu et al. (1994). The angular matrix elements are evaluated using the analytical expressions Varshalovich et al. (1988)
| (17) |
where are the Clebsch-Gordan coefficients and is Wigner’s 6- symbol.
As an example we give the full expression for the matrix elements of the lowest-order term in the multipole expansion, the dipole-dipole interaction:
| (18) |
References
- Singer et al. (2004) K. Singer, M. Reetz-Lamour, T. Amthor, L. G. Marcassa, and M. Weidemüller, Phys. Rev. Lett. 93, 163001 (2004).
- Tong et al. (2004) D. Tong, S. M. Farooqi, J. Stanojevic, S. Krishnan, Y. P. Zhang, R. Côté, E. E. Eyler, and P. L. Gould, Phys. Rev. Lett. 93, 063001 (2004).
- Vogt et al. (2006) T. Vogt, M. Viteau, J. Zhao, A. Chotia, D. Comparat, and P. Pillet, Phys. Rev. Lett. 97, 083003 (2006).
- Urban et al. (2009) E. Urban, T. A. Johnson, T. Henage, L. Isenhower, D. D. Yavuz, T. G. Walker, and M. Saffman, Nature Physics 5, 110 (2009).
- Lukin et al. (2001) M. D. Lukin, M. Fleischhauer, R. Côté, L. M. Duan, D. Jaksch, J. I. Cirac, and P. Zoller, Phys. Rev. Lett. 87, 037901 (2001).
- Møller et al. (2008) D. Møller, L. B. Madsen, and K. Mølmer, Phys. Rev. Lett. 100, 170504 (2008).
- Isenhower et al. (2010) L. Isenhower, E. Urban, X. L. Zhang, A. T. Gill, T. Henage, T. A. Johnson, T. G. Walker, and M. Saffman, Phys. Rev. Lett. 104, 010503 (2010).
- Saffman et al. (2010) M. Saffman, T. G. Walker, and K. Mølmer, Rev. Mod. Phys. 82, 2313 (2010).
- Li et al. (2004) W. Li, M. W. Noel, M. P. Robinson, P. J. Tanner, T. F. Gallagher, D. Comparat, B. Laburthe Tolra, N. Vanhaecke, T. Vogt, N. Zahzam, P. Pillet, and D. A. Tate, Phys. Rev. A 70, 042713 (2004).
- Peyronel et al. (2012) T. Peyronel, O. Firstenberg, Q.-Y. Liang, S. Hofferberth, A. V. Gorshkov, T. Pohl, M. D. Lukin, and V. Vuletić, Nature 488, 57 (2012).
- Dudin and Kuzmich (2012) Y. O. Dudin and A. Kuzmich, Science 336, 887 (2012).
- Raimond et al. (1981) J. M. Raimond, G. Vitrant, and S. Haroche, J. Phys. B 14, L655 (1981).
- Han and Gallagher (2009) J. Han and T. F. Gallagher, Phys. Rev. A 79, 053409 (2009).
- Ravets et al. (2014) S. Ravets, H. Labuhn, D. Barredo, L. Béguin, T. Lahaye, and A. Browaeys, Nature Physics 10, 914 (2014).
- Béguin et al. (2013) L. Béguin, A. Vernier, R. Chicireanu, T. Lahaye, and A. Browaeys, Phys. Rev. Lett. 110, 263201 (2013).
- Deiglmayr et al. (2014) J. Deiglmayr, H. Saßmannshausen, P. Pillet, and F. Merkt, Phys. Rev. Lett. 113, 193001 (2014).
- Farooqi et al. (2003) S. M. Farooqi, D. Tong, S. Krishnan, J. Stanojevic, Y. P. Zhang, J. R. Ensher, A. S. Estrin, C. Boisseau, R. Côté, E. E. Eyler, and P. L. Gould, Phys. Rev. Lett. 91, 183002 (2003).
- Stanojevic et al. (2006) J. Stanojevic, R. Côté, D. Tong, S. M. Farooqi, E. E. Eyler, and P. L. Gould, Eur. Phys. J. D 40, 3 (2006).
- Stanojevic et al. (2008) J. Stanojevic, R. Côté, D. Tong, E. E. Eyler, and P. L. Gould, Phys. Rev. A 78, 052709 (2008).
- Samboy and Côté (2011) N. Samboy and R. Côté, J. Phys. B 44, 184006 (2011).
- Overstreet et al. (2007) K. R. Overstreet, A. Schwettmann, J. Tallant, and J. P. Shaffer, Phys. Rev. A 76, 011403 (2007).
- Overstreet et al. (2009) K. R. Overstreet, A. Schwettmann, J. Tallant, D. Booth, and J. P. Shaffer, Nat. Phys. 5, 581 (2009).
- Saßmannshausen et al. (2013) H. Saßmannshausen, F. Merkt, and J. Deiglmayr, Phys. Rev. A 87, 032519 (2013).
- Raimond et al. (1978) J. M. Raimond, M. Gross, C. Fabre, S. Haroche, and H. H. Stroke, J. Phys. B 11, L765 (1978).
- Ritz (1908) W. Ritz, Astrophys. J. 28, 237 (1908).
- Goy et al. (1982) P. Goy, J. M. Raimond, G. Vitrant, and S. Haroche, Phys. Rev. A 26, 2733 (1982).
- Saßmannshausen et al. (2015) H. Saßmannshausen, F. Merkt, and J. Deiglmayr, Phys. Rev. Lett. 114, 133201 (2015).
- Westermann et al. (2006) S. Westermann, T. Amthor, A. L. de Oliveira, J. Deiglmayr, M. Reetz-Lamour, and M. Weidemüller, Eur. Phys. J. D 40, 37 (2006).
- Gurian et al. (2012) J. H. Gurian, P. Cheinet, P. Huillery, A. Fioretti, J. Zhao, P. L. Gould, D. Comparat, and P. Pillet, Phys. Rev. Lett. 108, 023005 (2012).
- Yu et al. (2013) Y. Yu, H. Park, and T. F. Gallagher, Phys. Rev. Lett. 111, 173001 (2013).
- Han and Gallagher (2008) J. Han and T. F. Gallagher, Phys. Rev. A 77, 015404 (2008).
- Vitrant et al. (1982) G. Vitrant, J. M. Raimond, M. Gross, and S. Haroche, J.Phys. B 15, L49 (1982).
- Robinson et al. (2000) M. P. Robinson, B. Laburthe Tolra, M. W. Noel, T. F. Gallagher, and P. Pillet, Phys. Rev. Lett. 85, 4466 (2000).
- Pohl et al. (2003) T. Pohl, T. Pattard, and J. M. Rost, Phys. Rev. A 68, 010703 (2003).
- Tanner et al. (2008) P. J. Tanner, J. Han, E. S. Shuman, and T. F. Gallagher, Phys. Rev. Lett. 100, 043002 (2008).
- Li et al. (2005) W. Li, P. J. Tanner, and T. F. Gallagher, Phys. Rev. Lett. 94, 173001 (2005).
- Viteau et al. (2008) M. Viteau, A. Chotia, D. Comparat, D. A. Tate, T. F. Gallagher, and P. Pillet, Phys. Rev. A 78, 040704 (2008).
- Reinhard et al. (2008) A. Reinhard, T. Cubel Liebisch, K. C. Younge, P. R. Berman, and G. Raithel, Phys. Rev. Lett. 100, 123007 (2008).
- Robicheaux et al. (2014) F. Robicheaux, M. M. Goforth, and M. A. Phillips, Phys. Rev. A 90, 022712 (2014).
- Penning (1927) F. M. Penning, Naturwissenschaften 15, 818 (1927).
- Amthor et al. (2007) T. Amthor, M. Reetz-Lamour, S. Westermann, J. Denskat, and M. Weidemüller, Phys. Rev. Lett. 98, 023004 (2007).
- Flannery et al. (2005) M. R. Flannery, D. Vrinceanu, and V. N. Ostrovsky, J. Phys. B 38, S279 (2005).
- Le Roy (1973) R. J. Le Roy, in Molecular Spectroscopy, Vol. 1, edited by R. F. Barrow, D. A. Long, and D. J. Millen (Royal Society of Chemistry, Cambridge, 1973) pp. 113–176.
- Weber and Sansonetti (1987) K. H. Weber and C. J. Sansonetti, Phys. Rev. A 35, 4650 (1987).
- Zimmerman et al. (1979) M. L. Zimmerman, M. G. Littman, M. M. Kash, and D. Kleppner, Phys. Rev. A 20, 2251 (1979).
- Marinescu et al. (1994) M. Marinescu, H. R. Sadeghpour, and A. Dalgarno, Phys. Rev. A 49, 982 (1994).
- Boisseau et al. (2002) C. Boisseau, I. Simbotin, and R. Côté, Phys. Rev. Lett. 88, 133004 (2002).
- Varshalovich et al. (1988) D. Varshalovich, A. N. Moskalev, and V. K. Khersonskii, Quantum Theory of Angular Momentum (World Scientific Publishing, Singapore, 1988).