Observation of excitonic resonances in the second harmonic spectrum of MoS2
Abstract
We measure the second-harmonic (SH) response of MoS2 in a broad fundamental photon energy range between 0.85 and 1.7 eV, and present a continuous SH spectrum capturing signatures of both the fundamental A and B excitons in addition to the intense C resonance. Moreover, we interpret our results in terms of the first exciton simulation of the SH properties of multi-layered MoS2 samples, represented by a study of trilayer MoS2. The good agreement between theory and experiments allows us to establish a connection between the measured spectrum and the underlying electronic structure, in the process elucidating the non-linear excitation of electron-hole pairs.
In recent years, two-dimensional transition metal dichalcogenides (TMDs), being semiconductorsMak et al. (2010); Splendiani et al. (2011); Eda et al. (2011); Zhang et al. (2014) with band gaps in the 2-3 eV rangeKomsa and Krasheninnikov (2012); Qiu et al. (2013); Zhang et al. (2014); Wang et al. (2014), have been applied as the basis for a host of novel two-dimensional optoelectronic devicesRadisavljevic et al. (2011); Yin et al. (2012); Larentis et al. (2012); Georgiou et al. (2013); Chuang et al. (2014); Jo et al. (2014). Accordingly, a great deal of attention has been devoted to the linear optical properties of these compoundsMak et al. (2010); Splendiani et al. (2011); Eda et al. (2011). Also, non-linear optical techniques have been demonstrated as particularly powerful probes for the microscopic structure of few-layered TMD crystals, revealing e.g., their crystallographic orientationMalard et al. (2013); Kumar et al. (2013); Li et al. (2013); Janisch et al. (2014); Wang et al. (2014), and stacking angleHsu et al. (2014). Moreover, second-harmonic (SH) spectroscopy allows for insights into the electronic structure of TMD flakesMalard et al. (2013), exposing edge-localized effectsYin et al. (2014), or valley-coherent excitationsWang et al. (2014).
While experimentally determined linear response functions of various TMDs, dominated by electron-hole pairs bound by several hundred meVsKomsa and Krasheninnikov (2012); Qiu et al. (2013); Chernikov et al. (2014), are reproduced reasonably well at the Bethe-Salpeter equation (BSE) level of complexityMolina-Sánchez et al. (2013); Qiu et al. (2013); Trolle et al. (2014); Grüning and Attaccalite (2014), similar comparisons for non-linear cases are lacking. Although several proposed theoretical models, based on both independent-particleYin et al. (2014); Wang and Guo and excitonicTrolle et al. (2014); Grüning and Attaccalite (2014) approaches, have been published, the SH spectrum of MoS2 has been investigated experimentallyMalard et al. (2013) only in a narrow fundamental photon energy range between 1.2 and 1.7 eV, probing the so-called C resonance also known from linear optics. Theoretical models have so far been benchmarked by their ability to reproduce this single featureTrolle et al. (2014); Grüning and Attaccalite (2014); Wang and Guo . However, the parabolic dispersion, and the split valence bands near the K-points of the Brillouin zone, translates into bound electron-hole pairs in the BSE picture. These give rise to sharp peaks in the absorption spectrum due to the so-called A and B excitonsQiu et al. (2013); Li et al. (2014) at photon energies near 1.9 eV, and the question remains how they might affect the SH response. In particular, the relative intensities and lineshapes of such features are of interest.
In the present letter, we report an experimental optical SH spectrum generated from many-layered MoS2, with fundamental photon energies varied in a broad range between 0.85 and 1.7 eV, capturing both the fundamental A and B excitons in addition to the aforementioned C resonance. We perform our optical experiments on (i) many-layered MoS2 flakes exfoliated onto fused silica by the well-known scotch tape methodRadisavljevic et al. (2011), and (ii) a bulk MoS2 crystal. The first approach gives access to a relatively smooth surface suitable for optical experiments, with little diffuse scattering. However, here flake thickness and surface coverage are difficult parameters to control within the area of a mm-sized laser beam. The thickness of the bulk crystal, on the other hand, is immaterial due to absorption. Unfortunately, the rather rough surface of weakly van der Waals bound bulk TMD crystals typically make systematic optical studies difficult. Hence, due to large amounts of diffuse scattering, we only measure reliable results for maximized SH signals at the C resonance. Thus, the flake samples give access to highly resolved SH spectra, whereas absolute values may be extracted from the bulk sample, which, in turn, yield very little spectral information. By combining the measured SH response from these two sample types, we are able to calibrate the intensity measured from the exfoliated flakes against the bulk crystal measurements, thereby allowing for estimation of absolute parameters.
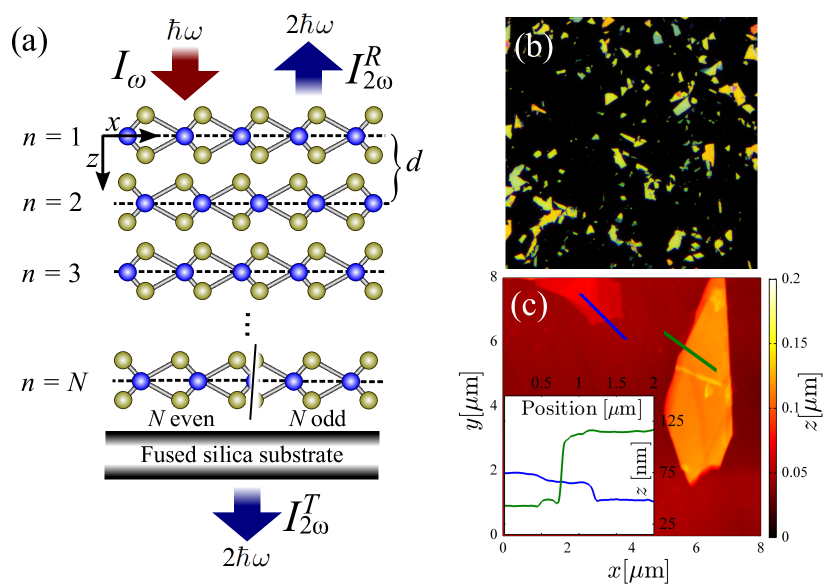
In Figs. 1(b) and (c), we include microscope images of the produced flakes. Atomic force microscopy and profiler scans confirm most flakes to consist of 40 - 100 monolayers (MLs). Indeed, no measurable photo-luminescence (PL) was observed, regardless of pump wavelength. This suggests very little ML coverage, since only ML domains posses the direct gap necessary for efficient PLMak et al. (2010); Eda et al. (2011); Splendiani et al. (2011).
At first glance, dipole selection rules prevent generation of even-ordered non-linearities in MoS2 due to inversion symmetry, which is only broken in finite samples consisting of an odd number of 2H-stacked MoS2 layersLi et al. (2013); Kumar et al. (2013); Malard et al. (2013). On the other hand, thick flakes, such as those investigated here, are not expected to display properties markedly different from bulk samples. From a simplistic point of view, the layer-selective vanishing SH response may be understood from the fact that adjacent layers are mirror images of each other in the -plane, as depicted in Fig. 1(a). Hence, in the limit of weak inter-layer coupling, adjacent layers contribute anti-symmetrically to the SH response function . While this means that the net polarization of two adjacent MoS2 layers cancels in the dipole approximation, the spatial variation of the driving field makes this cancellation only approximate. Indeed, previous measurements on bulk MoS2 crystals confirm this, with non-vanishing (although very weak) SH signals reportedWagoner et al. (1998); Li et al. (2013). It is this effect that allows us to perform SH spectroscopy on many-layered MoS2 samples. We here analyse the measured response in terms of an effective, spatially dependent SH susceptibility , constructed from the effective sheet susceptibilities of the individual MLs, viz
| (1) |
Here, Å is the centre-to-centre interlayer distance depicted in Fig. 1(a).
The SH experiments are performed using a Nd:YAG pumped optical parametric oscillator, yielding 5 ns pulses at a repetition rate of 10 Hz and average pulse energies of approximately 1 mJ at the sample. Measurements on flake and bulk samples are recorded in transmission and reflection configuration, respectively, using a small optical angle of incidence approximating 4∘. Furthermore, the spectral distribution of the emitted radiation was analysed with great care to rule out contributions from competing non-linear processes, such as two-photon PL. All results are reported relative to the SH intensity reflected from an -quartz (Qrz) wedge, related to the pump intensity by the expression . The bulk SH susceptibility of quartz has been measured toHagimoto and Mito (1995) pm/V, while the SH reflection coefficient has been derived beforeBloembergen and Pershan (1962).
We also note that the applied spot size is on the order of 1 mm2, hence, encompassing multiple crystal domains of random orientation. For this reason, we are not able to observe rotational anisotropy, which is routinely seen when investigating few-layered TMDs by SH microscopyLi et al. (2013); Malard et al. (2013); Kumar et al. (2013). Further, the various domains are mapped onto separate areas of the PMT detector, which means their respective contributions add incoherently, ruling out interference effects from adjacent crystal grains.
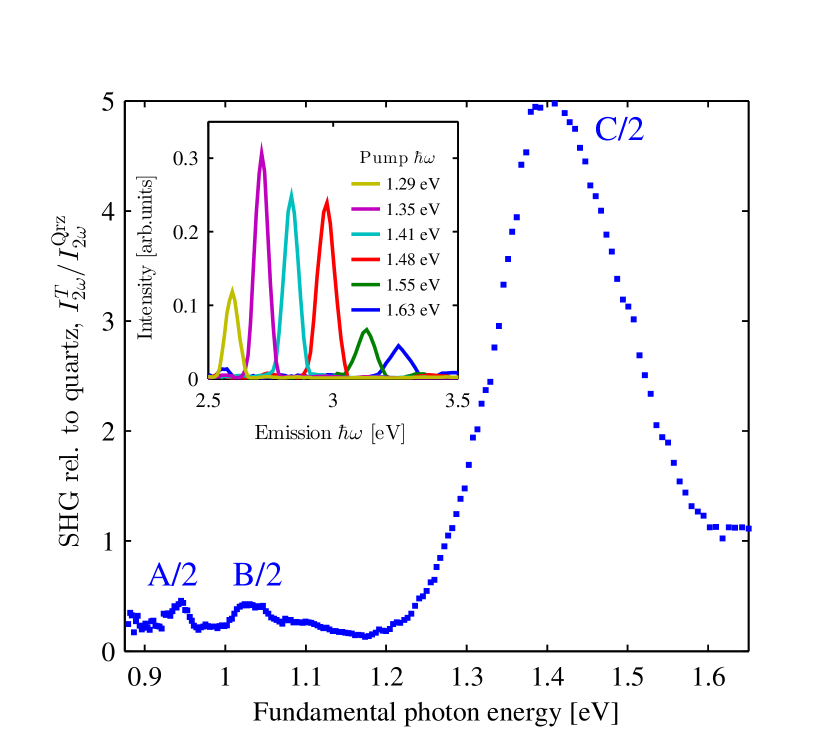
In Fig. 2, we present the measured SH transmission intensity spectrum for a sample with MoS2 flakes. We observe clear maxima in the SH spectrum at fundamental photon energies corresponding to half the energies of the linear absorption features denoted A, B, and C in Ref. Li et al., 2014. Similar maxima appear in our simulationTrolle et al. (2014) of the excitonic SH response of ML MoS2, where the corresponding peaks in the SH spectrum were dubbed A/2, B/2, and C/2, as also indicated on Fig. 2. Such ML simulations do not include effects of interlayer coupling, which are obviously present in the samples investigated here. To consider effects of multiple layers, we have extended our exciton modelTrolle et al. (2014) to study SH generation in trilayer (TL) MoS2, which represents a minimal MoS2 multilayer flake without inversion symmetry. We expand exciton states in a basis of singly excited Slater determinants, which are, in turn, constructed from tight-binding orbitals derived from the parameters of Ref. Zahid et al., 2013. For MLs, the low-energy spectrum is dominated by transitions from the spin-orbit split top valence bands to the degenerate conduction bands near the K-points of the Brillouin zone, giving rise the A and B excitons, as mentioned. In bilayer MoS2, a very similar picture with two split, doubly degenerate top valence bands and a degenerate conduction band minimum near the K-points is observed. Here, however, the splitting is not a spin-orbit effect, but due to crystal field splitting arising from interlayer coupling. In TL MoS2, we observe a combination of spin-orbit and crystal field splitting, giving rise to two groups of triply near-degenerate valence bands, which preserve the low-energy A/B exciton structure. When adding more layers, transitions in the energy range corresponding to the C peak become dominated by additional bands, which are not degenerate, resulting in a broadened C-feature. See the supplementary materialTrolle et al. (2015) for more information. We apply a relatively dense -grid, including 24 valence and 24 conduction bands. Hence, this problem is computationally difficult, and certainly beyond the scope of direct diagonalization. However, by carefully block diagonalizing the BSE based on out-of-plane symmetry, and by using our Lanczos/Haydock approach for calculation of SH response functionsTrolle et al. (2014), we are able to generate converged optical spectra. Furthermore, as described in Ref. Qiu et al., 2013, linear spectral features are increasingly broadened with increasing photon energy due to electron-phonon scattering. Here, we approximate this effect by implementing a frequency-dependent phenomenological broadening function, which we take to increase linearly with SH photon energies larger than the fundamental exciton energyTrolle et al. (2015). Note, the simulated TL sheet susceptibility is calculated in the dipole approximation, hence, it represents the sheet susceptibility averaged over the three-layer structure while including interlayer coupling. Hence, this quantity is fundamentally different from , which is an effective ML property valid for electronically decoupled layers.
In Fig. 3, we include the calculated SH response function for TL MoS2, and compare it with the square root of the observed SH signal. The latter quantity is related to the SH response function via , where is the surface coverage and is a SH transmission coefficient for an layer flakeTrolle et al. (2015). As already discussed, both and are unknown quantities for the flake samples. However, by assuming to depend only weakly on frequency, the square root of the observed SH signal may be compared directly with the SH response function . Indeed, we observe the important A/2, B/2 and C/2 features both in experiments and theory, with similar relative intensities. The theoretical observation of a C/2 splitting absent in the experiments may be attributed to the simplistic implementation of scattering effects. In fact, the linear case is often subject to similar deficienciesTrolle et al. (2014); Qiu et al. (2013). In the inset of Fig. 3, we compare ML and TL results. Although similar trends are found, we clearly observe an effect of including multiple layers, which is more pronounced than for the linear caseTrolle et al. (2015). For the TLs, we observe a slight enhancement of the A/2 and B/2 features relative to the ML case. Furthermore, in the studies using SH spectroscopy Malard and co-workersMalard et al. (2013) have demonstrated how the C/2 peak in ML samples is slightly red-shifted and broadened in TL samples (we include the spectra of Malard et al.Malard et al. (2013) in Fig. 3 for comparison). The theoretical results shown in the inset reproduce this trend.
We note that the observed SH intensity, displayed in Fig. 2, is roughly five times larger than the quartz reference signal, even though the sample was covered by roughly 10% MoS2 flakes. Hence, this hints at the extraordinarily largeMalard et al. (2013); Kumar et al. (2013); Li et al. (2013) SH response of few-layered MoS2. Unfortunately, we are not able to extract absolute values of the SH susceptibilities from measurements on flake samples due to uncertain surface coverages and flake thicknesses. However, our measurements on a 5 mm thick bulk MoS2 sample are not affected by thickness due to absorption. For fundamental photon energies near 1.4 eV, i.e. at the C/2 resonance, we measure a SH intensity reflected the bulk sample approximately 60 times larger than the SH quartz reference signal. To extract an effective sheet susceptibility from this value, we note that the intensity of the reflected SH signal may be related to the fundamental intensity and by the relation , where is a SH reflection coefficient valid for an -layer structure. The reflection coefficient , suitable for an inhomogeneous non-linear response given by Eq. 1, may be found using a relatively compact expressionTrolle et al. (2015), which in the bulk and ML limits yield

| (2) | ||||
| (3) |
Here, while the optical phase shift upon propagating through a single ML is taken to be negligible compared to the shift across all layers. Furthermore and are, respectively, the refractive indices of fused silica and MoS2Malitson (1965); Li et al. (2014). We note that the ML limit Eq. 3 is identical to the response derived starting from a non-linear surface -polarizationSipe (1987); Shen (1989), and has been applied before for the study of few-layered TMDsMalard et al. (2013); Li et al. (2013). Also, the bulk to ML intensity ratio at eV may be evaluated to % , agreeing favourably with previously reported resultsLi et al. (2013). It is also noted that the bulk expression Eq. 2 is very similar to the corresponding result for SH reflection from an infinite medium with homogeneous non-linear responseBloembergen and Pershan (1962), with the main difference being the proportionality, reflecting the fact that acts as an effective bulk susceptibility.
Since we measure the ratio , and since we have expressions for both and in addition to , we may estimate an effective ML sheet susceptibility defined previously in Eq. 1 to nm2/V.
Based on our measurements, we find the effective sheet SH susceptibility to be somewhat larger than the nm2/V reported for MoS2 MLs on quartz substrate in Refs. Malard et al., 2013 and Li et al., 2013. On the other hand, in Ref. Kumar et al., 2013 susceptibilities as large as 60 nm2/V are reported. In addition to the experimental values mentioned, on-resonance moduli of derived from theory are typically in the nm2/V rangeTrolle et al. (2014); Grüning and Attaccalite (2014); Wang and Guo . Hence, the absolute value of the SH response function of MoS2 is still a topic of considerable debate. We note that results generated using advanced microscopy techniques for resolution of individual TMD flakes with well-defined thickness, and by applying well-documented reference measurements for extraction of absolute values, such as Refs. Li et al., 2013; Malard et al., 2013, should be regarded with a high degree of validity.
The bulk crystal applied in our work is composed of multiple grains, with different orientations. On the boundaries of such grains, the odd/even layer anti-symmetry, implying dipole cancellation for perfectly stacked samples, does not lead to complete cancellation due to misalignment. Hence, these domains might give rise to an additional SH signal, perhaps partly explaining the large response measured here.
In conclusion, we have extended the experimentally available SH spectrum of multi-layered MoS2 flakes to include the broad fundamental photon energy range between 0.85 and 1.7 eV. Moreover, we have performed an exciton simulation of the nonlinear optical properties of TL MoS2, and find the key features of the simulated spectrum to be in good agreement with the experimentally observed spectrum. Hence, in this work, we have identified experimentally the signatures of the A, B and C excitons, in addition to the relative intensities of the resulting peaks. Hence, these results extend the spectral region in which experimental data are now available for comparison with theoretically derived SH spectra, allowing for future comparisons with more advanced models.
Acknowledgements
The authors gratefully acknowledge the financial support from the Villum Foundation Center of Excellence QUSCOPE. The authors also express their gratitude to the Centre of Scientific Computing Aarhus (Aarhus University) for access to the Grendel computer cluster. Furthermore, the authors would like to thank Bjarke Jessen at the Technical University of Denmark for supplying the investigated MoS2 flakes. Additionally, we also gratefully acknowledge the authors of Ref. Malard et al., 2013 for supplying their experimental results, which are reproduced in Fig. 3 for comparison.
References
- Mak et al. (2010) K. F. Mak, C. Lee, J. Hone, J. Shan, and T. F. Heinz, Phys. Rev. Lett. 105, 136805 (2010).
- Splendiani et al. (2011) A. Splendiani, L. Sun, Y. Zhang, T. Li, J. Kim, C.-Y. Chim, G. Galli, and F. Wang, Nano Lett. 10, 1271 (2011).
- Eda et al. (2011) G. Eda, H. Yamaguchi, D. Voiry, T. Fujita, M. Chen, and M. Chhowalla, Nano Lett. 11, 5111 (2011).
- Zhang et al. (2014) Y. Zhang, T.-R. Chang, B. Zhou, Y.-T. Cui, H. Yan, Z. Liu, F. Schmitt, J. Lee, R. Moore, Y. Chen, H. Lin, H.-T. Jeng, S.-K. Mo, Z. Hussain, A. Bansil, and Z.-X. Shen, Nat. Nano 9, 111 (2014).
- Komsa and Krasheninnikov (2012) H.-P. Komsa and A. V. Krasheninnikov, Phys. Rev. B 86, 241201 (2012).
- Qiu et al. (2013) D. Y. Qiu, F. H. da Jornada, and S. G. Louie, Phys. Rev. Lett. 111, 216805 (2013).
- Wang et al. (2014) G. Wang, X. Marie, I. Gerber, T. Amand, D. Lagarde, L. Bouet, M. Vidal, A. Balocchi, and B. Urbaszek, arXiv:1404.0056 (2014).
- Radisavljevic et al. (2011) B. Radisavljevic, A. Radenovic, J. Brivio, V. Giacometti, and A. Kis, Nat. Nanotechnol. 6, 147 (2011).
- Yin et al. (2012) Z. Yin, H. Li, H. Li, L. Jiang, Y. Shi, Y. Sun, G. Lu, Q. Zhang, X. Chen, and H. Zhang, ACS Nano 6, 74 (2012).
- Larentis et al. (2012) S. Larentis, B. Fallahazad, and E. Tutuc, Appl. Phys. Lett. 101, 223104 (2012).
- Georgiou et al. (2013) T. Georgiou, R. Jalil, B. D. Belle, L. Britnell, R. V. Gorbachev, S. V. Morozov, Y.-J. Kim, A. Gholinia, S. J. Haigh, O. Makarovsky, L. Eaves, L. A. Ponomarenko, A. K. Geim, K. S. Novoselov, and A. Mishchenko, Nat. Nano 8, 100 (2013).
- Chuang et al. (2014) H.-J. Chuang, X. Tan, N. J. Ghimire, M. M. Perera, B. Chamlagain, M. M.-C. Cheng, J. Yan, D. Mandrus, D. Tománek, and Z. Zhou, Nano Lett. 14, 3594 (2014).
- Jo et al. (2014) S. Jo, N. Ubrig, H. Berger, A. B. Kuzmenko, and A. F. Morpurgo, Nano Lett. 14, 2019 (2014).
- Malard et al. (2013) L. M. Malard, T. V. Alencar, A. P. M. Barboza, K. F. Mak, and A. M. de Paula, Phys. Rev. B 87, 201401 (2013).
- Kumar et al. (2013) N. Kumar, S. Najmaei, Q. Cui, F. Ceballos, P. M. Ajayan, J. Lou, and H. Zhao, Phys. Rev. B 87, 161403 (2013).
- Li et al. (2013) Y. Li, Y. Rao, K. F. Mak, Y. You, S. Wang, C. R. Dean, and T. F. Heinz, Nano Lett. 13, 3329 (2013).
- Janisch et al. (2014) C. Janisch, Y. Wang, D. Ma, N. Mehta, A. L. Elias, N. Perea-Lopez, M. Terrones, V. Crespi, and Z. Liu, Sci. Rep. 4, (2014).
- Hsu et al. (2014) W.-T. Hsu, Z.-A. Zhao, L.-J. Li, C.-H. Chen, M.-H. Chiu, P.-S. Chang, Y.-C. Chou, and W.-H. Chang, ACS Nano, ACS Nano 8, 2951 (2014).
- Yin et al. (2014) X. Yin, Z. Ye, D. A. Chenet, Y. Ye, K. O’Brien, J. C. Hone, and X. Zhang, Science 344, 488 (2014).
- Chernikov et al. (2014) A. Chernikov, T. C. Berkelbach, H. M. Hill, A. Rigosi, Y. Li, O. B. Aslan, D. R. Reichman, M. S. Hybertsen, and T. F. Heinz, Phys. Rev. Lett. 113, 076802 (2014).
- Molina-Sánchez et al. (2013) A. Molina-Sánchez, D. Sangalli, K. Hummer, A. Marini, and L. Wirtz, Phys. Rev. B 88, 045412 (2013).
- Trolle et al. (2014) M. L. Trolle, G. Seifert, and T. G. Pedersen, Phys. Rev. B 89, 235410 (2014).
- Grüning and Attaccalite (2014) M. Grüning and C. Attaccalite, Phys. Rev. B 89, 081102 (2014).
- (24) C.-Y. Wang and G.-Y. Guo, arXiv: 1409.0937 .
- Li et al. (2014) Y. Li, A. Chernikov, X. Zhang, A. Rigosi, H. M. Hill, A. M. van der Zande, D. A. Chenet, E.-M. Shih, J. Hone, and T. F. Heinz, Phys. Rev. B 90, 205422 (2014).
- Wagoner et al. (1998) G. A. Wagoner, P. D. Persans, E. A. V. Wagenen, and G. M. Korenowski, J. Opt. Soc. Am. B 15, 1017 (1998).
- Hagimoto and Mito (1995) K. Hagimoto and A. Mito, Appl. Opt. 34, 8276 (1995).
- Bloembergen and Pershan (1962) N. Bloembergen and P. S. Pershan, Phys. Rev. 128, 606 (1962).
- Zahid et al. (2013) F. Zahid, L. Liu, Y. Zhu, J. Wang, and H. Guo, AIP Adv. 3, 052111 (2013).
- Trolle et al. (2015) M. L. Trolle, Y.-C. Tsao, K. Pedersen, and T. G. Pedersen, Supplementary material to the present paper. (2015).
- Malitson (1965) I. H. Malitson, J. Opt. Soc. Am. 55, 1205 (1965).
- Sipe (1987) J. E. Sipe, J. Opt. Soc. Am. B 4, 481 (1987).
- Shen (1989) Y. R. Shen, Annu. Rev. Phys. Chem. 40, 327 (1989).