Too big to be real? No depleted core in Holm 15A
Abstract
Partially depleted cores, as measured by core-Sérsic model “break radii”, are typically tens to a few hundred parsecs in size. Here we investigate the unusually large ( = 4.57 kpc) depleted core recently reported for Holm 15A, the brightest cluster galaxy of Abell 85. We model the 1D light profile, and also the 2D image (using Galfit-Corsair, a tool for fitting the core-Sérsic model in 2D). We find good agreement between the 1D and 2D analyses, with minor discrepancies attributable to intrinsic ellipticity gradients. We show that a simple Sérsic profile (with a low index and no depleted core) plus the known outer exponential “halo” provide a good description of the stellar distribution. We caution that while almost every galaxy light profile will have a radius where the negative logarithmic slope of the intensity profile equals 0.5, this alone does not imply the presence of a partially depleted core within this radius.
Subject headings:
keyword: galaxies: elliptical and lenticular, cD — galaxies: individual (Holm 15A) — galaxies: photometry — galaxies: structure1. Introduction
Luminous early-type galaxies ( 20.5 0.75 mag) typically possess a core that is partially depleted of stars (e.g. Dullo & Graham, 2014, and references therein). This is evident by a marked flattening of their inner light distribution (King & Minkowski, 1966, 1972; Kormendy, 1982; Lauer, 1983; Byun et al., 1996). The light profiles of these bright galaxies typically have a negative, inner logarithmic slope 0.3, and have been fit using the King model (King, 1962, 1966), the “Nuker law” (Grillmair et al., 1994; Kormendy et al., 1994; Lauer et al., 1995; Ravindranath et al., 2001; Rest et al., 2001), and the core-Sérsic model (Graham et al., 2003; Trujillo et al., 2004; Ferrarese et al., 2006). The Nuker model was designed to investigate the inner-most regions of nearby early-type galaxies, and its double power-law nature was never intended to adapt to the full, outer, intrinsically curved –like profiles of galaxies (e.g. Faber et al., 1997, their Section 2). The outer curvature in galaxies results in a profile whose slope changes as a function of radius. As a consequence, the slope of a fitted Nuker model’s outer power law () varies with the fitted radial extent of a galaxy. Due to parameter coupling, it follows that all of the Nuker model parameters are a function of the fitted radial extent (Graham et al., 2003, Figures 2–4). The coupling is such that the Nuker model “break radii” are heavily over-estimated, relative to the radius of maximum curvature in the actual profile, i.e. the “break”, and increasingly so as the fitted radial extent is increased (Trujillo et al., 2004). This contributed to Lauer et al. (2007) adopting the radius where the Nuker model has a negative logarithmic slope of equal to 0.5 (Carollo et al., 1997) as a measure of the core size. All galaxy light profiles, even those with no depleted cores, have a radius where equals 0.5.
In Graham et al. (2003) it was shown how a Nuker model (with an inner power-law slope 0.3) can approximate a Sérsic profile (without any depleted core) if the profile has a low Sérsic index and thus a shallow inner profile slope. Dullo & Graham (2013) showed that this has occurred when modelling several real galaxies. Most recently, for example, Krajnović et al. (2013) report that their ATLAS3D galaxy NGC 4473 is a core galaxy according to their Nuker model fit. However, it actually contains an additional nuclear component rather than a depleted core (Krajnović et al., 2006), which Dullo & Graham (2014) have shown through the use of the Sérsic and core-Sérsic models. The core-Sersic model was introduced, in part, to prevent confusion when a profile has a shallow inner slope but no central deficit of stars, and to provide more robust, physically meaningful radii, slopes, and flux deficits for partially depleted cores.
Core sizes, as measured by the break radii of the core-Sérsic model (), are typically tens to a few hundred parsecs (e.g. Trujillo et al., 2004; Ferrarese et al., 2006; Richings et al., 2011; Dullo & Graham, 2012, 2013, 2014; Rusli et al., 2013). These core-Sérsic break radii are where the core-Sérsic model has its maximum curvature, and, for galaxies with depleted cores, Dullo & Graham (2012, their Section 5.2) revealed that this also matches well with the cusp radius111 The cusp radius is defined as the radius at which the negative logarithmic slope of the intensity profile equals a pre-specified value (Carollo et al., 1997). Hereafter we will use to actually indicate . where the negative logarithmic slope of the projected light profile equals 0.5. As noted, galaxies without partially depleted cores can also possess such a radius, and therefore one still needs to establish if there is an inner deficit relative to the outer profile. Indeed, many galaxies have an inner profile slope shallower than 0.5, and 0.3, but do not have a partially depleted core (Graham & Guzmán, 2003; Dullo & Graham, 2013, their appendix A.2). A thorough review of galaxy light profiles can be found in Graham (2013).
One of the most accredited scenarios for core formation attributes the depletion to the scouring action of black hole (BH) binaries formed during dry galaxy merger events. The binary depletes the centre of a galaxy by ejecting stars via three-body interactions which result in the orbital decay of the binary (e.g. Begelman et al., 1980; Ebisuzaki et al., 1991; Milosavljević & Merritt, 2001; Merritt, 2006).
Merritt (2006) suggested that the stellar mass depleted via the binary BH scouring mechanism scales as 0.5, where is the effective number of major dry mergers which the galaxy experienced. However, the observational result that is typically 0.5–4 (e.g. Graham, 2004; Ferrarese et al., 2006; Hyde et al., 2008; Rusli et al., 2013; Dullo & Graham, 2014), implies that the core galaxies characterized by the larger / ratio should have experienced up to 8 major dry mergers. Such a number of major mergers near or above this figure is excessive if compared to the merger rates derived from the observation of close massive galaxy pairs in the local ( 0.8) Universe (e.g. Bell et al., 2006; De Propris et al., 2007; Casteels et al., 2014). A second mistery is that Savorgnan & Graham (2015) have revealed that the large bulges with over-massive BHs (or low velocity dispersions) in the – diagram do not have larger / ratios as expected from dry mergers and as suggested by Volonteri & Ciotti (2013).
The depleted core radius is indicative of the central mass depletion experienced by the galaxy, modulo the pre-existing central stellar density profile. Scaling relations exist between the final merged mass () of the central super-massive black hole (SMBH) and both the ejected stellar mass (e.g. Graham, 2004; Ferrarese et al., 2006) and the core radii (e.g. Lauer et al., 2007; Dullo & Graham, 2013, 2014; Rusli et al., 2013). These studies have described the –(core radius) correlation using a log-linear relation, albeit with large uncertainties due to significant scatter in the data. The ongoing effort to characterize the high mass end of the relations is necessary to investigate whether a single slope is appropriate to describe the – diagram, as is currently assumed in the range 108 / 1010. A bend in the – relation may, for example, indicate different regimes of efficiency for the BH scouring mechanism. For instance, Kulkarni & Loeb (2012) have suggested that multiple (i.e., more than 2) SMBH systems can significantly increase the effectiveness of the scouring activity, and generate cores with a mass deficit up to five times .
A non-linear relation may also indicate that additional mechanisms other than binary BH scouring are operating. For example, a “kicked” SMBH can create an enhanced depleted core by crossing the nucleus multiple times (e.g. Redmount & Rees, 1989; Merritt et al., 2004; Boylan-Kolchin et al., 2004; Gualandris & Merritt, 2008). In this scenario, the SMBH is placed on a radial orbit, intersecting with the nucleus, after the recoil acquired upon its creation from the coalescence of a specially-oriented BH binary. Such a recoil is generated in response to the linear momentum carried away by the anisotropic emission of gravitational waves.
Another possibility for creating large cores is the “stalled binary” model (Goerdt et al., 2010), which proposes that the scouring activity is performed by a captured in-falling object. In this picture, a “perturber” spirals towards a galaxian center due to dynamical friction. The “stalled binary” scenario of Goerdt et al. (2010) predicts core radii up to 3 kpc and scaling as the mass of the perturber. In doing so, it exerts a tidal action on the central mass distribution, shredding it and creating a partially depleted core. This model predicts that the core radius will correspond to the orbit at which the infall of the perturber stalls due to a reduced efficiency of the dynamical friction. In yet another scenario, Martizzi et al. (2012) argued that the feedback action of an active galactic nucleus (AGN) might be an important factor in the creation of cores. The AGN feedback models by Martizzi et al. (2012) easily produce core radii of sizes up to 10 kpc although not yet confirmed. In this model, AGN-driven gas outflows generate fluctuations in the gravitational potential of the central region, from which stars are removed during the subsequent re-virialization and adjustment process. The expulsion of gas from the inner region might also induce an adiabatic expansion of the central stellar distribution, hence flattening the central mass density profile.
Based on the extrapolation of the relation between the luminosity of the host spheroid () and (e.g. Graham & Scott, 2013; Graham, 2015b), some Brightest Cluster Galaxies (BCGs) are expected to host extremely massive BHs ( 1010 ). Recent N-body simulations including the effects of dark matter, black holes, as well as baryons, have shown that black hole scouring in BCGs can create cores as large as 3 kpc (Laporte & White, 2014). Therefore, the study of BCGs is important to explore the scarcely-populated high-mass end of the – diagram, and hence provide better constraints on the – scaling relation and the formation physics involved.
1.1. The case of Holm 15A
López-Cruz et al. (2014, hereafter: LC14) studied the BCG Holm 15A (D = 253 Mpc)222 Luminosity distance from NED, relative to the Cosmic Microwave Background, assuming H0 = 67.30 km s-1 Mpc-1, = 0.315, = 0.685 (Planck+WMAP; Planck Collaboration et al., 2014). , located within the galaxy cluster Abell 85, and reported the discovery of the largest depleted core known using the Nuker model. They found a cusp radius = 4.57 0.06 kpc, which supersedes the record previously reported for the BCG in Abell 2261 ( 3.2 kpc; Postman et al., 2012). The cusp radius of Holm 15A is not only more than three times larger than the average obtained by Lauer et al. (2007) using the Nuker model for their sub-sample of 60 BCGs, but is also significantly larger than the biggest recorded core-Sérsic model break radius ( 1.5 kpc) reported by Hyde et al. (2008) for the massive elliptical galaxy SDSS J091944.2+562201.1.
LC14 derived fitting a 2D Nuker model to an image of Holm 15A within a major-axis radius of 80 kpc. They confirmed their measurement of non-parametrically from the 1D radial light profile (i.e., applying the definition given in Footnote 1). However, their inner light deficit () was not calculated using the Nuker model, but rather as the difference between a double-Sérsic fit (intended to represent the actual galaxy light distribution) and a de Vaucouleurs (1948) R1/4 profile (intended to reproduce the “pristine” light profile prior to the redistribution of the inner core light). This unconventional light deficit was then used to derive a BH mass using the – relation of Kormendy & Bender (2009), giving an exceptionally high 1011 . LC14 assessed the viability of this value by comparing it against the value of estimated using other methods. Since no direct (dynamical) measurement of the mass of the SMBH of Holm 15A is available, LC14 resorted to using the scaling relations between and: the stellar velocity dispersion (); the total luminosity of the bulge; the Nuker model break radius; and (Kormendy & Ho, 2013, and references therein). This analysis ultimately lead them to favor a more conservative 1010 .
Is the exceptionally large core of Holm 15A really due to a deficit of light relative to the inward extrapolation of its outer light profile? Is there an obvious and dramatic downward bend to its inner light profile? We have further investigated the case of Holm 15A by performing a detailed analysis of the light distribution of the galaxy. For the first time, we apply the core-Sérsic model and check if a depleted core is warranted over a core-less model (i.e. a Sérsic model).
This paper is structured as follows. In §2, we present the data and the procedure used for modeling the 1D light profile and the 2D image of the galaxy. In §3 we show that the light in Holm 15A is well fit by a three-parameter Sérsic function plus an exponential “halo” and as such it does not appear to have a partially depleted core with a well-defined break in the light profile. We summarize our conclusions in §4.
2. Data
We have used an -band333 Nominally, in the .MP9601 filter. This band corresponds to the SDSS -band, to which we will refer hereafter. image from the wide-field MegaPrime camera mounted on the Canadian-French-Hawaiian-Telescope (CFHT). The image was retrieved from the Canadian Astronomy Data Center444 \seqsplithttp://www2.cadc-ccda.hia-iha.nrc-cnrc.gc.ca (CADC). This enabled us to make a direct comparison with LC14, who used Kitt Peak National Observatory (KPNO) and CFHT data, in the and bands, respectively. We have based our analysis on the CFHT data because — to our knowledge — they represent the publicly available images for Holm 15A with the best seeing quality. A narrow point spread function (PSF) is important to detect core structures, whose projected sizes, even in the closest galaxies, are of the order of a few arcseconds or less.
The detector of the CFHT MegaPrime camera is composed of 36 CCDs (21124644 pixels each) covering a sky area of 1 square degree. Every MegaPrime image in the CADC is reduced via the Elixir pipeline (Magnier & Cuillandre, 2004), which performs the basic data calibration, including bias subtraction, flat-fielding, de-fringing, and astrometric calibration. The CFHT data used by LC14 was a single 120 s exposure. We searched the CADC archive for a similar data set, and discovered that all the images were severely affected by scattered light. This scattered light, which appears as a diffuse radial gradient across the image, is known to plague the MegaPrime data and it is due to unwanted internal reflections through the optics. This wavelength-dependent issue, especially prominent in the -band, was extensively reviewed by Duc et al. (2015).
Due to the lack of an analytical description for the scattered light, it could not be readily disentangled from the smoother sky background. We therefore modeled the combined background (sky + scattered light), and subtracted the contribution from the two components at the same time. Since Holm 15A easily fits within one single MegaPrime CCD, still allowing ample margins to determine the background, we performed this operation and the other analyses only on the CCD which was centered on the galaxy. First, we ran SExtractor (Bertin & Arnouts, 1996) to determine the (i.e. the radius encompassing 90% of the flux) of each source in the image, and to obtain a median estimate of the remaining background flux and of the background root-mean-square (RMS) fluctuation. Each detected source was masked using an elliptical region with a major axis equal to twice the size of the of the source, and with axis ratio and position angle (P.A.) as determined by SExtractor; in addition, we masked any 5 fluctuation about the median background flux. Finally, we used Galfit (Peng et al., 2010) to fit a 2D gradient to the background, adopting the SExtractor median background as the initial guess for the value at the image center. Figure 1 shows our background-subtracted -band image (see Table 1 for image specifications).
\begin{overpic}[width=208.13574pt]{Holm15A_S+D+C_image.eps} \put(5.0,5.0){{\color[rgb]{1,1,1}IMAGE}} \end{overpic} \begin{overpic}[width=208.13574pt]{mask_Holm15A_S+D+C.eps} \put(5.0,5.0){{\color[rgb]{1,1,1}MASKED IMAGE}} \end{overpic}
The masked areas (see §2) have been arbitrarily decreased in intensity so as to still show the contaminating objects. We overplot the elliptical isophotes from IRAF.ellipse (the boxiness of the ellipses is not considered in this representation). The dashed ellipse corresponds to the limiting surface brightness at which we truncated our 1D analysis ( 25.5 mag arcsec-2; see §2). This ellipse also corresponds to the physical extent of the 2D fit (everything outside the dashed curve was masked for the 2D fit; see §2).
| Target | RA (J2000) | Dec (J2000) | Camera/Filter | Exposure | Scale | ||
|---|---|---|---|---|---|---|---|
| [hh:mm:ss] | [dd:mm:ss] | [Mpc] | [mag] | [sec] | [/pixel] | ||
| (1) | (2) | (3) | (4) | (5) | (6) | (7) | (8) |
| Holm 15A | 00h41m50s.5 | -091811 | 253 | 37.02 | MegaPrime/ | 120 | 0.186 |
Note. — Details of the CFHT-MegaPrime image used for the current work.
(1) Target name. (2,3) Target coordinates from NED. (4) Luminosity distance from NED, corresponding to a redshift 0.057 (see Footnote 2). (5) Distance modulus. (6) CFHT camera and filter. (7) Total exposure time. (8) Image pixel scale.
2.1. The 1D radial light profile
An object mask was created using the SExtractor detections, and then further refined by hand after visual inspection to exclude cosmic rays, hot pixels, and smaller sources over-lapping with Holm 15A. The right panel of Figure 1 shows the CFHT mosaic with the masked areas down-scaled by an arbitrary amount; we also overplot the elliptical isophotes derived using the IRAF.ellipse task (Jedrzejewski, 1987).
Figure 2 shows the radial profiles along the semi-major axis (SMA) obtained from IRAF.ellipse for the: -band surface brightness (); ellipticity (); 4th harmonic deviation from perfect ellipticity ( ”boxiness/diskiness” parameter); P.A.; and isophote centroid shift. We observe that beyond 2, the ellipticity is steadily increasing, except for a flattening in the range 10–30. Increasing ellipticities have been shown to be common for BCGs, and they can be due to the projection of the prolate (or triaxial) structure of the outer regions (typically beyond 45 kpc) of these objects (e.g. Porter et al., 1991).
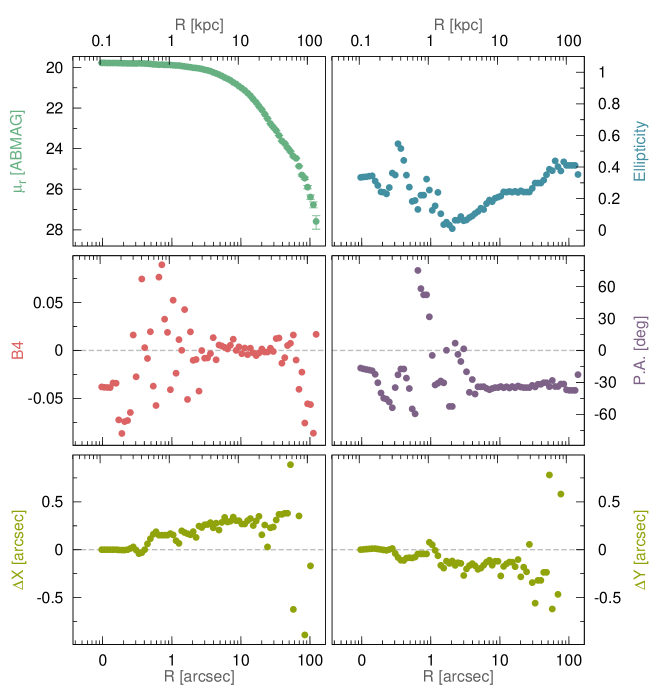
The fitting of models to the light profile (see §2.3) have been performed via a Levenberg-Marquardt minimization procedure, as described in Dullo & Graham (2014). We chose to limit the fit to 25.5 mag arcsec-2 (approximately corresponding to SMA 90 kpc), based on where the residual large scale background gradient (i.e., after the background subtraction process described above) becomes comparable to the galaxy light gradient. This limit roughly corresponds to the radius at which the elliptical isophotes stop being concentric (see Figure 1, right panel).
2.2. The 2D image
Modeling of the 2D light distribution was performed using Galfit-Corsair555 \seqsplitwww.astronomy.swin.edu.au/~pbonfini/galfit-corsair/ (Bonfini, 2014), a tool developed to include the core-Sérsic model into the Galfit fitting algorithm666 Galfit-Corsair is retro-compatible with Galfit. .
To maximize the consistency with the 1D analysis, we restricted the fit within the 25.5 mag arcsec-2 isophote (see §2.1) by masking every pixel outside it (see Figure 1, right panel). The Galfit-Corsair mask was hence obtained by combining this filter with the object mask described before. The PSF template was built with PSFEx (Bertin, 2011), combining 20 stars with signal-to-noise ratios () 100. Since the variation of the PSF FWHM was negligible across the CCD (less than 5%), we selected stars from all areas. The FWHM of the resulting PSF model is 0.75, in agreement with the value measured for real stars in the image. Finally, the weight (“sigma”) image was constructed using the internal Galfit algorithm, to which we supplied an estimate of the sky RMS as measured on the image by using SExtractor.
We warn the reader that the varying ellipticity of Holm 15A (Figure 2, top-right panel) can pose a challenge for the 2D fitting, because in Galfit-Corsair, as with Galfit, each galaxy component is associated with a single ellipticity and position angle. When the components of real galaxies have ellipticity gradients, the model does not allow for this. That is, even when a galaxy is decomposed into multiple components, the problem might persist whenever the ellipticity profile has a significant gradient over the range where any single component dominates. This issue is of no concern when modeling the 1D profile, which is simply extracted along the major axis. As such, small discrepancies are expected between the 1D and 2D analyses.
2.3. The choice of models
To investigate the presence of a partially depleted core in Holm 15A, we separately fit a seeing-convolved Sérsic model and a seeing-convolved core-Sérsic model, in both 1D and 2D. As noted and modelled by LC14, Holm 15A has a halo of light around it. The “bump” in the radial light profile at around 35 kpc, which also corresponds to a step in the ellipticity profile (see Figure 2), does indeed suggest that the galaxy hosts a second component. We therefore added an outer [seeing-convolved] exponential function to the Sérsic/core-Sérsic “bulge”, capturing the “halo” of Intra-Cluster Light (ICL). An exponential halo model was used following Seigar et al. (2007), who revealed that the halos of BCGs are typically exponential; see also Pierini et al. (2008). We did additionally model the ICL with a Sérsic model, but we found that it yielded a Sérsic index of 1, i.e. an exponential model.
The best-fit parameters obtained for the aforementioned models are reported in Table 2, while the model profiles are represented in Figure 3 (1D fit) and in the left and central panels of Figure 4 (2D fit). We stress that the profiles shown in Figure 4 represent a 1D projection of the 2D images and 2D models rather than what was actually minimized, namely the difference between the 2D image and model, as shown in lower panels of Figure 4. This projection was performed measuring the surface brightness of these images along the isophotes identified with IRAF.ellipse in our 1D analysis (see §2.1). In the next section, we will first mention the small discrepancies between the results of the 1D and 2D modeling, and then proceed to discuss the selection of the best-fit model.
2.4. Fit comparison and choice of best-fit model
Overall, our results from the modeling of the 1D light profile and the 2D image agree very well (see Table 2). However, the 1D projection of the 2D residuals (Figure 4) show a more pronounced pattern than seen the 1D residuals (Figure 3). This is partly an artifact of the particular choice of projection, and partly a direct consequence of each 2D model component of Galfit-Corsair having a single center and ellipticity weighted over the whole extent of the fit area. Here we will review the implications of these caveats over two specific regions.
| \begin{overpic}[angle={0},height=216.81pt]{1D_S+D.eps} \put(28.0,40.0){{\color[rgb]{0,0,0}{S\'{e}rsic{}+exponential}}} \end{overpic} | \begin{overpic}[angle={0},height=216.81pt]{1D_cS+D.eps} \put(8.0,41.0){{\color[rgb]{0,0,0}{core-S\'{e}rsic{}+exponential}}} \end{overpic} |
In the left panel, the red curve shows the Sérsic component. In the right panel, it represents the Sérsic portion of the core-Sérsic component. The exponential function which dominates at large radii is indicated by the violet short-dashed curves. The solid curve represents the complete fit to the profiles, with the RMS residuals, , about each fit given in the lower panels. Note that the core part of the core-Sérsic model fits an apparent slight “excess” of light over the inner 0.5, rather than a light “deficit”.
| \begin{overpic}[width=433.62pt]{Holm15A_projection.eps} \put(5.0,5.0){{\color[rgb]{1,1,1}}} \end{overpic} |
| \begin{overpic}[width=433.62pt]{resid_Holm15A_S+D.eps} \put(5.0,5.0){{\color[rgb]{1,1,1}}} \end{overpic} \begin{overpic}[width=433.62pt]{resid_Holm15A_cS+D.eps} \put(5.0,5.0){{\color[rgb]{1,1,1}}} \end{overpic} \begin{overpic}[width=433.62pt]{resid_Holm15A_S+D+C.eps} \put(5.0,5.0){{\color[rgb]{1,1,1}}} \end{overpic} |
Top.- The green data points represent the major-axis surface brightness profile measured over the isophotes defined using IRAF.ellipse (i.e. the same measurement presented in Figure 2). The curves represent the surface brightness profile of the model images measured over exactly the same isophotes. The continuous curves show the global models, while the dashed curves represent their sub-components. We stress that these are not fits to the 1D profile, but rather surface brightness measurements (projections) of the 2D models. The pentagon indicates the location of the core-Sérsic model’s break radius. The panels underneath the profiles represent the data residuals about the fitted models, first expressed in terms of the difference in surface brightness, and then in terms of residuals (in units of counts) divided by the standard deviation as measured on the “sigma” image. Bottom.- The actual residual images that were minimized by Galfit-Corsair. Masked objects are highlighted as in Figure 1.
The innermost 0.5. — In the projection shown in Figure 4, the 2D model seems to significantly underestimate the light at radii smaller than 0.5. Within 0.5, the isophote centers identified by IRAF.ellipse — which can trace the centroid of the real galaxy at the sub-pixel level — drastically shift (see Figure 2, bottom panels). When the photometry is performed over the 2D model along the same isophotes, the centroid of the Galfit-Corsair model are offset, hence the model brightness is underestimated within the 0.5 region.
However, since a corresponding tiny “bump” is visible in the 1D surface brightness profile (Figure 2, top left panel) at those radii, we investigated whether this small feature should be attributed to an intrinsically lopsided light distribution, or instead to the presence of a misaligned point-source. If there was in fact a point-source, it could be an unresolved nuclear star cluster or an offset AGN. Indeed, LC14 found evidence for AGN emission in the optical spectrum of Holm 15A, which might be visible in our -band image. We tried to model this potential inner feature by adding a point-source to the 2D models (nominally, a PSF function), but we could not obtain a successful fit due to the low surface brightness of this potential component relative to the surrounding galaxy. We also tried to perform a similar fit in 1D using a PSF and a PSF-convolved Gaussian (i.e., a slightly extended source), although our 1D residuals also did not warrant such an additional component. From this fit we obtained a PSF-convolved Gaussian with FWHM comparable to the PSF FWHM (as expected for a point-source), and an integrated magnitude for any potential nuclear component of 24.8 mag, which we consider as an upper limit.
The 1–4 region. — As discussed above, the ellipticity profile of Holm 15A (Figure 2, top-right) suggests the presence of two galaxy components (i.e., spheroid and halo). Assuming that the 10–30 interval marks the transition between them, our 2D fit seems to recover the ellipticity at the outer edge of each component (see Table 2), most probably due to the higher number of pixels along larger isophotes. The single ellipticity of the Galfit-Corsair components is the cause for the pattern visible in the center of the residual image (Figure 4, bottom-left), which appears as a 1-4 structure oriented in the direction perpendicular to the galaxian major-axis (i.e., along the NE-SW direction). This happens because in that region the image isophotes have a much more circular shape (e 0.1) than the 2D Sérsic component (for which we obtained = 0.2). In the 1D projection of the 2D residuals (Figure 4, top-left), this pattern manifests as a sinusoidal feature.
As a consequence, the 1D and 2D core-Sérsic+exponential fits show some differences in their inner regions. The 1D model shown in right-hand panels of Figure 3 yields a small (sub-pixel) break radius ( 0.14), generally consistent with being a core-less galaxy777 Recall that the image has a seeing of 0.75. . Every core-Sérsic fit can effectively reproduce an intrinsic Sérsic profile by sufficiently minimizing the break radius of the core. Although a core is partially resolved in the 2D model (middle panels of Figure 4), it does not seem to improve the fit significantly. In particular, we observe that the 1–4 2D residual feature described above is still present, and — although slightly reduced — still shows the same pattern, hence reducing the likelihood that it is related to a depleted a core.
On the other hand, outside the problematic inner 0.5 region, the Sérsic+exponential and core-Sérsic+exponential models fit the data comparably well, yielding similar residuals (see Table 2 and Figures 3 and 4). What has occurred is that the core-Sérsic core parameters were driven by the fit algorithms to partially compensate for the effects of the 0.5 “excess” (1D case) or the varying ellipticity (2D case), rather than accounting for an actual depleted core.
Persuaded that the simpler Sérsic+exponential model provides the most appropriate description, we decided to refine the 2D Sérsic+exponential fit using nested Galfit-Corsair models to see if we could approximate the varying ellipticity of Holm 15A. In addition to an ellipticity gradient, the radial range corresponding to the inner Sérsic component is also associated with an irregular position angle profile which is wildly varying within the innermost 4 (while it is remarkably constant in the range where the exponential component dominates; see Figure 2, middle-right). Therefore, we paid special attention to improve the fit of the inner component, and we constructed our refined model by using two Sérsic components with different axis ratios to describe the “bulge”, plus the previously used exponential function for the “halo” (Figure 4, right panels). This extra central component represents a corrective factor, rather than a distinct element of the galaxy. The parameters obtained with this new fit are reported in Table 2. The best-fit exponential halo component is practically unchanged with the addition of this new inner Sérsic component, indicating that the correction indeed acted mostly on the “bulge”. Moreover, the corrective component has a luminosity one order of magnitude fainter than the other components, so that the predominant Sérsic component still resembles the previously obtained “bulge” (including its position angle and aspect ratio). With this refinement the 2D fit drastically improved, now yielding flat residuals over all the fitted range beyond 0.5 (see Figure 4, bottom-right panel). The apparent (false) excess seen here, in the 1D profile is a result of the centroid shift issue discussed earlier.
| Model/Component | P.A. | ||||||||||||||
|---|---|---|---|---|---|---|---|---|---|---|---|---|---|---|---|
| [mag/arcsec2] | [mag] | [kpc] | [arcsec] | [kpc] | [arcsec] | [deg] | [mag/arcsec2] | [mag] | [mag] | ||||||
| (1) | (2) | (3) | (4) | (5) | (6) | (7) | (8) | (9) | (10) | (11) | (12) | (13) | (14) | (15) | |
| 1D | |||||||||||||||
| Sérsic+exp. { | Sérsic | 21.60 | 13.78 | 13.09 | 11.87 | 1.0 | } 0.015 | 12.50 | 24.52 | ||||||
| exponential | 21.93 | 13.32 | 46.49 | 42.15 | [1.0] | ||||||||||
| core-Sérsic+exp. { | core-Sérsic | 19.83 | 13.79 | 0.15 | 0.14 | [2.0] | 0.28 | 12.86 | 11.66 | 0.9 | } 0.014 | 12.51 | 24.49 | ||
| exponential | 21.94 | 13.33 | 46.60 | 42.25 | [1.0] | ||||||||||
| 2D | |||||||||||||||
| Sérsic+exp. { | Sérsic | 21.59 | 13.82 | 12.81 | 11.61 | 1.0 | 0.19 | 143.9 | } 0.119 | 12.61 | 24.41 | ||||
| exponential | 21.83 | 13.47 | 44.08 | 39.96 | [1.0] | 0.38 | 148.0 | ||||||||
| core-Sérsic+exp. { | core-Sérsic | 19.96 | 13.76 | 0.81 | 0.73 | 1.2 | -0.12 | 13.30 | 12.06 | 1.0 | 0.20 | 144.0 | } 0.119 | 12.62 | 24.40 |
| exponential | 21.99 | 13.53 | 46.90 | 42.52 | [1.0] | 0.40 | 148.2 | ||||||||
| Sérsic+exp.+Sérsic { | Sérsic | 21.62 | 13.85 | 13.19 | 11.96 | 0.9 | 0.21 | 143.9 | } 0.118 | 12.61 | 24.41 | ||||
| exponential | 21.85 | 13.46 | 44.37 | 40.23 | [1.0] | 0.37 | 148.2 | ||||||||
| Sérsic (corr.) | 22.67 | 17.82 | 4.13 | 3.74 | 0.3 | 0.24 | 54.9 | ||||||||
Note. — Best-fit parameters from our 1D and 2D analysis. Missing values are not relevant to the model/component under consideration.
(1) Fit model/component. (2) -band surface brightness at the: break radius (core-Sérsic), effective radius (Sérsic), or at = 0 (exponential). (3) Total -band magnitude of the component. For the 1D models, we integrated the surface brightness profile assuming a constant ellipticity e, which we chose as the ellipticity at the component’s effective radius (e 0.2 for the inner components, e 0.3 for the outer exponential components; see Figure 2). (4) Break radius in units of kilo-parsecs (at the distance of Holm 15A, 1″= 1.103 kpc). (5) Break radius in units of arcseconds. (6) Alpha parameter for the core-Sérsic model; this parameter has been held fixed (i.e. not solved for as a free parameter) in the 1D analysis. (7) Inner power-law index for the core-Sérsic model. (8) Effective radius () of the component in units of kiloparsecs; the of the core-Sérsic profile is defined to be the effective radius of the whole model in the 1D analysis, while it represents the of the Sérsic part of the composite model in Galfit-Corsair; since in this case the break radius turns out to be very small, the two effectively coincide. (9) Effective radius in units of arcseconds. (10) Sérsic index (for = 1 the Sérsic model corresponds to the exponential model). (11) Component ellipticity. (12) Component position angle (North = 0∘). (13) Dispersion of fit residuals. For the 1D fits we adopted the RMS of the difference between the light profile and the model values (see Figure 3). For the 2D fits we adopted the inner 68% (1) interval of the distribution of values from the residual image pixels (after applying the same masking used for the fit). Note that the former yields numerically smaller values than the latter because the residual data points are averaged over the whole isophote. (14) Rest-frame, extinction-corrected -band magnitude of the model. A 5log(1+) 0.12 mag magnitude dimming was applied using the distance reported in Table 1. Following the prescriptions of Poggianti (1997) for early-type galaxies, we also applied an -band -correction = 0.06 mag. We used the galactic extinction from NED (0.09 mag). (15) Absolute, rest-frame, extinction-corrected -band magnitude of the model (distance modulus is provided in Table 1).
3. Discussion
Extended halos around BCGs are commonly observed. Their presence is not only indicated by the need for adding an “envelope” component when fitting models, but also by the twist in the outer isophotes of BCGs, which has been interpreted as a signature of galaxy accretion/interaction (e.g. Porter et al., 1991; Gonzalez et al., 2005). This picture is supported by numerical simulations, which showed that BCGs, being at the centers of large dark matter haloes, underwent a vigorous history of both minor and major merging (e.g. De Lucia & Blaizot, 2007), and hence may be surrounded by a halo of tidally stripped stars (e.g. Cooper et al., 2014).
In fact, in their survey of nearby BCGs, Donzelli et al. (2011, herafter DM11) had already reported that a Sérsic+exponential model fits the light profile of Holm 15A. We improve on this by: (1) investigating the presence of a depleted core (DM11 did not perform this test plus their data had a FWHM 1–2 and their fits were limited to a minimum radius of 1.5FWHM); and (2) reaching deeper in limiting surface brightness (25.5 mag arcsec-2 compared to their 24.5 mag arcsec-2). DM11 thus limited their analysis to 60, while our fit extends up to 80, hence providing a better constraint on the extended galaxy halo light. Our 1D Sérsic+exponential fit agrees well with the similar fit by DM11. Given the luminosity– relation and the findings in Graham (1996), it may be surprising to note that the Sérsic index that we derive for the main “bulge” of a bright galaxy like Holm 15A ( –23.8 mag) is so small ( 1). However, this low Sérsic index can be compared to the low Sérsic indexes measured for the inner components of several BCGs (e.g. DM11), as well as in a couple of cD galaxies (NGC 4874 and UGC 9799; Seigar et al., 2007). These low Sérsic indexes might be a result of a dramatic galaxy re-shaping due to one/some of the processes mentioned in the Introduction. Although these low- profiles have rather flat inner regions, we are not dealing with a profile that displays a clear break and downward deviation at small radii — as observed with the traditional partially depleted cores in galaxies with larger ( 3) Sérsic indexes.
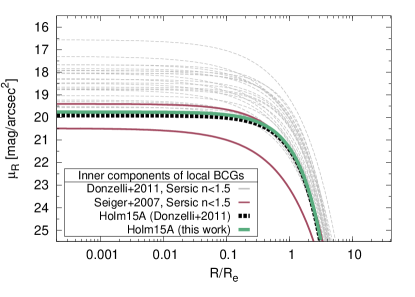
In Figure 5 we display the inner galaxy components from the fits by Donzelli et al. (2011) (their Table 2; dashed lines) and (Seigar et al., 2007, their Table 2; magenta solid lines), after selecting objects similar to Holm 15A, i.e. with Sérsic+exponential decomposition, and having inner spheroids with Sérsic 1.5. We highlight the Donzelli et al. (2011) model for Holm 15A with a black dashed line, which can be observed to closely match the profile we derived (solid green line). All the surface brightness profiles are expressed relative to the R-band, and, when necessary, have been converted from the observed bands using the colour conversions by Fukugita et al. (1995). Holm 15A does not seem to show any striking peculiarity in this representation, except that it has the lowest central surface brightness in the [sub-]sample from Donzelli et al. (2011). This observation strengthens the idea that Holm 15A is an otherwise somewhat standard representative of the population of local BCGs with low Sérsic index spheroids.
While LC14 favor the Nuker law for their description of the central regions of Holm 15A, they also use a double-Sérsic fit (comparable to our Sérsic+exponential model) to recover the total galaxy light, obtaining 13.28 mag. We can compare this value with the total magnitude obtained from our 2D Sérsic+exponential model, before rest-frame and extinction correction ( 12.88 mag; see Table 2 and table notes). We converted our magnitude, defined in the SDSS -band (AB system), to the Johnson/Cousin -band magnitude in the Vegamag system () by applying a () = 0.36 mag color correction, as typical for early-type galaxies (e.g. Fukugita et al., 1995). We obtained = 13.24 mag, comparable to the measurement of LC14.
An overview on how we came to believe in massive black holes, and the development of the scaling relations associated with them, can be found in the extensive review by Graham (2015a). LC14 estimated the mass of the BH in Holm 15A using several scaling relations (their Table 2), and concluded that the best estimate for is 1010. Of the relations they used, the only one which directly connects to the assumed morphological profile was the – relation taken from Rusli et al. (2013), from which they obtained 1.71011 using their Nuker law break radius. This is an order of magnitude above their preferred estimate. The Rusli et al. (2013) scaling relation was however constructed using the core-Sérsic break radius (), which is smaller than the Nuker break radius () for the reasons discussed in the Introduction. However, we found no convincing evidence in Holm 15A for a depleted core relative to the inward extrapolation of the outer light profile and as such we do not deem it appropriate to use the – relation.
In the binary black hole scouring scenario, the core mass deficit relates to the mass of the final merged SMBH (e.g. Merritt, 2006). The “depleted” mass can be inferred from the luminosity deficit with respect to a model representing the “unperturbed” galaxy. In LC14, they use a de Vaucouleurs profile as their original, unperturbed model to compare against their double-Sérsic fit. From a visual inspection, their de Vaucouleurs profile matches the data over the range of galactocentric radii: 10–40 kpc (LC14; their Figure 2). However, given that galaxies and BCGs exhibit a variety of Sérsic indexes (e.g. DM11), it might not be that the original (i.e., pre-depletion) profile of the galaxy had = 4 (corresponding to a de Vaucouleurs profile). Indeed, the application of a de Vaucouleurs model appears to have produced an artificial over-sized luminosity deficit.
The discrepancies between our results and those of LC14 are related to the adopted paradigm for the description of the surface brightness distribution, i.e. the core-Sérsic or the Nuker framework. There is no formal mistake in the analysis of LC14, and in fact we were able to reproduce their Nuker parameters when fitting a Nuker model in 2D with Galfit. However, for the reasons highlighted in the Introduction — and especially for its ability to discern real cores from the flat inner slopes of low- Sérsic profiles — we favor the core-Sérsic model, which found no evidence for a depleted core larger than the resolution limit.
Finally, we remark that the depletion of stars from the core of a galaxy due to coalescing black holes, and other mechanisms, preferentially removes stars on radial orbits, leaving an excess of stars on tangential orbits (e.g. Thomas et al., 2014). Integral-field kinematic data may therefore be of benefit to help identify or reject the presence of a core depleted of stars.
4. Conclusions
We performed a surface brightness analysis of the BCG Holm 15A using a CFHT-MegaPrime -band image to investigate the claim that this galaxy has the largest depleted core ever detected (4.57 kpc; López-Cruz et al., 2014).
We fit the 1D light profile and the 2D image of Holm 15A to compare a core-less galaxy plus envelope model (Sérsic+exponential) against a core-Sérsic galaxy plus envelope model (core-Sérsic+exponential). We obtained good agreement among the best-fit parameters derived with the 1D and 2D methods (see Table 2), modulo some minor differences predominantly attributable to ellipticity gradients (§2.4) and a varying center with isophotal radius. In order to approximate the varying ellipticity of the inner galaxy, the 2D models — having components with fixed ellipticity — required the addition of a “corrective” component to the Sérsic+exponential model.
We find that the core-Sérsic model does not provide an appropriate representation of the galaxy light distribution. In particular, in the 1D description the core has a slight excess of light, while in the 2D model the inner power-law of the core-Sérsic fit does not represent an actual real core, but rather compensates for the ellipticity gradient (§2.4). We therefore conclude that the galaxy is core-less and we favor the idea that its light distribution is best described by a simple Sérsic profile with a low index plus an exponential “halo” component as included by LC14.
References
- Begelman et al. (1980) Begelman, M. C., Blandford, R. D., & Rees, M. J. 1980, Nature, 287, 307
- Bell et al. (2006) Bell, E. F., Phleps, S., Somerville, R. S., et al. 2006, ApJ, 652, 270
- Bertin & Arnouts (1996) Bertin, E., & Arnouts, S. 1996, A&AS, 117, 393
- Bertin (2011) Bertin, E. 2011, Astronomical Data Analysis Software and Systems XX, 442, 435
- Bonfini (2014) Bonfini, P. 2014, PASP, 126, 935
- Boylan-Kolchin et al. (2004) Boylan-Kolchin, M., Ma, C.-P., & Quataert, E. 2004, ApJ, 613, L37
- Byun et al. (1996) Byun, Y.-I., Grillmair, C. J., Faber, S. M., et al. 1996, AJ, 111, 1889
- Carollo et al. (1997) Carollo, C. M., Franx, M., Illingworth, G. D., & Forbes, D. A. 1997, ApJ, 481, 710
- Casteels et al. (2014) Casteels, K. R. V., Conselice, C. J., Bamford, S. P., et al. 2014, MNRAS, 445, 1157
- Cooper et al. (2014) Cooper, A. P., Gao, L., Guo, Q., et al. 2014, arXiv:1407.5627
- De Lucia & Blaizot (2007) De Lucia, G., & Blaizot, J. 2007, MNRAS, 375, 2
- De Propris et al. (2007) De Propris, R., Conselice, C. J., Liske, J., et al. 2007, ApJ, 666, 212
- de Vaucouleurs (1948) de Vaucouleurs, G. 1948, Annales d’Astrophysique, 11, 247
- Donzelli et al. (2011) Donzelli, C. J., Muriel, H., & Madrid, J. P. 2011, ApJS, 195, 15
- Duc et al. (2015) Duc, P.-A., Cuillandre, J.-C., Karabal, E., et al. 2015, MNRAS, 446, 120
- Dullo & Graham (2012) Dullo, B. T., & Graham, A. W. 2012, ApJ, 755, 163
- Dullo & Graham (2013) Dullo, B. T., & Graham, A. W. 2013, ApJ, 768, 36
- Dullo & Graham (2014) Dullo, B. T., & Graham, A. W. 2014, MNRAS, 444, 2700
- Ebisuzaki et al. (1991) Ebisuzaki, T., Makino, J., & Okumura, S. K. 1991, Nature, 354, 212
- Faber et al. (1997) Faber, S. M., Tremaine, S., Ajhar, E. A., et al. 1997, AJ, 114, 1771
- Ferrarese et al. (2006) Ferrarese, L., Côté, P., Jordán, A., et al. 2006, ApJS, 164, 334
- Fukugita et al. (1995) Fukugita, M., Shimasaku, K., & Ichikawa, T. 1995, PASP, 107, 945
- Goerdt et al. (2010) Goerdt, T., Moore, B., Read, J. I., & Stadel, J. 2010, ApJ, 725, 1707
- Gonzalez et al. (2005) Gonzalez, A. H., Zabludoff, A. I., & Zaritsky, D. 2005, ApJ, 618, 195
- Graham (1996) Graham, A. W. 1996, ApJ, 459, 27
- Graham et al. (2003) Graham, A. W., Erwin, P., Trujillo, I., & Asensio Ramos, A. 2003, AJ, 125, 2951
- Graham & Guzmán (2003) Graham, A. W., & Guzmán, R. 2003, AJ, 125, 2936
- Graham (2004) Graham, A. W. 2004, ApJ, 613, L33
- Graham (2013) Graham, A.W. 2013, in ”Planets, Stars and Stellar Systems”, Volume 6, T.D.Oswalt & W.C.Keel (Eds.), Springer Publishing, p.91 (arXiv:1108.0997)
- Graham & Scott (2013) Graham, A. W., & Scott, N. 2013, ApJ, 764, 151
- Graham (2015a) Graham, A. W. 2015a, arXiv:1501.02937
- Graham (2015b) Graham, A.W. 2015b, in Galactic Bulges, E. Laurikainen, R.F. Peletier & D.Gadotti (Eds.), Springer Publishing (arXiv:1501.02937)
- Grillmair et al. (1994) Grillmair, C. J., Faber, S. M., Lauer, T. R., et al. 1994, AJ, 108, 102
- Gualandris & Merritt (2008) Gualandris, A., & Merritt, D. 2008, ApJ, 678, 780
- Jedrzejewski (1987) Jedrzejewski, R. I. 1987, MNRAS, 226, 747
- Hyde et al. (2008) Hyde, J. B., Bernardi, M., Sheth, R. K., & Nichol, R. C. 2008, MNRAS, 391, 1559
- Laporte & White (2014) Laporte, C. F. P., & White, S. D. M. 2014, arXiv:1409.1924
- Lauer (1983) Lauer, T. R. 1983, in Elliptical Galaxies, Surface Photometry, Santa Cruz: University of California
- Lauer et al. (1995) Lauer, T. R., Ajhar, E. A., Byun, Y.-I., et al. 1995, AJ, 110, 2622
- Lauer et al. (2007) Lauer, T. R., Faber, S. M., Richstone, D., et al. 2007, ApJ, 662, 808
- López-Cruz et al. (2014) López-Cruz, O., Añorve, C., Birkinshaw, M., et al. 2014, ApJ, 795, LL31
- Milosavljević & Merritt (2001) Milosavljević, M., & Merritt, D. 2001, ApJ, 563, 34
- King (1962) King, I. 1962, AJ, 67, 471
- King (1966) King, I. R. 1966, AJ, 71, 64
- King & Minkowski (1966) King, I. R., & Minkowski, R. 1966, ApJ, 143, 1002
- King & Minkowski (1972) King, I. R., & Minkowski, R. 1972, External Galaxies and Quasi-Stellar Objects, 44, 87
- Kormendy (1982) Kormendy, J. 1982, Saas-Fee Advanced Course 12: Morphology and Dynamics of Galaxies, 113
- Kormendy et al. (1994) Kormendy, J., Dressler, A., Byun, Y. I., et al. 1994, European Southern Observatory Conference and Workshop Proceedings, 49, 147
- Kormendy & Bender (2009) Kormendy, J., & Bender, R. 2009, ApJ, 691, L142
- Kormendy & Ho (2013) Kormendy, J., & Ho, L. C. 2013, ARA&A, 51, 511
- Krajnović et al. (2006) Krajnović, D., Cappellari, M., de Zeeuw, P. T., & Copin, Y. 2006, MNRAS, 366, 787
- Krajnović et al. (2013) Krajnović, D., Karick, A. M., Davies, R. L., et al. 2013, MNRAS, 433, 2812
- Kulkarni & Loeb (2012) Kulkarni G., Loeb A., 2012, MNRAS, 422, 1306
- Magnier & Cuillandre (2004) Magnier, E. A., & Cuillandre, J.-C. 2004, PASP, 116, 449
- Martizzi et al. (2012) Martizzi, D., Teyssier, R., & Moore, B. 2012, MNRAS, 420, 2859
- Merritt et al. (2004) Merritt, D., Milosavljević, M., Favata, M., Hughes, S. A., & Holz, D. E. 2004, ApJ, 607, L9
- Merritt (2006) Merritt, D. 2006, ApJ, 648, 976
- Peng et al. (2010) Peng, C. Y., Ho, L. C., Impey, C. D., & Rix, H.-W. 2010, AJ, 139, 2097
- Pierini et al. (2008) Pierini, D., Zibetti, S., Braglia, F., et al. 2008, A&A, 483, 727
- Planck Collaboration et al. (2014) Planck Collaboration, Ade, P. A. R., Aghanim, N., et al. 2014, A&A, 571, AA16
- Poggianti (1997) Poggianti, B. M. 1997, A&AS, 122, 399
- Porter et al. (1991) Porter, A. C., Schneider, D. P., & Hoessel, J. G. 1991, AJ, 101, 1561
- Postman et al. (2012) Postman, M., Lauer, T. R., Donahue, M., et al. 2012, ApJ, 756, 159
- Ravindranath et al. (2001) Ravindranath, S., Ho, L. C., Peng, C. Y., Filippenko, A. V., & Sargent, W. L. W. 2001, AJ, 122, 653
- Rest et al. (2001) Rest, A., van den Bosch, F. C., Jaffe, W., et al. 2001, AJ, 121, 2431
- Rusli et al. (2013) Rusli, S. P., Erwin, P., Saglia, R. P., et al. 2013, AJ, 146, 160
- Redmount & Rees (1989) Redmount, I. H., & Rees, M. J. 1989, Comments on Astrophysics, 14, 165
- Richings et al. (2011) Richings, A. J., Uttley, P., Körding, E. 2011, MNRAS, 415, 2158
- Savorgnan & Graham (2015) Savorgnan, G. A. D., & Graham, A. W. 2015, MNRAS, 446, 2330
- Seigar et al. (2007) Seigar, M. S., Graham, A. W., & Jerjen, H. 2007, MNRAS, 378, 1575
- Thomas et al. (2014) Thomas, J., Saglia, R. P., Bender, R., Erwin, P., & Fabricius, M. 2014, ApJ, 782, 39
- Trujillo et al. (2004) Trujillo, I., Erwin, P., Asensio Ramos, A., & Graham, A. W. 2004, AJ, 127, 1917
- Volonteri & Ciotti (2013) Volonteri, M., & Ciotti, L. 2013, ApJ, 768, 29