Solar ALMA: Observation-Based Simulations of the mm and sub-mm Emissions from Active Regions
Abstract
We developed an efficient algorithm integrated in our 3D modeling tool, GX Simulator (Nita et al. 2015), allowing quick computation of the synthetic intensity and polarization maps of solar active regions (AR) in the ALMA spectral range.
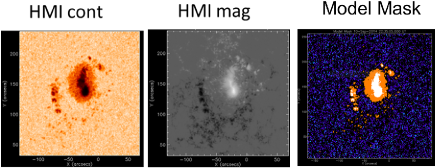
To get an idea of how a given AR looks at the ALMA wavelengths we explore the recently updated set of 1D models (1D distributions of the electron temperature and density along with non-LTE ionized and neutral hydrogen densities with height) of the solar atmosphere (Fontenla et al. 2009), distinguishing between umbra, penumbra, network, internetwork, enhanced network, facula, or plage. Thus, to apply a given static atmospheric model to a given line of sight, the algorithm analyzes the photospheric input (white light and magnetogram) to classify the pixel as belonging to one of the itemized above photospheric features and creates a corresponding model mask (Fig. 1). Then, a 1D chromospheric model is added on top of each pixel, which forms a simplified 3D chromospheric model of the AR embedded in an extrapolated 3D magnetic data cube. A huge advantage of this approach is that emission from any given AR can be synthesized very quickly, on the order of a few minutes after the AR selection.
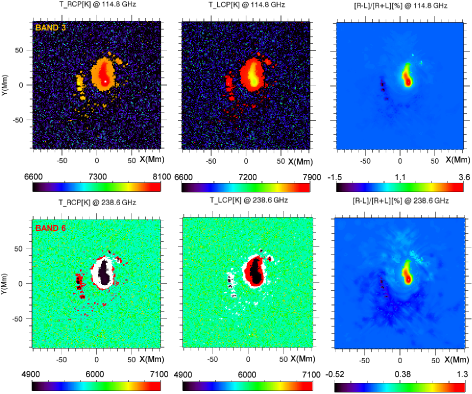
Although simplified, these models are comprehensive enough to perform many tests; in particular, to compute anticipated averaged mm and sub-mm emission maps from a given AR as would be observed by ALMA. For the AR studies we specifically developed a computation unit taking accurately into account the gyroresonance (GR) and free-free processes with the full account of the magnetized plasma dispersion as well as the frequency-dependent mode coupling (Fleishman & Kuznetsov 2014). Some results of this modeling for AR 12158 (observed 10 Sep 2014) are shown in Fig. 2 for ALMA bands 3 and 6. This modeling suggests that photospheric features will be distinguishable at the ALMA frequencies with the brightness temperature contrast up to a few hundred K. In line with the results of Loukitcheva et al. (2014), the umbra, which is dark (cool) at the high frequencies, appears bright (hot) at the lower frequencies. In addition, noticeably depends on the magnetic field via its influence on the free-free opacity. Resulting degree of circular polarization reaches 3.6% for AR 12158 (right panels in Fig. 2).
The degree of polarization along with the spatially resolved spectra are the keys in obtaining the magnetic field map at a given frequency, which translates to a certain chromospheric height. Multi-frequency data offer an elegant chromospheric tomography method (e.g., Loukitcheva et al., this volume).
Acknowledgments
This work was supported in part by NSF grants AGS-1250374 and AGS-1262772, NASA grant NNX14AC87G, RFBR grants 15-02-01089, 15-02-03717, 15-02-03835, and 15-02-08028, and Saint-Petersburg State University research grants 6.0.26.2010 and 6.37.343.2015.
References
- Fleishman & Kuznetsov (2014) Fleishman, G. D., & Kuznetsov, A. A. 2014, ApJ, 781, 77. 1312.2111
- Fontenla et al. (2009) Fontenla, J. M., Curdt, W., Haberreiter, M., Harder, J., & Tian, H. 2009, ApJ, 707, 482
- Loukitcheva et al. (2014) Loukitcheva, M., Solanki, S. K., & White, S. M. 2014, A&A, 561, A133. 1403.3436
- Nita et al. (2015) Nita, G. M., Fleishman, G. D., Kuznetsov, A. A., Kontar, E. P., & Gary, D. E. 2015, ApJ, 799, 236