UV spectra, bombs, and the solar atmosphere
Abstract
A recent analysis of UV data from the Interface Region Imaging Spectrograph IRIS reports plasma “bombs” with temperatures near K within the solar photosphere. This is a curious result, firstly because most bomb plasma pressures (the largest reported case exceeds dyn cm-2) fall well below photospheric pressures (), and secondly, UV radiation cannot easily escape from the photosphere. In the present paper the IRIS data is independently analyzed. I find that the bombs arise from plasma originally at pressures between and 800 dyne cm-2 before explosion, i.e. between and 550 km above . This places the phenomenon’s origin in the low-mid chromosphere or above. I suggest that bomb spectra are more compatible with Alfvénic turbulence than with bi-directional reconnection jets.
Subject headings:
Sun: atmosphere1. Introduction
Peter et al. (2014, henceforth P2014) recently reported on “Hot Explosions in the Cool Atmosphere of the Sun”. Throughout the paper the K plasma is identified as belonging to the solar photosphere. Two major pieces of evidence are presented by P2014 to support the idea that the bombs originate from photospheric plasma. P2014 make quantitative estimates of the electron density, leading them to conclude
“A density analysis based on the IRIS observations of O IV and Si IV shows that the bombs form in the photosphere”
The reasoning is that such high density plasma pre-exists only in the deeper layers. The second argument concerns the presence of narrow absorption lines of Fe II and Ni II seen against the bright emission. Cool plasma exists above the emitting plasma with sufficient opacity to produce absorption lines. P2014 did not analyze these lines quantitatively, this is done below.
In this paper I demonstrate that the radiating plasma must exist at least 550 km above the continuum photosphere, above the canonical temperature minimum region. I take the essential observations of P2014 and re-analyze them within the following simple picture. I adopt, with justification, a 1D model of the atmosphere that captures the essential stratification of 3D dynamical atmospheres to study the transfer of UV continuum and line radiation, in both the emission (C II, Si IV, Mg II) and absorption features (Fe II and Ni II) reported by P2014. I assume that electrons are fully thermalized owing to the high densities encountered. I re-analyze the physics determining the ratios of permitted Si IV and spin-forbidden O IV] lines (“]” denotes, by convention, a spin-forbidden transition), and the implications of the absorption features. I assume bomb spectra originate from pre-existing plasma that is heated to produce the K plasma, keeping the density approximately constant. The latter is assumed to be due to strong magnetic forces, to be consistent with the 5 minute lifetimes of the bombs that greatly exceed dynamical time scales ( km / 100 km s-1). Finally I review the analysis of P2014.
2. Analysis
Below I use photoionization cross sections from the OPACITY project (Seaton, 1987), other atomic data compiled by Judge (2007), IRIS data from P2014 and calibration data from De Pontieu et al. (2014). Photospheric abundances from Allen (1973) are adopted.
2.1. Pre-existing stratification and UV opacities
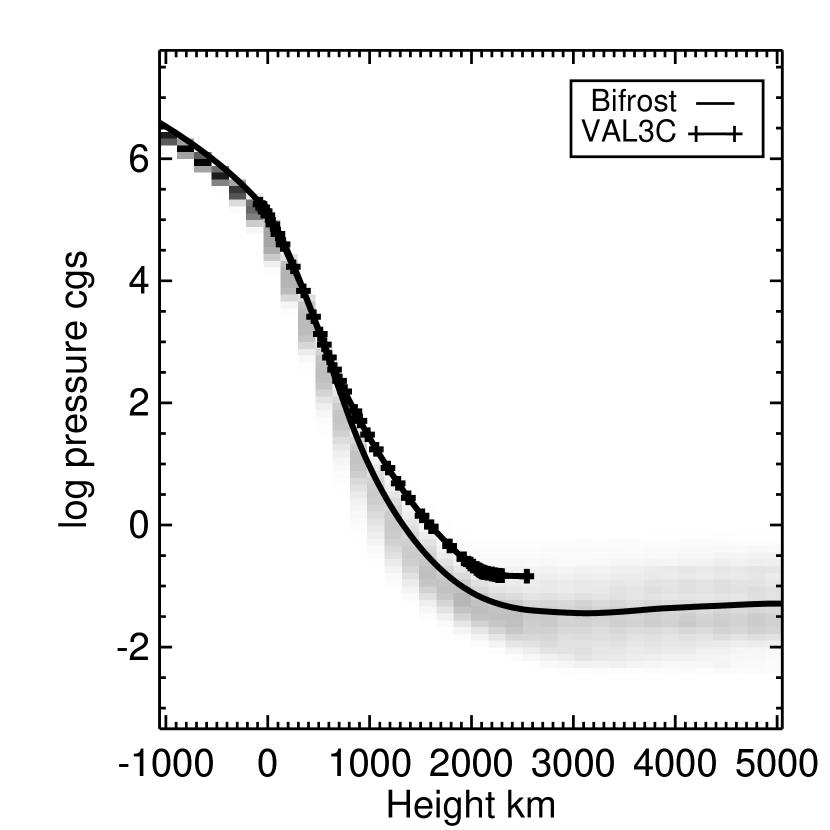
Under undisturbed conditions, the solar photosphere and chromosphere are strongly stratified. I therefore discuss bombs in the context of an average atmospheric model, model C (“VAL3C”) of Vernazza et al. (1981). This is a static 1D model. Nevertheless it captures typical density and pressure stratification of dynamical 3D models. Much has recently been made of the essential dynamical nature of the chromosphere (Leenaarts et al., 2012, e.g.), but such dynamical departures from hydrostatic equilibrium are large only in the tenuous regions of the upper chromosphere. Figure 1 shows the run of pressure with height of the VAL3C model together with a probability distribution function derived from the 3D Bifrost model “en024048_hion” developed for the IRIS project222http://sdc.uio.no/search/simulations. It is clear that VAL3C can be used to study the vertical transport of radiation, under undisturbed conditions, low in the solar chromosphere.
The atmospheres of G-type stars contain enormous opacities from abundant neutral atoms: Rayleigh scattering from hydrogen and bound-free transitions from Si, C, Fe, Al (e.g. Allen, 1973). UV radiation cannot escape from or penetrate the undisturbed photosphere. Below 152 nm, the opacity in the lower chromosphere is dominated by bound-free opacity from the ground levels () of neutral silicon. The Si I photoionization cross section is cm-2. Using initially (silicon is mostly neutral), and an abundance , we find
| (1) |
With these opacities, optical depths and the escape probabilities for line radiation lying in the Si I continuum are listed in Table 1. Below 600 km, where gas pressures exceed 600 dyne cm-2, the optical depth (proportional to column mass where in hydrostatic conditions and is the solar acceleration due to gravity), fewer than 1 in 100 photons escape from this high density, opaque plasma, dropping as a double-exponential function of height.
| height | ||||
|---|---|---|---|---|
| km | dyne cm-2 | |||
| 0.3 | 0.74 | 815 | ||
| 1 | 0.37 | 725 | 200 | |
| 3 | 0.05 | 635 | 400 | |
| 5 | 590 | 600 | ||
| 10 | 542 | 1000 | ||
| 100 | 450 | 2600 |
To construct Table 1 I assume unrealistically that bomb radiation does not affect the plasma surrounding it. Photoionization of neutrals reduces UV opacity at 140nm, but this effect is offset partly by increased recombination as more electrons are made free.
In principle a non-LTE transfer calculation is needed to investigate the statistical equilibrium of the bomb and its effects on the surrounding atmosphere. However, bomb plasma with densities cm-3 in a 1D atmosphere is so geometrically thin ( km) and hot that calculations with the RH non-LTE code (Uitenbroek, 2000) proved impossible to make converge.
To proceed, two simpler calculations were made. First, RH was used with downgoing radiative intensities of transition region lines that equal the brightest observed bomb intensities (as shown below), as an upper boundary condition. The non-LTE rate equations were solved for H, C, O, Si, Fe to study the penetration of such bright radiation downwards and changes in ionization balance and the electron number densities, keeping the temperature fixed. Less than 10% of the 139.3 nm radiation penetrates to or escapes from km. To understand this result, I then made the following rough calculations, examining the consequence of placing the bright bomb emission immediately below the temperature minimum region ( km, dyne cm-2). The undisturbed continuum optical depth at 140nm is . The wavelength-integrated intensity of radiation in bomb B-1 in the Si IV lines is erg cm-2 s-1 sr-1. The photoionization rate of Si I by the Si IV bomb emission is
| (2) |
At km the VAL3C electron density is cm-3, and the recombination rate per electron cm3s-1. Ionization equilibrium gives
| (3) |
i.e. the 140nm continuum optical depth is reduced to 100/70=1.4. The observed C II lines are almost as strong as the Si IV lines, and H L will certainly be strong. But all additional UV radiation will increase the electron density as elements become ionized: fully ionized silicon and carbon contribute an additional and electrons per cm3 at km. With these additional electrons, equation (3) yields with a continuum optical depth of about 6, stopping all but 2.5% of the radiation from emerging. These calculations explain the RH non-LTE calculations, so that to conclude, UV bomb emission below 450 km is not visible to IRIS even in the most extreme case B-1.
2.2. Density analysis
When the radiation in two emission lines depends differently on electron density and temperature , it is obvious that one line ratio can only broadly constrain possible mean densities in the emitting plasma. The general problem of finding electron densities from thermal but low density plasmas has been discussed by Judge et al. (1997). Refer to this paper for the notation used here. Under standard assumptions each line emits a total intensity of
| (4) |
where is a differential emission measure and depends on atomic processes. To derive a mean density one must specify a form of the source term , for example in an isothermal plasma at temperature , . Lines of Si IV and O IV] have different peak ionization equilibrium temperature temperatures, and . P2014 look for solutions for at constant pressure constant, so that and where
| (5) |
Note that the line ratio yields the mean electron density only when the ratio of the emission measures at and at is known. In this regard the calculations of P2014 are not specified sufficiently to reproduce them. I find them to be consistent with using calculations with similar ionization equilibria. It appears then that they assume the geometrical thickness of the emitting regions is the same in the Si and O lines, so that the Si line has roughly 4 the emission measure (i.e. in the present notation).
The specific case for Si IV/O IV] intensity ratios has additional problems:
-
1.
Si is a low-first ionization potential (low-FIP) element and O is not. Differential abundances between low- and high FIP elements are well documented (e.g. Feldman, 1998). Si can be enhanced by factors of up to 3 compared to O.
-
2.
The Si3+ and O3+ ions have different energy thresholds for ionization from the neutral species (58.7 and 103.7 eV). Consequently ionization equilibrium temperatures differ by a factor of two (P2014 use 4.87 and 5.16).
-
3.
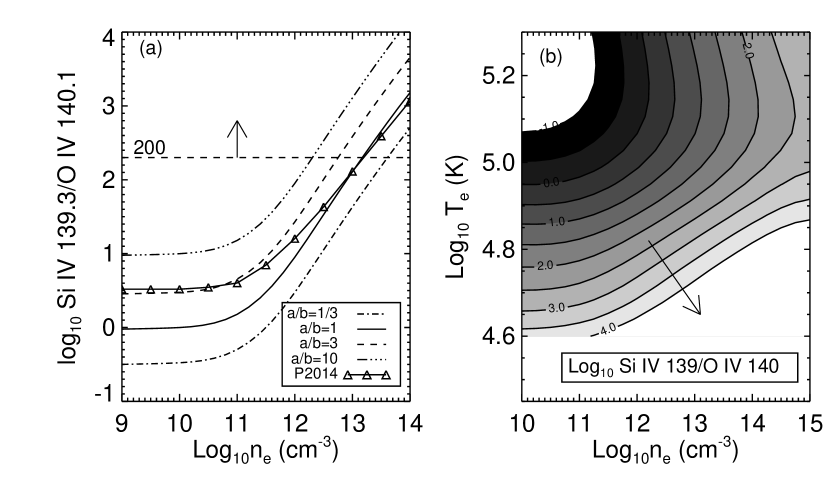
Ion populations depend on micro-fields in finite density plasmas (above cm-3, Summers, 1974). Above cm-3 collisions reduce rates of dielectronic recombination (DR) by perturbing the doubly excited states before the Auger stabilizing transition occurs (Summers, 1974). In Na-like Si3+, DR to Si2+ is significantly suppressed (see the computations of the homologous Li-like ions by Doyle et al., 2005). Together with increased ionization from metastable levels of B- and Be-like ions, at plasma densities above cm-3 I estimate using the approach of Judge (2007) that the emitted power of Na-like Si IV lines above those of O IV] lines by a factor of three to four (Figure 2).

Figure 2.— The figure compares the ionization balance of Si and O ions in response to changes in the electron density. In the “coronal approximation” (low densities) the curves do not vary with electron density. However at densities higher than cm-3 the effects of metastable level populations and reduced dielectronic recombination rates significantly change, systematically, the relative ion populations. Notably, the Na-like Si IV ion’s population grows rapidly with increasing density. The opposite is true for the B-like O IV ion. -
4.
The Si IV line core intensity ratios 139.3/140.2 are close to but (at least for bomb B-1 where the ratio is 1.6-1.7)) less than 2:1. Scattering in the outward (observed) direction increases the 139.3 component’s integrated intensity (Judge & Pietarila, 2004) since the lines are not optically thin, unlike the O IV] lines. In essence, downward directed radiation in Si IV lines can be scattered outwards, but in O IV] lines downward radiation is absorbed by the background continuum.
Another problem is that intensities of UV lines of Na-like and Li-like ions are known to be too weak by factors of several compared with lines of other sequences. In the accurate measurements used by (Judge et al., 1995), the Na-like Si IV lines are 2.5 times brighter than calculations predict. This discrepancy must lie outside of the high density effects because disk-averaged spectra contain many spin forbidden lines whose intensities are inconsistent with cm-3. Perhaps this originates in non-equilibrium ionization (Hansteen, 1993) or non-thermal distributions of electrons. Here I simply remind the reader of this additional problem.
Taken together, all these issues indicate that computations of relative intensities of Si IV and O IV] lines are uncertain to at least a factor of three. Most importantly, at least four independent processes can enhance the intensities of the Si IV line, each by factors of two to three. When these systematic effects are compounded, low-density computations may underestimate the ratio of Si IV to O IV] line intensities by an order of magnitude, which then would be mistakenly interpreted as an increased electron density using the above methods.
Figure 3 (a) shows Figure S8 of P2014, generalized to include different assumed values of . Differences with the shape of the curve of P2014 are primarily due to the different ionization equilibrium calculations used. I included approximate corrections for the DR suppression following Judge (2007). Clearly, the chosen form of strongly determines the outcome of the density analysis. There is no physical reason for choosing particular values of in the bombs. When electron heat conduction from overlying coronal plasma dominates the energy balance, these quantities are physically related (Jordan, 1992). But there is no evidence for coronal emission in the bombs, and there exists a class of solutions for “cool loop” structures invoked to account for long-standing observational problems in the solar transition region (Feldman, 1983; Dowdy et al., 1986). Such solutions can in principle have ratios that greatly exceed unity.
Figure 3 (b) shows line ratios computed for homogeneous plasmas where . All regions below the contour marked with the arrow are compatible with the observed lower limit to the ratio. When (very little plasma above K) the line ratios contours become more horizontal than vertical. The ratios are then primarily sensitive to than . In adopting equal emission measures for and 5.16, P2014 are forced to look for solutions beyond cm-3 in their Figure S8 in order to reconcile observed and computed line ratios. Instead, Figure 3 demonstrates that the line ratio analysis is subject to an entirely different interpretation where there is less plasma above .
In conclusion, the mean density is not even defined without drastic simplifying assumptions, even then they are poorly constrained and subject to systematic over-estimation by factors of 3 if low density ionization equilibrium approximations are used. By acknowledging possible FIP effects and the anomalous Li- and Na- like ion intensities, the over-estimate can easily increase to an order of magnitude or more as the increased Si/O intensity ratio is ascribed erroneously to pure density increases that decrease the O IV] emission rate.
2.3. Absorption lines
P2014 report several lines seen weakly in absorption against the bomb emission. They find that they are all slightly blue-shifted owing to flux emergence pushing pre-existing material upwards, and conclude that “the absorption features indeed belong directly to the bombs”. Here I simply estimate the column mass of material needed to account for these weak absorption features.
| Ion | log gf | ||||
| nm | cm-1 | dyn cm-2 | |||
| S I | 139.2589 | -3.35 | 573 | 360 | |
| 140.1515 | -1.18 | 396 | 2.3 | ||
| Fe II | 133.5409 | -0.93 | 27,620 | 800 | |
| 139.2816∗ | -0.483 | 20,806 | 60 | ||
| 139.3214 | -1.21 | 20,340 | 290 | ||
| 140.1774 | -0.91 | 22,810 | 250 | ||
| 140.3101∗ | -1.922 | 1,872 | 25 | ||
| 140.3255 | -1.25 | 22,810 | 550 | ||
| Ni II | 133.5203∗ | -0.19 | 1,507 | 4 | |
| 139.333∗ | -0.88 | 0 | 15 |
∗Data from Kurucz CD-ROM 23. Other data from NIST’s spectroscopic database. Partition functions of 50 and 25 were used for Fe II and Ni II corresponding to a plasma temperature of 6500K.
Table 2 lists pressures in the VAL3C atmosphere where the optical depths in the background atmosphere equal one in those observed absorption lines for which NIST atomic data are available. (Optical depth is proportional to column mass and ). Both Fe II and S I were assumed to be dominant ionization stages in the chromosphere, in making this table. The 133.54 nm line requires the highest optical depths to form a weak absorption line, the pressure at being almost 800 dyne cm-2. This corresponds to a column mass of 0.03 g cm-2 or a height of about 560 km. The line probably requires an optical depth close to 0.1 or even less since it is very shallow (bomb B-1) or absent (other bombs), thus these absorption features must form in plasma originally above about 80 dyne cm-2, near a pre-existing height of 850 km. The absorption of each line is stronger for smaller values of , The relative weakness of the observed S I lines implies that S I is mostly ionized above this height, a result confirmed in radiative transfer calculations with RH. Other than this, the line strengths appear in qualitative agreement with the absorption line depths seen in the data of P2014 (their Figure 3).
3. Discussion
I have summarized and/or demonstrated the following:
-
•
UV photons from Si IV bombs cannot escape from below 500 km above the continuum photosphere.
-
•
Computed Si IV lines have been shown to underestimate their brightness by factors of 2-3 in much earlier work, even in quiet Sun plasmas.
-
•
At very high densities claimed by P2014, Si IV becomes yet stronger as dielectronic recombination to Si2+ is suppressed and ionization from metastable levels increases. Such effects were not taken into account by P2014.
-
•
In at least one case the Si IV lines show evidence of a small optical depth. Scattering of Si IV photons by modestly opaque bomb plasma will enhance outward directed intensity by up to a factor of 2 Judge & Pietarila, 2004.
-
•
Any density analysis of Si/O line ratios hinges on an arbitrary assumption concerning the form of the emission measure distribution between and 5.1. Unfortunately, almost any density can be made consistent with the data, given this extra degree of freedom.
-
•
IRIS should observe the permitted multiplet of O IV near 134 nm if it is to address this problem.
-
•
Absorption lines with optical depths form in normal chromospheric plasma at pressures close to 80 dyne cm-2 which originally lies near 850 km.
Let us give P2014 the benefit of the doubt and accept their general assumptions in evaluating densities. Even if the assumptions concerning the form of are accepted, their calculations miss important physical processes leading them to under-estimate the intensities of the Si IV lines, by a factor of 10 or so. Consequently they over-estimate the electron densities by an order of magnitude. Even in the most extreme case (B-1), . This new constraint implies most bomb plasma originated from regions where, before explosion, g cm-3 or a height km above the undisturbed continuum photosphere. This constraint may seem uncomfortably above the km limit derived from absorption lines in bomb B-1. But given the general difficulties with density diagnosis, and the fact that the 850 km limit comes from the weakest of the absorption lines visible only in B-1, it seems reasonable to conclude that, all constraints considered, the bombs originate from plasma between and km in the pre-bomb atmosphere. If their implicit assumption () proves incorrect, then the electron and hydrogen densities will be change accordingly (Figure 3(b)). No method is known to the present author by which this important assumption is testable given these data. New observations including the permitted O IV multiplet near 134 nm should help.
Are the lower limit pressure and height of 500 km “photospheric?” Certainly it lies above the temperature minimum in VAL3C. However, as understood in physical terms, the photosphere is the region where the bulk of the radiative flux is radiated into space. The solar photosphere starts therefore where the radial optical depth in the 500 nm continuum equals unity, . The upper levels of the photosphere are less well defined. Allen’s (1973, § 77) definition is that the photosphere extends to where which lies 320 km above . Only a small fraction of the Sun’s radiative flux can originate above , so Allen’s definition allows % of the solar flux to be radiated.
Does it even matter that the bombs form in “photospheric” versus “chromospheric” plasma? Or is this merely semanticism? Indeed it matters because of the stratification. At the high densities of the photosphere, the Alfvén speed is slow for field strengths of a few hundred Gauss, characteristic of the regions without spots or pores where these bombs appear. Using Fig 1 of P2014, I use (optimistically) =400 G. The Alfvén speed at 500 km is 9 km s-1. Fast reconnection tends to occur at rates with outflows close to 0.1. For a bomb of say 3Mm size, the reconnection time scale is of order an hour, an order of magnitude larger than a typical bomb lifetime.
All things considered, it seems that the bombs arise from plasma with total particle densities, before explosion, that lie between 550 and km above the . This places the phenomenon’s origin in the low-mid chromosphere or above.
4. Speculations
Prompted by the higher Alfvén speeds associated with chromospheric plasma, I speculate on the nature of the bomb plasma. I also note that other observational properties of the bombs identified by P2014 are not easy to reconcile with the association of bombs with reconnection jets. More generally, reconnection leads to efficient acceleration of plasma through the change in topology and subsequent Lorentz force, but the direct heating effects are usually small. Why then should we expect to interpret the radiation from strongly heated plasma such as seen in the IRIS emission lines directly as reconnection jets?
The 5 minute bomb lifetimes greatly exceed the dynamical crossing times if we are to accept the proposal that the 100 km/s speeds represent reconnection jets. Reconnection must occur over several minutes in this picture, a perfectly reasonable picture. However, the bombs would be expected to exhibit large asymmetries between up- and down-flowing plasma because the surrounding atmosphere is highly stratified. The proposed supersonic jets must surely interact with surrounding magnetized plasma with observable consequences. At least for the overlying chromosphere, no obvious interaction is seen, instead benign absorption features are observed. What happens to the energy of the proposed jets? Perhaps this energy returns to photospheric layers, guided by closed fields, where it is deposited but is almost invisible being energetically a small contribution. I suggest that a more natural explanation of the broad rather symmetric lines is Alfvénic turbulence trapped in a compact loop-like flux tube that exists somewhere in the low-middle chromosphere, driven perhaps by reconnection that occupies a small volume of the system at any given time. Bombs are usually associated with magnetic footpoints of opposite polarities separated by 1000-2000 km, suggesting such a structure. This speculation appears worthy of further study.
References
- Allen (1973) Allen, C. W. 1973, Astrophysical Quantities (Univ. London: Athlone Press)
- De Pontieu et al. (2014) De Pontieu, B., Title, A. M., Lemen, J. R., et al. 2014, Solar Phys., 289, 2733
- Dowdy et al. (1986) Dowdy, J. F., J., Rabin, D., & Moore, R. L. 1986, Solar Phys., 105, 35
- Doyle et al. (2005) Doyle, J. G., Summers, H. P., & Bryans, P. 2005, Astron. Astrophys., 430, L29
- Feldman (1983) Feldman, U. 1983, Astrophys. J., 275, 367
- Feldman (1998) —. 1998, Space Sci. Rev., 85, 227
- Hansteen (1993) Hansteen, V. 1993, Astrophys. J., 402, 741
- Jordan (1992) Jordan, C. 1992, Memorie della Societa Astronomica Italiana, 63, 605
- Judge (2007) Judge, P. 2007, THE HAO SPECTRAL DIAGNOSTIC PACKAGE FOR EMITTED RADIATION (haos-diper) Reference Guide (Version 1.0), Tech. Rep. NCAR/TN-473-STR, National Center for Atmospheric Research
- Judge et al. (1997) Judge, P. G., Hubeny, V., & Brown, J. C. 1997, Astrophys. J., 475, 275
- Judge & Pietarila (2004) Judge, P. G., & Pietarila, A. 2004, Astrophys. J., 606, 1258
- Judge et al. (1995) Judge, P. G., Woods, T. N., Brekke, P., & Rottman, G. J. 1995, Astrophys. J. Lett., 455, L85
- Leenaarts et al. (2012) Leenaarts, J., Carlsson, M., & Rouppe van der Voort, L. 2012, Astrophys. J., 749, 136
- Peter et al. (2014) Peter, H., Tian, H., Curdt, W., et al. 2014, Science, 346, C315
- Seaton (1987) Seaton, M. J. 1987, J. Phys. B: At. Mol. Phys., 20, 6363
- Summers (1974) Summers, H. P. 1974, Mon. Not. R. Astron. Soc., 169, 663
- Uitenbroek (2000) Uitenbroek, H. 2000, Astrophys. J., 531, 571
- Vernazza et al. (1981) Vernazza, J., Avrett, E., & Loeser, R. 1981, Astrophys. J. Suppl. Ser., 45, 635