kxl014 \gridframeN \cropmarkN \MonthJune \Year2015
The role of correlation and solvation in ion interactions with B-DNA
Abstract
The ionic atmospheres around nucleic acids play important roles in biological function. Large-scale explicit solvent simulations coupled to experimental assays such as anomalous small-angle X-ray scattering (ASAXS) can provide important insights into the structure and energetics of such atmospheres but are time- and resource-intensive. In this paper, we use classical density functional theory (cDFT) to explore the balance between ion-DNA, ion-water, and ion-ion interactions in ionic atmospheres of RbCl, SrCl2, and CoHexCl3 (cobalt hexammine chloride) around a B-form DNA molecule. The accuracy of the cDFT calculations was assessed by comparison between simulated and experimental ASAXS curves, demonstrating that an accurate model should take into account ion-ion correlation and ion hydration forces, DNA topology, and the discrete distribution of charges on the DNA backbone . As expected, these calculations revealed significant differences between monovalent, divalent, and trivalent cation distributions around DNA. About half of the DNA-bound Rb+ ions penetrate into the minor groove of the DNA and half adsorb on the DNA backbone . The fraction of cations in the minor groove decreases for the larger Sr2+ ions and becomes zero for CoHex3+ ions, which all adsorb on the DNA backbone . The distribution of CoHex3+ ions is mainly determined by Coulomb and steric interactions, while ion-correlation forces play a central role in the monovalent Rb+ distribution and a combination of ion-correlation and hydration forces affect the Sr2+ distribution around DNA. This does not imply that correlations in CoHex solutions are weaker or stronger than for other ions. Steric inaccessibility of the grooves to large CoHex ions leads to their binding at the DNA surface. In this binding mode, first-order electrostatic interactions (Coulomb) dominate the overall binding energy as evidenced by low sensitivity of ionic distribution to the presence or absence of second-order electrostatic correlation interactions. Please address correspondence to Nathan Baker (nathan.baker@pnnl.gov).
doi:
doi: 10.1529/biophysj.XYZ.123456Introduction
Interactions with ions stabilize nucleic acid secondary and tertiary structure, have a major impact on DNA packing in cells, and strongly influence protein and drug binding (1, 2, 3, 4, 5, 6, 7, 8, 9). A fraction of counterions bind to specific sites on nucleic acids and can be detected in crystallographic structures (10), while other counterions form a dynamic ion atmosphere around DNA, diffusing along the molecule and exchanging with ions in bulk solution (11). Mean-field approaches such as Manning counterion condensation (12) and Poisson-Boltzmann (PB) (13, 14, 15, 16) theory have been used to obtain insight into ion distributions around biomolecules and ion-mediated interactions between macro-ions and have been compared with experimental data with some success (17, 18, 19, 20). While successful in describing some properties of nucleic acids in electrolyte solutions (e.g., RNA p shifts (21), monovalent ion concentration linkages to ligand-DNA binding (22, 8, 9, 23), and low valency ion distributions around DNA), these mean-field methods often fail when the ion charge concentration increases. For example, PB models cannot capture the displacement of Na+ by Mg2+ around DNA in mixed solutions (17) or ion-mediated DNA-DNA attractive interactions (24). By imposing the constraint that a fraction of the counterions are bound (condensed) to polyelectrolyte and part form ionic atmosphere in the mean-field counterion condensation theory, it has been possible to reproduce attraction between like-charged polyelectrolytes in the presence of monovalent counterions in the intermediate range of separations (24, 25, 26, 27, 28). Manning suggests that the origin of this effect lies in the increase in entropy due to the increase in the effective volume available for condensed counterions as two DNA molecules approach (26). Such condensation implies penetration of ions through the DNA hydration layer and their partial desolvation to form direct bonds with DNA (29, 30, 18). Describing this process requires atomistic or coarse-grained representation of the macro-ion, which captures both the discreteness of charge distribution on the DNA backbone and DNA topology, as well as a model for ion desolvation. Such characteristics are not currently present in the PB equation or other popular models of biomolecular electrostatics.
These failures suggest that, to reliably describe ion distribution around nucleic acids, the theoretical model must be refined to include more detailed interactions and incorporate higher-order non-mean-field interactions such as fluctuations. Such extensions of PB approach have been developed for simple geometries (e.g., plates, rods, spheres, etc.) to include second-order terms representing the interactions between fluctuations in ionic densities (31, 32, 33, 34, 35, 36, 37). These extended models and molecular simulations (38, 39, 40, 41, 42, 43, 44, 45, 46) as well as experimental data (47, 48, 49, 50, 51, 52, 53, 54, 55, 56, 57, 58) predict attraction between like-charged objects in the presence of multivalent electrolytes.
In this study, we establish a minimal model based on classical density functional theory (cDFT) to systematically study the influence of the discrete DNA molecular charge representation, ion-ion correlations, and ion-solvent interactions on the distribution of monovalent and multivalent ions around highly charged macromolecules. We show that this model is able to accurately reproduce the results of anomalous small-angle X-ray scattering (ASAXS) experiments (59, 60, 19, 61) for B-DNA in RbCl, SrCl2 and CoHexCl3 solutions. As expected, ion-ion correlations play a significant role in the accurate prediction of ASAXS curves. However, our results also demonstrate the importance of ion solvation in cation-DNA interactions and show that for doubly-charged cations these interactions can be as important as ion-ion correlations in modeling ion distributions around DNA.
Methods
DNA models
We used two coarse-grained models for the DNA macro-ion in the cDFT simulations: an infinitely long cylinder with a uniform line charge density along its -axis (charge distribution -1 e per 0.17 nm and the 2 nm cylinder diameter) and a model with a discrete charge distribution (Fig. 1). Na+ counterions present at 0.78 M concentration in all DNA calculations. The discrete charge distribution of the second model is described by three particle types: two helical arrays of charged spheres that represent the phosphate groups (charge -1 e, diameter 0.42 nm), two helical arrays of neutral spheres (diameter 0.42 nm) that represent the sugar/base groups, and an array of overlapping neutral spheres (diameter 0.78 nm) defining the DNA axis (62). The positions of these spheres were chosen to mimic B-form DNA using a cylindrical coordinate system for DNA backbone and base pair . The phosphate spheres have coordinates nm, degrees, and nm; the sugar/base spheres have coordinates nm, degrees, and nm; and the axis spheres have coordinates nm, degrees, and nm. There are 10 base pairs per turn of B-DNA; the angular cylindrical coordinates for backbone start at and degrees, respectively.
(a) 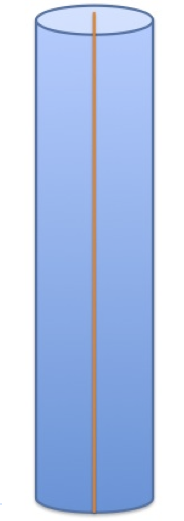 (b)
(b) 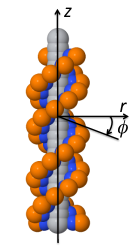
Computational models
A variety of computational models were used with the DNA models described above to assess the influence of different energetic contributions on DNA-ion interactions. These models are summarized in Table 1 and described in detail in the following sections.
| Model | Ion-ion elec. correl. | Ion-ion steric correl. | Ion-solvent interact. | Water struct. change | Rb+ exp. agreement | Sr2+ exp. agreement | CoHex3+ exp. agreement |
|---|---|---|---|---|---|---|---|
| NLPB | no | no | no | no | no* | no* | yes |
| cDFT, no correlation | no | yes | no | yes | no* | no* | yes |
| cDFT, no ion solvation | yes | yes | no | yes | yes | no* | yes |
| cDFT, full model | yes | yes | yes | yes | yes | yes | yes |
*Agreement with experiment can be obtained by fitting ion radii.
Classical density functional theory (cDFT)
Classical DFT (cDFT) has been previously used to determine the equilibrium distributions of multicomponent salt solutions surrounding DNA (63, 64, 65). In our cDFT models, the aqueous salt solution was modeled as a dielectric medium with , charged spherical particles representing ions, and neutral spherical particles representing water molecules. The concentration of spherical “water molecules” was 55.5 M, chosen to model experimental water density. The solutions considered in this work were aqueous NaCl, RbCl, SrCl2 and CoHexCl3 electrolytes in Na+ buffer. These electrolytes were chosen based on the availability of the experimental data for these systems (59, 60). We used experimental crystalline ionic diameters for mobile ions: nm, nm, nm, = 0.322 nm, nm, and nm (66). The ion charges were , , , , = -1, and . Parameterization of the cDFT model was performed against experimental data for the concentration dependence of mean activity coefficients in bulk electrolyte solutions (see Supporting Information). All calculations were performed at 298 K temperature.
To determine the equilibrium water and ion distributions via cDFT, the total Helmholtz free energy functional is minimized with respect to the densities of all the species in the presence of rigid DNA models. For this optimization, it is convenient to partition the total free energy of the system into so-called ideal () and excess components () (63). The ideal free energy corresponds to the non-interacting system and is determined by the configurational entropy contributions from water and small ions,
| (1) |
where is Boltzmann’s constant, is the temperature, is the density profile of ion species , is the number of ion species, is the ion coordinate, and is the calculation domain. The excess free energy is generally not known exactly but can be approximated by
| (2) |
where is the hard-sphere repulsion term, is the ion-ion electrostatic correlation term, is the direct Coulomb term, and is the ion-solvent interaction term included in some cDFT calculations (as described below).
The ion-ion steric correlation term excess free energy describes ion and water many-body interactions in condensed phase due to density fluctuations and can be approximated by Fundamental Measure Theory (67) as
| (3) |
where the functional has the form (68)
| (4) |
where and are the scalar and vector weighted averages of the density distribution functions and are defined by:
In the limit of a bulk hard-sphere fluid in the absence of external fields, vector densities and vanish. In the same limit, the four scalar weighted densities reduce to the sum of bulk densities for all species () and the 1D (), 2D (), and 3D () packing fractions. The “weight functions” and , characterizing the geometry of particles (ion-ion steric correlations with radius for ion species ), are given by (68)
| (5) | ||||
| (6) | ||||
| (7) | ||||
| (8) | ||||
| (9) | ||||
| (10) |
In the preceding formula, is the Heaviside step function, with for and for , and denotes the Dirac delta function.
The ion-ion electrostatic interaction term () can be derived using the Mean Spherical Approximation (33, 35)
| (11) |
where is the bulk concentration of ion species and the first term describes ion correlation free energy in bulk electrolyte solution in the absence of DNA. The first-order direct correlation functions are defined as
| (12) |
where is the chemical potential of ion species . The second-order direct correlation functions are defined as
| (13) |
where is the charge of ion species , is the dielectric constant of the solvent, is the hard-sphere contact distance between ions of diameters and , is given by
| (14) |
, is the inverse Debye length , is the Bjerrum length, and is the unit charge. The direct Coulomb free energy term can be calculated exactly
| (15) |
Finally, the ion-solvent interaction term models ion-water interactions with a square well potential
| (16) |
where is the well depth, and is the well width. For the current study, is the well width for interactions between ions and water and is the sum of radii of interacting particles (64). The following well depths were calculated using SPC/E water using the parameters from Horinek et al: eV, eV, eV (69). Simulations of concentration dependence of ion activity coefficients in RbCl and CoHex solutions demonstrated that adding attractive ion-water interactions does not affect the ion chemical potential (see Supporting Information).
Minimization of the excess free energy functional with respect to the water and ion densities gives
| (17) |
We solve Poisson’s equation
| (18) |
for the electrostatic potential () where is the dielectric coefficient. For an infinitely long uniformly charged cylinder in electroneutral conditions, the potential
| (19) |
Using this potential for the cylinder model and a numerical solution to Poisson’s equation (Eq. 18) for the 3D DNA model, the expression for the densities is
| (20) |
The resulting system of Eqs. 18 and 20 was solved iteratively to self-consistency using the numerical procedure described in detail by Meng (68). In particular, equilibrium ion density distributions were obtained using a relaxed Gummel iterative procedure for 3D systems and Picard iterations in 1D. Convergence was considered to be achieved when the maximum difference between the input and the output density profiles between iterations was smaller than . The solution of Eqs. 18 and 20 encompasses the equilibrium distribution of the densities of all ion species, corresponding to the minimum of the total free energy; the corresponding free energies for each contribution; and the chemical potentials. “Panoramic” density distributions representing angular distributions of ions on DNA backbone and in minor grooves were calculated along the corresponding helical shells. For each, angle the ion densities were averaged within the shells over and . For ions on the DNA backbone and in the minor grooves, the radial positions of the shells was defined as nm and nm, respectively.
Three main features distinguish our approach from previous cDFT models (70, 71, 72). First, our model includes a full representation of the coarse-grained DNA topology and a discrete distribution of charges. Second, we use Pauling diameters for ions and van der Waals diameters for water molecules as opposed to previous restricted models where all species have the same diameter. Finally, our model includes water-ion attractive interactions.
Anomalous small-angle X-ray scattering curve calculations
ASAXS profiles were calculated using the ion density distributions around DNA. In the 3D model, ion densities were averaged in cylindrical coordinates over the cylinder azimuthal angle and length for each radial distance from the DNA axis. The excess form factor for ion species was calculated as
| (21) |
where is a constant related to the average electron density of ion species and is the scattering vector. In the current study, we only consider the excess form factor due to cation species; the chloride anion has no ASAXS response. Furthermore, we only consider a single cation species at a time so that .
The excess form factor of DNA () was calculated using AquaSAXS (73). from the form factor of DNA in vacuo (), the form factor of the volume of water excluded by DNA (), and the form factor of hydration shell of the DNA ():
| (22) |
where is the bulk density of water. The form factor of the hydration shell is calculated using water density maps, , obtained via AquaSol (74), which employs the Poisson-Boltzmann formalism with water treated as an assembly of self-oriented dipoles:
| (23) |
where is a scale factor to adjust the hydration shell contribution (usually ) and integration is performed over the region where solvent density deviates from the bulk by a factor larger (in magnitude) than .
The ASAXS intensity is then calculated from these quantities as
| (24) |
where is the energy-dependent real part of ion anomalous scattering factor, is the energy far from the X-ray absorption edge of the ion, is the energy near the edge where ion scattering is suppressed by absorption, is the energy independent solvent-corrected scattering factor, is the effective number of electrons from DNA and is the number of excess ions around DNA (59) (see Supporting Information for more details). Since experimental data are available in arbitrary units, theoretical intensities were uniformly scaled with a common scaling factor, chosen to match the experimental and calculated intensities, obtained using 3D cDFT-full model, at low .
Results
Tables 1 and 2 provide qualitative and quantitative results on the performance of the models. These results are described in greater detail below.
| Model | Rb+ | Sr2+ | CoHex3+ |
|---|---|---|---|
| NLPB | 23.0 | 13.6 | 5.6 |
| cDFT, no correlation | 23.4 | 13.7 | 5.6 |
| cDFT, no ion solvation | 34.9 | 25.1 | 5.7 |
| cDFT, full model | 34.6 | 16.6 | 5.7 |
| Experiment | 34 3 | 19 2 | No data |
Comparison between DNA Model systems
The uniformly charged cylinder model (Fig. 1 left) represents a one-dimensional case for which ionic distribution is only a function of the radial distance from the cylinder axis. This 1D model produces monotonically decreasing with the distance from the cylinder surface density distributions of monovalent and multivalent counterions (Fig. 2). Competitive cation condensation in mixed 5 mM CoHexCl3 + 20 mM NaCl solutions results in preferential CoHex3+ condensation on the cylinder surface: sodium ions are not found in the immediate vicinity of the DNA (Fig. 2b). This competition is in qualitative agreement with experimental observations of a negligible effect of Na+ on CoHex3+ binding when NaCl concentration is below 40 mM (75).
(a) 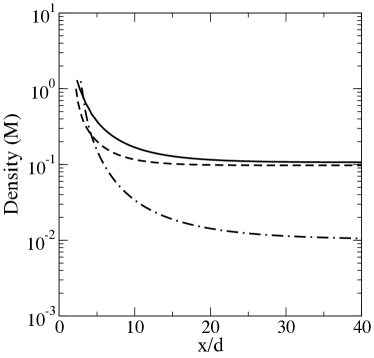 (b)
(b) 
For monovalent ions, the 1D cDFT calculations predict 91.5% and 77.5% DNA charge neutralization by Na+ and Rb+, respectively. Such differences in monovalent cation condensation on DNA were not observed experimentally (76), demonstrating a fundamental deficiency of a uniformly charged cylinder model for simulating ionic atmosphere around DNA. For divalent ions, the 1D cDFT calculations predict charge inversion at the DNA surface in SrCl2 solution. Note that charge inversion in the presence of multivalent salts has also been observed in cDFT and MC simulations for a cylinder DNA model (70, 71). However, we do not see this effect in our more detailed 3D DNA geometry simulations (see below). Finally, for trivalent ions, 90% DNA charge neutralization is found within 5 CoHex radii from the cylinder surface or within the region where excess CoHex concentration is present (Fig. 2b).
We also performed 3D cDFT calculations of the same electrolyte solutions surrounding the helical discrete charge model (Fig. 1 right). Fig. 3 shows cDFT results for the monovalent ion Rb+.
(a) 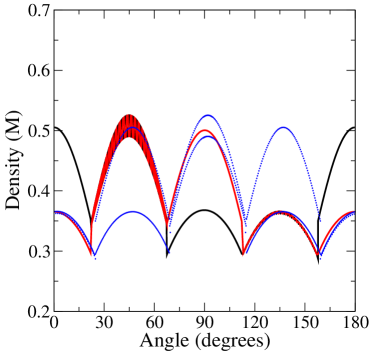 (b)
(b) 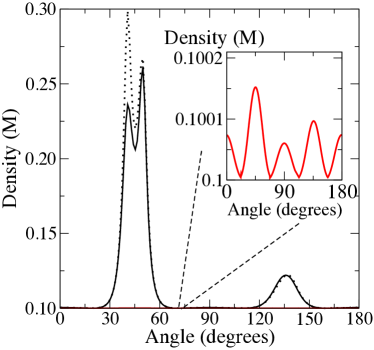 (c)
(c) 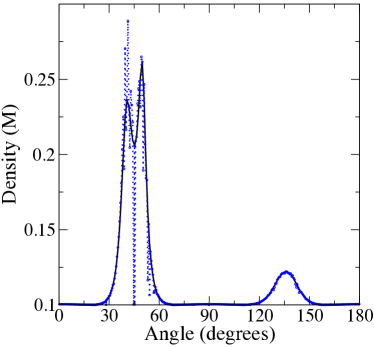 (d)
(d) 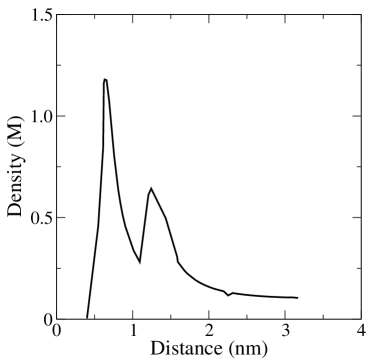
As shown in the panoramic density profiles, cDFT predicts a two-peak radial density distribution of Rb+ (Fig. 3): first peak at around 0.6 nm is due to cation penetration into DNA minor grooves and the second peak at 1.2 nm to Rb+ condensation on DNA backbones. These data are in good quantitative agreement with molecular dynamics results obtained using TIP3P water model (18). Fig. 4 shows cDFT results for the divalent ion Sr2+.
(a) 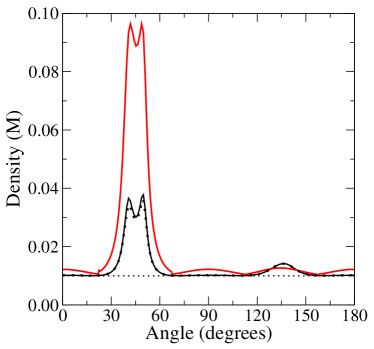 (b)
(b) 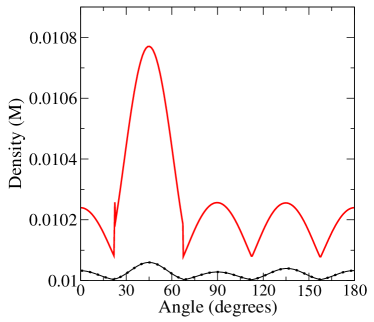 (c)
(c) 
In the case of Sr2+, the effect of ion-solvent interactions can be clearly seen in the density distribution of Sr2+ with respect to the DNA axis (Fig. 4). While both cDFT models - with and without ion-solvent interactions - produce two-peak Sr2+ density distributions at the same positions with respect to the DNA axis, the density distributions are qualitatively different. In particular, the model without ion-solvent interactions predicts much higher Sr2+ concentration in the DNA grooves than on the backbone , while the trend is reversed in the model with ion-solvent interactions. The 3D cDFT results for trivalent CoHexCl3 solutions are shown in Fig. 5b and are very similar to those obtained from the 1D cDFT model.
(a) 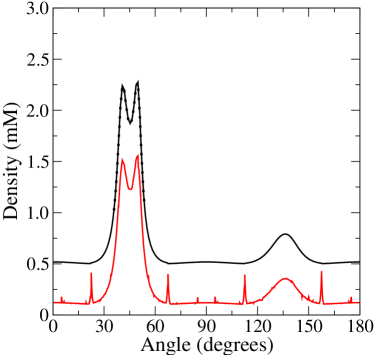 (b)
(b) 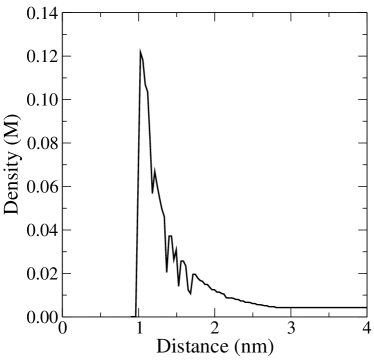
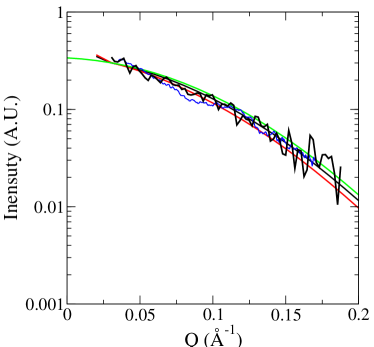
Finally, we used the results of our cDFT and NLPB calculations to determine ASAXS profiles as described in the Methods section. The results of these calculations for Rb+ and Sr2+, together with experimental data, are shown in Fig. 6.
(a)  (b)
(b) 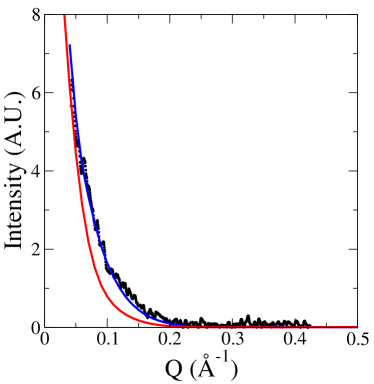
Similar results for CoHexCl3 are shown in Fig. 7.
Discussion
Comparison to Manning condensation
The cDFT calculations of ionic distributions for the uniformly charged cylinder model (Fig. 2) reproduce the Manning condensation limits (12) with approximately 1M concentrations of singly-charged cations at the cylinder surface. A complete 3D cDFT model also reproduces the Manning condensation limit for monovalent cations: the concentration of condensed Rb+ on the backbone and in minor groove is about 1 M (Fig. 3). The 1 M limit for monovalent ion concentrations at DNA surface corresponds to 76% compensation of native B-form DNA charge by condensed counterions. Manning’s theory predicts that the concentration of condensed counterions is independent of bulk salt concentration in the range of 0.0001-–0.1 M and increases slightly for higher ionic strengths of monovalent electrolyte solution (80% charge compensation for 0.5 M and 83% for 1 M solutions). Additionally, the 3D cDFT model predicts that the multivalent ions form much denser layers at the DNA surface than the monovalent cations (Figures 3, 4, and 5), consistent with Manning theory. The good correlation between our non-mean-field cDFT model (with full ion-ion correlations included) and the mean-field Manning theory is somewhat surprising, particularly given the significant differences observed in the total condensed ion densities between cDFT and the mean-field NLPB approaches. However, Manning theory indirectly accounts for interactions beyond first-order electrostatics through partitioning the total ion density into condensed ions and the surrounding ionic atmosphere. This accounts for the success of Manning theory in predicting the condensed concentrations of 1:1 electrolyte counterions on DNA as observed in experiments (12) and recent MD simulations (18).
Ion interaction with DNA grooves
By definition, the cylinder model does not allow ion penetration inside DNA and therefore yields well-known monotonically decreasing counterion distributions shown in Fig. 2. Thus, the model is not adequate for describing the interaction between DNA and small weakly solvated Na+ and Rb+ ions, which are known to penetrate into the minor grooves of DNA (18, 77). However, our more detailed helical charge model allows ion penetration. Simulations of RbCl solutions using this model showed that about half of the condensed Rb+ ions are bound to the minor groove of the DNA molecule (Fig. 3). The distributions of cation densities on the DNA backbone and in the minor groove are highly structured: they exhibit a periodicity correlated with the periodic spacing of phosphate groups on the DNA backbone . In contrast, cation distributions in the major groove are mostly featureless (see Fig. S1 in Supporting Information), in agreement with previous simulations and experimental data (30). Penetration of some cations into the grooves lowers the effective charge density on the DNA, limiting cation condensation on the backbone .
Increasing cation valency correlates with a stronger preference of cation binding to phosphate groups on the DNA backbone (Figures 3, 4, and 5). A similar preference for CoHex3+ binding to phosphates of B-DNA was also observed in MD simulations (78) and is determined by the strong electrostatic attraction of the trivalent cations to phosphate groups, CoHex3+-CoHex3+ repulsion, and steric inaccessibility of B-DNA minor groove to the large CoHex3+ ions. As shown in Figures 4 and 5, both Sr2+ and CoHex3+ ions preferentially bind to every fourth phosphate on the strand. Further away from the DNA axis, the Sr2+ density variations along the angular cylindrical coordinate have the same period as the period of the angular phosphate distribution (Fig. 4). The period of the density variations for CoHex3+ (Fig. 5) is two times larger than for Sr2+; i.e., some Sr2+ions can penetrate into the minor groove, while CoHex3+ ions bind exclusively to phosphate groups on the backbone .
Influence of correlation on ion distributions
To investigate the influence of ion correlation forces on the distribution of ions around DNA, we used a cDFT model without ion-correlation interactions (cDFT-nc) as well as the nonlinear Poisson-Boltzmann (NLPB) model, which also lacks correlation (Figures 3, 4, and 5). Both models without correlations yield qualitatively different ion distributions than the 3D cDFT calculations which include correlations. In the presence of correlations, sterically allowed ions accumulate in the minor groove; in the absence of correlations, ions accumulate near phosphate groups on the exterior of the DNA strand. The largest qualitative difference between NLPB and cDFT ion distributions was observed for the Rb+ density distribution. In NLPB, Rb+ ions decorate the phosphate groups, driven by Coulombic interactions; the panoramic distribution of Rb+ ions condensed on the backbone in NLPB model has a larger peak at 45∘ and a smaller one at 135∘ (Figures 3, 4, and 5). In contrast, ion-ion correlations reduce the effective electrostatic repulsion between cations promoting their penetration into the grooves.Due to stronger Coulomb interactions between multiply-charged cations the effect of correlations is weaker for Sr2+ and CoHex3+ resulting in the decrease in the fraction of counterions in the grooves with ion radius and charge (Fig. 4 and Fig. 5). For CoHex3+ the concentration of counterions in the grooves becomes insignificant.As a result, NLPB and cDFT predict qualitatively similar panoramic density distributions on DNA the DNA backbone for Sr2+ and CoHex3+ (Figures 4 and 5).
As illustrated in the figures and Tables 1 and 2, the models without correlations (NLPB and cDFT-nc) are very similar to each other, indicating the major influence of correlation on even low charge-density (monovalent) ion behavior. This result contrasts the conclusion that correlations are insignificant in monovalent electrolytes from early theories of ion correlations (79). However, these theories considered electrolytes at uniformly charged surfaces ignoring the influence of the discreteness of charge distribution on fluctuations in ionic atmosphere. Not surprisingly, these models do not capture the experimentally observed attraction between like-charged polyelectrolytes in low concentration monovalent electrolytes (54, 26). Recent molecular dynamic simulations also point to the importance of non-mean-field interactions between biomolecules and monovalent electrolytes manifested in a more structured ionic atmosphere than that predicted by NLPB (18, 77). The small difference between the cDFT-nc and NLPB models (in the height of the double peak around 45∘) for Rb+ is due to the solvent excluded-volume effects included in the cDFT-nc model and absent from NLPB theory (Fig. 3).
Ion correlations also influence ion-specific details in density distributions for counterions of the same valency. 3D cDFT results demonstrate that smaller Na+ ions tend to accumulate on the DNA backbone and minor groove while Rb+ ions are more evenly distributed along the DNA helix (see Fig. 3a). In the cDFT-nc and NLPB models with no correlation, the differences between Na+ and Rb+ distributions are significantly smaller (see Fig. 3b), suggesting that ion-correlation interactions are responsible for this effect.
Comparison with ASAXS experiments
ASAXS profiles calculated using the 3D cDFT model show very good agreement with experimental data (60) for RbCl solutions (Fig. 6). The shapes of the scattering curves are very similar in the 1D cDFT and 3D cDFT models, with similar average numbers of condensed counterions: the 1D and 3D cDFT calculations predict 34.9 and 34.6 condensed Rb+ ions, respectively. Both predictions are within error of the experimental measurement of 34 3 ions (59). However, the distribution of Rb+ ions is different in these models: all condensed cations decorate the cylinder surface (by definition) in the 1D model while half of the condensed cations are on the DNA backbone and the other half are in minor grooves in the 3D models. In contrast, the 3D NLPB model shows a significant deviation of the simulated scattering curve from the experimental one (Fig. 6). As discussed in the previous section, penetration of some cations into DNA grooves reduces the negative electrostatic potential acting on cations in solution. In the absence of any interactions beyond Coulomb forces, this penetration leads to lower concentrations of cations on the DNA surface and lower concentrations of condensed counterions. Previous NLPB simulations demonstrated that adjusting the ionic radius of Rb+ to its hydrated radius and prohibiting ion penetration into the DNA hydration shell can lead to closer agreement between 3D NLPB results and experiment (76) – but at the price of an incorrect ion distribution around DNA.
Comparison of calculated and experimental SrCl2 data highlight the importance of ion-solvent interactions on ion distributions around DNA (Fig. 6). Sr2+ ions have a significant hydration energy; approximately 3 times higher than that of monovalent alkali metal ions. These strong cation-water interactions lower the entropy of water molecules around cations, but introduce a higher enthalpy cost for partial ion desolvation (80). Simulations with the solvent approximated as dielectric continuum do not account for such desolvation, limiting interactions in the system to first- and second-order electrostatic interactions: Coulomb and ion-correlation forces. To understand the importance of these desolvation contributions, we used two variants of the cDFT model: one with attractive cation-water interactions and another without. As shown in Fig. 6, ASAXS curves calculated using cDFT without desolvation contributions via ion-solvent interactions deviate significantly from the experimental data and the ASAXS curves calculated using the complete cDFT model. On the other hand, the experimental ASAXS curves agree with those calculated from the complete cDFT model. The importance of desolvation is also emphasized by the fact that inclusion of such interactions is essential for reproducing the chemical potentials of divalent cations but is not required for weakly hydrated alkali metal ions or CoHex3+ (see Supporting Information). In summary, ion-solvent interactions are important for accurately modeling ion-DNA interactions: desolvation reduces the excess chemical potential of cations and anions, lowering the effective concentration of electrolyte and weakening ion-ligand interactions. Surprisingly, an NLPB model that includes neither ion-solvent interactions nor ion-ion correlations reproduces the experimental ASAXS curves for Sr2+ (Fig. 6), although some differences are obvious in the more detailed radial density functions (Fig. 4). This agreement is serendipitous and is due to cancellation of errors from the lack of ion-correlation, that favors ion accumulation in the grooves, and ion solvation, that limits ion concentration in the grooves.
Unexpectedly, the trivalent CoHexCl3 solution is the simplest ion to model around DNA; CoHex3+ can be reliably described by first-order electrostatics (i.e., direct Coulomb interactions). CoHex3+ ions decorate DNA backbone phosphates and do not penetrate inside B-DNA grooves (Fig. 5). All models explored in this paper show reasonable agreement between the calculated ASAXS profiles and the experimental data (Fig. 7), and is consistent with all-atom MD simulations in explicit solvent (78). For these triply-charged ions, the good agreement between cDFT and NLPB is caused by the dominance of first-order electrostatics in ion-DNA interactions over higher-order ion-ion correlations. Moreover, the large CoHex3+ ionic diameter creates a steric barrier for ion penetration inside the grooves, rendering the 1D cylinder models adequate for calculating the average number of condensed CoHex3+ ions. Finally, because the diameter of CoHex3+ is large, the field at its surface is comparable to Na+ and the effects of ion-solvent interactions are lower than for the smaller divalent Sr2+ ions. It follows from the current study that the models required to describe CoHex3+ around a single B-DNA backbone are relatively simple. However, we expect that ion correlation forces will dominate DNA-DNA interactions between multiple backbones due to the higher local phosphate charge density.
Conclusions
We have studied the details of ionic atmospheres around DNA molecule for 1:1, 2:1 and 3:1 electrolytes using a combination of cDFT and NLPB methods. Our calculations demonstrated that ion-ion correlation interactions induce counterion penetration into the DNA grooves, unless sterically prohibited by large ion radii. In particular, ion binding in the grooves – compared to binding on the backbone – has a profound effect on ion-induced nucleic acid condensation as demonstrated in our previous work (78). Ion-solvent interactions have an opposite effect: when the enthalpy cost of desolvation is high (e.g., for Sr2+ ions), ion-water interactions limit ion penetration into the DNA grooves. Partial compensation of these two opposing effects explains the success of NLPB in reproducing the average number of condensed cations and the shape of the ASAXS curves of the ion-counting experiments. In contrast, cDFT model without ion-desolvation interactions was found to systematically overestimate ion concentration in DNA grooves. Through the comparison of several cDFT models and experimental data, we demonstrated that a minimum model to describe ion-polyelectrolyte interactions should include long-range correlations arising from density and charge density fluctuations in electrolyte solution as well as short-range ion (de)solvation forces. The latter interactions are often ignored in reduced models of electrolyte solutions limiting their applicability to the classes of weakly solvated ions. Ion hydration forces are particularly pronounced in solutions of multiply-charged ions and give significant contribution to ion activity and, therefore, to ion-polyelectrolyte interactions. Our results highlight important aspects of the properties of electrolyte solutions influencing ionic atmosphere around biomolecules that may significantly impact DNA condensation and biomolecules-ligand interactions. One caveat of the current work is its neglect of DNA sequence-specific effects which have been shown to influence ion binding in some cases (81, 82, 83, 84, 85). The goal of our initial research was to understand the general characteristics of DNA-ion interactions that drive the behavior of different ionic species around DNA. In the future, we plan to extend the DNA model to include such sequence-dependent structural variations.
Author contributions
MLS, DGT, and SAP performed the research, analyzed the data, and helped write the manuscript. LP, AVO, and NAB designed the research, analyzed the data, and assisted in writing the manuscript.
Acknowledgments
This work was supported by NIH Grant R01 GM099450. NAB and MLS acknowledge fruitful discussions of hydration effects with Chris Mundy and Greg Schenter. The cDFT calculations were performed using PNNL Institutional Computing resources at Pacific Northwest National Laboratory. PNNL is a multiprogram national laboratory operated for DOE by Battelle under Contract DE-AC05-76RL01830.
SUPPLEMENTARY MATERIAL
An on-line supplement to this article can be found by visiting BJ Online at http://www.biophysj.org.
References
- Rau and Parsegian (1984) Rau, D. C., and V. A. Parsegian, 1984. Attractive Long-Range Hydration Forces Can Cause Macromolecular Assembly - the Condensation of DNA by Cross-Linking Agents. Biophysical Journal 45:A114–A114.
- Rau et al. (1984) Rau, D. C., B. Lee, and V. A. Parsegian, 1984. Measurement of the Repulsive Force between Poly-Electrolyte Molecules in Ionic Solution - Hydration Forces between Parallel DNA Double Helices. Proceedings of the National Academy of Sciences of the United States of America 81:2621–2625.
- Knobler and Gelbart (2009) Knobler, C. M., and W. M. Gelbart, 2009. Physical Chemistry of DNA Viruses. Annual Review of Physical Chemistry 60:367–383.
- Xiang et al. (2009) Xiang, Y., A. J. Tong, and Y. Lu, 2009. Abasic Site-Containing DNAzyme and Aptamer for Label-Free Fluorescent Detection of Pb2+ and Adenosine with High Sensitivity, Selectivity, and Tunable Dynamic Range. Journal of the American Chemical Society 131:15352–15357.
- Draper (2008) Draper, D. E., 2008. RNA Folding: Thermodynamic and Molecular Descriptions of the Roles of Ions. Biophysical Journal 95:5489–5495.
- Draper et al. (2005) Draper, D. E., D. Grilley, and A. M. Soto, 2005. Ions and Rna Folding. Annual Review of Biophysics and Biomolecular Structure 34:221–243.
- Woodson (2005) Woodson, S. A., 2005. Metal ions and RNA folding: a highly charged topic with a dynamic future. Current Opinion in Chemical Biology 9:104–109.
- Misra et al. (1994a) Misra, V. K., J. L. Hecht, K. A. Sharp, R. A. Friedman, and B. Honig, 1994. Salt Effects on Protein-DNA Interactions - the cI Repressor and EcoRI Endonuclease. Journal of Molecular Biology 238:264–280.
- Misra et al. (1994b) Misra, V. K., K. A. Sharp, R. A. Friedman, and B. Honig, 1994. Salt Effects on Ligand-DNA Binding - Minor-Groove Binding Antibiotics. Journal of Molecular Biology 238:245–263.
- Frederiksen and Piccirilli (2009) Frederiksen, J. K., and J. A. Piccirilli, 2009. Identification of catalytic metal ion ligands in ribozymes. Methods 49:148–166.
- Freisinger and Sigel (2007) Freisinger, E., and R. K. O. Sigel, 2007. From nucleotides to ribozymes - A comparison of their metal ion binding properties. Coordination Chemistry Reviews 251:1834–1851.
- Manning (1978) Manning, G. S., 1978. Molecular Theory of Polyelectrolyte Solutions with Applications to Electrostatic Properties of Polynucleotides. Quarterly Reviews of Biophysics 11:179–246.
- Lamm (2003) Lamm, G., 2003. The Poisson-Boltzmann Equation. In K. B. Lipkowitz, R. Larter, and T. R. Cundari, editors, Reviews in Computational Chemistry, John Wiley & Sons, Inc., Hoboken, NJ, USA, volume 19, chapter 4, 147–365.
- Baker (2004) Baker, N. A., 2004. Poisson-Boltzmann Methods for Biomolecular Electrostatics. In Methods in Enzymology, Elsevier, volume 383, 94–118.
- Fixman (1979) Fixman, M., 1979. The Poisson-Boltzmann equation and its application to polyelectrolytes. The Journal of Chemical Physics 70:4995–5005.
- Anderson and Record (1990) Anderson, C., and M. Record, 1990. Ion Distributions Around DNA and other Cylindrical Polyions: Theoretical Descriptions and Physical Implications. Annual Review of Biophysics and Biophysical Chemistry 19:423–463. http://dx.doi.org/10.1146/annurev.bb.19.060190.002231.
- Chu et al. (2007) Chu, V. B., Y. Bai, J. Lipfert, D. Herschlag, and S. Doniach, 2007. Evaluation of ion binding to DNA duplexes using a size-modified Poisson-Boltzmann theory. Biophysical Journal 93:3202–3209.
- Giambasu et al. (2014) Giambasu, G. M., T. Luchko, D. Herschlag, D. M. York, and D. A. Case, 2014. Ion Counting from Explicit-Solvent Simulations and 3D-RISM. Biophysical Journal 106:883–894.
- Pabit et al. (2009a) Pabit, S. A., K. D. Finkelstein, and L. Pollack, 2009. Using Anomalous Small Angle X-Ray Scattering to Probe the Ion Atmosphere around Nucleic Acids. Methods in Enzymology, Vol 469: Biophysical, Chemical, and Functional Probes of Rna Structure, Interactions and Folding, Pt B 469:391–410.
- Bai et al. (2007) Bai, Y., M. Greenfeld, K. J. Travers, V. B. Chu, J. Lipfert, S. Doniach, and D. Herschlag, 2007. Quantitative and comprehensive decomposition of the ion atmosphere around nucleic acids. Journal of the American Chemical Society 129:14981–14988.
- Tang et al. (2007) Tang, C. L., E. Alexov, A. M. Pyle, and B. Honig, 2007. Calculation of pK(a)s in RNA: On the structural origins and functional roles of protonated nucleotides. Journal of Molecular Biology 366:1475–1496.
- Shkel and Record (2012) Shkel, I., and T. Record, 2012. Coulombic free energy and salt ion association per phosphate of all-atom models of DNA oligomer: dependence on oligomer size. Soft Matter 8:9345–9355. http://dx.doi.org/10.1039/c2sm25607j.
- Misra et al. (1998) Misra, V. K., J. L. Hecht, A. S. Yang, and B. Honig, 1998. Electrostatic contributions to the binding free energy of the cI repressor to DNA. Biophysical Journal 75:2262–2273.
- Kornyshev and Leikin (1999) Kornyshev, A. A., and S. Leikin, 1999. Electrostatic zipper motif for DNA aggregation. Physical Review Letters 82:4138–4141.
- Ray and Manning (1994) Ray, J., and G. S. Manning, 1994. An Attractive Force between 2 Rodlike Polyions Mediated by the Sharing of Condensed Counterions. Langmuir 10:2450–2461.
- Manning (2011) Manning, G. S., 2011. Counterion condensation theory of attraction between like charges in the absence of multivalent counterions. European Physical Journal E 34:132.
- Perico and Rapallo (2011) Perico, A., and A. Rapallo, 2011. Clusters in strong polyelectrolyte solutions in the condensation theory approach. Journal of Chemical Physics 134:055108.
- Pietronave et al. (2008) Pietronave, S., L. Arcesi, C. D’Arrigo, and A. Perico, 2008. Attraction between Like-Charged Polyelectrolytes in the Extended Condensation Theory. Journal of Physical Chemistry B 112:15991–15998.
- Long et al. (2006) Long, H., A. Kudlay, and G. C. Schatz, 2006. Molecular dynamics studies of ion distributions for DNA duplexes and DNA clusters: Salt effects and connection to DNA melting. Journal of Physical Chemistry B 110:2918–2926.
- Allahyarov et al. (2003) Allahyarov, E., H. Lowen, and G. Gompper, 2003. Adsorption of monovalent and multivalent cations and anions on DNA molecules. Physical Review E 68:061903.
- Gonzalez-Amezcua et al. (2001) Gonzalez-Amezcua, O., M. Hernandez-Contreras, and P. Pincus, 2001. Electrostatic correlation force of discretely charged membranes. Physical Review E 64:041603.
- Kjellander et al. (1988) Kjellander, R., S. Marcelja, R. M. Pashley, and J. P. Quirk, 1988. Double-Layer Ion Correlation Forces Restrict Calcium Clay Swelling. Journal of Physical Chemistry 92:6489–6492.
- Blum (1975) Blum, L., 1975. Mean Spherical Model for Asymmetric Electrolytes .1. Method of Solution. Molecular Physics 30:1529–1535.
- Henderson et al. (1978) Henderson, D., E. Waisman, J. L. Lebowitz, and L. Blum, 1978. Equation of State of a Hard-Core Fluid with a Yukawa Tail. Molecular Physics 35:241–255.
- Hoye and Blum (1978) Hoye, J. S., and L. Blum, 1978. Mean Spherical Model for Asymmetric Electrolytes - Thermodynamics and Pair Correlation-Function. Molecular Physics 35:299–300.
- Jiang et al. (2001a) Jiang, J. W., L. Blum, and O. Bernard, 2001. Charged hard dumbbell in the binding mean-spherical approximation. Molecular Physics 99:1765–1767.
- Jiang et al. (2001b) Jiang, J. W., L. Blum, O. Bernard, and J. M. Prausnitz, 2001. Thermodynamic properties and phase equilibria of charged hard sphere chain model for polyelectrolyte solutions. Molecular Physics 99:1121–1128.
- Guldbrand et al. (1986) Guldbrand, L., L. G. Nilsson, and L. Nordenskiold, 1986. A Monte-Carlo Simulation Study of Electrostatic Forces between Hexagonally Packed DNA Double Helices. Journal of Chemical Physics 85:6686–6698.
- Rouzina and Bloomfield (1996a) Rouzina, I. F., and V. A. Bloomfield, 1996. Macroion attraction by correlated counterion fluctuations: Application to condensation of DNA. Biophysical Journal 70:Mp418–Mp418.
- Rouzina and Bloomfield (1996b) Rouzina, I., and V. A. Bloomfield, 1996. Macroion attraction due to electrostatic correlation between screening counterions .1. Mobile surface-adsorbed ions and diffuse ion cloud. Journal of Physical Chemistry 100:9977–9989.
- Arenzon et al. (1999) Arenzon, J. J., J. F. Stilck, and Y. Levin, 1999. Simple model for attraction between like-charged polyions. European Physical Journal B 12:79–82.
- Levin et al. (1999) Levin, Y., J. J. Arenzon, and J. F. Stilck, 1999. The nature of attraction between like-charged rods. Physical Review Letters 83:2680–2680.
- Shklovskii (1999a) Shklovskii, B. I., 1999. Screening of a macroion by multivalent ions: Correlation-induced inversion of charge. Physical Review E 60:5802–5811.
- Shklovskii (1999b) Shklovskii, B. I., 1999. Wigner crystal model of counterion induced bundle formation of rodlike polyelectrolytes. Physical Review Letters 82:3268–3271.
- Netz (2001) Netz, R. R., 2001. Electrostatistics of counter-ions at and between planar charged walls: From Poisson-Boltzmann to the strong-coupling theory. European Physical Journal E 5:557–574.
- Naji et al. (2004) Naji, A., A. Arnold, C. Holm, and R. R. Netz, 2004. Attraction and unbinding of like-charged rods. Europhysics Letters 67:130–136.
- Danilowicz et al. (2009) Danilowicz, C., C. H. Lee, K. Kim, K. Hatch, V. W. Coljee, N. Kleckner, and M. Prentiss, 2009. Single molecule detection of direct, homologous, DNA/DNA pairing. Proceedings of the National Academy of Sciences of the United States of America 106:19824–19829.
- Lin et al. (1978) Lin, S. C., W. I. Lee, and J. M. Schurr, 1978. Brownian-Motion of Highly Charged Poly(L-Lysine) - Effects of Salt and Polyion Concentration. Biopolymers 17:1041–1064.
- Drifford and Dalbiez (1985) Drifford, M., and J. P. Dalbiez, 1985. Effect of Salt on Sodium Polystyrene Sulfonate Measured by Light-Scattering. Biopolymers 24:1501–1514.
- Zero and Ware (1984) Zero, K., and B. R. Ware, 1984. Mobilities of Poly-L-Lysine Molecules in Low-Salt Solutions. Journal of Chemical Physics 80:1610–1616.
- Matsuoka et al. (1991) Matsuoka, H., D. Schwahn, and N. Ise, 1991. Observation of Cluster Formation in Polyelectrolyte Solutions by Small-Angle Neutron-Scattering .1. A Steep Upturn of the Scattering Curves from Solutions of Sodium Poly(Styrenesulfonate) at Scattering Vectors Below 0.01(a)-1. Macromolecules 24:4227–4228.
- Sedlak (1993) Sedlak, M., 1993. Domain-Structure of Polyelectrolyte Solutions - Is It Real. Macromolecules 26:1158–1162.
- Sedlak (1994) Sedlak, M., 1994. On the Possible Role of Nonelectrostatic Interactions in the Mechanism of the Slow Polyelectrolyte Mode Observed by Dynamic Light-Scattering. Journal of Chemical Physics 101:10140–10144.
- Sedlak (1996) Sedlak, M., 1996. The ionic strength dependence of the structure and dynamics of polyelectrolyte solutions as seen by light scattering: The slow mode dilemma. Journal of Chemical Physics 105:10123–10133.
- Sedlak (1997) Sedlak, M., 1997. Dynamic light scattering from binary mixtures of polyelectrolytes. II. Appearance of the medium polyelectrolyte mode upon mixing and comparison with experiments on binary mixtures of neutral polymers. Journal of Chemical Physics 107:10805–10815.
- Sedlak and Amis (1992a) Sedlak, M., and E. J. Amis, 1992. Concentration and Molecular-Weight Regime Diagram of Salt-Free Polyelectrolyte Solutions as Studied by Light-Scattering. Journal of Chemical Physics 96:826–834.
- Sedlak and Amis (1992b) Sedlak, M., and E. J. Amis, 1992. Dynamics of Moderately Concentrated Salt-Free Polyelectrolyte Solutions - Molecular-Weight Dependence. Journal of Chemical Physics 96:817–825.
- Bockstaller et al. (2001) Bockstaller, M., W. Kohler, G. Wegner, D. Vlassopoulos, and G. Fytas, 2001. Levels of structure formation in aqueous solutions of anisotropic association colloids consisting of rodlike polyelectrolytes. Macromolecules 34:6359–6366.
- Pabit et al. (2010) Pabit, S. A., S. P. Meisburger, L. Li, J. M. Blose, C. D. Jones, and L. Pollack, 2010. Counting Ions around DNA with Anomalous Small-Angle X-ray Scattering. Journal of the American Chemical Society 132:16334–16336.
- Andresen et al. (2008) Andresen, K., X. Y. Qiu, S. A. Pabit, J. S. Lamb, H. Y. Park, L. W. Kwok, and L. Pollack, 2008. Mono- and trivalent ions around DNA: A small-angle scattering study of competition and interactions. Biophysical Journal 95:287–295.
- Pabit et al. (2009b) Pabit, S. A., X. Y. Qiu, J. S. Lamb, L. Li, S. P. Meisburger, and L. Pollack, 2009. Both helix topology and counterion distribution contribute to the more effective charge screening in dsRNA compared with dsDNA. Nucleic Acids Research 37:3887–3896.
- Allahyarov et al. (2005) Allahyarov, E., G. Gompper, and H. Löwen, 2005. DNA condensation and redissolution: interaction between overcharged DNA molecules. Journal of Physics: Condensed Matter 17:S1827. http://dx.doi.org/10.1088/0953-8984/17/20/012.
- Wu and Li (2007) Wu, J. Z., and Z. D. Li, 2007. Density-functional theory for complex fluids. Annual Review of Physical Chemistry 58:85–112.
- Cao and Wu (2005) Cao, D. P., and J. Z. Wu, 2005. Microstructure of block copolymers near selective surfaces: Theoretical predictions and configurational-bias Monte Carlo simulation. Macromolecules 38:971–978.
- Ovanesyan et al. (2014) Ovanesyan, Z., B. Medasani, M. O. Fenley, G. I. Guerrero-García, M. Olvera de la Cruz, and M. Marucho, 2014. Excluded volume and ion-ion correlation effects on the ionic atmosphere around B-DNA: Theory, simulations, and experiments. The Journal of Chemical Physics 141:225103. http://scitation.aip.org/content/aip/journal/jcp/141/22/10.1063/1.4902407.
- Marcus (1988) Marcus, Y., 1988. Ionic-Radii in Aqueous-Solutions. Chemical Reviews 88:1475–1498.
- Yu and Wu (2002) Yu, Y. X., and J. Z. Wu, 2002. Structures of hard-sphere fluids from a modified fundamental-measure theory. Journal of Chemical Physics 117:10156–10164.
- Meng et al. (2014) Meng, D., B. Zheng, G. Lin, and M. L. Sushko, 2014. Numerical Solution of 3D Poisson-Nernst-Planck Equations Coupled with Classical Density Functional Theory for Modeling Ion and Electron Transport in a Confined Environment. Communications in Computational Physics 16:1298–1322.
- Horinek et al. (2009) Horinek, D., A. Herz, L. Vrbka, F. Sedlmeier, S. I. Mamatkulov, and R. R. Netz, 2009. Specific ion adsorption at the air/water interface: The role of hydrophobic solvation. Chemical Physics Letters 479:173–183.
- Goel et al. (2008) Goel, T., C. N. Patra, S. K. Ghosh, and T. Mukherjee, 2008. Molecular solvent model of cylindrical electric double layers: A systematic study by Monte Carlo simulations and density functional theory. Journal of Chemical Physics 129.
- Goel et al. (2011) Goel, T., C. N. Patra, S. K. Ghosh, and T. Mukheree, 2011. Effect of Ionic Size on the Structure of Cylindrical Electric Double Layers: A Systematic Study by Monte Carlo Simulations and Density Functional Theory. Journal of Physical Chemistry B 115:10903–10910.
- Patra and Yethiraj (1999) Patra, C. N., and A. Yethiraj, 1999. Density functional theory for the distribution of small ions around polyions. Journal of Physical Chemistry B 103:6080–6087.
- Poitevin et al. (2011) Poitevin, F., H. Orland, S. Doniach, P. Koehl, and M. Delarue, 2011. AquaSAXS: a web server for computation and fitting of SAXS profiles with non-uniformally hydrated atomic models. Nucleic Acids Research 39:W184–W189.
- Koehl and Delarue (2010) Koehl, P., and M. Delarue, 2010. AQUASOL: An efficient solver for the dipolar Poisson-Boltzmann-Langevin equation. Journal of Chemical Physics 132:064101.
- Braunlin et al. (1987) Braunlin, W. H., C. F. Anderson, and M. T. Record, 1987. Competitive interactions of Co(NH3)6(3+) and Na+ with helical B-DNA probed by 59Co and 23Na NMR. Biochemistry 26:7724–31. http://www.ncbi.nlm.nih.gov/pubmed/3427101.
- Andresen et al. (2004) Andresen, K., R. Das, H. Y. Park, H. Smith, L. W. Kwok, J. S. Lamb, E. J. Kirkland, D. Herschlag, K. D. Finkelstein, and L. Pollack, 2004. Spatial distribution of competing ions around DNA in solution. Physical Review Letters 93:248103.
- Robbins et al. (2014) Robbins, T. J., J. D. Ziebarth, and Y. Wang, 2014. Comparison of monovalent and divalent ion distributions around a DNA duplex with molecular dynamics simulation and a Poisson-Boltzmann approach. Biopolymers 101:834–848.
- Tolokh et al. (2014) Tolokh, I. S., S. A. Pabit, A. M. Katz, Y. Chen, A. Drozdetski, N. Baker, L. Pollack, and A. V. Onufriev, 2014. Why double-stranded RNA resists condensation. Nucleic Acids Research 42:10823–10831.
- Grochowski and Trylska (2008) Grochowski, P., and J. Trylska, 2008. Continuum molecular electrostatics, salt effects, and counterion bindingâA review of the PoissonâBoltzmann theory and its modifications. Biopolymers 89:93–113.
- Lightstone et al. (2001) Lightstone, F. C., E. Schwegler, R. Q. Hood, F. Gygi, and G. Galli, 2001. A first principles molecular dynamics simulation of the hydrated magnesium ion. Chemical Physics Letters 343:549–555.
- Halle and Denisov (1998) Halle, B., and V. P. Denisov, 1998. Water and monovalent ions in the minor groove of B-DNA oligonucleotides as seen by NMR. Biopolymers 48:210–33. http://www.ncbi.nlm.nih.gov/pubmed/10699841.
- Shui et al. (1998) Shui, X., C. C. Sines, L. McFail-Isom, D. VanDerveer, and L. D. Williams, 1998. Structure of the potassium form of CGCGAATTCGCG: DNA deformation by electrostatic collapse around inorganic cations. Biochemistry 37:16877–87. http://dx.doi.org/10.1021/bi982063o.
- McFail-Isom et al. (1999) McFail-Isom, L., C. C. Sines, and L. D. Williams, 1999. DNA structure: cations in charge? Current opinion in structural biology 9:298–304. http://www.sciencedirect.com/science/article/pii/S0959440X99800402.
- Denisov and Halle (2000) Denisov, V. P., and B. Halle, 2000. Sequence-specific binding of counterions to B-DNA. Proceedings of the National Academy of Sciences 97:629–633. http://www.pnas.org/content/97/2/629.abstract.
- Pasi et al. (2015) Pasi, M., J. H. Maddocks, and R. Lavery, 2015. Analyzing ion distributions around DNA: sequence-dependence of potassium ion distributions from microsecond molecular dynamics. Nucleic Acids Research 43:2412–2423. http://nar.oxfordjournals.org/content/43/4/2412.short?rss=1 http://dx.doi.org/10.1093/nar/gkv080.