Dust cooling in supernova remnants in the Large Magellanic Cloud
Abstract
The infrared-to-X-ray (IRX) flux ratio traces the relative importance of dust cooling to gas cooling in astrophysical plasma such as supernova remnants (SNRs). We derive IRX ratios of SNRs in the LMC using and SNR survey data and compare them with those of Galactic SNRs. IRX ratios of all the SNRs in the sample are found to be moderately greater than unity, indicating that dust grains are a more efficient coolant than gas although gas cooling may not be negligible. The IRX ratios of the LMC SNRs are systematically lower than those of the Galactic SNRs. As both dust cooling and gas cooling pertain to the properties of the interstellar medium, the lower IRX ratios of the LMC SNRs may reflect the characteristics of the LMC, and the lower dust-to-gas ratio (a quater of the Galactic value) is likely to be the most significant factor. The observed IRX ratios are compared with theoretical predictions that yield IRX ratios an order of magnitude larger. This discrepancy may originate from the dearth of dust in the remnants due to either the local variation of the dust abundance in the preshock medium with respect to the canonical abundance or the dust destruction in the postshock medium. The non-equilibrium ionization cooling of hot gas, in particular for young SNRs, may also cause the discrepancy. Finally, we discuss implications for the dominant cooling mechanism of SNRs in low-metallicity galaxies.
Subject headings:
galaxies: individual (LMC) — galaxies: ISM — dust, extinction1. Introduction
A dusty medium is known to be cooled either by an infrared (IR) cooling mechanism via gas–grain collisions referred to as dust cooling or by a cooling mechanism via atomic processes referred to as gas cooling. In hot plasma ( K), the cooling process is expected to be dominated by dust cooling (e.g., Ostriker & Silk, 1973). Since the canonical temperature of the swept-up gas in a supernova remnant (SNR) exceeds K (e.g., Hughes et al., 1998), SNRs provide an ideal laboratory to examine dust cooling in the interstellar medium (ISM).
A measure of the relative strength, the IR-to-X-ray (IRX) flux ratio, is often used as an indicator of the dominant cooling mechanism in dusty plasma (Dwek, 1987; Dwek et al., 1987). Using IR data obtained by the Infrared Astronomical Satellite (), IRX ratios of nine Galactic SNRs and four SNRs in the LMC have been measured by Dwek et al. (1987) and Graham et al. (1987), respectively, and both studies found that IRX ratios of the SNRs are significantly greater than unity, supporting dust grains being the dominant coolant.
As dust and gas cooling pertains to the properties of the ISM such as dust-to-gas ratio (DGR) or metallicity, IRX ratios in different galaxies or in different environments may reveal a distinct tendency. If an SNR or its progenitor has encountered inhomogeneities in the ISM or local variations of dust abundance in the ambient medium, e.g., SNRs interacting with nearby molecular clouds (Dwek et al., 1987), IRX ratios may deviate significantly from the theoretical prediction based on global values. Also, the variation of IRX ratios could be a probe of the ongoing destruction of dust (e.g., Dwek et al., 2008).
The LMC is the nearest gas-rich galaxy to our Galaxy, and its metallicity is a half of the Galactic value (e.g., Pei, 1992). In this context, a comparison of the IRX ratios of the LMC SNRs to those of the Galactic SNRs may confirm environmental effects on the dominant cooling mechanism in the hot plasma. However, no systematic comparison of IRX ratios between SNRs in the two galaxies has been made so far, probably due to the insufficient IR and/or X-ray data on the SNRs.
In the last decade, the Spitzer Space Telescope and the AKARI infrared satellite have enabled large-scale IR surveys to be performed toward the Galaxy as well as the Magellanic Clouds (e.g., Meixner et al., 2006; Onaka et al., 2007). Using these data, statistical studies about the IR emission of SNRs in the Galaxy (e.g., Lee, 2005; Reach et al., 2006; Pinheiro Gonçalves et al., 2011; Jeong et al., 2012) and the LMC (e.g., Seok et al., 2008, 2013) have been carried out. Moreover, the Chandra X-ray Observatory provides superb X-ray data on a large number of SNRs such as the Chandra SNR Catalog111http://hea-www.cfa.harvard.edu/ChandraSNR/. The IR and X-ray surveys on SNRs allow us to carry out a systematic comparison of IRX ratios and to investigate environmental effects on this ratio.
In this paper, we present IRX ratios of LMC SNRs using IR fluxes and compare them with those of Galactic SNRs. Theoretical IRX ratios for the LMC and the Galaxy are calculated according to dust and gas cooling functions taking into account relevant DGRs. The IRX ratios of the LMC SNRs show a subtle deviation from those of the Galactic SNRs, and for some cases, the observed IRX ratios are significantly lower than the theoretical prediction. We discuss the the possible origin of the observed trend and its implications.
2. IRX ratio of a dusty plasma
2.1. Measurement of IRX ratio
We define the observational IRX ratio as
| (1) |
where is the total IR flux and is the X-ray flux in 0.3–2.1 keV. We adopt the 24 and 70 µm fluxes of the LMC SNRs from Seok et al. (2013, hereafter SKO13) and X-ray fluxes from the SNR catalog. Among the 47 SNRs listed in SKO13, 29 SNRs show IR emission at 24 µm, and all but three SNRs are also detected at 70 µm. In addition, X-ray properties (gas temperature and density) of 28 SNRs are listed in SKO13, and 24 out of the 28 SNRs have IR flux measurements. However, note that we include 19 out of the 24 SNRs in this study for the following reasons: IR and X-ray emission of two SNRs (N157B and N158A) are dominated by their pulsar wind nebulae, so dust and gas cooling mechanisms are not applicable. For two other SNRs (DEM L72 and DEM L256), although their X-ray properties are presented in Klimek et al. (2010) their total X-ray fluxes are not given in the paper. Finally, in the case of the SNR in N159, it is inevitable that its IR and X-ray emissions are contaminated by a nearby H II region and LMC X-1.
Among the 19 SNRs, we estimate of 16 of them by fitting their spectral energy distribution (SED) with a single-temperature modified blackbody (Equation (1) in SKO13). Uncertainties of mostly result from the uncertainties of the photometry, which is – of the total flux. In the case of the three SNRs (0509–67.5, 0519–69.0, and SN 1987A) for which 70 µm fluxes are not given in SKO13, their are derived on the basis of the spectrum taken by the Infrared Spectrograph (IRS) on board (Dwek et al., 2010; Williams et al., 2011, see more in Table 2.1).
For all the SNRs but two (DEM L205 and DEM L241), we adopt X-ray fluxes from the SNR catalog (see Table 2.1). Adopting the soft-band (0.3–2.1 keV) fluxes from the catalog, we expect to exclude a hard X-ray component mainly dominated by synchrotron emission. In fact, the soft-band fluxes are nearly the same as the wide-band (0.3–10.0 keV) fluxes except for (young) Crab-like SNRs where synchrotron emission dominates their SEDs (such as N157B and N158A that we likewise exclude above). Although there are three Crab-like SNRs (0453–68.5, SNR in N206, and DEM L241) in our sample, all are mature enough for their SNR shocks to have encountered the ambient medium and to produce thermal emission contributing most of the X-ray emission. For a few (young) SNRs such as N103B or SN 1987A, however, the X-ray spectra indicate multiple components, possibly including a contribution from SN ejecta, which need to be distinguished (see section 4.4). Uncertainties of the X-ray fluxes mostly arise when correcting the interstellar absorption in general, so that the X-ray fluxes of the LMC SNRs should be relatively secure compared with those of the Galactic SNRs. We suppose that the X-ray fluxes are uncertain by a factor of a few, at most (e.g., Seok et al., 2008; Dwek et al., 2010) and assume 30% of the X-ray flux as its uncertainty en bloc.
To compare LMC and Galactic SNRs, we accumulate IR fluxes of Galactic SNRs in the literature. Recently, Pinheiro Gonçalves et al. (2011, hereafter PG11) detected 39 out of 121 SNRs within the MIPSGAL survey at 24 and 70 µm and measured their fluxes. For 13 of these 39 SNRs, the total IR fluxes and IRX ratios are also measured. We consider that the 70 µm fluxes of two SNRs (Kes 79 and G337.2–0.7) are quite uncertain due to their low brightness in the MIPS 70 µm, so they are excluded from our study. Moreover, we notice that most SNRs with the measurement of IRX ratios in PG11 are known to interact with molecular clouds, which do not usually show a spatial resemblance between IR and X-ray (see below). To supplement Galactic SNRs for this study, eight Galactic SNRs including the historical SNRs such as those of Kepler or Tycho, are additionally included. In total, there are 19 Galactic SNRs used in this work. Since PG11 derive IRX ratios using wide-band fluxes (see Table 6 in PG11, ), we newly derive their IRX ratios using the soft-band fluxes for consistency of this paper although the difference is negligible.
Furthermore, as the spatial resemblance between IR and X-ray morphologies (IRX resemblance, hereafter) implies a physical association between dust and hot plasma, it is necessary to scrutinize IRX ratios taking the IRX resemblance into account. We classify all SNRs in our sample into three categories (definite, partial, and lack of resemblance) based on visual inspection of the 24 µm and soft-band images and use the classification for further analysis.
In summary, we estimate IRX ratios of the 19 LMC SNRs and 19 Galactic SNRs as listed in Table 2.1. The total IR and X-ray fluxes, plasma temperatures, and the IRX resemblances are given together. Among the LMC SNRs, Graham et al. (1987) previously measured IRX ratios of N49, N49B, and N63A using the data (, 4, and 12, respectively). While our new measurement for N49 (N49: ) is consistent with the previously derived ratio, the IRX ratios of the other two SNRs (N49B: and N63A: ) differ somewhat from them. This deviation is most likely due to the contribution from the FIR emission (see section 4.4).
| SNR | aaTotal IR flux () of the 19 LMC SNRs and the 19 Galactic SNRs. For all LMC SNRs except three, is derived using the 24 and 70 µm fluxes from (SKO13) in this work. of 0509-67.5 and 0519-69.0 are derived from their dust mass and temperature measured based on their IRS spectra (Williams et al., 2011; Borkowski et al., 2006). Uncertainties of their fluxes incorporate the dust temperature range in Borkowski et al. (2006). For SN 1987A, see below. For the Galactic SNRs, is taken from the references given in parentheses. | bbSoft band (0.3-2.1 keV) X-ray flux from the SNR Catalog. Uncertainties are assumed to be 30% en bloc (see Section 2.1), which are taken into account for estimating the uncertainties of IRXs. For two of the LMC SNRs, XMM-Newton fluxes are adopted; Assuming the distance of 50 kpc, we derive the X-ray flux of DEM L205 based on its X-ray luminosity measured by Maggi et al. (2012). For DEM L241, the X-ray flux of the entire SNR is derived by the summation of the X-ray fluxes for its head and tail structures and a point source inside the SNR (Bamba et al., 2006). For four Galactic SNRs, their X-ray fluxes are not included in the Catalog, or the flux integrated over the limited area is only listed. In these cases, we took the X-ray fluxes from the literature; Cygnus Loop and Puppis A: Dwek et al. (1987), IC 443: Kawasaki et al. (2005), Kes 17: Gelfand et al. (2013) | IRX Ratio | ccGas temperature () in 106 K. For the LMC SNRs, is taken from (SKO13). For the Galactic SNRs, is adopted from the references given in parentheses. | IR-X-ray Resemblance ddSpatial resemblance between IR and X-ray morphologies (D: definite, P: partial, L: lack of resemblance). |
|---|---|---|---|---|---|
| ( erg cm-2 s-1) | ( erg cm-2 s-1) | ( K) | |||
| LMC Sources | |||||
| 0453–68.5 | 1.8 | 3.4 | D | ||
| DEM L71 | 2.6 | 7.5 | D | ||
| N23 | 2.2 | 6.5 | D | ||
| N103B | 5.6 | 11.6 | D | ||
| 0509–67.5 | 0.59 | 23.2 | D | ||
| 0519–69.0 | 3.57 | 17.4 | D | ||
| N132D | 17.0 | 9.5 | D | ||
| N49B | 8.0 | 4.2 | D | ||
| N49 | 7.2 | 5.1 | P | ||
| DEM L205 | 0.048 | 2.9 | L | ||
| SNR in N206 | 0.44 | 4.6 | L | ||
| DEM L238 | 0.072 | 4.1 | L | ||
| SN 1987AeeDue to the youth of SN 1987A, IR and X-ray fluxes evolve with time. We adopt ranges of the measured fluxes and the corresponding IRXs from Dwek et al. (2010) between day 6067 to 7983, and the representative value of the IRX is 2.5. | 0.31–1.55 | 0.12–0.58 | 2.4–3.8 (2.5) | 5.0 | D |
| N63A | 26 | 9.0 | P | ||
| DEM L241 | 0.13 | 4.5 | L | ||
| DEM L249 | 0.046 | 8.7 | L | ||
| DEM L316B | 0.17 | 7.5 | L | ||
| DEM L316A | 0.12 | 16.2 | L | ||
| 0548–70.4 | 0.27 | 7.5 | P | ||
| Galactic Sources | |||||
| Kepler | 131 (1) | 64.4 | 2.0 | 27.6 (8) | D |
| G11.2–0.3 | 1100 (2) | 395 | 2.8 | 6.7 (9) | D |
| G15.9+0.2 | 530 (2) | 95 | 5.6 | 10.4 (10) | D |
| Kes 73 | 990 (2) | 175 | 5.6 | 5.8 (11) | D |
| Kes 75 | 270 (2) | 19.5 | 13 | 8.0 (12) | D |
| 3C 391 | 2000 (2) | 61.7 | 32 | 6.5 (13) | L |
| W44 | 200 (2) | 8.31 | 240 | 5.8 (8) | L |
| 3C 396 | 300 (2) | 18 | 16 | 8.1 (14) | L |
| 3C 397 | 810 (2) | 129 | 6.2 | 2.9 (15) | P |
| W49B | 3000 (2) | 587 | 5.1 | 2.8 (8) | L |
| Cygnus Loop | 7900 (3) | 1400 | 5.6 | 2.7 (8) | D |
| Cas A | 2570 (4) | 1870 | 1.3 | 17.4 (16) | D |
| Tycho | 668 (1) | 176 | 3.9 | 9.9 (8) | D |
| IC 443 | 8100 (3) | 1930 | 4.2 | 2.2 (8) | L |
| Puppis A | 9000 (5) | 3800 | 6.9 | 7.0 (17) | D |
| G292.0+1.8 | 287 (6) | 204 | 1.4 | 7.7 (18) | D |
| Kes 17 | 455 (7) | 5.4 | 84 | 8.8 (19) | L |
| RCW 103 | 2700 (2) | 1700 | 1.6 | 3.5 (20) | D |
| G349.7+0.2 | 1400 (2) | 30.3 | 42 | 8.8 (21) | P |
Note. —
References. — References for and of the Galactic SNRs. (1) Gomez et al. (2012); (2) PG11 and references therein; (3) Dwek et al. (1987); (4) Sibthorpe et al. (2010); (5) Arendt et al. (2010); (6) Lee et al. (2009); (7) Lee et al. (2011); (8) Kawasaki et al. (2005); (9) Roberts et al. (2003); (10) Reynolds et al. (2006); (11) Kumar et al. (2014); (12) Helfand et al. (2003); (13) Chen et al. (2004); (14) Su et al. (2011); (15) Safi-Harb et al. (2005); (16) Hwang & Laming (2012); (17) Hwang et al. (2008); (18) Park et al. (2004); (19) Gelfand et al. (2013); (20) Gotthelf et al. (1997); (21) Lazendic et al. (2005)
2.2. Dust and gas cooling function
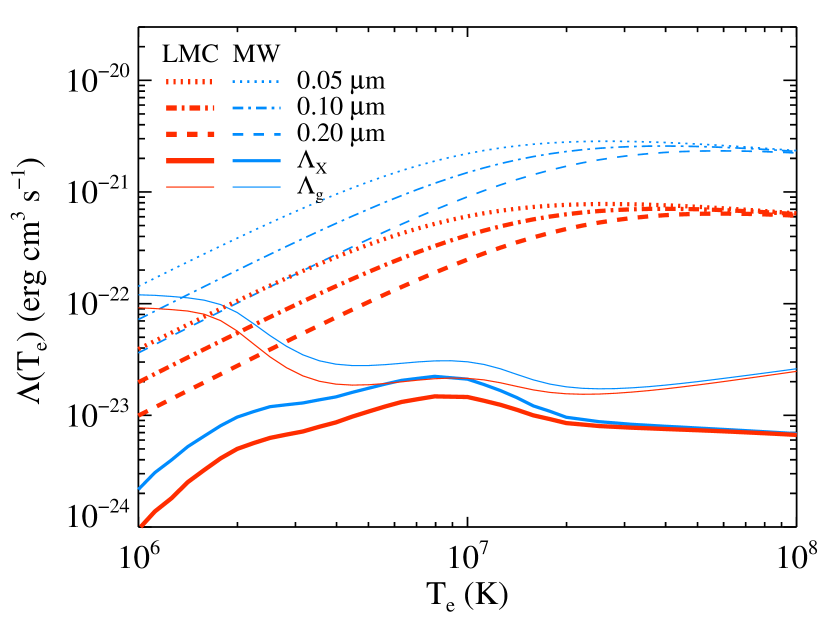
The dust cooling function (, erg cm3 s-1) in thermal equilibrium was computed by Dwek (1987), and we adopt the simple analytic expression of the collisional heating rate from Dwek & Arendt (1992). For a single species of dust grains with a given radius ( in µm), the cooling function is thus written as
| (2) |
where is the mean atomic weight of the gas (), is the DGR, is the gas temperature in units of K, is the material density of the dust grain, and is the heating efficiency. The heating efficiency is the fraction of electron kinetic energy deposited to dust, which is a function of electron energy and grain size (and species). It was extensively calculated by Dwek (1987), and we adopt the approximate formula given by Smith et al. (1996, see their equation 6). We take from Zubko et al. (2004, BARE-GR-S model) for the Galaxy and from Meixner et al. (2013) for the LMC. We consider graphite as a common dust species for the Galaxy and the LMC ( g cm-3, Zubko et al., 2004) although taking a different dust species such as silicate does not alter our results much (see Section 4.1).
Figure 1 shows the dust cooling functions for a single-sized dust populations with radii of 0.05, 0.1, and 0.2 µm (equation 2). for the Galaxy in Figure 1 shows good agreement with from more elaborate calculations by Dwek et al. (2008). In addition, gas cooling functions are shown in the figure for comparison. For the gas cooling, we compute the cooling curve in collisional ionization equilibrium (CIE) by using the CHIANTI code (V7.0; Landi et al., 2012). The elemental abundances of the Galaxy and the LMC are taken from Asplund et al. (2009) and Russell & Dopita (1992), respectively. Note that we calculate not only the total gas cooling but also the soft X-ray (0.3–2.1 keV) cooling curve, , which we adopt for more direct comparison with the X-ray fluxes.
Using the cooling function of a dusty plasma via gas–grain collisions, , and of the gas via atomic processes, , the theoretical ratio of the IR cooling to X-ray cooling, hereafter referred to as the IRXth ratio, is defined as
| (3) |
It is worthwhile to note that there are several caveats in comparing the ratio of theoretical cooling rates to the observed IRX ratios. One would result from the fact that heavy elements are repeatedly included when we calculate the gas and dust cooling rates. Behind the SNR shock wave, dust grains are destroyed and some fraction of heavy elements might be returned to the gas phase. So in SNRs, the DGR would be lower while the metal abundance in the gas phase would be higher than those in the general ISM. We assume the non-depleted LMC (solar) abundance for the gas cooling, considering that the X-ray emitting gas will have an abundance close to it. If some fraction of heavy elements are locked into dust, the gas cooling curve will be lower than those in Figure 1. We will further discuss other caveats in Section 4.3.
3. Results
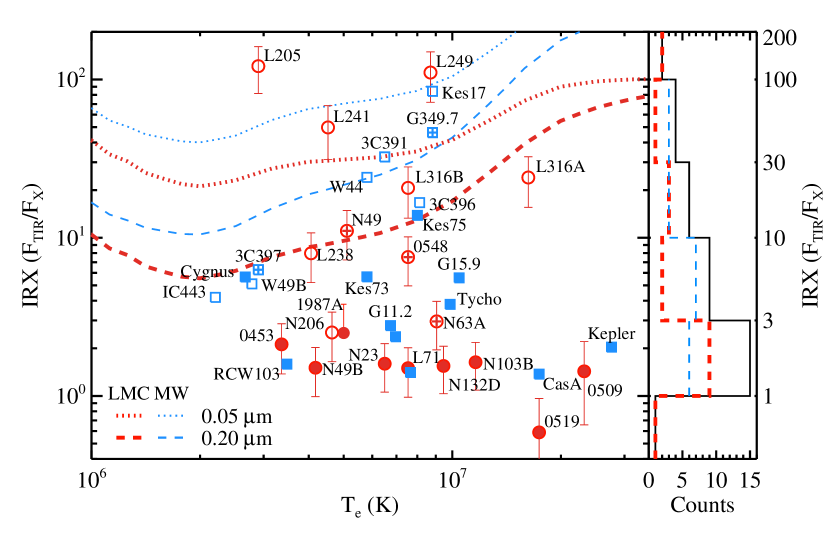
Figure 2 shows the IRX ratios of the 19 LMC SNRs and 19 Galactic SNRs as a function of plasma temperature and the distributions of the IRX ratios. The IRX resemblance is also denoted for each SNR in the figure: definite, partial, and lack of IRX resemblance are shown respectively by solid, open with cross, and open symbols. Based on and in Figure 1, the IRXth ratio for the LMC and the Galaxy is shown in Figure 2.
First of all, the SNRs in both galaxies (except 0519–69.0) show that IRX ratios greater than unity, which supports the idea that dust cooling is the primary cooling mechanism in the dusty plasma. However, it is found that more than half of the LMC SNRs have IRX ratios just between 1 and (see also Table 2.1). Moreover, IRX ratios considerably greater than unity are mostly derived from those without a definite IRX resemblance. This is somewhat surprising in the sense that Dwek et al. (1987) report that most of the Galactic SNRs have IRX ratios much larger than unity. In the case of 19 Galactic SNRs shown here, one third of them have IRX ratios below , seven have ratios between 3 and 10, and the rest of them have ratios even larger than 10.
It is noticeable that the LMC SNRs with a lack of the IRX resemblance appear to have generally higher IRX ratios (median ratio of those with the partial or lack of IRX resemblance: 21) than those with definite IRX resemblance (median: 1.5). A similar trend can be found from the Galactic SNRs, too (median ratio: 3.8 for those with definite IRX resemblance and 24 for the rest). These SNRs with high IRX ratios (or without definite IRX resemblance) are mostly known to interact with molecular clouds (e.g., 3C 391, W44, or IC 443, Jiang et al., 2010) and/or are so-called “mixed-morphology” SNRs with centrally brightened X-ray emission (Rho & Petre, 1998). For SNRs interacting with molecular clouds, the IR emission can be enhanced because radiation may play an important role in heating dust grains compared with collision; this eventually results in high IRX ratios. This will be further explored for the Galactic SNRs in our future paper.
Among the SNRs with definite IRX resemblance, the IRX ratios of the LMC SNRs seem to be systematically lower than those of the Galactic SNRs (recall the median IRX ratios of 1.5 and 3.8, respectively). Such a difference is, in fact, consistent with the trend seen in the theoretical expectation that the IRXth ratio for the LMC is lower by a factor of –3 than that for the Galaxy although we need to be cautious about the direct comparison between the measured IRX and IRXth ratios. The comparison between the observed IRX and IRXth ratios is relevant only to those with definite IRX resemblance because the rest of them might have contributions from radiatively heated dust. We compare only those IRX ratios with the theoretical prediction. As shown in Figure 2, all the LMC SNRs with definite IRX resemblance have much lower IRX ratios than IRXth ratios by up to an order of magnitude. Such a large deviation has been previously reported for a few Galactic SNRs, too (e.g., Dwek et al., 1987), and this could be attributed to the low DGR or dust destruction (see Section 4.3).
4. Discussion
4.1. IRX Ratios of SNRs in the LMC and in the Galaxy
While theoretical calculations predict that dust cooling plays a primary role in the cooling of a dusty plasma, the relative importance of dust cooling () to gas cooling () is expected to depend on environmental properties such as DGR, metallicity, and grain compositions. Our sample shows that the measured IRX ratios of the LMC SNRs are systematically lower than those of the Galactic SNRs, and the theoretical IRX ratios can explain this observed trend to some extent. The IRXth ratio of the LMC is lower than that of the Galaxy (Figure 2), which is due to the low DGR of the LMC. As shown in Figure 1, while at K is reduced by due to the half-metallicity of the LMC (mainly Fe, Mg, and O), of the LMC is four times lower than that of the Galaxy due to the 1/4-DGR of the LMC. The measured DGR of the LMC might have some variation depending on methods or observational data (e.g., Meixner et al., 2010), but nevertheless the lower IRX ratios of the LMC SNRs relative to those of the Galactic SNRs seem to be most significantly attributed to the low DGR of the LMC.
We also examine other possibilities that may systematically influence IRX ratios. Grain properties such as composition or size distribution may be different between the LMC and the Galaxy though we assumed the same properties for both. Pei (1992) examined the extinction curves of the LMC and the Galaxy and suggested that dust in the LMC is composed predominantly of silicate while the abundances of silicate and carbonaceous grains are comparable in the Galaxy. Meixner et al. (2010) also suggested that the standard properties for Galactic dust are not appropriate and that amorphous carbon is required for the LMC instead of graphite. However, the densities of different grain species do not significantly alter the dust cooling function (Equation (2)), which can be a factor of two at most (e.g., –1.87 and 3.5 g cm-3 for amorphous carbon and silicate, respectively; Zubko et al., 2004). In addition, the details of the grain size distribution in the LMC are not well known, but the relative abundance of very small grains to large grains in the LMC is rather similar to the Galactic value (Bernard et al., 2008). This may indicate that there is no significant difference between the LMC and the Galaxy in terms of the grain size distribution. Therefore, the different grain composition and size distribution could be the subsidiary factors to the low IRX ratios of the LMC SNRs.
4.2. IRX ratio and IRX resemblance
The SNRs without definite IRX resemblance are found to have high IRX ratios. This may imply that there is some (or more) contribution to the IR emission originating from radiatively heated dust or atomic/molecular emission lines rather than collisionally heated dust. For the radiatively heated dust, there are two aspects. In the postshock gas, radiative heating might dominate dust heating. Using the data, Andersen et al. (2011) modeled the dust emission of 14 Galactic SNRs and compared the relative importance of collisional heating to radiative heating as a function of grain size (see Figure 5 in their paper). In most cases, it is found that radiative heating is dominant for grains with a size of 4.0–110 nm. This is not surprising given the fact that these SNRs show signs of interaction with molecular clouds, which induces radiative shocks to produce the strong UV radiation from the postshock gas (e.g., Draine & McKee, 1993; Koo, 2014). Another aspect is that dust grains in the preshock gas can be heated by shock radiation (e.g., Lee et al., 2011). If the preshock medium is dense gas such as a large molecular cloud, then a significant fraction of the shock radiation will be absorbed and converted into IR radiation whereas the X-ray emission from shocked gas is only a fraction of shock radiation. This can naturally explain the high IRX, and in this case we do not expect to see any spatial resemblance between IR and X-ray emission.
Additionally, ionic and/or molecular line emission could contribute to . For example, in N49, one of the SNRs that show strong emission lines in the IR spectrum, the emission lines can contribute of the MIPS 24 µm flux, and the [O I] 63 µm line provides of the MIPS 70 µm flux (Otsuka et al., 2010, and references therein). However, since this fraction is not enough to attribute the high IRX solely to the contribution from the line emission, the line emission could be a relatively minor cooling source as concluded by Andersen et al. (2011).
4.3. Comparison to the theoretical IRX
Figure 2 clearly shows that the LMC SNRs with a definite IRX resemblance, have a significant deviation of the IRX ratios from the IRXth ratios. Dwek et al. (1987) found a similar discrepancy from a few Galactic SNRs such as Kepler or SN 1006. Both these SNRs are located far above the Galactic plane and have much lower IRX ratios than the predicted values. This may suggest that the severe dearth of dust in the ambient medium around the SNRs results in the discrepancy. Borkowski et al. (2006) and Williams et al. (2006) calculate dust destruction in four Type Ia and four core-collapse LMC SNRs, respectively, which overlap with our sample. They infer the total dust masses swept up by the blast wave before sputtering, and these masses are generally several times lower than the typical value from the average DGR of the LMC. Interestingly, 0453–68.5 (and 0548–70.4), which has a high DGR of (and ), comparable to the canonical value of the LMC, shows a relatively high IRX ratio whereas the rest of them that have lower DGRs show much lower IRX ratios (and consequently a more significant deviation between IRX and IRXth ratios). This implies that the low IRX ratios may arise from the local fluctuation of DGR in the preshock medium of the SNR.
Another major reason for the low IRX ratios might be because dust grains are destroyed behind the shock front and therefore the DGR decreases with time. Dust grains swept up by SNR shocks are destroyed by thermal and non-thermal sputtering with ions. At gas temperatures above K and shock speeds km s-1, the sputtering rate is approximately constant, and the characteristic lifetimes of carbonaceous (C) and silicate (Mg2SiO4) grains with radius in µm are and years, respectively, where is the density of H nuclei of hot plasma (see Figure 2 in Nozawa et al., 2006; Dwek et al., 2008). Therefore, for old SNRs, we expect theoretical IRX ratios lower than the curves in Figure 2. For young SNRs, there is yet another factor. Since it takes time for the swept-up ions to reach the CIE, the X-ray cooling rate of young SNRs is much higher than that in the CIE model (e.g., Dwek et al., 1987; Smith et al., 1996). Therefore, for both young and old SNRs, we expect them below the equilibrium IRXth ratio in Figure 2. It is anticipated that theoretical IRX curves taking into account the dust destruction and the non-equilibrium ionization cooling effects will provide a better understanding of the observed IRX ratios.
4.4. Uncertainties of IRX ratios
While we carry out the systematic comparison of IRX ratios in the two galaxies, there are some uncertainties in measuring IRX ratios that we can improve if better knowledge of X-ray emission and more comprehensive IR analysis of SNRs are achieved. The X-ray emission in an SNR may consist of different physical components such as thermal emission from swept-up ISM or synchrotron emission. In most cases, the X-ray spectra can be explained by the swept-up ISM with a single-temperature component, which is generally soft ( keV). We have searched available literature to check the X-ray contribution from SN ejecta or multiple components that are unlikely to be associated with the regions where dust cooling occurs. For some SNRs (e.g., N103B, N132D, SN 1987A, and N49), however, their X-ray spectra definitely require multiple components or a contribution from ejecta (e.g., Lewis et al., 2003; Park et al., 2003; Borkowski et al., 2007; Dwek et al., 2008). In such a case, the X-ray flux can be corrected, as Dwek et al. (2008) applied a correction factor to disentangle hard and soft components in the X-ray emission of SN 1987A, but in general it is difficult to separate it out. Thus, due to the contribution from SN ejecta, IRX ratios will be lower than IRXth ratios, in particular for young SNRs. Indeed, as shown in Figure 2, young SNRs with ejecta-dominated X-ray fluxes are all located in the lower part of the diagram (e.g., Lewis et al., 2003, N103B:, Williams et al., 2011, SNR 0509-67.5 and 0519-69.0:, Hwang & Laming, 2012, Cas A:, Reynolds et al., 2006, Kepler:).
While we estimate the total IR fluxes (), fluxes at wavelengths longer than 70 µm are not taken into account. If there is a significant far-IR (FIR) emission from cold dust in the SNR, we might underestimate the total IR flux. For example, Graham et al. (1987) include 100 µm fluxes for their estimation. For the two SNRs (N49B and N63A) showing some differences between the new and previous measurements of IRX ratios (Section 2.1), their fluxes at 100 µm are the strongest among the fluxes in the four bands. However, since both SNRs probably have considerable FIR confusion due to nearby bright sources (e.g., the photoionized western lobe embedded in N63A and a bright clump near the southern limb of N49B, see Figures 4–5 in SKO13, ), their previous IRX ratios might be overestimated.
Recently, the Herschel Space Observatory has provided FIR data with unprecedented high sensitivity and spatial resolution. Otsuka et al. (2010) detect the bright FIR emission from N49 using the images and show that a significant emission originates from the cold dust component. In spite of its superb capabilities, however, only two SNRs, N49 and SN 1987A, have been clearly detected by so far (Otsuka et al., 2010; Matsuura et al., 2011). Note that FIR emission of SN 1987A originates not from the swept-up ISM/CSM but from the newly formed dust (Indebetouw et al., 2014) whereas most LMC SNRs in our sample are rather mature SNRs ( years). Lakićević et al. (2015) present the FIR atlas of the LMC SNRs using the data and report that SNRs are not clearly distinguishable in the FIR bands. Moreover, no evidence for large amounts of newly formed SN-origin dust in SNRs is found, and they argue that cold interstellar dust in SNRs is significantly destroyed due to sputtering by SN shocks. In this context, it is less likely that the FIR emission has a significant influence on IRX ratios in this work although we cannot rule out the subtle contribution.
4.5. Implications for low-metallicity galaxies
The observational trend that IRX ratios of the LMC SNRs are systematically lower than those of the Galactic SNRs implies that dust grains in extreme low-metallicity galaxies may not be a dominant coolant of hot plasma unlike in normal-metallicity galaxies. If the DGR is significantly reduced as the metallicity decreases (e.g., Lisenfeld & Ferrara, 1998; Hirashita, 1999), the dust cooling would be reduced almost proportionally to the DGR. Meanwhile, the gas cooling is modestly affected in hot plasma ( K) in proportion to metallicity. For example, the SMC has a metallicity even lower than the LMC (1/5-1/8 , Russell & Dopita, 1992). There are more than 20 SNRs in the SMC identified by X-ray and/or radio observations (e.g., 23 SNRs listed in Badenes et al., 2010), and the recent XMM-Newton survey of the SMC reveals that 20 SNRs show X-ray emission (Haberl et al., 2012). Surprisingly, however, only two SMC SNRs (1E 0102.2–7219 and B0104–72.3) have been found to have the IR counterparts (e.g., Stanimirović et al., 2005; Koo et al., 2007). The detectability of IR emission in the SMC SNRs is extremely low whereas about 60% of the LMC SNRs show associated IR emission (SKO13). Although no systematic study of the SMC SNRs has been carried out, this might suggest that the dust cooling in the SMC SNRs is less efficient, most probably due to the low DGR of the SMC (, Meixner et al., 2013). Further IR observations toward the SMC SNRs using higher spatial resolution and higher sensitivity such as NIRCam or MIRI onboard James Webb Space Telescope will help in understanding the cooling mechanisms of the SMC SNRs or of hot plasma in the low-metallicity environment in general.
References
- Andersen et al. (2011) Andersen, M., Rho, J., Reach, W. T., Hewitt, J. W., & Bernard, J. P. 2011, ApJ, 742, 7
- Arendt et al. (2010) Arendt, R. G., Dwek, E., Blair, W. P., et al. 2010, ApJ, 725, 585
- Asplund et al. (2009) Asplund, M., Grevesse, N., Sauval, A. J., & Scott, P. 2009, ARA&A, 47, 481
- Badenes et al. (2010) Badenes, C., Maoz, D., & Draine, B. T. 2010, MNRAS, 407, 1301
- Bamba et al. (2006) Bamba, A., Ueno, M., Nakajima, H., Mori, K., & Koyama, K. 2006, A&A, 450, 585
- Bernard et al. (2008) Bernard, J.-P., Reach, W. T., Paradis, D., et al. 2008, AJ, 136, 919
- Borkowski et al. (2007) Borkowski, K. J., Hendrick, S. P., & Reynolds, S. P. 2007, ApJ, 671, L45
- Borkowski et al. (2006) Borkowski, K. J., Williams, B. J., Reynolds, S. P., et al. 2006, ApJ, 642, L141
- Chen et al. (2004) Chen, Y., Su, Y., Slane, P. O., & Wang, Q. D. 2004, ApJ, 616, 885
- Draine & McKee (1993) Draine, B. T., & McKee, C. F. 1993, ARA&A, 31, 373
- Dwek (1987) Dwek, E. 1987, ApJ, 322, 812
- Dwek & Arendt (1992) Dwek, E., & Arendt, R. G. 1992, ARA&A, 30, 11
- Dwek et al. (2010) Dwek, E., Arendt, R. G., Bouchet, P., et al. 2010, ApJ, 722, 425
- Dwek et al. (2008) Dwek, E., Arendt, R. G., Bouchet, P., et al. 2008, ApJ, 676, 1029
- Dwek et al. (1987) Dwek, E., Petre, R., Szymkowiak, A., & Rice, W. L. 1987, ApJ, 320, L27
- Gelfand et al. (2013) Gelfand, J. D., Castro, D., Slane, P. O., et al. 2013, ApJ, 777, 148
- Gomez et al. (2012) Gomez, H. L., Clark, C. J. R., Nozawa, T., et al. 2012, MNRAS, 420, 3557
- Gotthelf et al. (1997) Gotthelf, E. V., Petre, R., & Hwang, U. 1997, ApJ, 487, L175
- Graham et al. (1987) Graham, J. R., Evans, A., Albinson, J. S., et al. 1987, ApJ, 319, 126
- Haberl et al. (2012) Haberl, F., Sturm, R., Ballet, J., et al. 2012, A&A, 545, A128
- Helfand et al. (2003) Helfand, D. J., Collins, B. F., & Gotthelf, E. V. 2003, ApJ, 582, 783
- Hirashita (1999) Hirashita, H. 1999, ApJ, 510, L99
- Hughes et al. (1998) Hughes, J. P., Hayashi, I., & Koyama, K. 1998, ApJ, 505, 732
- Hwang & Laming (2012) Hwang, U., & Laming, J. M. 2012, ApJ, 746, 130
- Hwang et al. (2008) Hwang, U., Petre, R., & Flanagan, K. A. 2008, ApJ, 676, 378
- Indebetouw et al. (2014) Indebetouw, R., Matsuura, M., Dwek, E., et al. 2014, ApJ, 782, L2
- Jeong et al. (2012) Jeong, I.-G., Koo, B.-C., & Lee, H.-G. 2012, PKAS, 27, 235
- Jiang et al. (2010) Jiang, B., Chen, Y., Wang, J., et al. 2010, ApJ, 712, 1147
- Kawasaki et al. (2005) Kawasaki, M., Ozaki, M., Nagase, F., Inoue, H., & Petre, R. 2005, ApJ, 631, 935
- Klimek et al. (2010) Klimek, M. D., Points, S. D., Smith, R. C., Shelton, R. L., & Williams, R. 2010, ApJ, 725, 2281
- Koo (2014) Koo, B.-C. 2014, in IAU Symp., 296, Supernova Environmental Impacts, ed. Z. Knežević & A. Lemaitre (Cambridge: Cambridge Univ. Press), 214
- Koo et al. (2007) Koo, B.-C., Lee, H.-G., Moon, D.-S., et al. 2007, PASJ, 59S, 455
- Kumar et al. (2014) Kumar, H. S., Safi-Harb, S., Slane, P. O., & Gotthelf, E. V. 2014, ApJ, 781, 41
- Lakićević et al. (2015) Lakićević, M., van Loon, J. T., Meixner, M., et al. 2015, ApJ, 799, 50
- Landi et al. (2012) Landi, E., Del Zanna, G., Young, P. R., Dere, K. P., & Mason, H. E. 2012, ApJ, 744, 99
- Lazendic et al. (2005) Lazendic, J. S., Slane, P. O., Hughes, J. P., Chen, Y., & Dame, T. M. 2005, ApJ, 618, 733
- Lee (2005) Lee, H.-G. 2005, JKAS, 38, 385
- Lee et al. (2009) Lee, H.-G., Koo, B.-C., Moon, D.-S., et al. 2009, ApJ, 706, 441
- Lee et al. (2011) Lee, H.-G., Moon, D.-S., Koo, B.-C., et al. 2011, ApJ, 740, 31
- Lewis et al. (2003) Lewis, K. T., Burrows, D. N., Hughes, J. P., et al. 2003, ApJ, 582, 770
- Lisenfeld & Ferrara (1998) Lisenfeld, U., & Ferrara, A. 1998, ApJ, 496, 145
- Maggi et al. (2012) Maggi, P., Haberl, F., Bozzetto, L. M., et al. 2012, A&A, 546, A109
- Matsuura et al. (2011) Matsuura, M., Dwek, E., Meixner, M., et al. 2011, Sci, 333, 1258
- Meixner et al. (2010) Meixner, M., Galliano, F., Hony, S., et al. 2010, A&A, 518, L71
- Meixner et al. (2006) Meixner, M., Gordon, K. D., Indebetouw, R., et al. 2006, AJ, 132, 2268
- Meixner et al. (2013) Meixner, M., Panuzzo, P., Roman-Duval, J., et al. 2013, AJ, 146, 62
- Nozawa et al. (2006) Nozawa, T., Kozasa, T., & Habe, A. 2006, ApJ, 648, 435
- Onaka et al. (2007) Onaka, T., Matsuhara, H., Wada, T., et al. 2007, PASJ, 59S, 401
- Ostriker & Silk (1973) Ostriker, J., & Silk, J. 1973, ApJ, 184, L113
- Otsuka et al. (2010) Otsuka, M., van Loon, J. T., Long, K. S., et al. 2010, A&A, 518, L139
- Park et al. (2003) Park, S., Burrows, D. N., Garmire, G. P., et al. 2003, ApJ, 586, 210
- Park et al. (2004) Park, S., Hughes, J. P., Slane, P. O., et al. 2004, ApJ, 602, L33
- Pei (1992) Pei, Y. C. 1992, ApJ, 395, 130
- Pinheiro Gonçalves et al. (2011) Pinheiro Gonçalves, D., Noriega-Crespo, A., Paladini, R., Martin, P. G., & Carey, S. J. 2011, AJ, 142, 47
- Reach et al. (2006) Reach, W. T., Rho, J., Tappe, A., et al. 2006, AJ, 131, 1479
- Reynolds et al. (2006) Reynolds, S. P., Borkowski, K. J., Hwang, U., et al. 2006, ApJ, 652, L45
- Rho & Petre (1998) Rho, J., & Petre, R. 1998, ApJ, 503, L167
- Roberts et al. (2003) Roberts, M. S. E., Tam, C. R., Kaspi, V. M., et al. 2003, ApJ, 588, 992
- Russell & Dopita (1992) Russell, S. C., & Dopita, M. A. 1992, ApJ, 384, 508
- Safi-Harb et al. (2005) Safi-Harb, S., Dubner, G., Petre, R., Holt, S. S., & Durouchoux, P. 2005, ApJ, 618, 321
- Seok et al. (2013) Seok, J. Y., Koo, B.-C., & Onaka, T. 2013, ApJ, 779, 134
- Seok et al. (2008) Seok, J. Y., Koo, B.-C., Onaka, T., et al. 2008, PASJ, 60S, 453
- Sibthorpe et al. (2010) Sibthorpe, B., Ade, P. A. R., Bock, J. J., et al. 2010, ApJ, 719, 1553
- Smith et al. (1996) Smith, R. K., Krzewina, L. G., Cox, D. P., Edgar, R. J., & Miller, W. W., III 1996, ApJ, 473, 864
- Stanimirović et al. (2005) Stanimirović, S., Bolatto, A. D., Sandstrom, K., et al. 2005, ApJ, 632, L103
- Su et al. (2011) Su, Y., Chen, Y., Yang, J., et al. 2011, ApJ, 727, 43
- Williams et al. (2006) Williams, B. J., Borkowski, K. J., Reynolds, S. P., et al. 2006, ApJ, 652, 33
- Williams et al. (2011) Williams, B. J., Borkowski, K. J., Reynolds, S. P., et al. 2011, ApJ, 729, 65
- Zubko et al. (2004) Zubko, V., Dwek, E., & Arendt, R. G. 2004, ApJS, 152, 211