The list of tantalum lines for wavelengths calibration of the Hamilton echelle-spectrograph
Abstract
We present solution of the problem of wavelength calibration for Hamilton Echelle spectrograph using hollow cathode lamp, which was operated at Lick Observatory Shane telescope before June 9, 2011. The spectrum of the lamp claimed to be thorium-argon, contains, in addition to the lines of thorium and argon, a number of the unrecognized lines identified by us with tantalum. Using atomic data for measured lines of tantalum and thorium, we estimated the temperature of the gas in the lamp as K. From the atomic line database VALD3 we selected all lines of TaI and TaII which can be seen in the spectrum of the lamp and compiled a list for the use in the processing of spectral observations. We note a limitation of the accuracy of calibration due to the influence of the hyperfine line splitting.
keywords:
instrumentation: spectrographs – methods: laboratory: atomic – methods: observational – techniques: spectroscopic1 INTRODUCTION
Hollow cathode lamps are the main source of reference spectral lines for wavelength calibration of the spectra. The lamps themselves are sealed glass flasks filled by an inert gas, containing inside a cylindrical cathode with metal sputtering. Under the action of electric current the gas in the lamp is heated, partially ionized, its atoms become excited and emit photons in the corresponding wavelengths. In addition, the atoms and ions of the gas begin to bombard cathode surface, embossing the metal atoms, which, in turn, also emit photons with characteristic wavelengths. Resulting spectrum of the lamp contains the lines of at least two elements, of the cathode gas and of the cathode element, in two ionization stages. Most often the gas is argon, helium, neon or a combination of them, while the cathode is coated by a thin layer of some metal. The industry produces dozens of lamps with different sputtering of cathodes: by aluminum, iron, gold, calcium, chromium, bismuth, cesium, etc. In the astronomical practice, most common is thorium-argon lamp, thanks to numerous spectral lines, more or less evenly distributed over the visible. Often used are iron-argon lamps, especially for calibration of observations in the blue spectrum.
Wavelength calibration is an integral part of spectral observations. Poor calibration is a source of all kinds of errors in the determination of radial velocities and identification of spectral lines and, hence, it leads to inaccuracy of scientific results. For accurate calibration, it is necessary to know the wavelengths of reference wavelines with an error of at least an order of magnitude lower than the width of the spectrograph instrumental profile , where is wavelength, – spectral resolution. For thorium-argon lamps there exist several lists and atlases which are contained in the well-known systems of observation processing MIDAS and IRAF. There are also more detailed lists of lines, for instance, (Willmarth D. W. et al., 2008; Lovis & Pepe, 2007; Redman et al., 2014).
In March 2011, as part of “A systematic study of NLTE abundance of nearby dwarfs” proposal (PI – Zhao Gang, NAOC, China), the spectra of 6 stars were taken by the Shane 3 m telescope of Lick Observatory (California, USA) using the Hamilton Echelle Spectrograph. We used the CCD e2v CCD203-82 (4k4k, , Dewar #4) and thorium-argon lamp (S&J Box, Westinghouse WL23418, symbol ThAr02) as the source of comparison spectrum. Spectral resolution was . For the processing of observations we applied the package “echelle” of the software system MIDAS. We extracted from the CCD-frame 115 echelle orders in the wavelengths range 3373–10915 Å. Wavelength calibration begins with identification of several relatively bright lines of argon and then the code automatically identifies observed spectral lines using the list of standard lines thar100.tbl. For high-grade calibration, identification of more than a half of all observed lines across the spectrum, as well as at least 5 lines in each echelle order are necessary. However, the program was able to identify only about of the spectral lines. A careful examination of CCD frame revealed the presence of about 20 unidentified bright lines with wavelengths from 4700 to 6500 Å, which are usually not observed in the spectra of thorium-argon lamps. The lines of thorium were, on average, weakened and, at the same time, some lines from the list were even not observed in the lamp spectrum. These two occasions resulted in the failure of wavelength calibration.
Above-described situation forced us to look for the solution of the problem. It was found by identification of the unrecognized lines with these of tantalum, as described in Section 2 of the article. For further calibration it was necessary to compile a list of the lines of tantalum (Section 3). In Section 4 we present an example of calibration using above-mentioned list of lines and discusses its accuracy. The results obtained in this study will be useful for high-quality processing of spectral data obtained by the Hamilton spectrograph using the lamp under scrutiny before June 9, 2011. Furthermore, a similar pattern of the location of bright lines of tantalum is observed for another Lick Observatory lamp (symbol ThAr07, Westinghouse Box, Westinghouse WL32809) that was in operation from February 17, 1995 to June 19, 2011) and which is, highly-likely, a ThTaAr lamp also.
Earlier, we encountered already a similar problem with calibration lamps in Lick observatory (Pakhomov & Zhao, 2013). Therefore, we shall apply a similar method to solve above-mentioned problem too.
2 IDENTIFICATION OF UNKNOWN LINES
Note, in practice, there are no two identical lamps with hollow cathode. Differences in the physical characteristics and conditions, such as the pressure and gas temperature, the voltage, service time, lead to different relative intensities of spectral lines. However, the strongest lines persist and reflect a characteristic pattern in the CCD frame. An example of this are very strong lines of argon in the 7000–8000 Å range. The website of Lick Observatory111http://mtham.ucolick.org/techdocs/techref/ThAr/ provides a possibility to compare the spectra of lamps used in the Hamilton spectrograph. It is easy to see that most of the dozen lamps show almost identical patterns, with exception of ThAr01, ThAr02, and ThAr07 lamps. The first of them was identified by us as a TiAr lamp by Pakhomov & Zhao (2013).
For identification of unknown lines we carried out a preliminary calibration using the lines of argon and thorium. For some echelle orders with a sufficient number of these lines, calibration accuracy better than 0.005 Å was achieved. For other orders containing only few lines of argon and too weak thorium lines, we used a two-dimensional solution of the echelle equation, which provided the accuracy of about 0.03–0.05 Å. Altogether, 1815 lines were found in the spectrum of the calibration lamp. Using the database of the atomic parameters of spectral lines VALD3 (Ryabchikova et al., 2015), for the vicinity of every of these lines, for the distances less than Å (which we call below detection domain), we constructed a sample of all spectral lines belonging, possibly, to more than 70 neutral atoms and ions in the first ionization stage. For each element the total number of possible identifications was found. Next, detection domain was narrowed to Å and the number of identifications of the elements was found again. The idea of the method is that the elements that appear in the detection domain by accident would show a two-fold reduction in the number of identifications with transition of from 0.1 to 0.05 Å, while the number of the elements belonging to the lamp will remain the same or slightly reduce. We deleted from the list the elements with the number of identifications less than 100 (about ), since the elements of cathode usually produce much more spectral lines.
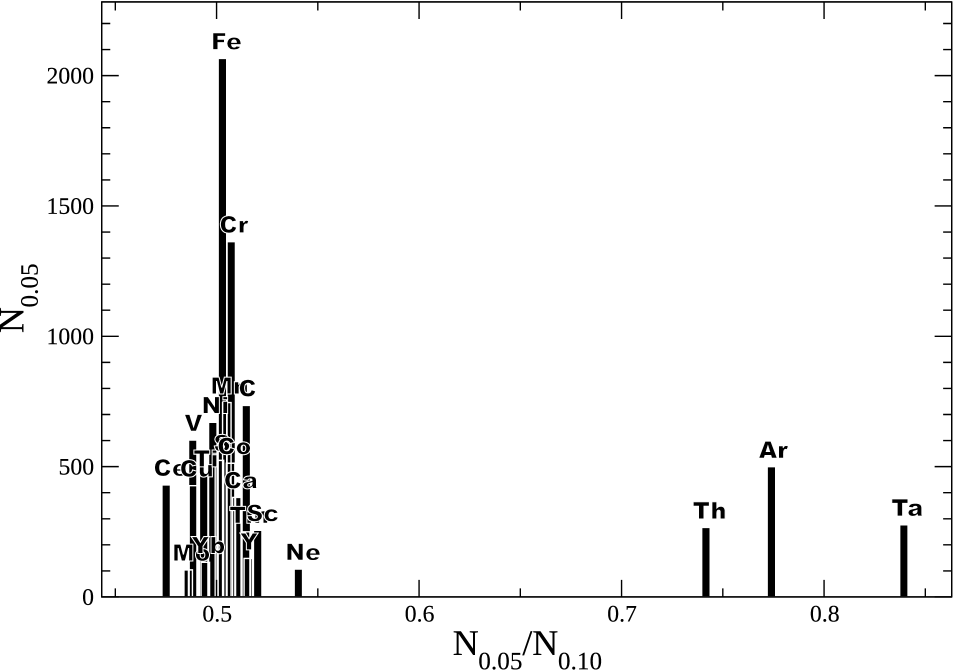
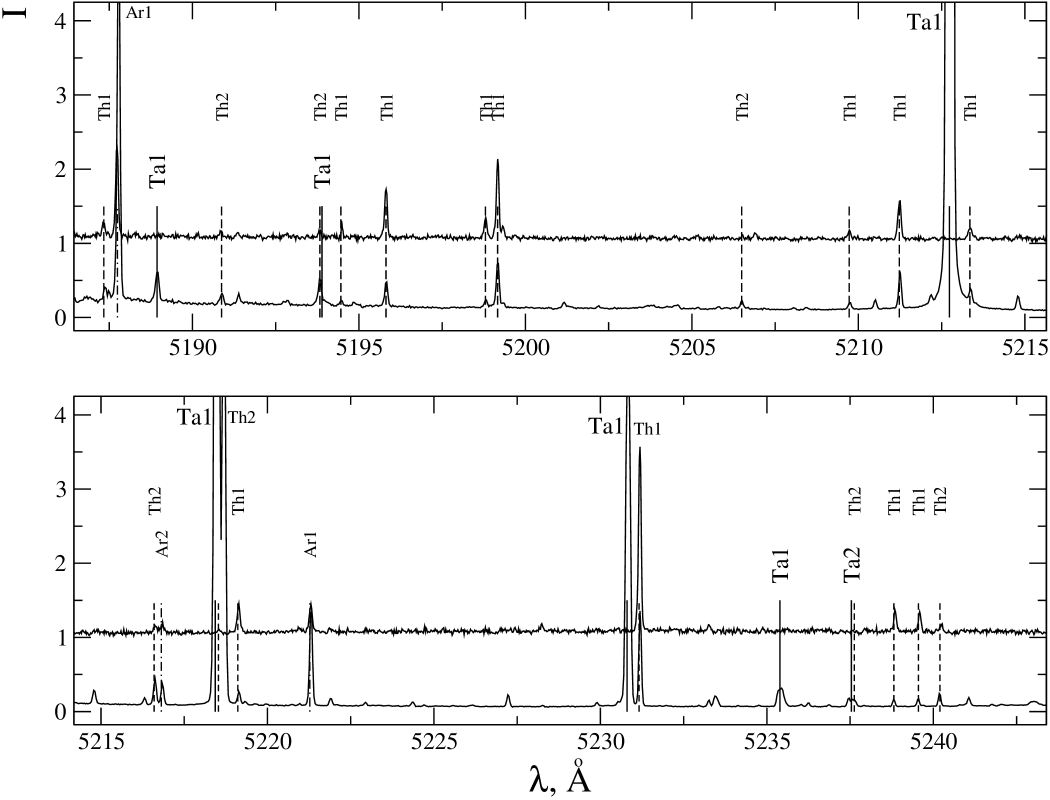
Figure 1 shows the number of identifications for Å and its relative change . It is evident that the overwhelming majority of elements is concentrated around , while three elements (thorium, argon, and tantalum) have significantly different positions and the number of their identifications reduces by .
Figure 2 shows the comparison of the spectrum of 109th echelle-order containing three unknown bright lines with the spectrum of the thorium-argon lamp installed in the spectrograph EMMI (telescope NTT, ESO). Common details in the spectra are the lines of thorium and argon, while three bright lines ( 5212.73, 5218.43, and 5230.80 Å) and a number of relatively weak lines are present only in the spectrum of the tested lamp. Checking of the positions of the spectral lines of tantalum confirmed in full that the cathode elements are tantalum and thorium.
3 COMPILATION OF THE TANTALUM LINES LIST
In the approximation of local thermodynamic equilibrium (LTE) without account of the self-absorption the intensity of a spectral line, produced by spontaneous emission, is described by expression , where is the statistical weight of the upper level, – oscillator strength for given transition, – spectral line wavelength, – the energy of excitation of the upper level, – Boltzmann constant, and – gas temperature. Strictly speaking, in hollow-cathode lamps LTE-conditions are not fulfiled and our computations provide only estimates.
To compile a list of tantalum lines, it is necessary to choose from the database spectral lines with registered intensity exceeding the minimum of intensity of the lines in the lamp spectrum. This requires absolute flux calibration of the spectrum. Furthermore, it is necessary to know the temperature of the gas, which can be estimated from the spectral lines by using the values of their absolute or relative intensity and atomic parameters (, , , ) from the relation
| (1) |
where is a constant that determines the zero point of the scale of the oscillator strengths, – a constant characterizing population levels in the Boltzmann distribution.
3.1 Flux calibration
Flux calibration of the lamp spectrum was performed using the spectrum of the star HD 103095, taken the same night. Because the latter star is not a spectrophotometric standard, the energy distribution was calculated using the synthetic spectrum code SynthV (Tsymbal et al., 2003) and the program for modeling of stellar atmospheres ATLAS9 (Kurucz, 1993). In the calculation of the model atmosphere, the following parameters were adopted: effective temperature K, effective gravity , metallicity , microturbulence velocity 0.9km/s (Sitnova et al., 2015). The star HD 103095 is sufficiently close (parallax ), so the interstellar reddening was not considered. To refuce the fluxes to absolute scale, we applied the magnitudes in the bands , , , , , , , , recalculated using the relations of Bessell et al. (1998). Synthetic spectrum in absolute fluxes with account for radial velocity of the star and orbital velocity of the Earth (in total, km/s) was converted into the MIDAS format to construct the response function of the spectrograph–CCD system that allowed to restore the energy distribution in the spectrum of calibration lamp. The values thus obtained are relative, because it is not known what fraction of the lamp radiation is intercepted by the spectrograph.
3.2 The estimate of gas temperature
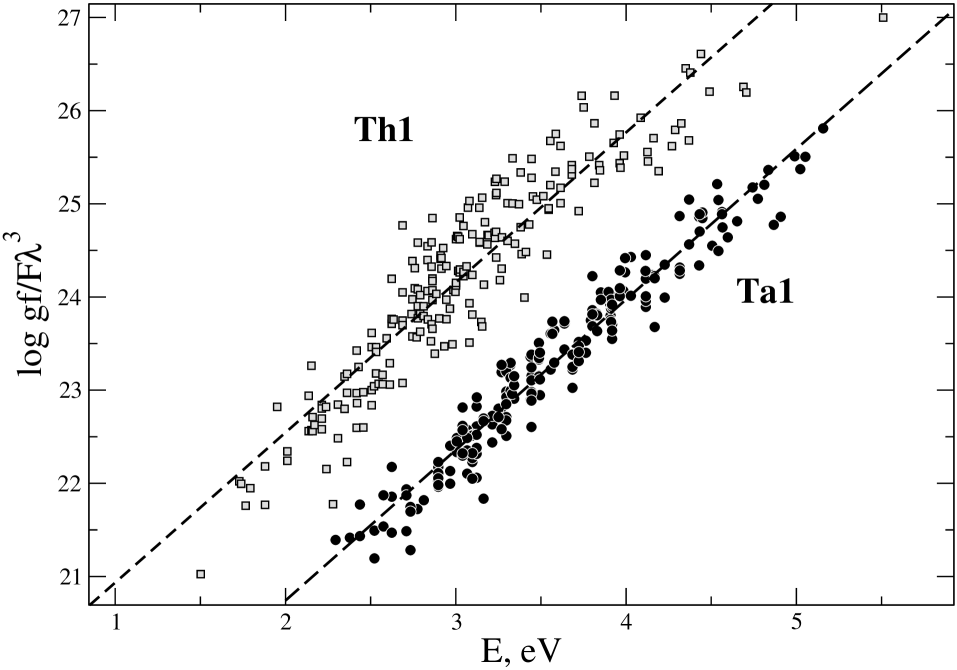
For all found nonblended lines of TaI (201 lines) and ThI (211 lines) we measured intensity and obtained atomic parameters from the database VALD3 (Ryabchikova et al., 2015). We used only spectral lines with saturation threshold not exceeding the threshold of the used CCD. Figure 3 shows dependence of the left side of Eq. 1 on the excitation potential of the upper level . The scatter of points in the vertical direction is, primarily, due to the deviation from LTE and possible errors in accounting of the scattered light of echelle spectrograph. It can be seen that tantalum lines form an explicit dependence (correlation coefficient 0.97), parallel to thorium lines, suggesting similar temperatures, correct identification of unknown lines and the possibility of evaluation of the temperature in the LTE approximation. Solution of Eq. 1 for tantalum – , , for thorium – , . Hence, the obtained values of the gas temperature are, respectively, K and K. The resulting temperature is close to the value of K, found by Pakhomov & Zhao (2013) for the other lamp of the Hamilton spectrograph, as it is expected because the lamps are operated at the same conditions.
3.3 Tantalum line list
We have found that the minimum flux recorded in the spectral line of the lamp under study is erg/cm2. Therefore, to search for all lines of tantalum, which can be seen in the spectrum of the lamp, we selected from the database VALD3 all lines satisfying the condition:
Also, 10 lines of TaII were identified in the spectrum. The analysis of intensities of the lines of the ions of tantalum in LTE approximation made it possible to estimate the concentration ratio:
Altogether, 557 TaI lines and 46 TaII lines in the range 3000–12000 Å were selected from the VALD9 database. As our calculations were performed assuming LTE, to refine the list, each line was tested for the presence in the spectrum and the possibility of its use. In the final list, there remained 262 lines of TaI and 3 lines of TaII between 3387 and 8415 Å. A part of the list of lines is shown in the Table 1; complete list is available in electronic form222ftp://cdsarc.u-strasbg.fr/pub/cats/J/AZh.
| , Å | Ion |
|---|---|
| … | … |
| 4205.885 | Ta I |
| 4228.622 | Ta I |
| 4245.344 | Ta I |
| 4279.052 | Ta I |
| 4294.380 | Ta I |
| 4314.522 | Ta I |
| 4318.813 | Ta I |
| 4360.792 | Ta I |
| 4374.175 | Ta I |
| 4378.810 | Ta I |
| 4381.885 | Ta I |
| 4386.060 | Ta I |
| 4398.444 | Ta I |
| … | … |
4 DISCUSSION
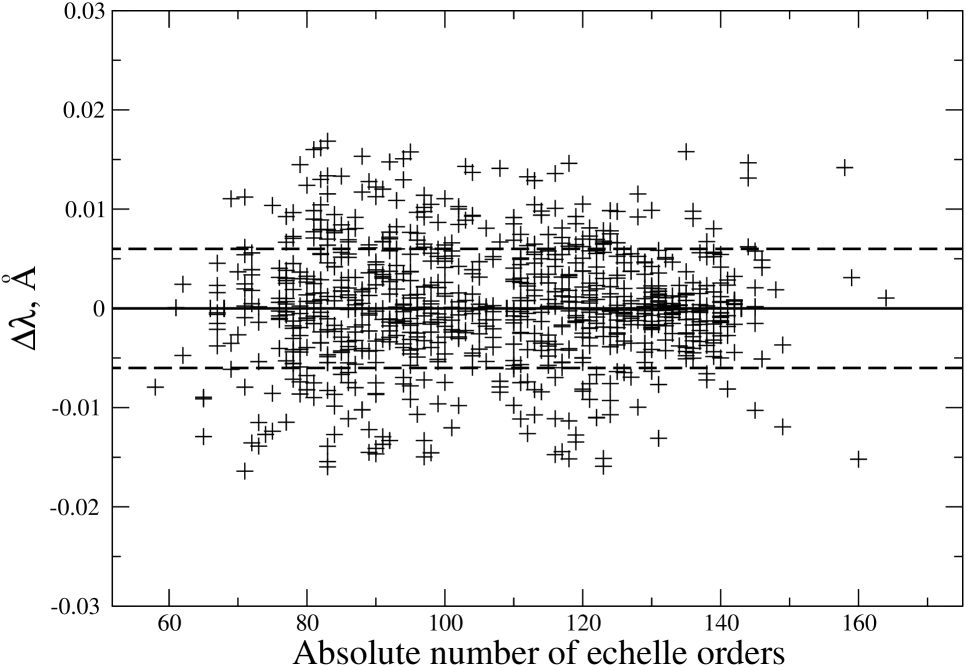
Using the list of tantalum lines together with the list of lines of thorium and argon, we calibrated the echelle spectrograph Hamilton. Figure 4 shows the deviations of the centers of the measured lines from the Table values for different echelle orders. The mean square error of calibration of entire spectrum comprised 0.006 Å, like in the case of titanium-argon lamp (Pakhomov & Zhao, 2013), but for the range 4000–7000 Å the accuracy was higher – up to 0.002–0.003 Å, while now it is 0.005–0.006 Å, wherein some of the lines have deviations exceeding 0.01 Å. This may be due to the fact that the tantalum has an odd number in the periodic table, is subject to the effect of hyperfine splitting of atomic levels. According to the measurements of Messnarz et al. (2003), the splitting of spectral lines of tantalum approaches 0.1–0.3 Å. The uneven distribution of the components leads to the asymmetry of the measured line and to the shift of its center. For this reason, the overall accuracy of the calibration becomes worse. The analysis of the measured lines of tantalum showed that about half of the lines have the width of about Å, that generally corresponds to the spectral resolution. At this, of the lines have the width of more than 0.2 Å. Therefore, if a larger accuracy is needed in the analysis of the spectra, for example, for measuring the radial velocities with the precision better than 0.5 km/s, the use of tantalum lines is impractical. For small number of the lines of thorium and argon in some echelle orders, it is impossible to avoid the use of the lines of tantalum, but one should consider the real accuracy of the calibration wavelengths. For the measurements of the line intensity, determination of abundances of chemical elements and other problems, the accuracy of the calibration using tantalum lines will be sufficient.
5 CONCLUSION
To summarize, in the spectrum of the hollow cathode calibration lamp, installed in the spectrograph Hamilton, the presence of unknown lines was revealed. These lines were identified with tantalum. We determined the temperature of the gas in the lamp, which allowed to select from the database of spectral lines VALD3 spectral lines of tantalum, which can be observed in the spectrum of the lamp. Using compiled list of lines, we performed wavelength calibration with an average accuracy of about 0.006 Å. However, for some lines of tantalum deviations of the measured positions from the line list values are possible, due to the effect of the hyperfine splitting that imposes constraints on the accuracy of calibration for a number of echelle orders.
Acknowledgments
This study was partially supported by the Russian Foundation for Basic Research (project No. 14–02–91153-GFEN_a) and by the Program of Basic Research of the Presidium of Russian Academy of Sciences “Non-stationary phenomena in the objects of Universe”.
References
- Bessell et al. (1998) Bessell M. S., Castelli F., Plez B., 1998, Astron. & Astrophys, 333, 231
- Kurucz (1993) Kurucz R., 1993, ATLAS9 Stellar Atmosphere Programs and 2 km/s grid. Kurucz CD-ROM No. 13. Cambridge, Mass.: Smithsonian Astrophysical Observatory, 1993., 13
- Lovis & Pepe (2007) Lovis C., Pepe F., 2007, Astron. & Astrophys., 468, 1115
- Messnarz et al. (2003) Messnarz D., Jaritz N., Arcimowicz B., Zilio V. O., Engleman Jr. R., Pickering J. C., Jäger H., Guthöhrlein G. H., Windholz L., 2003, Phys. Scr., 68, 170
- Pakhomov & Zhao (2013) Pakhomov Y. V., Zhao G., 2013, Astron. J., 146, 97
- Redman et al. (2014) Redman S. L., Nave G., Sansonetti C. J., 2014, Astrophys. J. Suppl. Ser., 211, 4
- Ryabchikova et al. (2015) Ryabchikova T., Piskunov N., Kurucz R. L., Stempels H. S., Heiter U., Pakhomov Y., Barklem P., 2015, Phys. Scr., 90, 4005
- Sitnova et al. (2015) Sitnova T., Zhao G., Mashonkina L., Chen Y. Q., Liu F., Pakhomov Y., Tan K., Bolte M., Alexeeva S., Grupp F., Shi J.-R., Zhang H.-W., 2015, Astrophys. J., in press
- Tsymbal et al. (2003) Tsymbal V., Lyashko D., Weiss W. W., 2003, in N. Piskunov, W. W. Weiss, & D. F. Gray ed., Modelling of Stellar Atmospheres Vol. 210 of IAU Symposium, Processing Stellar Echelle Spectra. p. 49
- Willmarth D. W. et al. (2008) Willmarth D. W. Cheselka M., Fitzpatrick M., Rippa M., , 2008, Thorium-Argon spectral atlas, http://www.noao.edu/kpno/tharatlas/thar/