X-raying the coronae of HD 155555
Abstract
We present an analysis of the high-resolution Chandra observation of the multiple system, HD 155555 (an RS CVn type binary system, HD 155555 AB, and its spatially resolved low-mass companion HD 155555 C). This is an intriguing system which shows properties of both an active pre-main sequence star and a synchronised (main sequence) binary. We obtain the emission measure distribution, temperature structures, plasma densities, and abundances of this system and compare them with the coronal properties of other young/active stars. HD 155555 AB and HD 155555 C produce copious X-ray emission with log of 30.54 and 29.30, respectively, in the 0.3-6.0 keV energy band. The light curves of individual stars show variability on timescales of few minutes to hours. We analyse the dispersed spectra and reconstruct the emission measure distribution using spectral line analysis. The resulting elemental abundances exhibit inverse first ionisation potential effect in both cases. An analysis of He-like triplets yields a range of coronal electron densities 10 cm-3. Since HD 155555 AB is classified both as an RS CVn and a PMS star, we compare our results with those of other slightly older active main-sequence stars and T Tauri stars, which indicates that the coronal properties of HD 155555 AB closely resemble that of an older RS CVn binary rather than a younger PMS star. Our results also suggests that the properties of HD 155555 C is very similar to those of other active M dwarfs.
Subject headings:
stars: activity, stars: coronae, stars: low-mass, pre-main sequence, stars: individual: HD 155555, techniques:spectroscopic, X-ray:stars1. Introduction
RS Canum Venaticorum (RS CVn) type stellar systems are close binaries containing late type evolved G/K stars (Hall, 1980). Typical orbital periods of these systems range from less than a day to a few months and, with a few exceptions such as And, the rotation periods of the close components are spun up to match their orbital period due to the tidal synchronization forces. As a result of their rapid rotation and deep convective envelopes, RS CVns have powerful magnetic dynamos which generate enormous amounts of magnetic flux which, emerging into their outer layers, produces enhanced stellar activity. For example, RS CVns show optical variability due to the rotational modulation of an asymmetrical distribution of cool spots which can cover 10% of their surfaces. Studies of RS CVns in chromospheric lines such as Ca II H and K and H-alpha and in the ultraviolet and X-ray bands show that an enormous amount of energy (compared to stars like the Sun) is being released into their chromospheres and coronae, in both their typical (sometimes, called quiescent) and flaring states. Their intense X-ray activity was first detected by the HEAO-1 observatory (Walter & Bowyer, 1981) and has been extensively studied since by subsequent missions such as Einstein, EXOSAT, ROSAT, ASCA, Chandra and XMM-Newton. The X-ray luminosities of RS CVn binaries are typically in the range of 30 log 32 (ergs s−1), corresponding to 10-4 to 10-3 of their bolometric luminosities, and log values 33 have been observed in large RS CVn flares (e.g. the Swift-detected flare of SZ Psc discussed by Drake et al. 2015).
Pre-main-sequence and early (zero-age) main-sequence solar- and sub-solar-mass stars have retained much of the angular momentum of their original protostellar predecessors, and thus have rotation rates from less than a day to 10 days, much in excess of the present solar rotation rate. As a result, just like active synchronized binaries with similar rotation rates, young stars have powerful chromospheres and coronae. As they evolve, their rotation rates, and consequently their activity levels, drop due to the loss of angular momentum in stellar winds. The coronae of very young (ages 5 - 10 Myr) stars have been well-studied due to their locations in large nearby stellar associations and clusters, such as Tau-Aur and Orion OB1. Young, late-type pre-main sequence stars are luminous X-ray sources. This is indeed observed in T Tauri stars which are divided into two classes the Classic T Tauri stars (CTTS) and weak-line T Tauri stars (WTTS). The CTTS shows a strong H emission lines and infra-red excess as a result of the accretion, whereas, WTTS display weak H line and no infrared excess. Güdel et al. (2007) surveyed the Taurus molecular cloud and found evidence for lower X-ray luminosities in CTTS compared to WTTS. However, the X-ray emission of a fraction of CTTS, exhibits an additional soft, high-density component that has been attributed to a magnetically confined accretion column, e.g., the 8-Myr old TW Hya (Kastner et al., 2002). It has only been in the last 3 decades that the existence of a population of somewhat older (10 - 300 Myr) stars permeating the solar neighborhood in kinematically homogeneous stellar moving groups has been recognized, e.g., AB Dor (Rucinski, 1982), Speedy Mic (Bromage et al., 1992), etc. A few pre-main sequence stars also show evidence of soft extended X-ray emission close to the star that is thought to arise in accretion-related jet-like outflows, for example, DG Tau (Güdel et al., 2005), Z CMa (Stelzer et al., 2009), RY Tau (Skinner et al., 2011).
There has been some discussion in the literature as to whether the details of coronal and chromospheric activity in cool stars differs due to the underlying origin of their rapid rotation, i.e., spin-up in close binary systems vs. youth, but few definitive conclusions have been reached. A number of flares in active binaries observed in the radio have been observed by VLBI to have an extent similar to the separation between the two components (e.g., Little-Marenin et al. 1986, suggesting that they may be related to inter-binary magnetic reconnection, but X-ray observations lack the milli-arcsecond spatial resolution needed for this type of analysis). There have been some indirect tests: e.g., Singh et al. (1996), compared 59 RS CVn binaries containing 2 late-type components to 29 Algol-type binaries most of which had only one late-type component, and found a tendency for RS CVns to be 3-4 times more X-ray luminous than Algols with the same orbital period, suggesting that there may be additional energy release in their coronae due to interconnecting magnetic field reconnections and/or disconnections. The most significant difference in the coronal properties of active RS CVns like AR Lac or active (pre-main sequence) binary system HD 98000 and active accreting (pre-main sequence) single stars like TW Hya are due to the presence of an accretion-related soft (T 2 - 4 MK) plasma component in CTTS; there can also be additional variability in the X-ray emission of CTTS due to varying absorption by circumstellar material and/or fluctuations in the accretion rate, e.g., Flaccomio et al. (2010).
The intense coronal X-ray activity in the low mass RS CVn type binaries is a key characteristic in investigating the properties and evolution of low mass late-type stellar objects, spurring extensive studies with several X-ray satellites over the last few decades (Audard et al., 2003). The Sun is usually considered a prototype of low mass cool stars, hence we often extrapolate the knowledge we have on the Sun to the other stars. The X-ray emission and the temperature of the coronal plasma of such stars are, however, at least a magnitude higher than the solar coronal emission indicating a fundamental difference in the dynamo powering the coronal activity. Most of the earlier studies, with a few exceptions, have been performed using low spectral resolution instruments, which were not able to provide very reliable information on coronal plasma. The unprecedented spectral resolution provided by X-ray gratings and large effective area of X-ray telescopes like Chandra X-ray observatory and XMM-Newton, allows us to resolve individual lines thus providing plasma diagnostics of coronae of stars other than the Sun. In particular, an updated picture of coronal abundance anomalies based on observations of HR 1099 confirmed its depletion in the abundance of low first ionisation potential (FIP) elements in comparison to the high-FIP elements (Brinkman et al., 2001; Drake & Kashyap, 2001; Güdel et al., 2001). Later, Audard et al. (2002) showed that stars with different activity level show a continuum of behaviour from the FIP effect to the inverse FIP (iFIP) effect.
Spectral diagnostics based on a large number of prominent emission lines can be used to derive the temperatures, density structure of emitting plasma, emission processes and ionisation properties of the coronal X-ray plasma. Furthermore, based on the electron density and coronal temperatures we can infer the pressure and the volume of the emitting plasma. Since stellar coronal structures are spatially unresolved, unlike the solar coronal loops, by combining all the above results one can also derive useful information about the coronal loop properties (Reale et al., 1997; Güdel & Nazé, 2009; Fuhrmeister et al., 2011).
Finally, we can compare the high-resolution X-ray spectroscopic data with that of other low mass stars with different ages which are crucial for understanding how the stellar activity and coronal properties change during these different evolutionary phases (Ball et al., 2005; Robrade & Schmitt, 2005).
Here, we report the first high spectral resolution observations of the HD 155555 system with Chandra HETG with the objective of getting a better insight into the hottest part of the outer stellar atmosphere of the active stars in HD 155555 system. Although stellar activity has been observed and studied for decades, the exact mechanism controlling the magnetic activity in low-mass stars are still not understood. The fundamental parameters must be derived for a range of stars in order to provide the basis for a theoretical understanding. Our goal is to use the X-ray light curves and spectra of an active RS CVn system to address several issues: monitor the flares, determine the emission measure and temperature distribution, determine abundances, probe the density diagnostics and compare to other stars in different evolutionary states. This paper is organised as follows: in § 2 we discuss the properties of HD 155555 system; § 3 presents the details of the X-ray observation and the methods adopted for the data analysis; in § 4 we describe the procedures used to obtain the emission measures, the abundances and the electron densities of HD 155555 AB. In § 5, we analyse the time variability and spectral properties of HD 155555 C. We discuss the implications of the analyses of both HD 155555 AB and the companion HD 155555 C in § 6 and summarise our conclusions in § 7.
2. The HD 155555 system
HD 155555 (V824 Ara), is a young (18 Myr, Strassmeier & Rice 2000) RS CVn binary which also shows some characteristics common to the pre-main sequence stars. It is a triple star system consisting of cool stars: G5IV, a K0IV and an M3V star. Two of the three stars (G and K stars) are in a close binary system with an orbital period of 1.68d (Strassmeier & Rice, 2000) and will together be referred to as HD 155555 AB, henceforth. The M dwarf companion LDS 536 B is 33 away from the primary close-in binary system, and henceforth will be referred to as HD 155555 C. Pasquini et al. (1991) suggested that HD 155555 AB and HD 155555 C are part of a young disk which is in agreement with the high lithium abundance in both the components. Later, based on the Hipparcos satellite the distance to the HD 155555 system has been determined to be 31 pc (Strassmeier & Rice, 2000). The properties of the stars in HD 155555 system are summarised in Table 1.
HD 155555 AB exhibits all the characteristics nominally attributed to the RS CVn class of stars, viz., strong Ca II H and K emission due to chromospheric activity and photometric variability as a result of spot migration (Cutispoto, 1990). Dunstone et al. (2008) have shown that both the components of the HD 155555 system are particularly interesting because it is an unusual RS CVn in which the close-in binaries have become synchronised rotators as they evolved towards the main sequence; most RS CVn systems synchronise much later in their lifetimes as one/both stars evolve away from the main sequence. Thus, without the binarity factor, HD 155555 system would still be active, since they are rapidly rotating cool stars. The binarity of this system has, however, set the orbital period to 1.68d which is shorter than if this were a single star. It is likely that while both age and binarity have worked together to produce activity, in this case, the latter has determined the exact period.
| Parameter | HD 155555A | HD 155555B | HD 155555 C |
|---|---|---|---|
| Vmag | 6.72 | 12.82 | |
| T [K] | 5500100 | 5050150 | 3300150 |
| Spectral type | G5IV | K0IV | M3V |
| P [days] | 1.68 | 1.68 | |
| Inclination i | 52.52.5 | 52.52.5 | 50 |
| Vi [km s-1] | 36.81.0 | 33.71.5 | 3 |
| Ri [R⊙] | 1.550.18 | 1.210.25 | |
| Mi [M⊙] | 1.100.01 | 1.000.01 | |
| log [erg s-1] | 33.89 | 32.26 |
The stars in HD 155555 AB probably exhibit substantial differential rotation which is a key factor in the generation of stellar magnetic fields. A very high level of activity has also been reported from the visual companion HD 155555 C (Martin & Brandner, 1995). The X-ray emission from HD 155555 AB was first reported by HEAO-1 A2 low energy experiment (Walter et al., 1980). It was found to be a relatively strong X-ray source with log 1.01031 erg s-1, yielding a log -2.9 in 0.5-3 keV energy range, making it a very active binary system. It was subsequently observed by several other X-ray satellites and a summary of observed X-ray fluxes and the corresponding luminosities is given in Table 2. The low X-ray flux observed by EXOSAT LE could be due to poor calibration. HD 155555 C was discovered serendipitously during EXOSAT observations of HD 155555 AB (Pasquini et al., 1989). The X-ray luminosity of HD 155555 C was found to be 31029 erg s-1 in 0.04-2.0 keV energy band, yielding a log -2.8, suggesting that HD 155555 C is also a very active young star.
| Instruments | Unabsorbed FX | Ref. | |
|---|---|---|---|
| erg s-1 cm-2 | 1030 erg s-1 | ||
| HEAO-1 A2 | 9.0 | 10.31 | (a) |
| (0.5-3.0 keV) | |||
| EXOSAT | 0.9-1.1 | 1.03-1.26 | (b) |
| (0.04-2.0 keV) | |||
| ROSAT PSPC | 3.8 | 4.35 | (c) |
| (0.1-2.4 keV) | |||
| ROSAT HRI | 3.7-4.6 | 4.23-5.26 | (c) |
| (0.1-2.4 keV) | |||
| XMM-Newton | 5.7 | 6.52 | (d) |
| (0.2-12.0 keV) | |||
| Chandra HETG | |||
| (0.3-6.0 keV) | 2.8-3.6 | 3.20-4.12 | (e) |
| (0.5-5.0 keV) | 2.4-3.0 | 2.74-3.43 | (e) |
References. (a) Walter
et al. (1980); (b) Barstow (1987); (c) Using
XSPEC v13.0 and WebPIMMS v4.7 and assuming a coronal temperature of 10 MK,
we estimated ECFPSPC=7.910-12 erg s-1 cm-2 and
ECFHRI=2.510-11 erg s-1 cm-2; (d) observed during XMM-Newton slew survey
and converted to flux using the flux limit 1.310-11 erg s-1 cm-2; (e) present work.
3. The Chandra data
The HD 155555 system was observed for 94 ks starting on 2002 July 10 11:27 UT, using the HETG (Weisskopf et al., 2002) and Advanced Camera for Imaging Spectroscopy (ACIS, Garmire et al., 2003) on-board Chandra X-ray observatory (ObsID 2538). The data obtained from the public Chandra Data Archives were reprocessed following the Chandra Interactive Analysis of Observations (CIAO ver 4.5)111see http://cxc.harvard.edu/ciao/threads/ science threads, and XSPEC V13.0 (Arnaud, 1996) was used for spectral analysis.
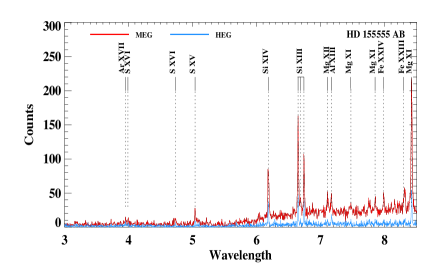
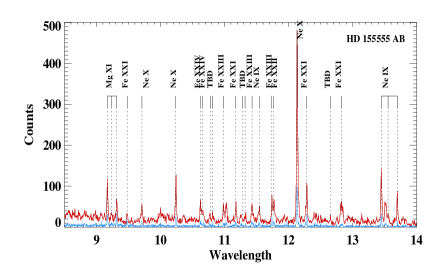
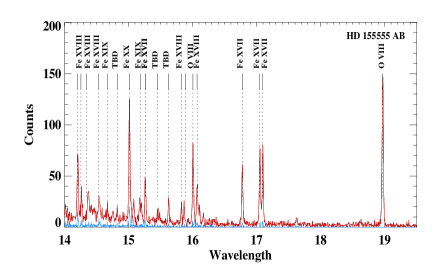
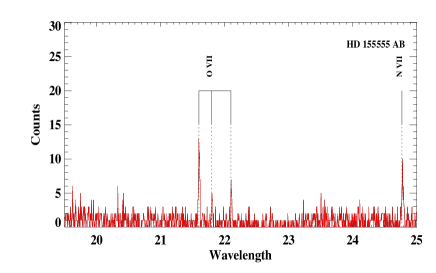
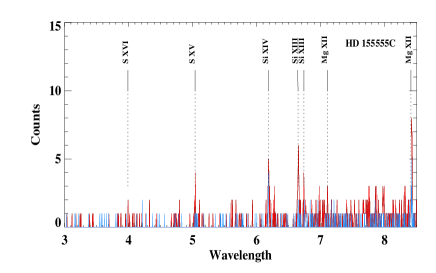
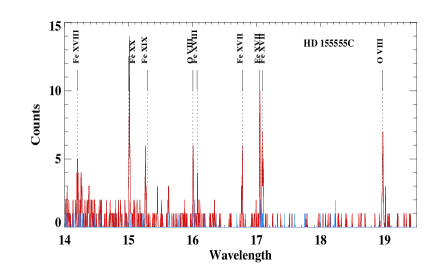
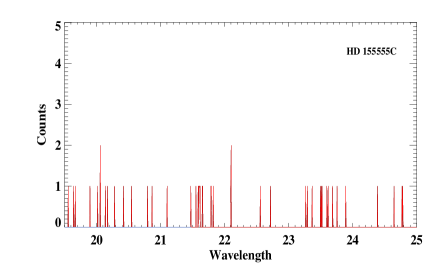
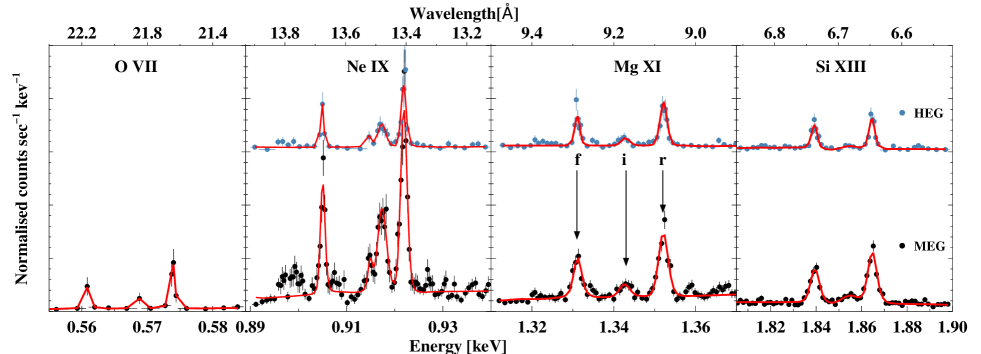
To optimize the signal-to-noise ratio in the spectrum, CIAO includes position-dependent PHA filtering of the data. We used the TGEXTRACT tool available in the CIAO to extract the -1 and +1 grating orders of HEG and MEG, and used the addgratingorders script to sum the orders to improve the counts statistics. We used the default binning of 0.005Å for MEG and 0.0025Å for HEG. The background spectrum was extracted from source-free symmetrical regions near the source region, with each region having an area of the order of few times that of the source area. We computed the net spectrum of HD 155555 AB and HD 155555 C by subtracting the background spectrum. The spectra were then scaled to the area of the source region, to get the source spectrum for both +1 and -1 orders. The positive and negative orders spectra for each of the sources were then combined to get the final spectrum. The co-added negative and positive first order MEG and HEG spectrum of HD 155555 AB and HD 155555 C for the entire observation are shown in Figure 1 and 2. There are numerous well resolved lines with high signal-to-noise ratio present in the spectrum and these have been labelled in the figures.

Furthermore, we re-ran the CIAO data reduction pipeline and extracted the zeroth-order spectrum of both HD 155555 AB and HD 155555 C. The zeroth-order spectrum is a low-resolution spectrum created by the photons that pass through the grating without being diffracted. The net count rate for HD 155555 AB and HD 155555 C zeroth order spectrum is 0.231.5810-3 and 3.9610-26.5410-4 counts s-1, respectively. Based on the observation of HD 155555 system, PIMMS predicts a large pile-up fraction of 20; hence, we chose to use only the dispersed spectrum for our analysis.
4. Analysis and results: HD 155555 AB
4.1. Variability
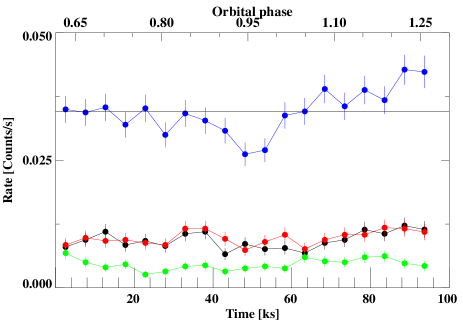
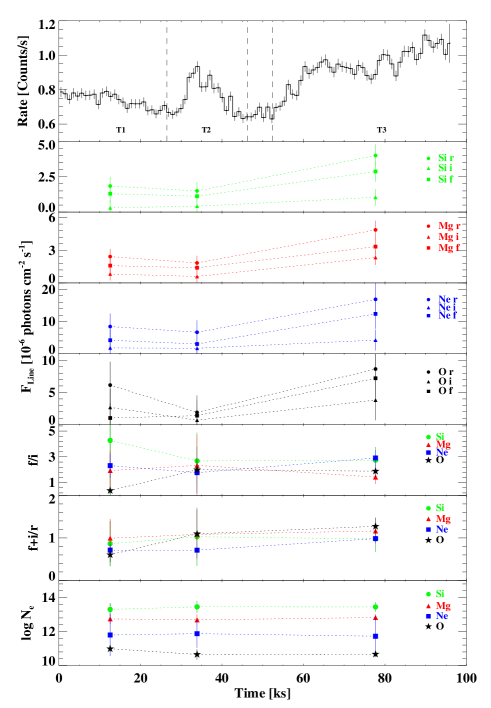
We produced light curves from the event list using the dispersed events for the full 94 ks observing period. In Figure 3 (top panel), we show the X-ray light curve in the 0.4-6 keV energy band. In this figure, we also show the orbital phase corresponding to our observation using the ephemeris by Strassmeier & Rice (2000) . The light curve shows a significant variability and has been divided into three distinct time bins marked as T1, T2 and T3, thus isolating the various features noticed in the light curve. The time bin T1 spans from 0-25 ks which are free of any large variation; the time bin T2 spans between 25-45 ks and shows a typical flare-like feature with a long and sharp rise in the flux and a slow exponential decay; the time bin T3 shows a broad event starting at 45 ks and lasting until the end of the observations.
The smooth rise in X-ray emission (in time bin T3) between T=50 and 60 ks (corresponding to rotation phase 1.0) is followed by a plateau which could be due to the rotation of one of the two stars in HD 155555 AB crossing the visible hemisphere of a coronal active region. If it lasts for 10 ks, and assuming that the active region occurs near the equator and neglecting the inclination and differential rotation, we estimate a size of 25∘ ( 25∘) for the active region. However, Doppler imaging of HD 155555 AB carried out by (Strassmeier & Rice, 2000) reveals inhomogeneities at higher latitudes this would force the active region dimension to be bigger than 25∘, hence this value is essentially a lower limit. Similarly, there may be a rise between 80 and 95 ks, but it is not as clear as the previous rise and it may just be due to small-scale variation occurring at , and 92 ks.

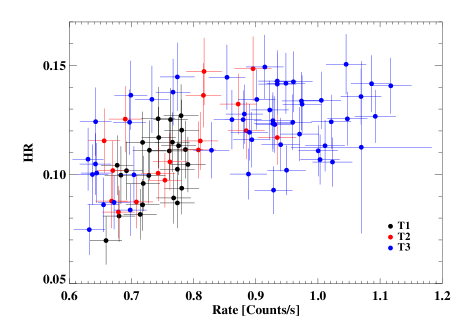
We searched for spectral variations caused by flare heating events (e.g., events seen during the phase T2) by defining a hardness ratio (HR) as the ratio of the number of counts in the hard band (2.0-6.0 keV) to the number of counts in the soft band (0.4-2.0 keV). The hardness ratio variations of HD 155555 AB are shown in the bottom panel of Figure 3. In Figure 4, we plot the HR vs the count rate of the T1 (black filled circles), T2 (red filled circles) and T3 (blue filled circles). We carried out a non-parametric correlation test on the HR and count rates for each of the time bins. The rank correlation co-efficient with two-sided significance values are given in Table 3. The small p-value indicates a correlation with 2.5-3 probability between the HR and the count rate for the time bin T2 with a flare. The correlation observed in the other time bins is of lower significance. We have carried out parametric regression analysis and obtained the slopes for each of the time bins and shown in (column 4, Table 3).
| Time bin | Spearman’s correlation | Linear regression | |
|---|---|---|---|
| p-value | slope | ||
| T1 | 0.44 | 0.025 | 0.190.07 |
| T2 | 0.66 | 0.004 | 0.140.04 |
| T3 | 0.35 | 0.010 | 0.050.02 |
We have also examined the prominent line features in the spectra for variability. We find that the Ne X line feature at 12.13 Å shows evidence of variability. Its light curve is shown in Figure 5. We tested other strong lines like Mg XI at 8.41Å, Fe XVII at 15.01 Å, and O VIII at 18.97 Å but they show very marginal variation or no significant variation. The detection of a dip in Ne X seen close to 1.0 and coinciding with the dip in the total intensity in Fig. 3 could indicate that moderately cool gas gives rise to this feature. The rise in the Ne X flux towards the end of the observation probably indicates the presence of a large active region on the surface of the star moving into the line of sight.
4.2. Spectroscopic behaviour
We divided the source spectra into three time-intervals as mentioned above and carried out a detailed spectral analysis for each of these intervals to investigate the temperature, the emission measure, the abundance and the density variation of the coronal plasma in HD 155555 AB. The analysis was carried out by global fitting using XSPEC as well as line by analysis of prominent lines using PINTofALE.
4.2.1 XSPEC fitting
We have characterised the thermal structure and the elemental abundance composition of the coronae of HD 155555 AB using the simultaneous global fitting to the HEG and MEG spectra. The temperatures and abundances relative to the solar values (Grevesse & Sauval, 1998) were determined by simultaneous iterative XSPEC fit to the HEG and MEG spectra with Variable Astrophysical Emission Code (VAPEC) for thermal optically thin plasma models (Smith et al., 2001). We determined the number of VAPEC components with different temperatures by adding a new component until the addition of the next component did not improve the fit. Assuming that the corona of a star is not isothermal and has multi-temperature components, we used two-temperature VAPEC models. This produced a 611 (DOF711), 412 (DOF591), and 1419 (DOF1320) for time bins T1, T2 and T3, respectively, showing that 2T VAPEC models are a good fit to the data. We then added a new temperature component which reduced the minimum further to 520 (DOF709), 368 (DOF589), and 1245 (DOF1318) for time bins T1, T2 and T3, respectively. The F-test produces a p-value of 0.017, 0.0913 and 0.0096 for time bins T1, T2 and T3, respectively. These p-values could under-state the evidence for the extra component by factors of 2 (Protassov et al., 2002), so we use a 3T model. Adding a 4th temperature component yields an F-test p-values 0.48, 0.47 and 0.50 for time bins T1, T2 and T3, respectively, which are unambiguously large. Hence, we use the 3T VAPEC models to describe of the dispersed spectra of HD 155555 AB. We allowed the abundance of all the elements to vary freely for each of the time bins. However, we fixed them to the same abundance values for each of the temperature components in the 3T VAPEC. For example, in the case of time bin T1 we allowed the O, Ne, Mg, Al, Si, S, Ar, Fe and Ni abundances vary freely while tying all the temperature components to the same abundance value for a given element. We, thus obtain a unique solution for the abundances for each time bin separately and also the temperatures, and emission measures.The best-fit temperatures and the emission measures for time intervals T1, T2 and T3 are presented in Table 4, whereas the best-fit abundance values are listed in Table 5. The unabsorbed X-ray flux of HD 155555 AB in 0.3-6.0 keV energy band is in the range erg s-1 cm-2, implying LX=3.20-4.121030 erg s-1.
| Parameters | T1 | T2 | T3 |
|---|---|---|---|
| log t1 [K] | 6.720.03 | 6.740.07 | 6.640.05 |
| EM1 [cm-3] | 52.92 | 52.94 | 52.93 |
| log t2 [K] | 7.030.05 | 7.010.07 | 6.940.02 |
| EM2 [cm-3] | 53.10 | 53.06 | 53.10 |
| log t3 [K] | 7.340.10 | 7.260.07 | 7.230.01 |
| EM3 [cm-3] | 52.93 | 53.04 | 52.28 |
| red. | 0.73 | 0.62 | 0.94 |
| DOF | 709 | 589 | 1316 |
| log [erg s-1] | 30.51 | 30.52 | 30.61 |
| log | -3.37 | -3.36 | -3.27 |
Note: the errors are estimated with 90% confidence limit.
4.2.2 Line based analysis
We identified the individual line features on the basis of CHIANTI version 4.02 (Dere et al. 2001) database. The identified lines and their corresponding fluxes are listed in Appendix. In Figure 1, both the MEG and HEG spectra are shown. The lines in the MEG spectra are much brighter than in the HEG spectra. Therefore, we consider only the lines seen in the MEG for further analysis.
We derive the differential emission measure (DEM) from the measured line fluxes using Markov Chain Monte Carlo (MCMC) analysis method of Kashyap & Drake (1998) as implemented in the PINTofALE222see http://hea-www.harvard.edu/PINTofALE/ software package. The DEM gives the amount of plasma as a function of temperature. The MCMC analysis gives an estimate of emission measure distribution over a pre-selected range of temperatures with a DEM estimate for each of the temperature bins. We used a temperature grid with log T=0.05 with a range of 6.2log T[K]7.4. All strong emission lines which are reasonably isolated (minimum separation ) were used for the DEM reconstruction. We derived the abundance relative to the iron for all the elements for which at least one line has been identified and included in the selection. The elemental abundances were obtained along with reconstructed DEM distribution. For this, we used only the iron lines from our selection to obtain the initial DEM distribution and abundance of Fe. We then added the lines of other elements one by one gradually extending to the temperature range where the DEM is constrained. At each iteration, we obtained a new DEM distribution and the abundance relative the Fe abundance. Once the DEM distribution has been calculated the Fe abundance is determined by comparing the observed continuum with the predicted continuum based on different metallicity values (see Argiroffi et al. 2003).
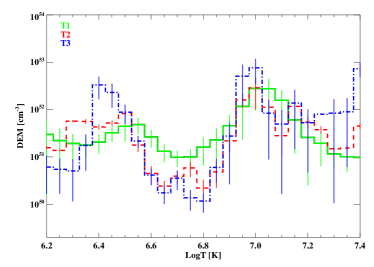
In Figure 6, we show the reconstructed DEM for HD 155555 AB. The general shape of DEM distribution derived for HD 155555 AB for three time-intervals consistently shows a multi-temperature plasma with a dominant peak at log T[K]6.9-7.0, very well constrained by line fluxes. This peak is consistent with the one of the temperature components predicted by XSPEC model. The peak at the low temperature between log T[K]6.35-6.55 is much more prominent during time interval T3 when compared to the other time intervals. During time interval T2 and T3, we notice a higher temperature component (log T[K]7.35) which implies that the enhanced activity level during time interval T2 and T3 is adding a discrete source of emission at the higher and lower end of the temperature range.
| T1 | T2 | T3 | ||||
|---|---|---|---|---|---|---|
| Elements | XSPEC | Line-based | XSPEC | Line-based | XSPEC | Line-based |
| N | 0.50 | 0.490.11 | 0.60 | 0.480.23 | 0.74 | 0.510.21 |
| O | 0.54 | 0.250.21 | 0.55 | 0.290.23 | 0.50 | 0.250.18 |
| Ne | 0.86 | 0.510.21 | 0.78 | 0.490.20 | 0.79 | 0.520.20 |
| Mg | 0.37 | 0.130.11 | 0.30 | 0.120.10 | 0.27 | 0.120.09 |
| Al | 0.32 | 0.100.06 | 0.34 | 0.100.05 | 0.31 | 0.120.05 |
| Si | 0.28 | 0.170.07 | 0.25 | 0.190.02 | 0.25 | 0.200.06 |
| S | 0.24 | 0.110.08 | 0.33 | 0.140.07 | 0.26 | 0.110.07 |
| Ar | 1.33 | 0.470.25 | 1.29 | 0.480.20 | 1.16 | 0.500.32 |
| Fe | 0.27 | 0.210.11 | 0.24 | 0.200.10 | 0.25 | 0.210.11 |
| Ni | 0.28 | 0.130.11 | 0.13 | 0.140.11 | 0.14 | 0.150.10 |
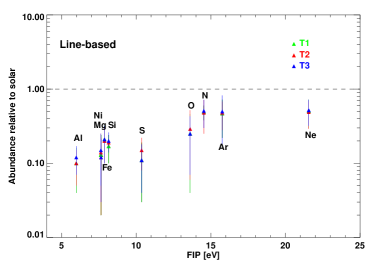
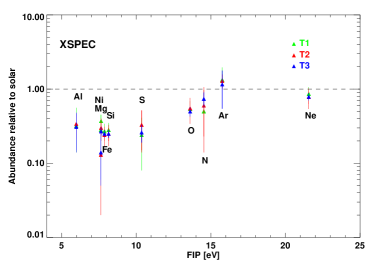
In Figure 7, the coronal elemental abundances of HD 155555 AB obtained for all the three time-intervals are plotted as a function of the first ionisation potential of the elements. In Table 5, we list the coronal elemental abundances relative to the solar photospheric abundances derived by both the line based method and XSPEC fitting methods. The line-based and the XSPEC fitting to the MEG spectra give nearly consistent values for the elemental abundance except for Ar, despite the difference in the temperature distribution derived using the two methods. This could be because in the line-based analysis we reject lines that are blended and problematic whereas the XSPEC fitting assumes that the model can explain each and every individual line in the observed spectrum. Furthermore, we use 3T XSPEC model to characterise the corona which is a criterion we use to define a multi-temperature structure of the corona; whereas the DEM reconstruction shows clearly that the corona of HD 155555 AB has a continuously distributed multi-temperature thermal structure.
4.2.3 Optical depth effects
Generally, the X-ray emission from coronal plasmas can be assumed to be optically thin (Schrijver et al., 1995; Mewe et al., 1995). In order to justify the optically thin model used in our analysis, we estimated the optical depth by comparing the observed flux ratio of the Fe XVII line at 15.265Å to the resonance line at 15.040Å of Fe XVII but with a lower oscillator strength. These ratios have been measured in the laboratory using an electron beam ion trap by Brown et al. (1998) and the values range between 0.31-0.36 at 0.85-1.3 keV. The measured value for the Sun is 0.490.05 (Saba et al., 1999). We obtained a ratio of 0.350.11 for HD 155555 AB, which is larger than the value of 0.260.10 determined for Capella (Brinkman et al., 2000) and smaller than the value of 0.490.14 determined for II Peg (Huenemoerder et al., 2001). The uncertainty in the ratio for HD 155555 AB is large enough that the results are consistent with previously estimated ratios.
4.2.4 Electron densities
We have investigated the electron densities of the coronal plasma using the density-sensitive line flux ratios of forbidden to inter combination lines of helium-like triplets (N VI, O VII, Ne IX, Mg XI and Si XIII), based on the theory of density-sensitive lines as described in detail by Gabriel & Jordan (1969). The He-like triplets of O VII, Ne IX, Mg XI and Si XIII are strong enough in our observations to obtain characteristic electron densities in the source (see Figure 8). Note that in the second panel of Fig. 8, the Ne IX inter-combination line (13.553 Å) is blended with Fe XIX (13.518 Å), since the spectral resolution of Chandra HEG and MEG are 0.005 and 0.0025 Å per bin, respectively, the peaks are well-resolved and are easily fitted with two separate Gaussian components. The measured line counts, the f/i ratios and the deduced electron densities for the entire duration of observation are listed in Table 6. In order to convert the measured f /i ratios to densities, we approximated the flux ratio by
where is the low-density limit and is the critical density for which we adopted the values from Pradhan & Shull (1981) for each of the ions. Notice that ratio and electron densities obtained from the dispersed spectrum represent mean values over the entire observation.
| Ion | G= | log(Te) | R= | log(ne) |
|---|---|---|---|---|
| K | ||||
| Si XIII | 0.730.12 | 6.920.20 | 7.081.18 | 13.34 |
| Mg XI | 0.730.07 | 6.760.17 | 1.950.20 | 12.72 |
| Ne IX | 0.830.10 | 6.480.09 | 2.870.34 | 11.83 |
| O VII | 0.820.25 | 6.380.22 | 1.130.35 | 10.80 |
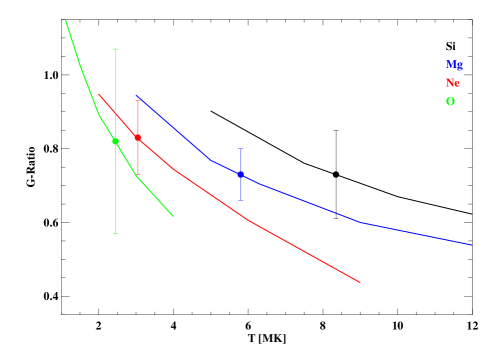
Furthermore, using the measured f, i and r line fluxes we have calculated the G= ratio for the time-averaged spectra, which provides an estimate of the electron temperature Te. The dependence on temperatures of the G-ratios is due to the collisional excitations which have a different temperature sensitivity for the forbidden and inter-combination lines compared to the r lines. In the case of a strong r line the G-ratio (G 1) suggests a collisionally dominated plasma (see Table 6). We compared the measured G(T) values of O VII, Ne IX, Mg XI and Si XIII with the theoretical relation between the electron temperature and G(T) as described by Porquet & Dubau (2000) and have plotted the results in Figure 9). The comparison shows that the coronal temperature is in 2-12 MK range. This temperature range is comparable to the temperatures derived using the DEM analysis.
We derived the R and G ratio for each of the time bins and refined the analysis of plasma temperature and density. In Figure 10, we show the line fluxes and their ratios as a function of time. Although individual fluxes clearly show an increasing trend during T3, the f/i ratio shows marginal variation between T1, T2 and T3.
The electron densities calculated using O VII triplets for HD 155555 AB time bins T1, T2 and T3 are log ne[cm-3], , and , respectively at log T[K]6.3. The Ne IX triplet is strongly affected by the blending of Fe XIX hence the obtained density might be highly uncertain; however, we obtain log ne[cm-3]11.79, 11.87, and 11.72 for time bins T1, T2 and T3, respectively, at log T[K]6.6. Higher densities are indicated by the Mg XI and Si XIII triplets yielding log ne[cm-3]12.73, 12.68, and 12.82 at log T[K]6.9 and log ne[cm-3]13.29, 13.45, and 13.44 at log T[K]7.0, for time bins T1, T2 and T3, respectively. Our results show that the electron densities are higher in the plasma region with higher temperature.
5. Analysis and results: HD 155555 C
We subjected the spectra of the M-dwarf companion to the same analysis that we have applied to HD 155555 AB, as described in § 4.
5.1. Light curve
The X-ray light curve obtained in 0.4-6.0 keV range is shown in Figure 11. There is flare-like feature observed in HD 155555 C where the intensity increases by a factor of (Fig. 11). The flare like feature was fitted with an exponential function
| (1) |
where CR(t) is the count rate as a function of time, A0 is the count rate at the flare peak, t0 is the time of peak count rate, is the rise/decay time of the flare. The short rise (6.000.02 ks) followed by a slow steady decline (8.900.03 ks) in the X-ray counts are similar to the flares observed on pre-main sequence stars (Stelzer et al., 2005; Getman et al., 2008). We have examined the spectral evolution of HD 155555 C but there is no obvious spectral hardening during this flare-like feature (bottom panel of Fig. 11) based on hardness ratio variation. The enhancement in the emission could occur as a result of magnetic reconnection. Since there is an increase in the count rate and no apparent change in the hardness ratio or temperature, we can interpret this enhancement in two ways 1) the increase in count rate was a result of more plasma with similar coronal properties rotating into the line-of-sight or 2) there is indeed a change in the coronal temperature but could not be observed as a result of the relatively poor statistics of this spectrum.

5.2. Spectral analysis
The spectrum of the HD 155555 C is significantly softer than that of HD 155555 AB; this is evident clearly in the first-order spectrum (see Fig. 2). We have used multi-temperature VAPEC model assuming an optically thin coronal plasma to the dispersed spectrum of HD 155555 C. We fit two temperature component VAPEC models which produced a (DOF). We then added an additional temperature component which produced a (DOF). Based on the F-statistic we obtained a p-value of 0.008. We further added an additional temperature component which did not improve the chi-square significantly and produced an unambiguously large F-test p-value of 0.49. Hence we modelled the spectra of HD 155555 C with three temperature component allowing the abundance of O, Ne, Mg, Si, S and Fe independently. The resultant model parameters are shown in Table 7. We estimate an unabsorbed X-ray flux of erg cm-2 s-1 for HD 155555 C which corresponds to X-ray luminosity of 2 erg s-1. The abundances of X-ray emitting plasma obtained from the above model are listed in Table 8.
| Parameters | |
|---|---|
| log t1 drive drive[K] | 6.49 |
| EM1 [cm-3] | 51.65 |
| log t2 [K] | 6.90 |
| EM2 [cm-3] | 51.71 |
| log t3 [K] | 7.34 |
| EM3 [cm-3] | 51.86 |
| red. | 0.81 |
| DOF | 202 |
| log [erg s-1] | 29.30 |
Note: the errors are estimated with 90% confidence limit.
In addition to the global fits we have used the line-based analysis as in the case of HD 155555 AB to assess the coronal temperatures, emission measures and the abundances of HD 155555 C. We reconstructed the DEM using all the strong lines. The resulting DEM distribution is shown in Figure 12 peaking at log T[K]6.3. The elemental abundances were also determined using the reconstructed DEM and their values are given in Table 8.

| HD 155555 C | ||
|---|---|---|
| Elements | XSPEC | Line-based |
| O | 0.31 | 0.290.06 |
| Ne | 0.92 | 0.890.45 |
| Mg | 0.36 | 0.270.15 |
| Al | 0.5 | 0.450.31 |
| Si | 0.48 | 0.290.10 |
| S | 0.55 | 0.350.12 |
| Fe | 0.50 | 0.410.14 |

We estimated the coronal density using density-sensitive ratio of forbidden and inter-combination lines of Ne IX triplet and obtained a value of log Ne11.78 (Table 9). Using the line fluxes of Si XIII, Mg XI and O VII we estimate an upper limit to the coronal densities of these elements (Table 9).
| Ion | f | i | r | G= | log(Te) | R= | log(ne) |
|---|---|---|---|---|---|---|---|
| [counts] | [counts] | [counts] | K | ||||
| Si XIII | 9.634.22 | 3.27 | 28.236.38 | 0.45 | … | 2.94 | 13.42 |
| Mg XI | 26.306.20 | 8.49 | 15.595.04 | 2.23 | … | 3.09 | 12.59 |
| Ne IX | 22.285.79 | 9.254.16 | 13.634.79 | 2.311.14 | … | 2.401.25 | 11.78 |
| O VII | 4.483.28 | 2.43 | 5.49 | 1.25 | … | 1.84 | 10.67 |
The ratio of Fe XVII resonance line at 15.01Å and the adjacent line at 15.26 Å yielded 0.380.25, indicating a ratio similar to HD 155555 AB.
6. Discussion
Our observation of HD 155555 AB shows continuous variability such that no part of the observation can be defined as being ”quiescent” (see Fig.3). The light curve was divided into three different time intervals. Interval T1 shows small-scale fluctuations and a steady decline which is perhaps indicative of the rotational modulation. During interval T2, a flare-like event is observed. The flare intensity is correlated with the hardness ratio. During interval T3, a steady rise with several small-scale variations is seen. This could be the result of one of the binary components crossing a large active region or several such regions on the stellar surface.
Our analysis of the Chandra HETG spectra has provided an insight into the plasma emission measure distribution, coronal temperatures, the abundances of individual elements, and the plasma densities as determined by He-like triplets. An obvious feature of the reconstructed DEMs (Fig.6) for each time interval is the apparent bimodal structure at similar temperatures. By comparing the XSPEC models predicting the observed spectra during three different time bins we find an increase in the source luminosity from 3.2 erg s-1 (during T1) to 4.1 erg s-1 (during T3). This is also reflected in the DEMs where the high-temperature peak at log T[K]6.9-7.0 is higher during T3 by a factor 1.5-2 when compared to that during T1. The high-temperature peak values of the DEM are consistent with the values obtained using XSPEC. The peaks of the low-temperature components of the DEM (at log T[K]6.3-6.5) increase by factors of 2-10 for T2 and T3 compared to T1. The large emission measure can be a result of an increase in the density or increase in the emitting volume.
A key parameter to interpret magnetically confined coronal structure is the plasma density. The measurements of the density and temperature obtained from the detailed analysis of He-like triplets allow us to estimate the volume and thus the average pressure of the emitting coronal region where these He-like triplets are formed. In Figure 14, we plot the estimated plasma pressure obtained using the densities and temperatures derived from the triplet line ratios as a function of the temperature. The plasma pressure increases steeply with increase in the temperature. A similar trend has been observed previously by Argiroffi et al. (2003) and Sanz-Forcada et al. (2003); they interpret this due to the presence of different kinds of coronal structures in different isobaric conditions where the plasma pressure increases for increasing temperature of the confined plasma but the volume filling factor decreases.

Stellar coronae often exhibit abundance anomaly patterns. A few moderately active, and even some low activity stars like the Sun, show an enhancement of low FIP elements and a depletion of high FIP elements. Highly active stars, on the other hand, exhibit an inverse pattern with the depletion of low-FIP elements and enhancement of high-FIP elements (inverse-FIP or iFIP effect). These effects result in higher metallicities in the coronae of stars with low activity compared to high activity stars (Güdel et al., 2001). The abundances derived for HD 155555 AB by the two methods used here (see §4.2.1 and §4.2.2) show a general sub-solar abundance for most of the elements, though the low FIP elements (10 eV; e.g. Mg, Si, Fe) are depleted more compared to the high FIP elements ( eV; e.g. O, Ne, Ar, N) (Fig. 7). The coronal abundances of HD 155555 AB relative to solar photospheric values (Grevesse & Sauval, 1998), do not show a strong FIP dependence, but rather suggest a moderate iFIP effect. We do not see any strong variation in the individual abundances during different time intervals in HD 155555 AB, indicating that there is no significantly fresh chromospheric material being evaporated into the corona.
6.1. Comparison with other stars
In order to check whether there are any differences between the coronae of stars that are active due to their extreme youth and those in RS CVn binary systems that have been spun up by tidal forces, we compare the spectrum of HD 155555 AB with that of active stars and young stars, viz., AR Lac (an active RS Cvn type binary), AB Dor (an active PMS star), HD 98800 (a WTTS), and TW Hya (a CTTS). AR Lac is one of the brightest RS CVn type binary (Siviero et al., 2006; Drake et al., 2014) with an orbital period of 1.98 d and with its binary components separated by 9.2 R⊙ (Chambliss, 1976; Popper & Ulrich, 1977). AB Dor is a bright (V6.9) young (age30-100 Myr) ultra-fast rotating (Pd) late-type star (Amado et al. 2001; Guirado et al. 2011 and references therein), and a member of a wide visual binary system (its companion is Rst 137B at a separation of 9′′ with spectral type M3-M5; Guirado et al. 2011). AB Dor is a highly active star that has been observed by many space-based observatories across the UV, EUV and X-ray wavelengths (Sanz-Forcada et al., 2003; García-Alvarez et al., 2008; Lalitha & Schmitt, 2013). TW Hya is a low-mass K-type star with an age of 10 Myr. TW Hya is accreting from its circumstellar disk (accretion rate of 1.0 and 5 M⊙ yr-1; Batalha et al. 2002; Brickhouse et al. 2010), which may give rise to post-shock plasma. Therefore, we have also chosen a non-accreting X-ray bright PMS star, HD 98800 for comparison. TW Hya is a single CTTS, whereas HD 98800 is a multiple system with two visual components separated by 0.8′′ and orbital period of 300-400 years (Soderblom et al., 1998; Tokovinin, 1999; Prato et al., 2001; Boden et al., 2005). The two components of HD 98800 are well resolved in the Chandra HETG zeroth-order image with the primary component HD 98800 A appearing to be 4 times brighter than HD 98800 B (Kastner et al., 2004). This system displays an X-ray luminosity similar to TW Hya, however, there is no evidence of accretion in HD 98800 (Kastner et al., 1997, 2004).
The basic stellar and X-ray properties of these stars are summarized in Table 10. The coronal emission of AR Lac, TW Hya and HD 98800 has been studied in detail via Chandra HETG observations (Batalha et al., 2002; Huenemoerder et al., 2004; Kastner et al., 2004; Drake et al., 2014). In Figure 15, we show the Chandra HETG spectra in the 13-16 Å region for AR Lac, AB Dor, HD 155555 AB, TW Hya and HD 98800. This wavelength region encompasses several highly ionised Fe lines and the Ne IX triplets. Visual comparison shows that the spectrum of HD 155555 AB is very similar to that of AR Lac and AB Dor showing similar relative line strengths for the Ne IX triplet and the Fe lines. On the other hand, TW Hya and HD 98800 show the Ne IX resonance line to be strong, and Fe lines to be weak compared to HD 155555 AB, AR Lac, and AB Dor.
| Star | Spectral | Age | Binarity | Ongoing | Prot/orb | Distance | log | log | T |
|---|---|---|---|---|---|---|---|---|---|
| Type | Myr | Accretion | days | MK | |||||
| AR Lac | K0IV+G5IV | 30001 | Y | N | 1.98 | 43 | 30.89 | -3.45 | 16 |
| AB Dor | K0-2V | 30-100 | Y | N | 0.52 | 15 | 30.01 | -3.00 | 13 |
| HD 155555 AB | G5IV+K0IV | 18 | Y | N | 1.68 | 31 | 30.60 | -3.28 | 12 |
| HD 98800 | K4V | 10 | Y | N | 262 | 40 | 29.83 | -3.40 | 2.5-10 |
| TW Hya | K6Ve | 8 | N | Y | 4.5? | 57 | 30.11 | -2.92 | 3 |
Note: The ages, spectral types and distances are from 1) Lanza
et al. 1998; Drake
et al. 2014, and references therein, for AR Lac; 2) Guirado
et al. 2011 and references therein for AB Dor; 3) Strassmeier &
Rice 2000 for HD 155555 AB; 4) Kastner
et al. 1997; Webb
et al. 1999 for HD 98800; 5) Batalha
et al. 2002; Setiawan
et al. 2008 for TW Hya. For AB Dor, Prot/orb listed in column 6 represents the rotation period (Guirado
et al., 2011), whereas, for HD 98800 this value represents the orbital period of the wide binary (Boden
et al., 2005). For AR Lac and HD 155555 AB, Prot/orb represents both rotation period and the orbital period since these systems are tidally locked (Lanza
et al., 1998; Strassmeier &
Rice, 2000). For TW Hya, Prot/orb listed in column 6 represents an uncertain rotation period (Alencar &
Batalha, 2002). The coronal temperature (T) are the emission measure weighted temperatures in MK. For AR Lac and AB Dor the temperature and emission measures are obtained from Singh
et al. (1996) and Lalitha
et al. (2013), respectively. For TW Hya and HD 98800, the temperatures are obtained from Kastner
et al. (2002) and Kastner
et al. (2004), respectively.

Comparison of our results with AR Lac, AB Dor, TW Hya, and HD 98800 indicate that HD 155555 AB is very similar to AR Lac and AB Dor in its emission measure distribution, abundances, and electron densities, despite the difference in their ages. During flare-like events the emission measures peak at similar temperatures (log T[K]6.3 and 6.9) for HD 155555 AB, AR Lac (Huenemoerder, 2002) and AB Dor (Sanz-Forcada et al., 2003). However, an additional higher temperature component are observed during both quiescence and flare at log T[K] for AB Dor. This difference in the temperatures could be due to the rapid rotation of AB Dor (Randich, 1998) or due to its higher activity level (Telleschi et al., 2005). We note that the DEM distributions for both AR Lac and AB Dor are trimodal, whereas this is the case only during flare-like events (T2) for HD 155555 AB.
The total emission measure for the higher temperature component (log T [K]6.9) is 52.35 cm-3 for HD 155555 AB, cf., 52.95 and 52.34 cm-3 for AR Lac and AB Dor, respectively (Huenemoerder 2002; Sanz-Forcada et al. 2003). For TW Hya and HD 98800, there is no emission component at log T [K]6.9. The DEM for TW Hya peaks at log T[K]6.5 (Kastner et al., 2002) with no evidence of a hotter component (log T[K]7.0). Similarly the DEM for HD 98800 has one peak at log T[K]6.5, and a flat DEM thereafter (Huenemoerder et al., 2004; Kastner et al., 2004).
Güdel et al. (1997) studied a sample of solar-like G stars with ages ranging from 70-9000 Myr and found that the emission measure of the hotter component rapidly decreases with age. Our study, however, shows that the emission measures of the hotter component for HD 155555 AB and AB Dor are very similar with no noticeable trend. We note that the age of HD 155555 AB is several Myr younger than the youngest star (EK Dra, age 70 Myr) in the sample compiled by Güdel et al. (1997). A more detailed analysis and interpretation of the coronal temperatures, emission measures, and densities of K-type stars with a range of ages is required in order to characterise how the X-ray properties of these stars evolve with time, and how their behaviour compares with solar-type stars.
The ratio of Ne to Fe abundance is 3 for HD 155555 AB , 5 for AR Lac (Huenemoerder, 2002), 5 for AB Dor (Sanz-Forcada et al., 2003) and 5 for HD 98800 (Kastner et al., 2004), whereas this ratio is larger than the solar value by a factor of 10 for TW Hya (Kastner et al., 2002). Although the DEM peaks are similar for TW Hya and HD 98800, the Ne/Fe abundance ratio for HD 98800 is unlike that seen in TW Hya. This large ratio in TW Hya could be the result of an ongoing accretion where significant fractionation occurs in the circumstellar disk.
The electron densities (log ne) obtained for HD 155555 AB with O VII and Ne IX are 10.80 and 11.83 cm-3, respectively, which are similar to the values for AR Lac (Huenemoerder, 2002) and AB Dor (Sanz-Forcada et al., 2003; Lalitha et al., 2013). However, the log ne values for O VII and Ne IX in TW Hya are 11.75 and 12.47 cm-3 respectively (Kastner et al., 2002). This could be the result of ongoing accretion seen in TW Hya (Argiroffi et al., 2009; Brickhouse et al., 2010; Dupree et al., 2012; Ness & Schmitt, 2005).
Similarly, we have compared our results on HD 155555 C with other studies of M stars. In Figure 16, we show the Chandra HETG spectra in the 13-16 Å region for HD 155555 C, AU Mic and EQ Peg. AU Mic is an active nearby (distance10 pc) M type star showing typical X-ray luminosity of 21029 ergs s-1, similar to that of HD 155555 C (Rodono et al., 1986; Del Zanna et al., 2002). EQ Peg is a visual binary consisting of two stars with spectral type M3.5 and M4.5 which are separated by 30 AU. At a distance of 6.1 pc, the quiescent X-ray luminosity of EQ Peg has been measured to be between 6-71028 ergs s-1 (Robrade & Schmitt, 2005). EQ Peg has a spectral type similar to that of HD 155555 C, and AU Mic shows X-ray emission similar to that of HD 155555 C. Visual comparison of Figure 16 shows that the spectrum of HD 155555 C shows a strong flux at 15.01 Å similar to what is seen in EQ Peg and AU Mic. The Ne IX triplet emission which is very strong in both EQ Peg and AU Mic is barely visible in the case of HD 155555 C. Although the Ne IX line luminosity for HD 155555 C is at least half an order of magnitude brighter than that of AU Mic, the Ne/Fe abundance ratio is 2, whereas for AU Mic and EQ Peg the ratios are 7 and 8, respectively.

The emission measure of HD 155555 C shows a peak at log T[K]6.4, and has no significant plasma emission at log T[K]7. In contrast, AU Mic and EQ Peg show peaks around log T[K]6.8-6.9 with the bulk of the plasma located between log T[K]6.3-7.3. However, the temperatures and emission measures obtained by XSPEC model fit are consistent with the results obtained for AU Mic and EQ Peg. The abundances of HD 155555 C show a moderate iFIP effect, which is common among stars with high activity levels like AU Mic and EQ Peg. The metallicities of HD 155555 C found here are sub-solar.
7. Conclusion
We have analysed the Chandra HETG data of a young active multiple system, HD 155555. We infer the following characteristics of the coronal plasma of this system:
-
•
The X-ray emission shows continuous variability throughout the observation, with flare-like events. The light curve also shows a possible modulation due to coronal hot spots. Since the observation reported here spans only (Pd and Pd) of the rotation period, additional observations covering at least a few rotation periods of HD 155555 AB are required to verify whether the observed variation is indeed due to rotational modulation.
-
•
The emission measure distributions calculated for the coronal plasma of HD 155555 AB and HD 155555 C using individual line fluxes, show a stable structure at followed by a steep increase up to the peak at . During high activity state the DEM shows an increase in the amount of X-ray emission. For HD 155555 C, the DEM shows a peak at , followed by a plateau in the range -7.4.
-
•
Element abundances in the corona of HD 155555 AB and HD 155555 C are observed to follow an intermediate behavior between the solar-like FIP effect, and the inverse FIP effect observed in other active stars. The coronal metallicity in both the HD 155555 AB and C spectra is sub-solar, as is typically found in active stars.
-
•
The continuum, line emissivity, densities and the temperatures of the coronal plasma in HD 155555 AB, are very similar to that of other active stars of similar age, like AB Dor and older RS CVns, like AR Lac, but very different from that of other young stars of CTTS or WTTS type. These results thus indicate that age has little effect on their activity, unlike what is seen in the solar-type stars. A detailed study of a range of K-type stars with different ages, however, may reveal the dependence of coronal properties on age, and whether the behaviour is similar to the solar-type stars or not.
-
•
The X-ray emission of the HD 155555 C component is similar to that of other M-type dwarf stars of similar activity levels in the solar neighborhood.
References
- Alencar & Batalha (2002) Alencar, S. H. P., & Batalha, C. 2002, ApJ, 571, 378
- Amado et al. (2001) Amado, P. J., Cutispoto, G., Lanza, A. F., & Rodonò, M. 2001, in Astronomical Society of the Pacific Conference Series, Vol. 223, 11th Cambridge Workshop on Cool Stars, Stellar Systems and the Sun, ed. R. J. Garcia Lopez, R. Rebolo, & M. R. Zapaterio Osorio, 895
- Argiroffi et al. (2003) Argiroffi, C., Maggio, A., & Peres, G. 2003, A&A, 404, 1033
- Argiroffi et al. (2009) Argiroffi, C., Maggio, A., Peres, G., Drake, J. J., López-Santiago, J., Sciortino, S., & Stelzer, B. 2009, A&A, 507, 939
- Arnaud (1996) Arnaud, K. A. 1996, in ASP Conf. Ser. 101: Astronomical Data Analysis Software and Systems V, ed. G. H. Jacoby & J. Barnes, 17
- Audard et al. (2002) Audard, M., Güdel, M., Sres, A., Mewe, R., Raassen, A. J. J., Behar, E., Foley, C. R., & van der Meer, R. L. J. 2002, in Astronomical Society of the Pacific Conference Series, Vol. 277, Stellar Coronae in the Chandra and XMM-NEWTON Era, ed. F. Favata & J. J. Drake, 65
- Audard et al. (2003) Audard, M., Güdel, M., Sres, A., Raassen, A. J. J., & Mewe, R. 2003, A&A, 398, 1137
- Ball et al. (2005) Ball, B., Drake, J. J., Lin, L., Kashyap, V., Laming, J. M., & García-Alvarez, D. 2005, ApJ, 634, 1336
- Barstow (1987) Barstow, M. A. 1987, MNRAS, 228, 251
- Batalha et al. (2002) Batalha, C., Batalha, N. M., Alencar, S. H. P., Lopes, D. F., & Duarte, E. S. 2002, ApJ, 580, 343
- Boden et al. (2005) Boden, A. F., et al. 2005, ApJ, 635, 442
- Brickhouse et al. (2010) Brickhouse, N. S., Cranmer, S. R., Dupree, A. K., Luna, G. J. M., & Wolk, S. 2010, ApJ, 710, 1835
- Brinkman et al. (2001) Brinkman, A. C., et al. 2001, A&A, 365, L324
- Brinkman et al. (2000) Brinkman, A. C., et al. 2000, ApJ, 530, L111
- Bromage et al. (1992) Bromage, G. E., Kellett, B. J., Jeffries, R. D., Innis, J. L., Matthews, L., Anders, G. J., & Coates, D. W. 1992, in Astronomical Society of the Pacific Conference Series, Vol. 26, Cool Stars, Stellar Systems, and the Sun, ed. M. S. Giampapa & J. A. Bookbinder, 80
- Brown et al. (1998) Brown, G. V., Beiersdorfer, P., Liedahl, D. A., Widmann, K., & Kahn, S. M. 1998, ApJ, 502, 1015
- Chambliss (1976) Chambliss, C. R. 1976, PASP, 88, 762
- Cutispoto (1990) Cutispoto, G. 1990, A&AS, 84, 397
- Del Zanna et al. (2002) Del Zanna, G., Landini, M., & Mason, H. E. 2002, A&A, 385, 968
- Drake & Kashyap (2001) Drake, J. J., & Kashyap, V. 2001, ApJ, 547, 428
- Drake et al. (2014) Drake, J. J., Ratzlaff, P., Kashyap, V., Huenemoerder, D. P., Wargelin, B. J., & Pease, D. O. 2014, ApJ, 783, 2
- Drake et al. (2015) Drake, S. A., Osten, R. A., Krimm, H., De Pasquale, M., Gehrels, N., & Barthelmy, S. 2015, The Astronomer’s Telegram, 6940, 1
- Dunstone et al. (2008) Dunstone, N. J., Hussain, G. A. J., Collier Cameron, A., Marsden, S. C., Jardine, M., Barnes, J. R., Ramirez Velez, J. C., & Donati, J.-F. 2008, MNRAS, 387, 1525
- Dupree et al. (2012) Dupree, A. K., et al. 2012, ApJ, 750, 73
- Flaccomio et al. (2010) Flaccomio, E., Micela, G., Favata, F., & Alencar, S. P. H. 2010, A&A, 516, L8
- Fuhrmeister et al. (2011) Fuhrmeister, B., Lalitha, S., Poppenhaeger, K., Rudolf, N., Liefke, C., Reiners, A., Schmitt, J. H. M. M., & Ness, J.-U. 2011, A&A, 534, A133
- Gabriel & Jordan (1969) Gabriel, A. H., & Jordan, C. 1969, MNRAS, 145, 241
- García-Alvarez et al. (2008) García-Alvarez, D., Drake, J. J., Kashyap, V. L., Lin, L., & Ball, B. 2008, ApJ, 679, 1509
- Garmire et al. (2003) Garmire, G. P., Bautz, M. W., Ford, P. G., Nousek, J. A., & Ricker, G. R., Jr. 2003, in Society of Photo-Optical Instrumentation Engineers (SPIE) Conference Series, Vol. 4851, X-Ray and Gamma-Ray Telescopes and Instruments for Astronomy., ed. J. E. Truemper & H. D. Tananbaum, 28
- Getman et al. (2008) Getman, K. V., Feigelson, E. D., Broos, P. S., Micela, G., & Garmire, G. P. 2008, ApJ, 688, 418
- Grevesse & Sauval (1998) Grevesse, N., & Sauval, A. J. 1998, Space Sci. Rev., 85, 161
- Güdel et al. (2001) Güdel, M., et al. 2001, A&A, 365, L336
- Güdel et al. (2007) Güdel, M., et al. 2007, A&A, 468, 353
- Güdel et al. (1997) Güdel, M., Guinan, E. F., & Skinner, S. L. 1997, ApJ, 483, 947
- Güdel & Nazé (2009) Güdel, M., & Nazé, Y. 2009, A&A Rev., 17, 309
- Güdel et al. (2005) Güdel, M., Skinner, S. L., Briggs, K. R., Audard, M., Arzner, K., & Telleschi, A. 2005, ApJ, 626, L53
- Guirado et al. (2011) Guirado, J. C., Marcaide, J. M., Martí-Vidal, I., Le Bouquin, J.-B., Close, L. M., Cotton, W. D., & Montalbán, J. 2011, A&A, 533, A106
- Hall (1980) Hall, D. S. 1980, ApJ, 236, L137
- Huenemoerder (2002) Huenemoerder, D. P. 2002, in High Resolution X-ray Spectroscopy with XMM-Newton and Chandra, ed. G. Branduardi-Raymont, 18
- Huenemoerder et al. (2004) Huenemoerder, D. P., Boroson, B., Schulz, N. S., Canizares, C. R., Buzasi, D. L., Preston, H. L., & Kastner, J. H. 2004, in IAU Symposium, Vol. 219, Stars as Suns : Activity, Evolution and Planets, ed. A. K. Dupree & A. O. Benz, 238
- Huenemoerder et al. (2001) Huenemoerder, D. P., Canizares, C. R., & Schulz, N. S. 2001, ApJ, 559, 1135
- Kashyap & Drake (1998) Kashyap, V., & Drake, J. J. 1998, ApJ, 503, 450
- Kastner et al. (2004) Kastner, J. H., Huenemoerder, D. P., Schulz, N. S., Canizares, C. R., Li, J., & Weintraub, D. A. 2004, ApJ, 605, L49
- Kastner et al. (2002) Kastner, J. H., Huenemoerder, D. P., Schulz, N. S., Canizares, C. R., & Weintraub, D. A. 2002, ApJ, 567, 434
- Kastner et al. (1997) Kastner, J. H., Zuckerman, B., Weintraub, D. A., & Forveille, T. 1997, Science, 277, 67
- Lalitha et al. (2013) Lalitha, S., Fuhrmeister, B., Wolter, U., Schmitt, J. H. M. M., Engels, D., & Wieringa, M. H. 2013, A&A
- Lalitha & Schmitt (2013) Lalitha, S., & Schmitt, J. H. M. M. 2013, A&A
- Lanza et al. (1998) Lanza, A. F., Catalano, S., Cutispoto, G., Pagano, I., & Rodono, M. 1998, A&A, 332, 541
- Little-Marenin et al. (1986) Little-Marenin, I. R., Simon, T., Ayres, T. R., Cohen, N. L., Feldman, P. A., Linsky, J. L., Little, S. J., & Lyons, R. 1986, ApJ, 303, 780
- Martin & Brandner (1995) Martin, E. L., & Brandner, W. 1995, A&A, 294, 744
- Mewe et al. (1995) Mewe, R., Kaastra, J. S., Schrijver, C. J., van den Oord, G. H. J., & Alkemade, F. J. M. 1995, A&A, 296, 477
- Ness & Schmitt (2005) Ness, J.-U., & Schmitt, J. H. M. M. 2005, A&A, 444, L41
- Pasquini et al. (1991) Pasquini, L., Cutispoto, G., Gratton, R., & Mayor, M. 1991, A&A, 248, 72
- Pasquini et al. (1989) Pasquini, L., Schmitt, J. H. M. M., Harnden, F. R., Jr., Tozzi, G. P., & Krautter, J. 1989, A&A, 218, 187
- Popper & Ulrich (1977) Popper, D. M., & Ulrich, R. K. 1977, ApJ, 212, L131
- Porquet & Dubau (2000) Porquet, D., & Dubau, J. 2000, A&AS, 143, 495
- Pradhan & Shull (1981) Pradhan, A. K., & Shull, J. M. 1981, ApJ, 249, 821
- Prato et al. (2001) Prato, L., et al. 2001, ApJ, 549, 590
- Protassov et al. (2002) Protassov, R., van Dyk, D. A., Connors, A., Kashyap, V. L., & Siemiginowska, A. 2002, ApJ, 571, 545
- Randich (1998) Randich, S. 1998, in Astronomical Society of the Pacific Conference Series, Vol. 154, Cool Stars, Stellar Systems, and the Sun, ed. R. A. Donahue & J. A. Bookbinder, 501
- Reale et al. (1997) Reale, F., Betta, R., Peres, G., Serio, S., & McTiernan, J. 1997, A&A, 325, 782
- Robrade & Schmitt (2005) Robrade, J., & Schmitt, J. H. M. M. 2005, A&A, 435, 1073
- Rodono et al. (1986) Rodono, M., et al. 1986, A&A, 165, 135
- Rucinski (1982) Rucinski, S. M. 1982, Information Bulletin on Variable Stars, 2203, 1
- Saba et al. (1999) Saba, J. L. R., Schmelz, J. T., Bhatia, A. K., & Strong, K. T. 1999, ApJ, 510, 1064
- Sanz-Forcada et al. (2003) Sanz-Forcada, J., Maggio, A., & Micela, G. 2003, A&A, 408, 1087
- Schrijver et al. (1995) Schrijver, C. J., Mewe, R., van den Oord, G. H. J., & Kaastra, J. S. 1995, A&A, 302, 438
- Setiawan et al. (2008) Setiawan, J., Henning, T., Launhardt, R., Müller, A., Weise, P., & Kürster, M. 2008, Nature, 451, 38
- Singh et al. (1996) Singh, K. P., Drake, S. A., & White, N. E. 1996, AJ, 111, 2415
- Singh et al. (1996) Singh, K. P., White, N. E., & Drake, S. A. 1996, ApJ, 456, 766
- Siviero et al. (2006) Siviero, A., Dallaporta, S., & Munari, U. 2006, Baltic Astronomy, 15, 387
- Skinner et al. (2011) Skinner, S. L., Audard, M., & Güdel, M. 2011, ApJ, 737, 19
- Smith et al. (2001) Smith, R. K., Brickhouse, N. S., Liedahl, D. A., & Raymond, J. C. 2001, ApJ, 556, L91
- Soderblom et al. (1998) Soderblom, D. R., et al. 1998, ApJ, 498, 385
- Stelzer et al. (2005) Stelzer, B., Flaccomio, E., Montmerle, T., Micela, G., Sciortino, S., Favata, F., Preibisch, T., & Feigelson, E. D. 2005, ApJS, 160, 557
- Stelzer et al. (2009) Stelzer, B., Hubrig, S., Orlando, S., Micela, G., Mikulášek, Z., & Schöller, M. 2009, A&A, 499, 529
- Strassmeier & Rice (2000) Strassmeier, K. G., & Rice, J. B. 2000, A&A, 360, 1019
- Telleschi et al. (2005) Telleschi, A., Güdel, M., Briggs, K., Audard, M., Ness, J.-U., & Skinner, S. L. 2005, ApJ, 622, 653
- Tokovinin (1999) Tokovinin, A. A. 1999, Astronomy Letters, 25, 669
- Walter & Bowyer (1981) Walter, F. M., & Bowyer, S. 1981, ApJ, 245, 671
- Walter et al. (1980) Walter, F. M., Bowyer, S., Linsky, J. L., & Garmire, G. 1980, ApJ, 236, L137
- Webb et al. (1999) Webb, R. A., Zuckerman, B., Platais, I., Patience, J., White, R. J., Schwartz, M. J., & McCarthy, C. 1999, ApJ, 512, L63
- Weisskopf et al. (2002) Weisskopf, M. C., Brinkman, B., Canizares, C., Garmire, G., Murray, S., & Van Speybroeck, L. P. 2002, PASP, 114, 1
| HD 155555 AB | HD 155555 C | |||||||
| Ion | log Tmax | Transition | Fl | Fl | ||||
| [K] | [upper lower] | [] | [] | [counts] | [] | [counts] | ||
| Ar XVIII | 7.60 | Unknown | 3.727 | 3.727 | 35.937.05 | … | … | |
| Ar XVI | 7.20 | Unknown | 3.952 | 3.951 | 52.688.30 | … | … | |
| Ar XVI/XVII | 7.20/7.30 | Unknown | 3.994 | 3.994 | 46.767.89 | … | … | |
| S XVI | 7.40 | 4.727 | 4.731 | 77.719.85 | 4.732 | 3.343.02 | ||
| S XV | 7.20 | 5.038 | 5.041 | 147.7013.18 | 5.036 | 9.184.15 | ||
| Si XIV | 7.20 | 6.180 | 6.184 | 409.7521.26 | 6.185 | 20.855.64 | ||
| Si XIII | 7.00 | 6.650 | 6.649 | 579.8625.09 | 6.652 | 28.236.38 | ||
| Si XIII | 6.95 | 6.688 | 6.688 | 52.498.29 | … | … | ||
| Si XIII | 7.00 | 6.740 | 6.740 | 371.9120.30 | 6.740 | 9.634.22 | ||
| Mg XII | 7.00 | 7.110 | 7.109 | 191.5614.86 | … | … | ||
| Fe XXIV | 7.30 | 7.170 | 7.168 | 193.7014.94 | … | … | ||
| Mg XI | 6.85 | Unknown | 7.473 | 7.471 | 132.6012.54 | … | … | |
| Al XII | 6.90 | 7.760 | 7.757 | 166.7713.94 | 7.757 | 6.883.71 | ||
| Mg XI | 6.80 | 7.850 | 7.852 | 186.0614.66 | … | … | ||
| Fe XXIV | 7.29 | 7.985 | 7.986 | 211.7115.57 | 7.980 | 13.534.77 | ||
| Fe XXIII | 7.20 | 8.300 | 8.310 | 261.5017.19 | … | … | ||
| Mg XII | 7.00 | 8.419 | 8.420 | 1030.0633.10 | 8.422 | 36.627.11 | ||
| Fe XXIII | 7.20 | 8.810 | 8.812 | 196.6015.04 | … | … | ||
| Fe XXII | 7.10 | 8.980 | 8.973 | 149.3913.25 | … | … | ||
| Mg XI | 6.81 | 9.168 | 9.169 | 651.0523.45 | 9.168 | 15.595.04 | ||
| Mg XI | 6.81 | 9.231 | 9.234 | 162.2313.76 | … | … | ||
| Mg XI | 6.81 | 9.314 | 9.314 | 316.6218.81 | 9.310 | 26.306.20 | ||
| Fe XXI | 7.10 | 9.480 | 9.479 | 112.9011.66 | … | … | ||
| Fe XXI | 7.10 | Unknown | 9.542 | 9.545 | 37.147.15 | … | … | |
| Ne X | 6.81 | 9.708 | 9.707 | 269.7017.44 | … | … | ||
| Ni XXV | 7.30 | 9.970 | 9.993 | 170.3214.07 | … | … | ||
| Na XI | 6.90 | 10.020 | 10.038 | 264.6117.29 | … | … | ||
| Ne X | 6.78 | 10.238 | 10.239 | 566.4324.81 | 10.242 | 15.224.99 | ||
| Fe XXV | 7.75 | Unknown | 10.369 | 10.362 | 142.4412.96 | … | … | |
| Fe XXIV | 7.27 | 10.619 | 10.625 | 287.0817.96 | 10.616 | 11.424.48 | ||
| Fe XXIV | 7.27 | 10.663 | 10.664 | 186.5814.68 | 10.663 | 16.045.09 | ||
| Ne IX | 6.60 | Unknown | 10.764 | 10.768 | 120.8212.02 | … | … | |
| Fe XXIII? | 7.2 | Unknown | 10.825 | 10.817 | 114.8311.75 | … | … | |
| Fe XXIII | 7.20 | 10.980 | 10.984 | 211.5615.57 | 10.989 | 9.814.24 | ||
| Fe XXIII | 7.20 | 11.020 | 11.028 | 265.9417.33 | 11.028 | 15.755.06 | ||
| Fe XXIV | 7.29 | 11.176 | 11.177 | 249.6416.82 | 11.176 | 11.764.53 | ||
| Fe XXIV | 7.29 | Unknown | 11.260 | 11.259 | 139.0212.69 | … | … | |
| Fe XVIII | 6.90 | Unknown | 11.326 | 11.321 | 98.9810.98 | … | … | |
| Fe XXIV | 7.29 | 11.432 | 11.430 | 302.0018.39 | 11.430 | 10.974.42 | ||
| Ne IX | 6.60 | 11.544 | 11.539 | 250.2016.84 | … | … | ||
| Fe XXIII | 7.18 | 11.736 | 11.741 | 298.1418.28 | … | … | ||
| Fe XXIII | 7.10 | 11.770 | 11.775 | 308.5118.58 | 11.753 | 21.035.66 | ||
| Fe XXII | 7.10 | 11.930 | 11.929 | 111.5411.59 | 11.932 | 14.384.88 | ||
| Fe XXI/XXII | 7.1/7.1 | Unknown | 11.975 | 11.976 | 72.979.58 | |||
| Ne X | 6.77 | 12.132 | 12.134 | 2099.9346.83 | 12.134 | 53.218.34 | ||
| Fe XXI | 7.10 | 12.284 | 12.284 | 470.2022.70 | 12.282 | 20.385.59 | ||
| Fe XXI | 7.10 | Unknown | 12.397 | 12.398 | 108.7011.46 | … | … | |
| Fe XXI | 7.10 | Unknown | 12.649 | 12.650 | 135.4412.67 | … | … | |
| Fe XX | 7.00 | Unknown | 12.750 | 12.754 | 134.0612.61 | … | … | |
| Fe XX | 7.00 | 12.827 | 12.827 | 451.2422.26 | 12.840 | 17.365.25 | ||
| Fe XX | 7.00 | Unknown | 13.143 | 13.143 | 109.6811.50 | … | … | |
| Ne IX | 6.59 | 13.447 | 13.449 | 503.4926.53 | 13.453 | 13.634.79 | ||
| Fe XXI | 6.91 | 13.518 | 13.515 | 354.9919.86 | 13.551 | 9.254.16 | ||
| Ne IX | 6.59 | 13.553 | 13.554 | 109.6711.50 | 13.701 | 22.285.79 | ||
| Ne IX | 6.59 | 13.699 | 13.699 | 313.4718.72 | … | … | ||
| Fe XVIII | 6.84 | 14.208 | 14.206 | 404.6621.13 | 14.204 | 17.645.28 | ||
| Fe XVIII | 6.84 | 14.256 | 14.266 | 151.3313.33 | 14.263 | 11.884.55 | ||
| Fe XVIII | 6.89 | 14.373 | 14.372 | 238.6416.47 | 14.382 | 16.815.19 | ||
| Fe XVIII | 6.90 | 14.530 | 14.540 | 159.6513.66 | … | … | ||
| Fe XVIII | 6.90 | 14.580 | 14.585 | 48.678.03 | … | … | ||
| Fe XIX | 6.90 | 14.670 | 14.669 | 84.7910.24 | … | … | ||
| Fe XX | 7.00 | Unknown | 14.754 | 14.755 | 63.248.99 | … | … | |
| Fe XX ? | 7.00 | Unknown | 14.826 | 14.823 | 60.148.80 | … | … | |
| Fe XVII | 6.72 | 15.014 | 15.014 | 653.2926.57 | 15.013 | 45.757.81 | ||
| Fe XIX | 6.90 | 15.080 | 15.081 | 121.4212.05 | 15.083 | 6.213.63 | ||
| O VIII | 6.51 | 15.176 | 15.175 | 135.3712.66 | … | … | ||
| Fe XVII | 6.72 | 15.261 | 15.263 | 230.5616.20 | 15.266 | 17.655.29 | ||
| Fe XVII | 6.70 | 15.450 | 15.457 | 79.4999.95 | … | … | ||
| Fe XX | 7.10 | 15.626 | 15.626 | 116.2511.81 | … | … | ||
| Fe XVIII | 6.90 | 15.828 | 15.823 | 76.519.79 | … | … | ||
| Fe XVIII | 6.90 | 15.870 | 15.869 | 78.399.89 | … | … | ||
| O VIII | 6.50 | 16.005 | 16.007 | 387.0920.69 | 16.009 | 17.565.27 | ||
| Fe XVIII | 6.84 | 16.071 | 16.073 | 229.5416.17 | 16.076 | 7.373.85 | ||
| Fe XIX | 6.90 | 16.120 | 16.108 | 72.819.57 | … | … | ||
| Fe XVIII | 6.70 | 16.170 | 16.167 | 58.148.67 | … | … | ||
| Fe XVII | 6.71 | 16.780 | 16.776 | 208.2218.57 | 16.773 | 12.554.64 | ||
| Fe XVII | 6.71 | 17.051 | 17.052 | 367.0920.17 | 17.092 | 24.806.05 | ||
| Fe XVII | 6.71 | 17.096 | 17.096 | 306.8118.53 | … | … | ||
| O VIII | 6.48 | 18.967 | 18.970 | 781.2228.96 | 18.970 | 27.806.34 | ||
| O VII | 6.33 | 21.600 | 21.601 | 70.809.45 | … | … | ||
| O VII | 6.33 | 21.800 | 21.804 | 27.556.32 | … | … | ||
| O VII | 6.33 | 22.100 | 22.106 | 31.156.64 | 22.100 | 4.493.29 | ||
| N VII | 6.32 | 24.779 | 24.780 | 57.548.63 | … | … |