The distribution of deuterated formaldehyde within Orion–KL
Abstract
We report the first high angular resolution imaging (3.4″ 3.0″) of deuterated formaldehyde (HDCO) toward Orion–KL, carried out with the Submillimeter Array (SMA). We find that the spatial distribution of the formaldehyde emission systematically differs from that of methanol: while methanol is found towards the inner part of the region, HDCO is found in colder gas that wraps around the methanol emission on four sides. The HDCO/H2CO ratios are determined to be 0.003–0.009 within the region, up to an order of magnitude higher than the D/H measured for methanol. These findings strengthen the previously suggested hypothesis that there are differences in the chemical pathways leading to HDCO (via deuterated gas phase chemistry) and deuterated methanol (through conversion of formaldehyde into methanol on the surface of icy grain mantles).
1 Introduction
The Orion–KL nebula, that lies at a distance of 4147 pc (Menten et al., 2007) is a focal source for studies of the physics and chemistry of high–mass star forming regions. Its rich molecular diversity and complex physical structure have been revealed by a number of spectral line surveys and interferometric studies of the region (e.g. Blake et al., 1987; Comito et al., 2005; Schilke et al., 1997, 2001; Beuther et al., 2005, 2006; Persson et al., 2007; Guélin et al., 2008; Friedel & Snyder, 2008; Tercero et al., 2010, 2011; Favre et al., 2011a, b, 2014; Brouillet et al., 2013; Peng et al., 2013; Friedel & Snyder, 2008; Friedel & Widicus Weaver, 2012; Widicus Weaver & Friedel, 2012; Esplugues et al., 2013). Recently, a broadband spectral line survey of Orion–KL carried out with the Herschel/HIFI spectrometer (Bergin et al., 2010; Crockett et al., 2010, 2014) has been obtained as part of the HEXOS key program111www.hexos.org. The unprecedented 1.2 THz wide frequency coverage of this survey has allowed for strong constraints on physical parameters and molecular abundances due to the detection of many transitions for each molecule, with a wide range of excitation conditions, revealing the presence of thermal gradients (e.g. Wang et al., 2011). Among the molecular components associated with Orion–KL lie the so-called Hot Core and Compact Ridge. Although the precise nature of these regions remains enigmatic, evidence has been recently provided that they may have originated from the interaction of the remnants of a recent explosion with ice grains mantles (720 years ago, e.g. Bally et al., 2011; Gómez et al., 2005, 2008; Rodríguez et al., 2005; Nissen et al., 2012), leading to the evaporation and the heating of organic material (Favre et al., 2011a; Zapata et al., 2011).
Deuterium fractionation is intrinsically a low-temperature process. Therefore, deuterated molecules in warm (T100K) region, such as Orion-KL, offer a window into its physical conditions at the earlier, colder stage (T10–30 K) when this material likely formed (Blake et al., 1987; Charnley et al., 1997; Pagani et al., 1992). Numerous deuterated species have been observed toward Orion–KL: deuterated water (Turner et al., 1975; Jacq et al., 1990; Neill et al., 2013b), deuterated ammonia (Rodriguez Kuiper et al., 1978; Walmsley et al., 1987), deuterated formaldehyde (Loren & Wootten, 1985; Turner, 1990) and deuterated methanol (Mauersberger et al., 1988; Jacq et al., 1993; Peng et al., 2012). Recently, Neill et al. (2013a) used the HIFI survey, and tens of transitions, to set strong constraints in the D/H ratio of organics associated with Orion–KL. Their finding strongly suggests that D/H fractionation is inhomogenuous in this source.
In this study, we extend the HIFI study of deuterated species performed by Neill et al. (2013a, b); especially since the Herschel observations are spatially unresolved, so even with well determined column densities within the beam, there can be large deviations in the deuterium fractionation as a function of spatial position. In Section 2, we present the SMA observations to complement the HIFI analysis. In particular, we focus on formaldehyde (H2CO and HDCO). The D/H ratios of this molecule is key to obtaining a full picture of the oxygen chemistry in this region, as formaldehyde is believed to be an intermediate in the grain–surface synthesis of methanol through sequential reactions of H or D atoms with CO (see Watanabe & Kouchi, 2002; Cazaux et al., 2011; Taquet et al., 2012). Alternatively, gas phase chemistry might independently lead to the formation of formaldehyde via reactions involving CH2D+ products under warmer conditions (typically T 50K, see Wootten, 1987; Loren & Wootten, 1985). Incidentally, the tentative detection of the CH2D+ ion toward Orion-KL by Roueff et al. (2013) suggests that gas phase chemistry might be efficient for the HDCO formation. In this analysis we present the first high angular resolution image of the spatial distribution of (deuterated) formaldehyde in Orion–KL and discuss the different chemical pathways that can be involved in its formation. More specifically, results and analysis are presented in Section 3 and discussed in Section 4, with conclusions set out in Section 5.
2 Observations and data reduction
Observations of Orion-KL were carried out with the SMA222The Submillimeter Array is a joint project between the Smithsonian Astrophysical Observatory and the Academia Sinica Institute of Astronomy and Astrophysics, and is funded by the Smithsonian Institution and the Academia Sinica. (Ho et al., 2004) in its compact configuration on December 12, 2013 for about 6.75h. The phase-tracking centre was = 05h35m1420, = -05223300. The new broader-bandwidth SMA capability of the 230 GHz band was used to cover the following frequency ranges: 192.6–194.6 GHz and 197.6–199.6 GHz in LSB band and, 207.6–209.6 GHz and 212.6–214.6 GHz in the USB band. An enormous advantage of this broadband capability is the possibility to observe transitions of both HDCO and H213CO in a single tuning (see Table 1). The correlator was configured with a uniform spectral resolution over 4 GHz bandwidth in each sideband. Each 4 GHz bandwidth is divided into 48 ‘chunks’, each is further divided into 128 channels with a channel width of 0.812 MHz. The weather conditions were good and stable with an atmospheric opacity of about 0.14 at 225 GHz. The SMA data were calibrated using the MIR/IDL package333https://www.cfa.harvard.edu/cqi/mircook.html (Qi, 2007). The nearby quasars 0423013 and 0510180 were used as complex gain (phase and amplitude) calibrators.
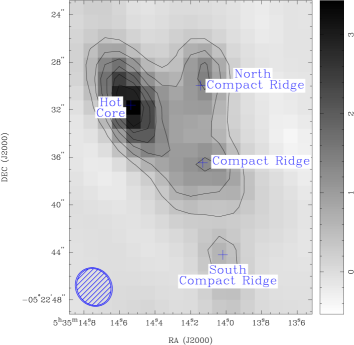
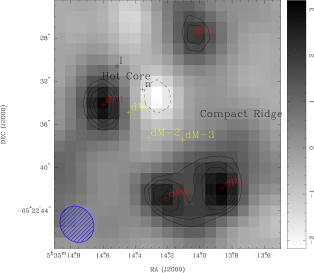
Continuum subtraction and data imaging were performed using the MIRIAD software package. The final continuum emission maps obtained at 198 GHz and 213 GHz are shown in Figure 1. They were restored using a robust weighting of 0.0, resulting in a synthesized beam size of 3.5″ 3.01″(P.A. = 32.7) at 198 GHz and of 3.2″ 2.8″(P.A. = 26.7) at 213 GHz. Positions of the four main continuum sources derived from Gaussian fits in the LSB dataset image plane are given in Figure 1. Positions of these continuum sources are commensurate between the LSB and USB data sets and, in agreement, within the synthesized beam size, with previous PdBI observations (Favre et al., 2011a).
In this analysis, we only focus on 2 emission lines of HDCO and 2 of para–H213CO (see spectroscopic parameters listed in Table 1). The spectral resolution is 1.14 km s-1 for HCO at 212/213 GHz and 1.26 km s-1 for the HDCO lines at 193 GHz. The resulting synthesized beam sizes (, P.A. = 30 ) are given in Table 1 at the different frequencies.
3 Results and analysis
3.1 Emission maps and velocity structure
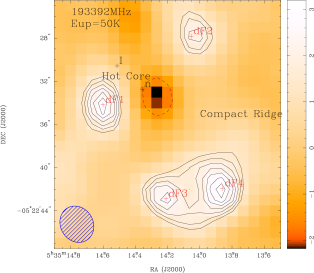
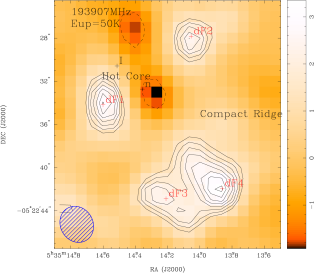
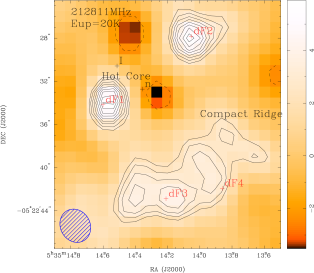
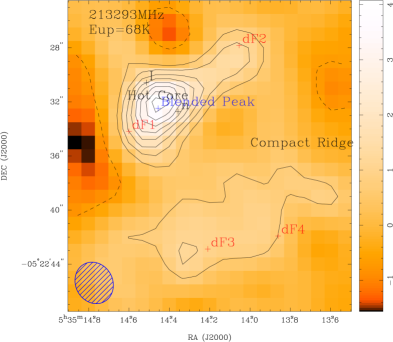
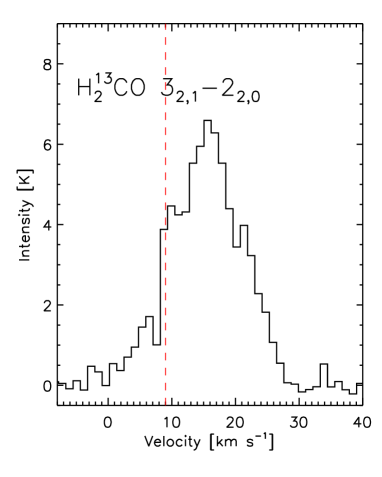
The HDCO and H213CO emission maps integrated over the line profile are shown in Figure 2. Four main molecular emission peaks, labeled dF1 to dF4, are associated with the HDCO emission. More specifically, they are located toward the left of Hot Core component (dF1), the north of the Compact Ridge (dF2) and in the quiescent ridge (dF3 and dF4) located south of the Compact Ridge. Their coordinates are given in Table 1. The regions dF1, dF2 and dF3 are also associated with the H213CO emission but not the dF4 one. Incidentally, it is important to note that the integrated emission map of the H213CO transition at 213293.57 MHz is strongly contaminated by the emission from an unidentified species toward the Hot Core region. This is shown in Fig. 3, which displays the integrated emission map along with the spectrum of this H213CO line; the latter being taken at the position of the contaminated emission peak.
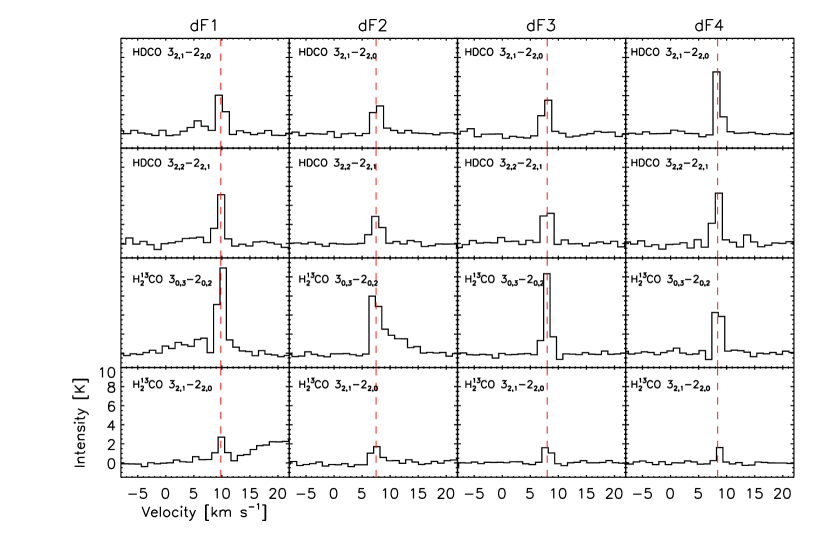
Spectra of the formaldehyde transitions observed towards the regions dF1 to dF4 are shown in Figure 4 and the observed line parameters are summarized in Table 1. The bulk of the formaldehyde emission towards those peaks appears to lie between =7.5 km s-1 and =9.8 km s-1. This result is consistent with the HDCO LSR velocity derived by Loren & Wootten (1985) toward the quiescent ridge (8.5 km s-1, single-dish Millimeter Wave Observatory observations) and by Neill et al. (2013a) toward the region (8 and 10.4 km s-1, Herschel/HIFI observations). It is important to note that Neill et al. (2013a) have associated the HDCO emission with two velocity components in Compact Ridge. This difference results from the fact that i) some complex molecules, such as methyl formate or dimethyl ether, are seen with two distinct velocity components emitting at 7.5 and 9.2 km s-1 in the Compact Ridge (e.g. Favre et al., 2011a; Brouillet et al., 2013) and that, ii) the Herschel observations are spatially unresolved. We infer that the two HDCO velocity components seen by Neill et al. (2013a), actually correspond to our HDCO emission observed toward dF3 and dF1, respectively.
3.2 Excitation temperature
Assuming optically thin emission, we use the integrated line intensity measurements of the observed H213CO transitions to derive the formaldehyde excitation temperature (Tex) within Orion–KL following Eq. 1:
| (1) |
where E, W, A, g and refer to the state energies (K), the integrated line intensities (K km s-1), the Einstein A coefficients (s-1), the statistical weights and the line frequencies (Hz) of the 32,1–22,0 (u) and 30,3–20,2 (l) transitions. It is important to note that Equation 1 cannot be directly applied to HDCO since both of the detected transitions have the same upper energy level (see Table 1). Thus, the below analysis hinges upon the assumption that Tex is the same for both HDCO and H213CO.
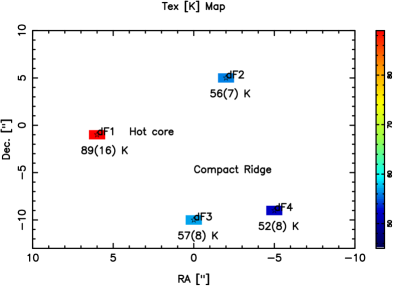
Figure 5a presents the excitation temperature map for H213CO within Orion-KL. The formaldehyde excitation temperature derived toward the dF2, dF3 and dF4 peaks is low (52–57 K, see Table 1) contrary to dF1, for which it is higher (90 K). Our derived temperatures in the quiescent ridge (i.e regions dF3 and dF4) are commensurate within the uncertainties, with the one derived by Bergin et al. (1994, 6030 K) using CH3C2H, a known tracer of ambient ridge gas. Regarding the dF2 emission peak, our derived temperature is in agreement with one of the KL–W methanol clump that lies in its vicinity (i.e 2 east, see Peng et al., 2012). As for the dF1 emission peak, there is a slight discrepancy with the temperature derived by Peng et al. (2012). In particular, these authors report a temperature that is lower than the typical temperature derived in the vicinity of this region (100–300 K, e.g. Favre et al., 2011a; Goddi et al., 2011a; Friedel & Snyder, 2008). However, looking at their Figure B.4., a 130 K temperature seems to be consistent with their data, suggesting that their error bars might have been underestimated. Overall the temperatures derived here are lower than the typical temperatures derived for organic species towards the Hot Core and Compact Ridge components associated with the inner part of Orion–KL (e.g. Crockett et al., 2014).
3.3 Column density
Assuming that i) LTE is reached, which implies that the excitation temperature is equal to the rotational temperature and, ii) the rotational temperature is the same for both HDCO and H213CO, we derive the total column density, N, by using the following equation (Goldsmith & Langer, 1999):
| (2) |
where,
The column densities derived toward the regions dF1 to dF4 for both HDCO and para–H213CO are listed in Table 1. In addition, Table 2 gives the total column densities for HDCO, H213CO and H2CO toward the dF1 to dF4 peaks. The total column densities have been calculated as follow: i) the column densities derived for the two HDCO transitions, that are listed in Table 1, have been averaged. The same applies to the two para–H213CO transitions. ii) Regarding H213CO and HDCO, we assume an ortho:para ratio of 3:1, that is commensurate with measurements performed towards Orion–KL by Kahane et al. (1984) and Crockett et al. (2014), and a 12C/13C isotopic ratio of 70 (see, Favre et al., 2014, and reference therein), that is in agreement within the error bars with previous studies (e.g. Persson et al., 2007; Stahl et al., 2008).
3.4 D/H ratios for formaldehyde
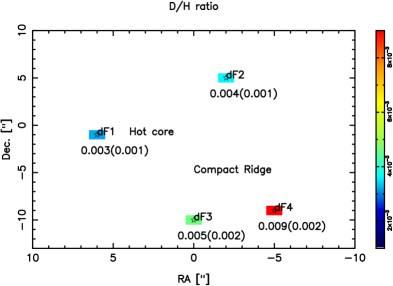
Using the total column densities for HDCO and for H213CO (see Section 3.3 and Table 2), we derive the D/H ratio for the regions dF1 to dF4. The resulting D/H ratios are given in Table 2. Figure 5b shows the distribution map of the D/H ratio for formaldehyde in Orion–KL. The HDCO/H2CO ratio is found to be 0.0090.002 toward dF4, 0.0030.001 toward dF1 and 0.0040.001 and 0.0050.002 toward dF2 and dF3, respectively. Our results are commensurate within the uncertainties with previous D/H ratio measurements in the region (e.g. Loren & Wootten, 1985; Neill et al., 2013a) and suggest a possible gradient in the HDCO/H213CO ratio at a 3 level.
4 Discussion
4.1 Anticorrelation between formaldehyde and methanol emission
A recent study by Peng et al. (2012) using the Plateau de Bure interferometer derived the D/H ratios of methanol (CH2DOH and CH3OD) at comparable resolution to our SMA observations. A notable result is that the spatial distribution of formaldehyde emission (HDCO and H213CO, see Fig. 2) clearly differs from that of (deuterated) methanol (see Fig. 3 of Peng et al., 2012). The methanol distribution follows a V-shaped structure linking the Hot Core component to the Compact Ridge (Peng et al., 2012) while formaldehyde exhibits a spatial structure which appears to surround this molecular V-shaped structure on four sides. This difference is illustrated in Figure 2 (bottom right panel) in which the deuterated methanol emission peaks identified by Peng et al. (2012) are indicated on the HDCO integrated emission map at at 193391.6 MHz. Furthermore, the D/H ratio for methanol derived by Peng et al. (2012) lies in the range 0.8–1.310-3, which is up to an order of magnitude (within the uncertainties) lower than the D/H ratio for formaldehyde derived in this study (see Table 2).
4.2 Origin of formaldehyde emission
All the nearby well–characterized sources (i.e. Hot Core, Compact Ridge) are not coincident with formaldehyde emission. In fact, it is possible and even likely that we are seeing quiescent material surrounding the hotter sources, such as the well–known quiescent ridge in Orion–KL. Incidentally, the spatial difference between the formaldehyde and methanol emission has already been observed toward others sources, such as the Horsehead Photon-Dominated Region (PDR) and its associated dense core (Guzmán et al., 2013) and the Orion Bar PDR (Leurini et al., 2006, 2010). In their respective analyses, the authors have shown that the UV radiation field affects the gas–phase abundance of formaldehyde and methanol. More specifically, the H2CO/CH3OH abundance ratio is expected to be higher in high FUV illuminated environments in comparison to denser and less illuminated regions. In this light, the entire Orion–KL quiescent ridge gas is a face–on PDR (see Lerate et al., 2008; Persson et al., 2007; Irvine et al., 1987), therefore photodissociation of gas-phase methanol into formaldehyde might occur (e.g. see, Le Teuff et al., 2000; Leurini et al., 2006, 2010). In this context we determine the abundance ratio of H2CO/CH3OH in the formaldehyde clumps. Comparison to ratios measured towards other PDRs would then illuminate whether the Orion PDR is influencing the local chemistry of dense material surrounding the hot embedded cores.
The determination of the methanol column density (see Eq. 2) relies on the assumptions that the CH3OH–E transitions listed in Table 3 are optically thin and, that the rotational temperature is the same as that of H213CO. It is important to note that toward the dF1 and dF2 emission peaks the CH3OH–E lines are strongly blended (see Figure 6), preventing us from deriving the column density of methanol at those positions. Regarding the dF3 and dF4 regions, the resulting H2CO/CH3OH abundance ratio lies in the range 3.5–4.5, that might suggest a slight decrease in the methanol abundance in the quiescent ridge. However, our derived ratio is lower by at least a factor of 3–400 in comparison to that estimated by Leurini et al. (2010) toward the Orion Bar, suggesting that the production of formaldehyde in Orion–KL through photodissociation of gas-phase methanol is not the main formation route. Finally, it is noticeable that our estimated H2CO/CH3OH abundance ratio is more consistent with that found in hot–corino regions (see Maret et al., 2004, 2005 and Guzmán et al., 2013 for a review). This finding leads us to argue that formaldehyde emission in Orion–KL is more likely probing the edge of the hot gas.
4.3 Implications: on the formaldehyde formation
Formaldehyde and methanol are believed to be formed on ice grain mantles during the pre-stellar cold phase (T50 K) from successive hydrogenation reactions of H– or D– atoms with CO (see e.g. Charnley et al., 1997; Cazaux et al., 2011; Taquet et al., 2012; Watanabe & Kouchi, 2002):
| (3) |
and
| (4) |
Laboratory experiments have shown that the sequential CO hydrogenation process (i.e. reaction 3) efficiently form both formaldehyde and methanol at low temperatures (20 K, see Fuchs et al., 2009; Watanabe et al., 2004; Hidaka et al., 2004). Thus, if methanol and formaldehyde both purely originate from ice grain mantles, the measured D/H ratio should be similar (within a factor 2) for both molecules and, in particular, these molecules should trace similar environments while desorbed as they share a common origin. This is inconsistent with our observations (see Section 4.1) and thus strongly argues in favor of differences in the chemical formation pathways of these deuterated molecules. Thus CH3OH and H2CO emission is probing different spatial regions within the central region of Orion KL that may not be coeval. We infer that a likely scenario is a HDCO production through hot gas-phase deuterium chemistry in the colder gas associated with Orion–KL, as suggested by Loren & Wootten (1985). More specifically, at relatively high temperature (T70K–100K, Öberg et al., 2012; Wootten, 1987), such as that derived in this study (see Figure 5), reaction 5 is active due to its high exothermicity (E of 654 K, see Roueff et al., 2013) and favors deuterium fractionation through reactions involving CH2D+ as a parent molecule (Favre et al., 2015).
| (5) |
In that context, reaction 5 can then lead to the formation of HDCO and H2CO (see further details in Loren & Wootten, 1985). Incidentally, the temperature of this colder region associated with Orion-KL is not sufficient enough to desorb CH3OH from the surface of icy grain mantles (T120–160 K see, Collings et al., 2004; Green et al., 2009). However, in the inner hottest part of Orion–KL where methanol emits, most of the formaldehyde might have been converted into methanol by grain surface reactions (Watanabe & Kouchi, 2002) during a colder phase prior to the explosive event. Then, upon heating methanol is released from grain surfaces into gas phase along with little formaldehyde. We stress that the release of methanol into gas–phase in this region is mainly due to internal radiation heating (i.e outflow, shock, IR sources) but not heat from the PDR (see Section 4.2). In this instance, the D/H ratio and the spatial distribution of methanol should differ from the one of formaldehyde.
5 Conclusions
We have characterized, for the first time, the spatial distribution of deuterated formaldehyde (HDCO) toward Orion–KL with an angular resolution of 3.4″ 3.0″using the SMA. The new SMA broadband capability of the 230 GHz band allowed simultaneous observation of both HDCO and H213CO within relatively sparse spectra. Four main emission peaks, labelled in this study dF1 to dF4, are identified in the formaldehyde emission image. A salient result is that the spatial distribution the emission of the HDCO and H213CO emission differ from that of CH3OH and its deuterated isotopologues. The emission maps show that methanol emits in the inner part of Orion–KL, while formaldehyde is found in the colder gas enveloping the CH3OH emission on four sides: one located left of the Hot Core (dF1), one toward the north of the Compact Ridge (dF2) and two in the quiescent ridge (dF3 and dF4). In addition, we derive a HDCO/H2CO ratio which lies in the range of 0.003 to 0.009 within the region; this value is an order of magnitude higher than the D/H measured for methanol. We suggest that the high measured D/H ratio for formaldehyde and its spatial distribution in Orion–KL are a combination of gas phase chemistry in the cooler gas associated with Orion–KL and, a conversion of formaldehyde into methanol on ice grain mantles in the earlier history of the inner part.
References
- Bally et al. (2011) Bally, J., Cunningham, N. J., Moeckel, N., et al. 2011, ApJ, 727, 113
- Bergin et al. (1994) Bergin, E. A., Goldsmith, P. F., Snell, R. L., & Ungerechts, H. 1994, ApJ, 431, 674
- Bergin et al. (2010) Bergin, E. A., Phillips, T. G., Comito, C., et al. 2010, A&A, 521, L20
- Beuther et al. (2005) Beuther, H., Zhang, Q., Greenhill, L. J., et al. 2005, ApJ, 632, 355
- Beuther et al. (2006) Beuther, H., Zhang, Q., Reid, M. J., et al. 2006, ApJ, 636, 323
- Blake et al. (1987) Blake, G. A., Sutton, E. C., Masson, C. R., & Phillips, T. G. 1987, ApJ, 315, 621
- Bocquet et al. (1999) Bocquet, R., Demaison, J., Cosléou, J., et al. 1999, Journal of Molecular Spectroscopy, 195, 345
- Brouillet et al. (2013) Brouillet, N., Despois, D., Baudry, A., et al. 2013, A&A, 550, A46
- Cazaux et al. (2011) Cazaux, S., Caselli, P., & Spaans, M. 2011, ApJ, 741, L34
- Charnley et al. (1997) Charnley, S. B., Tielens, A. G. G. M., & Rodgers, S. D. 1997, ApJ, 482, L203
- Collings et al. (2004) Collings, M. P., Anderson, M. A., Chen, R., et al. 2004, MNRAS, 354, 1133
- Comito et al. (2005) Comito, C., Schilke, P., Phillips, T. G., et al. 2005, ApJS, 156, 127
- Crockett et al. (2010) Crockett, N. R., Bergin, E. A., Wang, S., et al. 2010, A&A, 521, L21+
- Crockett et al. (2014) Crockett, N. R., Bergin, E. A., Neill, J. L., et al. 2014, ApJ, 787, 112
- Esplugues et al. (2013) Esplugues, G. B., Tercero, B., Cernicharo, J., et al. 2013, A&A, 556, A143
- Favre et al. (2015) Favre, C., Bergin, E. A., Cleeves, L. I., et al. 2015, ApJ, 802, L23
- Favre et al. (2011a) Favre, C., Despois, D., Brouillet, N., et al. 2011a, A&A, 532, A32
- Favre et al. (2011b) Favre, C., Wootten, H. A., Remijan, A. J., et al. 2011b, ApJ, 739, L12
- Favre et al. (2014) Favre, C., Carvajal, M., Field, D., et al. 2014, ApJS, 215, 25
- Friedel & Snyder (2008) Friedel, D. N., & Snyder, L. E. 2008, ApJ, 672, 962
- Friedel & Widicus Weaver (2012) Friedel, D. N., & Widicus Weaver, S. L. 2012, ApJS, 201, 17
- Fuchs et al. (2009) Fuchs, G. W., Cuppen, H. M., Ioppolo, S., et al. 2009, A&A, 505, 629
- Goddi et al. (2011a) Goddi, C., Greenhill, L. J., Humphreys, E. M. L., Chandler, C. J., & Matthews, L. D. 2011a, ApJ, 739, L13
- Goddi et al. (2011b) Goddi, C., Humphreys, E. M. L., Greenhill, L. J., Chandler, C. J., & Matthews, L. D. 2011b, ApJ, 728, 15
- Goldsmith & Langer (1999) Goldsmith, P. F., & Langer, W. D. 1999, ApJ, 517, 209
- Gómez et al. (2008) Gómez, L., Rodríguez, L. F., Loinard, L., et al. 2008, ApJ, 685, 333
- Gómez et al. (2005) —. 2005, ApJ, 635, 1166
- Green et al. (2009) Green, S. D., Bolina, A. S., Chen, R., et al. 2009, MNRAS, 398, 357
- Guélin et al. (2008) Guélin, M., Brouillet, N., Cernicharo, J., Combes, F., & Wooten, A. 2008, Ap&SS, 313, 45
- Guzmán et al. (2013) Guzmán, V. V., Goicoechea, J. R., Pety, J., et al. 2013, A&A, 560, A73
- Hidaka et al. (2004) Hidaka, H., Watanabe, N., Shiraki, T., Nagaoka, A., & Kouchi, A. 2004, ApJ, 614, 1124
- Ho et al. (2004) Ho, P. T. P., Moran, J. M., & Lo, K. Y. 2004, ApJ, 616, L1
- Irvine et al. (1987) Irvine, W. M., Goldsmith, P. F., & Hjalmarson, A. 1987, Astrophysics and Space Science Library, Vol. 134, Chemical abundances in molecular clouds, ed. D. J. Hollenbach & H. A. Thronson Jr., 561–609
- Jacq et al. (1990) Jacq, T., Walmsley, C. M., Henkel, C., et al. 1990, A&A, 228, 447
- Jacq et al. (1993) Jacq, T., Walmsley, C. M., Mauersberger, R., et al. 1993, A&A, 271, 276
- Johns & McKellar (1977) Johns, J. W. C., & McKellar, A. R. W. 1977, Journal of Molecular Spectroscopy, 64, 327
- Kahane et al. (1984) Kahane, C., Lucas, R., Frerking, M. A., Langer, W. D., & Encrenaz, P. 1984, A&A, 137, 211
- Le Teuff et al. (2000) Le Teuff, Y. H., Millar, T. J., & Markwick, A. J. 2000, A&AS, 146, 157
- Lerate et al. (2008) Lerate, M. R., Yates, J., Viti, S., et al. 2008, MNRAS, 387, 1660
- Leurini et al. (2010) Leurini, S., Parise, B., Schilke, P., Pety, J., & Rolffs, R. 2010, A&A, 511, A82
- Leurini et al. (2006) Leurini, S., Rolffs, R., Thorwirth, S., et al. 2006, A&A, 454, L47
- Loren & Wootten (1985) Loren, R. B., & Wootten, A. 1985, ApJ, 299, 947
- Maret et al. (2005) Maret, S., Ceccarelli, C., Tielens, A. G. G. M., et al. 2005, A&A, 442, 527
- Maret et al. (2004) Maret, S., Ceccarelli, C., Caux, E., et al. 2004, A&A, 416, 577
- Mauersberger et al. (1988) Mauersberger, R., Henkel, C., Jacq, T., & Walmsley, C. M. 1988, A&A, 194, L1
- Menten et al. (2007) Menten, K. M., Reid, M. J., Forbrich, J., & Brunthaler, A. 2007, A&A, 474, 515
- Müller et al. (2005) Müller, H. S. P., Schlöder, F., Stutzki, J., & Winnewisser, G. 2005, Journal of Molecular Structure, 742, 215
- Müller et al. (2000) Müller, H. S. P., Gendriesch, R., Margulès, L., et al. 2000, Physical Chemistry Chemical Physics (Incorporating Faraday Transactions), 2, 3401
- Neill et al. (2013a) Neill, J. L., Crockett, N. R., Bergin, E. A., Pearson, J. C., & Xu, L.-H. 2013a, ApJ, 777, 85
- Neill et al. (2013b) Neill, J. L., Wang, S., Bergin, E. A., et al. 2013b, ApJ, 770, 142
- Nissen et al. (2012) Nissen, H. D., Cunningham, N. J., Gustafsson, M., et al. 2012, A&A, 540, A119
- Öberg et al. (2012) Öberg, K. I., Qi, C., Wilner, D. J., & Hogerheijde, M. R. 2012, ApJ, 749, 162
- Pagani et al. (1992) Pagani, L., Salez, M., & Wannier, P. G. 1992, A&A, 258, 479
- Peng et al. (2012) Peng, T.-C., Despois, D., Brouillet, N., Parise, B., & Baudry, A. 2012, A&A, 543, A152
- Peng et al. (2013) Peng, T.-C., Despois, D., Brouillet, N., et al. 2013, A&A, 554, A78
- Persson et al. (2007) Persson, C. M., Olofsson, A. O. H., Koning, N., et al. 2007, A&A, 476, 807
- Qi (2007) Qi, C. 2007, Advances in Space Research, 40, 639
- Remijan et al. (2007) Remijan, A. J., Markwick-Kemper, A., & ALMA Working Group on Spectral Line Frequencies. 2007, BAAS, 38, 963
- Rodríguez et al. (2005) Rodríguez, L. F., Poveda, A., Lizano, S., & Allen, C. 2005, ApJ, 627, L65
- Rodriguez Kuiper et al. (1978) Rodriguez Kuiper, E. N., Kuiper, T. B. H., & Zuckerman, B. 1978, ApJ, 219, L49
- Roueff et al. (2013) Roueff, E., Gerin, M., Lis, D. C., et al. 2013, Journal of Physical Chemistry A, 117, 9959
- Schilke et al. (2001) Schilke, P., Benford, D. J., Hunter, T. R., Lis, D. C., & Phillips, T. G. 2001, ApJS, 132, 281
- Schilke et al. (1997) Schilke, P., Groesbeck, T. D., Blake, G. A., & Phillips, T. G. 1997, ApJS, 108, 301
- Stahl et al. (2008) Stahl, O., Casassus, S., & Wilson, T. 2008, A&A, 477, 865
- Taquet et al. (2012) Taquet, V., Ceccarelli, C., & Kahane, C. 2012, ApJ, 748, L3
- Tercero et al. (2010) Tercero, B., Cernicharo, J., Pardo, J. R., & Goicoechea, J. R. 2010, A&A, 517, A96
- Tercero et al. (2011) Tercero, B., Vincent, L., Cernicharo, J., Viti, S., & Marcelino, N. 2011, A&A, 528, A26+
- Turner (1990) Turner, B. E. 1990, ApJ, 362, L29
- Turner et al. (1975) Turner, B. E., Fourikis, N., Morris, M., Palmer, P., & Zuckerman, B. 1975, ApJ, 198, L125
- Walmsley et al. (1987) Walmsley, C. M., Hermsen, W., Henkel, C., Mauersberger, R., & Wilson, T. L. 1987, A&A, 172, 311
- Wang et al. (2011) Wang, S., Bergin, E. A., Crockett, N. R., et al. 2011, A&A, 527, A95+
- Watanabe & Kouchi (2002) Watanabe, N., & Kouchi, A. 2002, ApJ, 571, L173
- Watanabe et al. (2004) Watanabe, N., Nagaoka, A., Shiraki, T., & Kouchi, A. 2004, ApJ, 616, 638
- Widicus Weaver & Friedel (2012) Widicus Weaver, S. L., & Friedel, D. N. 2012, ApJS, 201, 16
- Wootten (1987) Wootten, A. 1987, in IAU Symposium, Vol. 120, Astrochemistry, ed. M. S. Vardya & S. P. Tarafdar, 311–318
- Zapata et al. (2011) Zapata, L. A., Schmid-Burgk, J., & Menten, K. M. 2011, A&A, 529, A24

| HDCO | |||||||||||||||
|---|---|---|---|---|---|---|---|---|---|---|---|---|---|---|---|
| Frequency | Transition | Eup | A | Synthesized | dF1 | dF2 | |||||||||
| 10-4 | beam | dv | Tex | N | dv | Tex | N | ||||||||
| (MHz) | (K) | (s-1) | ( ) | PA () | (K km s-1) | (km s-1) | (km s-1) | (K) | (1014cm-2) | (K km s-1) | (km s-1) | (km s-1) | (K) | (1014cm-2) | |
| 192893.26ccfootnotemark: | 30,3–20,2 | 18.5 | 1.94 | – | – | – | – | – | – | – | – | – | – | – | – |
| 193907.46 | 32,1–22,0 | 50.4 | 1.10 | 3.44 3.01 | 30 | 8.50(1.54) | 9.84(0.14) | 1.80(0.46) | 89(16) | 4.65(0.86) | 7.38(0.43) | 7.75(0.10) | 2.20(0.18) | 56(7) | 2.92(0.22) |
| 193391.61 | 32,2–22,1 | 50.4 | 1.09 | 3.47 3.02 | 30 | 9.05(0.63) | 9.65(0.10) | 1.69(0.16) | 89(16) | 4.96(0.37) | 7.07(0.35) | 7.57(0.07) | 2.40(0.15) | 56(7) | 2.80(0.18) |
| dF3 | dF4 | ||||||||||||||
| dv | Tex | N | dv | Tex | N | ||||||||||
| (K km s-1) | (km s-1) | (km s-1) | (K) | (1014cm-2) | (K km s-1) | (km s-1) | (km s-1) | (K) | (1014cm-2) | ||||||
| 192893.26ccfootnotemark: | 30,3–20,2 | 18.5 | 1.94 | – | – | – | – | – | – | – | – | – | – | – | – |
| 193907.46 | 32,1–22,0 | 50.4 | 1.10 | 3.44 3.01 | 30 | 7.13(0.98) | 7.80(0.10) | 1.71(0.32) | 57(8) | 2.77(0.42) | 11.25(1.45) | 8.61(0.05) | 1.13(0.14) | 52(8) | 4.26(0.62) |
| 193391.61 | 32,2–22,1 | 50.4 | 1.09 | 3.47 3.02 | 30 | 8.00(2.29) | 8.00(0.03) | 1.39(0.44) | 57(8) | 3.12(0.93) | 9.79(1.02) | 8.30(0.10) | 1.66(0.24) | 52(8) | 3.71(0.45) |
| (para–)HCO | |||||||||||||||
| Frequency | Transition | Eup | A | Synthesized | dF1 | dF2 | |||||||||
| 10-4 | beam | dv | Tex | N | dv | Tex | N | ||||||||
| (MHz) | (K) | (s-1) | ( ) | PA () | (K km s-1) | (km s-1) | (km s-1) | (K) | (1014cm-2) | (K km s-1) | (km s-1) | (km s-1) | (K) | (1014cm-2) | |
| 212811.18 | 30,3–20,2 | 20.4 | 2.64 | 3.17 2.75 | 30 | 17.99(1.73) | 9.88(0.09) | 1.83(0.24) | 89(16) | 5.44(0.53) | 16.04(1.37) | 7.44(0.11) | 2.54(0.29) | 56(7) | 2.83(0.26) |
| 213037.34ddfootnotemark: | 32,2–22,1 | 67.7 | 1.46 | – | – | – | – | – | – | – | – | – | – | – | – |
| 213293.57 | 32,1–22,0 | 67.7 | 1.46 | 3.15 2.75 | 30 | 5.87(0.85) | 9.89(0.19) | 2.21(0.42) | 89(16) | 5.43(0.82) | 3.84(0.40) | 7.43(0.13) | 2.16(0.30) | 56(7) | 2.83(0.35) |
| dF3 | dF4 | ||||||||||||||
| dv | Tex | N | dv | Tex | N | ||||||||||
| (K km s-1) | (km s-1) | (km s-1) | (K) | (1014cm-2) | (K km s-1) | (km s-1) | (km s-1) | (K) | (1014cm-2) | ||||||
| 212811.18 | 30,3–20,2 | 20.4 | 2.64 | 3.17 2.75 | 30 | 12.93(0.28) | 7.94(0.03) | 1.55(0.04) | 57(8) | 2.27(0.64) | 9.70(1.16) | 8.44(0.03) | 1.58(0.25) | 52(8) | 1.58(0.20) |
| 213037.34ddfootnotemark: | 32,2–22,1 | 67.7 | 1.46 | – | – | – | – | – | – | – | – | – | – | – | – |
| 213293.57 | 32,1–22,0 | 67.7 | 1.46 | 3.15 2.75 | 30 | 3.14(0.55) | 8.03(0.08) | 1.56(0.37) | 57(8) | 2.27(0.44) | 2.16(0.26) | 8.63(0.17) | 1.30(0.23) | 52(8) | 1.58(0.23) |
Note. — The HDCO emission peaks lie at the following positions: dF1 (=05h35m14601, =-05223418), dF2 (=05h35m14054, =-05222782), dF3 (=05h35m14210, =-05224288) and dF4 (=05h35m13861, =-05224192). The excitation temperature of HDCO towards those peaks is fixed and taken equal to that of H213CO as described in Section 3.2.
| Position | N(HDCO) | N(H213CO) | N(H2CO) | D/H ratio |
|---|---|---|---|---|
| (1014cm-2) | (1014cm-2) | (1016cm-2) | ||
| dF1 | 4.81(0.62) | 21.70(2.72) | 15.20(1.90) | 0.0032(0.0008) |
| dF2 | 2.86(0.20) | 11.30(1.22) | 7.92(0.86) | 0.0036(0.0006) |
| dF3 | 2.94(0.67) | 9.06(1.00) | 6.34(0.70) | 0.0046(0.0016) |
| dF4 | 3.99(0.54) | 6.34(0.85) | 4.44(0.60) | 0.0090(0.0024) |
| Frequency | Transition | Eup | A |
|---|---|---|---|
| (MHz) | (K) | (10-5 s-1) | |
| 193415.37 | 40,4 – 30,3 =0 | 36.3 | 3.03 |
| 193441.61 | 41,4 – 31,3 =0 | 28.8 | 2.84 |
| 193474.33 | 43,1 – 33,0 =0 | 70.9 | 1.33 |
| 193488.99 | 43,2 – 33,1 =0 | 85.9 | 1.33 |
| 193506.60 | 41,3 – 31,2 =0 | 44.3 | 2.91 |