BATC 15 BAND PHOTOMETRY OF THE OPEN CLUSTER NGC 188
Abstract
This paper presents CCD multicolour photometry for the old open cluster NGC 188. The observations were carried out as a part of the Beijing–Arizona–Taiwan–Connecticut Multicolour Sky Survey from 1995 February to 2008 March, using 15 intermediate-band filters covering 3000–10000 Å. By fitting the Padova theoretical isochrones to our data, the fundamental parameters of this cluster are derived: an age of Gyr, a distant modulus of , and a reddening of . The radial surface density profile of NGC 188 is obtained by star count. By fitting the King model, the structural parameters of NGC 188 are derived: a core radius of , a tidal radius of , and a concentration parameter of . Fitting the mass function to a power-law function , the slopes of mass functions for different spatial regions are derived. We find that NGC 188 presents a slope break in the mass function. The break mass is . In the mass range above , the slope of the overall region is . The slope of the core region is , and the slopes of the external regions are and , respectively. In the mass range below , these slopes are , , , and , respectively. The mass segregation in NGC 188 is reflected in the obvious variation of the slopes in different spatial regions of this cluster.
Subject headings:
open cluster and association: individual (NGC 188) – stars: fundamental parameters – stars: luminosity function, mass function1. Introduction
Open clusters are important tools to investigate the Galaxy evolution and stellar evolution. Due to their accurate parameters (e.g. age, metallicity, and distance), open clusters can probe the Galactic disk and trace the Galaxy evolution. For example, Chen et al. (2003) compiled the most complete open cluster sample with metallicity, age, and distance data, as well as kinematic information, available, and presented some statistical analysis on spatial and metallicity distributions. Their result supports the inside-out Galactic disk formation mechanism, in which the invoked star formation rate and infall timescale vary with radius. Bonatto et al. (2006) used a sample consisting of 654 open clusters to determine the thin-disk scale height, displacement of the Sun above the Galactic plane, scale length and the open cluster age-distribution function. The dynamical state of open clusters is complexly determined by the primordial gas expulsion, stellar evolution, dynamics, and the effect of Galactic tidal field (Kroupa, 2001a; Wu et al., 2007; Bonatto et al., 2005): (1) the primordial expulsion of gas unbinds most of cluster, but a significant fraction of it can condense by two-body interactions to became an open cluster; (2) stellar evolution at the early phase causes large mass loss that will result in the disruption of open clusters; (3) internal dynamical evolution will result in mass segregation and evaporation of low mass star, and (4) the Galactic tidal force will strip the stars from the open cluster. Therefore, the detailed study of the dynamical state of open clusters can examine the stellar evolution theory and Galactic dynamics as well as map the Galactic tidal field. The accurate and precise fundamental parameters, structural parameters and mass function are the cornerstone for these investigations.
The photometric system of the Beijing–Arizona–Taiwan–Connecticut (BATC) Multicolour Survey consists 15 intermediate-band filters which cover the wavelength range . This system is designed to avoid most of the known bright and variable night-sky emission lines, and it is suitable to derive spectral energy distributions (SEDs) of objects. Before February 2006, a Ford Aerospace thick CCD camera was applied, which has a pixel size of 15 and a field of view of , resulting in a resolution of . After February 2006, a new CCD with a pixel size of 12 m was used with a resolution of pixel-1 (Fan et al., 2009). Due to the large field of view and deep photometry of the BATC photometric system, it is suitable for investigating open clusters in the Milky Way. The BATC photometric system has been used to study the membership determination, fundamental parameters, structural parameters and mass function of open clusters such as M67, M48, and NGC 7789 (Fan et al., 1996; Wu et al., 2005, 2006, 2007). In this paper we will study an old open cluster NGC 188 based on the BATC photometric data. We will derive the fundamental parameters and structural parameters, and discuss the mass function and dynamical state for this open cluster.
The old open cluster NGC 188 has once been regarded as the oldest open cluster in the Milky Way. Old open clusters are important to understand the early history of the Milky Way. Owing to its special location and , NGC 188 is less contaminated and easy to be observed. Therefore, since from Sandage (1962) many works about NGC 188 have been done. Works about the fundamental parameters of this cluster are listed in Table 1 of Fornal et al. (2007) and Table 1 of this paper. From these tables we can see that many methods are used to derive the fundamental parameters, and the results are somewhat different. The age of NGC 188 is from 4.3 Gyr to 16 Gyr, the metallicity is from to , the reddening value is from to , and the distance is from 1275 pc to 2047 pc. We consider that, one hand, these scatters result from the reddening-metallicity degeneracy. On the other hand, it reflects that different stellar evolutionary models and different photometric data will derive different results. In addition, quite some works adopted solar metallicity to NGC 188 and derived the other parameters based on this metallicity. Based on the BATC photometric data, we will try to find a method to avoid the reddening-metallicity degeneracy. The color-color diagram based on the photometric data in the four BATC bands performs well to this purpose for NGC 188. Bonatto et al. (2005) has derived the structural parameters and mass function (MF), and studied the dynamical evolution of NGC 188 in detail. In addition, till now only Bonatto & Bica (2005) and Bonatto et al. (2005) studied the MF break of NGC 188, however, because of not deep photometry, Bonatto & Bica (2005) and Bonatto et al. (2005) did not observe the MF break of NGC 188. So, in this paper, we will study the dynamical evolution of NGC 188 based on our deeper photometry.
We describe our new observational data and photometric reduction of NGC 188 in Section 2. In Section 3 we derive the fundamental parameters of NGC 188. The structure of NGC 188 is discussed in Section 4. The MF and the mass segregation are discussed in Section 5. A summary is presented in Section 6.
2. Observation and photometric data
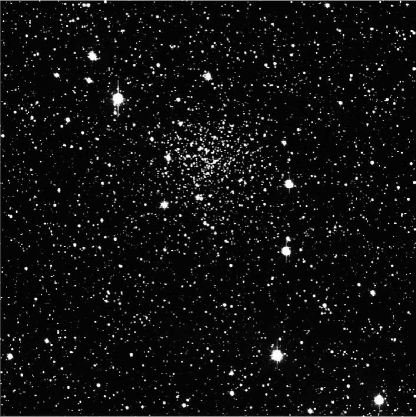

Our observations are based on the BATC photometric system. The BATC photometric system utilizes the 60/90 cm f/3 Schmidt telescope which is at the Xinglong Station of the National Astronomical Observatories, China Academy of Sciences (NAOC). Figure 1 shows the image of NGC 188 in the BATC band. The details of the BATC system are described in Yan et al. (2000) and Zhou et al. (2001). In Table 2, we list the corresponding effective wavelength and full width at half maximum (FWHM) of each filter, and exposure time and the number of frames observed in each filter for our observation.
Data reductions are carried out by two procedures called PIPELINE I and PIPELINE II. These procedures are developed as standard for the BATC photometric system. Bias subtraction and field flatting are carried out by PIPELINE I. Instrumental magnitudes of point sources are determined by PIPELINE II. After that, the instrumental magnitudes are calibrated to the BATC standard system (Zhou et al., 2003). For each filter, the average calibration error is below 0.02 mag. For every image, the mean of the FWHM of the point spread function (PSF) is , which critically samples ( pixels) the PSF. So, the effect of undersampling on our photometric accuracy is not critical. For each star observed more than once in a BATC band, the final photometric result in that band is the weighted mean.
3. Fundamental parameters for NGC 188
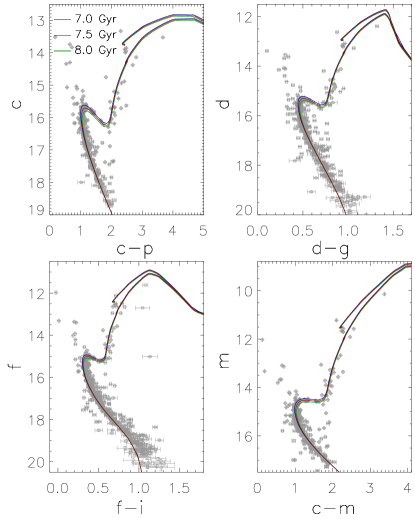
We adopt the proper-motion membership probabilities in Table 3 of Platais et al. (2003) for NGC 188. Matching this table and our star catalog, we pick up the common stars, which are plotted in Figure 2. In this paper, stars whose proper-motions membership probabilities greater than are used to derive the fundamental parameters. We used the photometric data in the seven BATC bands to construct four color-magnitude diagrams (CMDs). These combinations are vs. , vs. , vs. , and vs. . We fit the theoretical BATC isochrones (see Section 3.2) to our observational data of NGC 188 to derive the fundamental parameters.
3.1. Isochrones of stellar evolutionary models
Stellar evolutionary models from the Padova group (Bertelli et al., 1994; Girardi et al., 2000, 2002, and references therein) are widely used. In the Padova stellar evolutionary models, Girardi et al. (2002) provided tables of theoretical isochrones in such photometric systems as ABmag, STmag, VEGAmag, and a standard star system. The complete data-base (Girardi et al., 2002) covers a very large range of stellar masses (typically from 0.6 to ). These models (Girardi et al., 2002, 2008) are computed with updated opacities and equations of state, and moderate amount of convective overshoot. However, the isochrones are presented for only 6 initial chemical compositions: , , , , (solar metallicity), and , which are evidently not dense enough. It is fortunate that Marigo et al. (2008) provide tables for any intermediate value of age and metallicity via an interactive web interface 111http://stev.oapd.inaf.it/cmd.
3.2. Isochrone fitting
To determine the main characteristics of the population in NGC 188, we fit isochrones to the cluster CMD. We used the Padova theoretical isochrones in the BATC system (Marigo et al., 2008). Via an interactive web interface (see Section 3.1), we can construct a grid of isochrones for different values of age and metallicity, photometric system, and dust properties. We use the default models that involve scaled solar abundance ratios (i.e., ). In performing, the Chabrier lognormal initial mass function (IMF) (Chabrier, 2001) is adopted.
3.2.1 Reddening
To determine the reddening value of an open cluster, a method based on the color-color diagram fitting is usually used. However, in this method, the degeneracy between reddening and metallicity requires that the metallicity is previously known. For instance, adopting the metallicity of for NGC 188, Sarajedini et al. (1999) obtained NGC 188’s reddening to be based on the color-color diagram and the Hyades fiducial sequence. Assuming a solar metallicity for NGC 188, Fornal et al. (2007) obtained NGC 188’s reddening to be based on the and color-color diagram and the Girardi et al. (2004) SDSS isochrones.
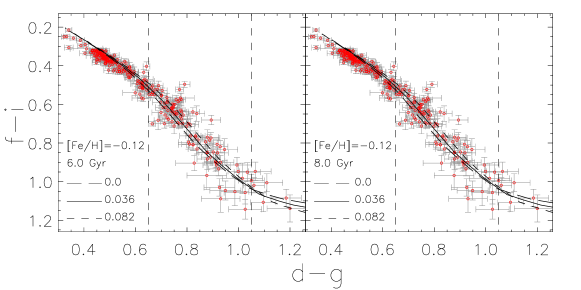
We derive the reddening of NGC 188. Table 1 of Fornal et al. (2007) and Table 1 of this paper list the metallicities of NGC 188 obtained from spectral analysis, which are between and . We adopted these two values of metallicity to derive the reddening of NGC 188 on the and color-color diagram. In addition, the resent results showed that the age of NGC 188 is between 6.0 and 8.0 Gyr (see Section 3.3 for details). In this paper, the reddening is transformed to each BATC band using the extinction coefficient derived by Chen (2000) based on the procedure given in Appendix B of Schlegel et al. (1998).
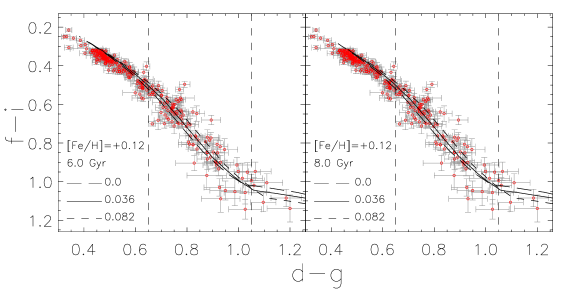
Figure 3 shows the result obtained for three values of reddening , 0.036, and 0.082 (). In the left and right panels, the BATC isochrones are for 6.0 and 8.0 Gyr, respectively. In Figure 3, the two vertical dashed lines represent the main-sequence band between and 1.05, which is the region where the data and isochrones should fit best. From Figure 3, we can see that the best fit of the BATC isochrone to the data points was obtained for . Figure 4 shows the result as Figure 3 did, but for . From Figure 4, we can also see that the best fit of the BATC isochrone to the data points was obtained for . As a result, we arrived at a reddening value of for NGC 188, where the quoted uncertainty only includes an estimate of the error in the reddening determination.
3.2.2 Metallicity, age, and distance modulus
Since the value of reddening has been fixed, we go ahead to determine the other parameters of NGC 188 in the CMDs. Because of the age-metallicity degeneracy, we cannot simultaneously determine age and metallicity by the fitting method. We adopt a value of metallicity in Friel et al. (2010), which was obtained from spectral analysis of red giants of NGC 188. Now, fitting the theoretical isochrone to our color-magnitude data points became straightforward. First, we chose the age for which the fitted isochrone had the same color of the turn-off as our data points. Then, by shifting the isochrone up and down (changing the distance modulus), we finally obtained the best fit.
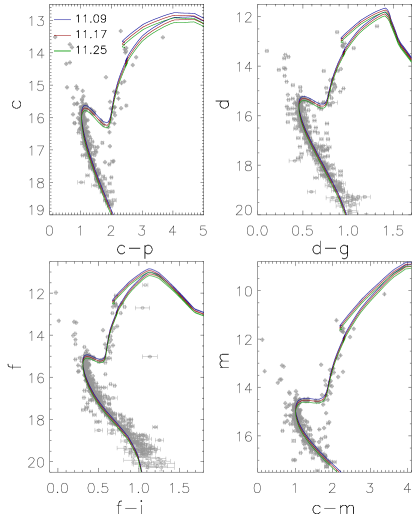
Based on the age obtained by the previous works (see Table 1 of this paper and Table 1 of Fornal et al. 2007 in detail), we used the interactive web in Section 3.1 to construct a fine grid of isochrones about ages, sampling an age range Gyr at intervals of 0.1 Gyr. The metallicity where , so this metallicity corresponds to . Using this fine grid of isochrones, we obtained the fundamental parameters of NGC 188. A set of the best fitting parameters for our data is adopted as follows: an age of Gyr, and a distance modulus of . The error of the age of NGC 188 is estimated by eye in the CMDs. Figure 5 shows a set of CMDs in the BATC system for NGC 188. From Figure 5, we can give an estimate of the error of age to be Gyr. The error of the distance modulus is also estimated by eye in the CMDs. Figure 6 shows a set of CMDs in the BATC system for NGC 188. From Figure 6, we can give an estimate of the error of distance modulus to be .
3.3. Comparing with previous works
We compare our best fitting parameters for NGC 188 with those of previous studies in the past two decade. For reddening , many works (see Table 1 of Fornal et al. 2007) obtained the values of reddening to be larger than . Our best fitting result of is in very agreement with those in Carraro et al. (1994), who obtained the values of reddening to be 0.03 and 0.04. Our result is also consistent with that of Fornal et al. (2007), who obtained the value of reddening to be . For age, our best fitting of Gyr is consistent with those of Carraro et al. (1994), Sarajedini et al. (1999), and Fornal et al. (2007), who obtained the ages of NGC 188 to be 7.5 Gyr and 7.0 Gyr, Gyr, and Gyr, respectively. For distance modulus , our best fitting of (or ) is consistent with those of Carraro et al. (1994), Sarajedini et al. (1999), and Fornal et al. (2007), who obtained the distances of NGC 188 to be and , , and , respectively.
4. Structural parameters of NGC 188
The structure of a cluster is described by means of the radial surface density profile, which is defined as the projected number of stars per area in the direction of the cluster. In this paper we adopt the empirical formula derived by King (1962) to fit the radial surface density profile of NGC 188.
In order to enlarge the number of member stars of NGC 188, we used the SED fitting method developed by Wu et al. (2006) to search more member stars. For the th star, a parameter can be defined:
| (1) |
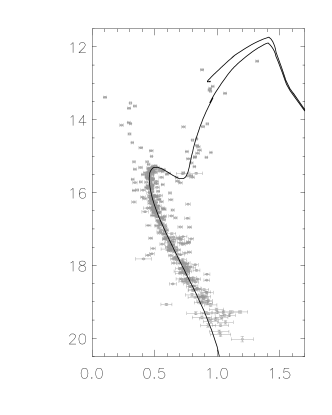
where is the theoretical magnitude in the th BATC band, corrected by the distance modulus and reddening and computed from the chosen theoretical isochrone model with the age and metallicity . The values of , , , and have been obtained in Section 3. Here and are the observed magnitude and its error, respectively, of the th star in the th band, and is the total number of observed bands for the th star. For with different stellar masses, the minimum of , , can be obtained for the th star with the chosen theoretical model. If the observed SEDs can match the theoretical SEDs, the parameter should be the distribution with degrees of freedom, where is the number of free parameters to be solved. The integral probability at least as large as in the distribution with degrees of freedom is taken as the “photometric“ membership probability of the th star (Wu et al., 2006). We determine 2131 stars to be photometric members with greater than . The versus CMD of these stars are shown in Figure 7.
We used these 2131 member stars to determine the radial surface density profile of NGC 188. We adopted the central position for NGC 188 at and (J2000.0) following Bonatto et al. (2005). The radial surface density profile is determined by counting stars inside concentric annuli with a step of in radius of and counting stars inside concentric annuli with a step of in radius of . The radial surface density profile of NGC 188 is shown in Figure 8. The fit has been performed using a non-linear least-square fit routine which uses the 1 Poisson errors as weights. The fitted structural parameters obtained here are as follows: a core radius of , a tidal radius of , and a concentration parameter of . With the distance to the Sun obtained in Section 3, the core radius and tidal radius of NGC 188 turn out to be and , respectively. The fitting curves are shown in Figure 8 with solid lines. As shown in Figure 8, the radial surface density profile is reproduced well by the King model within uncertainties.
We compare our structural parameters for NGC 188 with those of previous studies. For the core radius , our best fitting result of is somewhat larger than that of Bonatto et al. (2005), who obtained the value of core radius to be . However, our result is somewhat smaller than that of Chumak et al. (2010), who obtained the value of core radius to be . The tidal radius of obtained here is somewhat larger than that in Keenan et al. (1973), who obtained the tidal radius of NGC 188 to be . Our result is consistent with that in Bonatto et al. (2005), who obtained the tidal radius of NGC 188 to be . And our result is smaller than that in Chumak et al. (2010), who derived the tidal radius of NGC 188 to be .

5. Mass function of NGC 188
Since a large field of view of NGC 188 is observed here, we have an opportunity to study the MF and the mass segregation for NGC 188. The member stars of NGC 188 obtained here by the SED fitting method is used. In addition, we take the stars below the main-sequence turn-off to derive MF. We used stars with greater than to avoid the field-star contamination. In order to study the mass segregation of NGC 188, we must know the mass functions in different regions. We select the core region (), , , and the whole region (). Completeness estimation is necessary to obtain the MF of NGC 188. We used artificial-star tests on our data to determine completeness corrections as Wu et al. (2007) did. The completeness correction for the whole region and for three different regions of NGC 188 are listed in Table 3 for the BATC band. In the mass functions we included only the values for which the completeness corrections are 0.5 or higher for all regions in NGC 188. Therefore, limiting magnitude is adopted. After correcting for completeness, the mass functions for different regions of NGC 188 were obtained, which are shown in Figure 9.
In Figure 9, the MF break is obvious. The break mass is determined to be near . The MF break of clusters essentially reflects the internal dynamics of clusters on the mass function and/or some fundamental properties of the initial mass function associated to different conditions in star formation (Bonatto & Bica, 2005). The power-law function is used to fit the MF. The fit has been performed using a non-linear least-square fit routine which uses the 1 Poisson errors as weights. The best fitting power-law functions are shown in Figure 9 with solid lines, and the slopes are listed in Table 4. In the fitting of the core region, we did not use the point which only includes one member star. The slope of MF is flat in the core region and become steeper as the distance increases, which reflects the mass segregation of NGC 188. The overall MF slope in the mass range is much flatter than the universal IMF in the mass range (Kroupa, 2001b, 2002). This flat slope reflects the advanced dynamical state of NGC 188. The number of stars for NGC 188 can be estimated by the power-law function. We derived the number of stars in NGC 188 based on the power-law function obtained here to be 5776. Based on the number of stars obtained here, we can estimate the relaxation time of NGC 188. The relaxation time is calculated according to this formula , where is the cross time, is the number of stars, and is the velocity dispersion (Binney & Tremaine, 2008). We adopted a typical from Binney & Merrifield (1998), and the relaxation time of NGC 188 is . The ratio of the cluster age to the relaxation time is . Therefore, NGC 188 is in the advanced dynamical state. Many number of low mass stars have been evaporated and stripped from this open cluster.

6. Summary
In this paper, we present photometry of NGC 188 in 15 intermediate-band filters of the BATC system. By fitting the theoretical isochrones to the observational data points, we determined three fundamental parameters for NGC 188: a reddening of , an age of Gyr, and a distance modulus of .
Based on the SED fitting method developed by Wu et al. (2006), we obtained a sample of NGC 188 member stars consisting of 2131 stars with greater than . We determined the radial surface density profile of NGC 188 using this sample. By fitting the empirical density law of King (1962) to our radial surface density profile, the structural parameters of NGC 188 are derived: a core radius of , a tidal radius of , and a concentration parameter of .
We studied the details of mass function of NGC 188 based on the photometry which are obtained in a large field of view and deep observation. The MF is fitted with a power-law function, and the slopes of mass functions in different regions are derived. The MF slopes flatten from the outskirts to the inner regions which indicates mass segregation in NGC 188. The MF break in NGC 188 is observed, and the break mass is . We also derived the number of stars and the relaxation time. The mass segregation and the large ratio of the cluster age to the relaxation time indicate that NGC 188 has gone strong dynamical evolution.
References
- Binney & Merrifield (1998) Binney, J., & Merrifield, M. 1998, in Galactic Astronomy (Princeton, NJ: Princeton University Press), Princeton serise in astrophysis, QB857.B522
- Binney & Tremaine (2008) Binney, J., & Tremaine, S. 2008, in Galactic Dynamics (Princeton, NJ: Princeton University Press)
- Bertelli et al. (1994) Bertelli, G., Bressan, A., Chiosi, C., Fagotto, F., & Nasi, E. 1994, A&AS, 106, 275
- Bonatto & Bica (2005) Bonatto, C., & Bica, E. 2005, A&A, 437, 483
- Bonatto et al. (2005) Bonatto, C., Bica, E., & Santos. J. F. C. 2005, A&A, 433, 917
- Bonatto et al. (2006) Bonatto, C., Kerber, L. O., Bica, E., & Santiago, B. X. 2006, A&A, 446, 121
- Carraro et al. (1994) Carraro, G., Chiosi, C., Bressan, A., & Bertelli, G. 1994, A&A, 103, 375
- Chabrier (2001) Chabrier, G. 2001, ApJ, 554, 1274
- Chumak et al. (2010) Chumak, Y. O., Platais, I., McLaughlin, D. E., Rastorguev, A. S., & Chumak, O. V. 2010, MNRAS, 402, 1841
- Chen (2000) Chen, A. 2000, Ph.D. thesis, Natl. Cent. Univ.
- Chen et al. (2003) Chen, L., Hou, J.-L., & Wang, J.-J. 2003, AJ, 125, 1397
- Fan et al. (1996) Fan, X., Burstein, D., Chen, J.-S., et al. 1996, AJ, 112, 628
- Fan et al. (2009) Fan, Z., Ma, J., & Zhou, X. 2009, Res. Astron. Astrophys., 9, 993
- Fornal et al. (2007) Fornal, B., Tucker, D. L., Smith, J. A., Allam, S. S., Rider, C. J., & Sung, H. 2007, AJ, 133, 1409
- Friel et al. (2010) Friel, E. D., Jacobson, H. R., & Pilachowski, C. A. 2010, AJ, 139, 1942
- Girardi et al. (2000) Girardi, L., Bressan, A., Bertelli, G., & Chiosi, C. 2000, A&AS, 141, 371
- Girardi et al. (2002) Girardi, L., Bertelli, G., Bressan, A., et al. 2002, A&A, 391, 195
- Girardi et al. (2008) Girardi, L., Dalcanton, J., Williams, B., et al. 2008, PASP, 120, 583
- Girardi et al. (2004) Girardi, L., Grebel, E. K., Odenkirchen, M., & Chiosi, C. 2004, A&A, 422, 205
- Jacobson et al. (2011) Jacobson, H. R., Pilachowski, C. A., & Friel, E. D. 2011, AJ, 142, 59
- Keenan et al. (1973) Keenan, D. W., Innanen, K. A., & House, F. C. 1973, AJ, 78, 173
- King (1962) King, I. 1962, AJ, 67, 471
- Kroupa (2001a) Kroupa, P. 2001, ASPC, 243, 387
- Kroupa (2001b) Kroupa, P. 2001, MNRAS, 322, 231
- Kroupa (2002) Kroupa, P. 2002, Science, 295, 82
- Marigo et al. (2008) Marigo, P., Girardi, L., Bressan, A., Groenewegen, M. A. T., Silva, L., & Granato, G. L. 2008, A&A, 482, 883
- Meibom et al. (2009) Meibom, S., Grundahl, F., Clausen, J. V., et al. 2009, AJ, 137, 5086
- Platais et al. (2003) Platais, I., Kozhurina-Platais, V., Mathieu, R., Girard, T. M., & van Altena, W. F. 2003, AJ, 126, 2922
- Sandage (1962) Sandage, A. 1962, ApJ, 135, 333
- Sarajedini et al. (1999) Sarajedini, A., von Hippel, T., Kozhurina-Platais, V., & Demarque, P. 1999, AJ, 118, 2894
- Schlegel et al. (1998) Schlegel, D. J., Finkbeiner, D. P., & Davis, M. 1998, ApJ, 500, 525
- Vandenberg & Stetson (2004) Vandenberg, D. A., & Stetson, P. B. 2004, PASP, 116, 997
- Worthey & Jowett (2003) Worthey, G., & Jowett, K. J. 2003, PASP, 115, 96
- Wu et al. (2005) Wu, Z.-Y., Zhou, X., Ma, J., Jiang, Z.-J., & Chen, J.-S. 2005, PASP, 117, 32
- Wu et al. (2006) Wu, Z.-Y., Zhou, X., Ma, J., Jiang, Z.-J., & Chen, J.-S. 2006, PASP, 118, 1104
- Wu et al. (2007) Wu, Z.-Y., Zhou, X., Ma, J., Jiang, Z.-J., Chen, J.-S., & Wu, J.-H. 2007, AJ, 133, 2061
- Yan et al. (2000) Yan, H., Burstein, D., Fan, X.-H., et al. 2000, PASP, 112, 691
- Zhou et al. (2001) Zhou, X., Jiang, Z.-J., Xue, S.-J., Wu, H., Ma, J., & Chen, J.-S. 2001, Chinese Astron. Astrophys., 1, 372
- Zhou et al. (2003) Zhou, X., Jiang, Z.-J., Ma, J., et al. 2003, A&A, 397, 361
| Reference | Distance Modulus | Distance | Age | Technique | ||
| (pc) | (Gyr) | (mag) | ||||
| Fornal et al.(2007) | (adopted) | photometry,Girardi isochrone fits | ||||
| Meibom et al.(2009) | (adopted) | (adopted) | Analysis of eclipsing binaries | |||
| Friel et al.(2010) | … | … | … | … | High-resolution spectral analysis of red giants | |
| Jacobson et al.(2011) | … | … | … | … | High-resolution spectral analysis | |
| This work | (adopted) | BATC multi-color photometry, isochrone fits |
| Number | Filter Name | FWHM | Exposure | Number of Images | |
|---|---|---|---|---|---|
| (Å) | (Å) | (s) | |||
| 1 | |||||
| 2 | |||||
| 3 | |||||
| 4 | |||||
| 5 | |||||
| 6 | |||||
| 7 | |||||
| 8 | |||||
| 9 | |||||
| 10 | |||||
| 11 | |||||
| 12 | |||||
| 13 | |||||
| 14 | |||||
| 15 |
| 0.91 | 0.37 | 0.92 | 0.91 | |
| 0.92 | 0.56 | 0.93 | 0.92 | |
| 0.96 | 0.96 | 0.97 | 0.97 | |
| 0.91 | 0.90 | 0.92 | 0.92 | |
| 0.83 | 0.82 | 0.84 | 0.84 | |
| 0.68 | 0.69 | 0.69 | 0.69 | |
| 0.53 | 0.64 | 0.56 | 0.56 | |
| 0.13 | 0.47 | 0.14 | 0.14 |
| Distance | ||
|---|---|---|