The spectral energy distribution of galaxies at : Implications from the Herschel/SPIRE color-color diagram
We use the Herschel SPIRE color-color diagram to study the spectral energy distribution (SED) and the redshift estimation of high-z galaxies. We compiled a sample of 57 galaxies with spectroscopically confirmed redshifts and SPIRE detections in all three bands at , and compared their average SPIRE colors with SED templates from local and high-z libraries. We find that local SEDs are inconsistent with high-z observations. The local calibrations of the parameters need to be adjusted to describe the average colors of high-z galaxies. For high-z libraries, the templates with an evolution from z=0 to 3 can well describe the average colors of the observations at high redshift. Using these templates, we defined color cuts to divide the SPIRE color-color diagram into different regions with different mean redshifts. We tested this method and two other color cut methods using a large sample of 783 Herschel-selected galaxies, and find that although these methods can separate the sample into populations with different mean redshifts, the dispersion of redshifts in each population is considerably large. Additional information is needed for better sampling.
Key Words.:
Galaxies:evolution - Galaxies:high-redshift - Infrared:galaxies1 Introduction
The Herschel Space Observatory, with its 3.5 meter mirror and the two PACS (Poglitsch et al., 2010) and SPIRE (Griffin et al., 2010) instruments, covers the electromagnetic spectrum from 55 to 672 m. Herschel provides us with an unprecedented chance to study the infrared (IR) emission of galaxies. The SPIRE instrument is able to detect galaxies up to quite high redshift ( to ), where the , and m bands of SPIRE corresponds to the peak of the IR spectral energy distribution (SED) of star-forming galaxies. The combination of the three band fluxes provide constraints on the shape of IR SEDs of these high-z objects and on physical parameters like the dust temperature or the dust mass (e.g., Amblard et al., 2010; Chapman et al., 2010; Magnelli et al., 2010; Roseboom et al., 2012).
The identification of IR sources and the measure of their redshift are challenging at . The obscuration of these high-z IR luminous galaxies makes their optical emission very faint and hard to detect. The large beam size of SPIRE also makes the cross-matching with optical sources very difficult. As a consequence, acquiring spectroscopic or photometric redshifts from optical bands is not possible for most of these sources. Submillimeter spectroscopic redshifts can be used for these high-z IR sources: the redshifts of most spectroscopically confirmed high-z sources are measured in this way (e.g., Riechers et al., 2013; Dowell et al., 2014). However, the method is not yet efficient enough to obtain redshifts for large galaxy samples (Casey et al., 2014). Consequently, it is certainly useful to directly estimate redshifts for large samples of galaxies only detected in IR.
The IR data from alone are not sufficient to provide reliable photometric redshifts for individual galaxies, but they can be useful in providing redshift distributions of large samples and candidates for follow-up spectroscopic observations. Several works have been dedicated to presenting methods to select high-z candidates using the SPIRE data (e.g., Amblard et al., 2010; Pope & Chary, 2010; Roseboom et al., 2012). Based on the redshift distributions of IR galaxies on a SPIRE color-color diagram, a color cut is applied to select high-z and low-z galaxy populations (e.g., Amblard et al., 2010; Pope & Chary, 2010; Riechers et al., 2013; Dowell et al., 2014). All these works are based on modified blackbody (MBB) models to model the IR emission. It is necessary to reinvestigate this topic with updated libraries of more sophisticated IR SED templates, which are now available using Herschel observations.
Empirical template of IR SEDs (m) are widely used to derive the total IR luminosity, the SFR, and the dust properties of galaxies. Prior to Herschel, local templates were built based on IRAS, ISO, SCUBA, or Spitzer (e.g., Chary & Elbaz, 2001; Dale & Helou, 2002; Draine & Li, 2007; Rieke et al., 2009). Adding Herschel data, recent studies have constructed new IR templates for low- and high-redshift objects (Elbaz et al., 2011; Smith et al., 2012b; Magdis et al., 2012; Ciesla et al., 2014). However, there are still no IR SED templates for galaxies at . Numerous studies still use local templates or MBB models when deriving the properties of very distant galaxies (e.g., Cox et al., 2011; Conley et al., 2011; Combes et al., 2012; Huang et al., 2014; Robson et al., 2014).
To obtain a clearer and up-to-date view of where we stand in this post-Herschel era, we compare the SED templates from different libraries with a sample of high-z galaxies that have spectroscopic redshifts and reliable SPIRE flux measurements. We attempt to find the SED templates that can best describe the average SPIRE colors of high-z galaxies. Through a comparison with the local calibrations, we can test the evolution of the galaxy populations. In addition, we examine whether different redshift populations could be separated by using a SPIRE color-color diagram.
The paper is organized as follows. We first introduce the samples and the SED libraries used in this study in Sections 2 and 3. We compare SED templates with observed high-z data on a color-color diagram at different redshifts in Section 4. In Section 5 we discuss the possible influence of the detection limits of SPIRE observations and the ability of applying SPIRE color cuts to select high-z galaxies. The main conclusions are summarized in Section 6.
Throughout this paper, [mJy] means the flux density at m. The IR luminosity [] is integrated from to m of the spectrum. The –cosmology is adopted: =0.3, =0.7, and = km s-1 Mpc-1.
2 Sample
2.1 A spectroscopically confirmed sample of galaxies at
| Reference | Objects | z | [mJy] | [mJy] | [mJy] | a𝑎aa𝑎aIR luminosity derived using DH02 template fitting, uncorrected for lensing magnification. | |
|---|---|---|---|---|---|---|---|
| Weiss+2013 | SPT0103-45 | 3.0917 | 121.015.0 | 210.023.0 | 222.024.0 | 13.84 | 1.0 |
| Weiss+2013 | SPT0345-47 | 4.2958 | 242.025.0 | 279.029.0 | 215.023.0 | 14.3 | 1.0 |
| Weiss+2013 | SPT0346-52 | 5.6559 | 136.016.0 | 202.022.0 | 194.021.0 | 14.36 | 5.4 |
| Weiss+2013 | SPT0418-47 | 4.2248 | 115.014.0 | 189.020.0 | 187.020.0 | 14.08 | 21.0 |
| Weiss+2013 | SPT0441-46 | 4.4771 | 62.010.0 | 98.012.0 | 105.013.0 | 13.87 | 1.0 |
| Weiss+2013 | SPT0459-59 | 5.7993 | 35.010.0 | 54.010.0 | 61.011.0 | 13.83 | 1.0 |
| Weiss+2013 | SPT0529-54 | 3.3689 | 74.013.0 | 137.017.0 | 162.019.0 | 13.75 | 9.4 |
| Weiss+2013 | SPT0532-50 | 3.3988 | 214.023.0 | 269.028.0 | 256.027.0 | 14.08 | 1.0 |
| Weiss+2013 | SPT2103-60 | 4.4357 | 43.010.0 | 72.011.0 | 108.015.0 | 13.81 | 1.0 |
| Weiss+2013 | SPT2146-55 | 4.5672 | 58.012.0 | 79.014.0 | 82.014.0 | 13.8 | 1.0 |
| Weiss+2013 | SPT2147-50 | 3.7602 | 73.012.0 | 114.014.0 | 116.015.0 | 13.77 | 1.0 |
| Weiss+2013 | SPT0113-46 | 4.2328 | 228 | 5410 | 8211 | 13.63 | 1.0 |
| Weiss+2013 | SPT0125-47 | 2.51480 | 78579 | 72273 | 48850 | 14.37 | 1.0 |
| Weiss+2013 | SPT0243-49 | 5.699 | 188 | 268 | 5911 | 14.06 | 1.0 |
| Weiss+2013 | SPT2132-58 | 4.7677 | 5511 | 7512 | 7812 | 13.81 | 1.0 |
| Weiss+2013 | SPT2134-50 | 2.7799 | 34636 | 33935 | 25728 | 14.09 | 1.0 |
| Magnelli+2012 | LESS011 | 2.679 | 15.22.6 | 19.23.4 | 17.94.2 | 12.73 | 1.0 |
| Magnelli+2012 | LOCK850.14 | 2.611 | 19.43.8 | 24.95.7 | 30.68.3 | 12.82 | 1.0 |
| Magnelli+2012 | AzLOCK.10 | 2.56 | 12.43.9 | 34.57.5 | 35.08.7 | 12.8 | 1.0 |
| Magnelli+2012 | SMMJ140110252 | 2.565 | 61.76.0 | 63.13.8 | 48.54.0 | 13.27 | 3.0 |
| Magnelli+2012 | SMMJ140090252 | 2.934 | 66.46.0 | 65.83.8 | 53.74.2 | 13.41 | 1.5 |
| Magnelli+2012 | SMMJ002661708 | 2.73 | 52.87.2 | 61.34.5 | 44.64.7 | 13.28 | 2.4 |
| Magnelli+2012 | SMMJ045420301 | 2.911 | 76.015.1 | 94.48.8 | 84.111.5 | 13.5 | 50.0 |
| Magnelli+2012 | SMMJ1635466114 | 3.188 | 20.56.0 | 25.73.0 | 17.43.3 | 13.03 | 1.7 |
| Magnelli+2012 | SMMJ1635566122B | 2.516 | 78.16.0 | 70.27.2 | 74.73.5 | 13.34 | 22.0 |
| Magnelli+2012 | SMMJ1635566123A | 2.516 | 53.76.0 | 47.13.1 | 26.93.5 | 13.23 | 14.0 |
| Magnelli+2012 | SMMJ023990136 | 2.81 | 65.76.1 | 72.03.9 | 62.84.6 | 13.38 | 2.5 |
| Casey+2012 | X24 J033136.96275510.9 | 3.145 | 15.53.8 | 20.83.8 | 24.04.8 | 12.91 | 1.0 |
| Casey+2012 | X1.4 J033151.94275326.9 | 2.938 | 12.93.9 | 21.63.7 | 24.24.2 | 12.83 | 1.0 |
| Casey+2012 | X24 J095916.08021215.3 | 4.454 | 25.82.2 | 24.12.9 | 14.73.2 | 13.3 | 1.0 |
| Casey+2012 | X1.4 J100111.52022841.3 | 3.975 | 24.52.2 | 32.94.3 | 22.86.8 | 13.27 | 1.0 |
| Casey+2012 | X24 J100150.16024017.2 | 2.883 | 13.82.2 | 12.22.9 | 8.94.0 | 12.71 | 1.0 |
| Casey+2012 | X1.4J100008.64022043.1 | 2.888 | 16.52.2 | 12.32.9 | 9.43.6 | 12.79 | 1.0 |
| Saintonge+2013 | 8:00arc | 2.73 | 91.33.6 | 78.54.2 | 47.84.0 | 13.5 | 12.3 |
| Saintonge+2013 | cB58 | 2.729 | 24.92.4 | 16.03.3 | 10.93.6 | 12.97 | 31.8 |
| Saintonge+2013 | J0712 | 2.646 | 9.12.9 | 3.83.4 | 4.73.1 | 12.5 | 27.5 |
| Saintonge+2013 | J1226 | 2.925 | 9.75.3 | 3.73.3 | 3.15.1 | 12.49 | 40.0 |
| Saintonge+2013 | Eye | 3.074 | 26.87.0 | 33.18.7 | 19.110.0 | 13.08 | 30.0 |
| Dowell+2014 | LSW20 | 3.36 | 17.60.0 | 36.60.0 | 43.90.0 | 13.17 | 1.0 |
| Dowell+2014 | FLS1 | 4.29 | 62.30.0 | 94.00.0 | 98.20.0 | 13.81 | 1.0 |
| Dowell+2014 | FLS5 | 4.44 | 24.70.0 | 45.10.0 | 48.20.0 | 13.5 | 1.0 |
| Dowell+2014 | LSW102 | 5.29 | 49.70.0 | 118.10.0 | 140.40.0 | 14.11 | 1.0 |
| Roseboom+2012 | G1 | 4.05 | 18.62.3 | 31.72.7 | 24.32.7 | 13.23 | 1.0 |
| Roseboom+2012 | G3 | 2.98 | 46.32.0 | 46.52.3 | 32.72.3 | 13.28 | 1.0 |
| Roseboom+2012 | G19 | 2.91 | 11.22.1 | 11.32.4 | 17.32.4 | 12.65 | 1.0 |
| Roseboom+2012 | L1 | 2.562 | 80.13.4 | 63.23.8 | 40.64.4 | 13.4 | 1.0 |
| Negrello+2010 | SDP81 | 3.04 | 129.020.0 | 182.028.0 | 166.027.0 | 13.79 | 19.0 |
| Negrello+2010 | SDP130 | 2.63 | 105.017.0 | 128.020.0 | 108.018.0 | 13.54 | 6.0 |
| Smolcic+2015 | AzTEC1 | 4.3415 | 19.56.0 | 29.87.6 | 28.89.0 | 13.31 | 1.0 |
| Smolcic+2015 | Vd-17871 | 4.622 | 9.52.0 | 12.32.4 | 13.03.7 | 13.01 | 1.0 |
| Sklias+2014b𝑏bb𝑏bCalibration errors and confusion noise are not included. | A68/nn4 | 3.19 | 45.31.87 | 38.042.19 | 17.741.5 | 13.01 | 2.3 |
| Bothwell+2013 | SPT0538-50 | 2.8 | 326.023.0 | 396.038.0 | 325.024.0 | 14.09 | 21.0 |
| Magdis+2011 | GN20 | 4.055 | 18.62.7 | 41.35.2 | 39.76.1 | 13.34 | 1.0 |
| Cox+2011 | HATLASID141 | 4.24 | 115.019.0 | 192.030.0 | 204.032.0 | 14.1 | 20.0 |
| Conley+2011b𝑏bb𝑏bCalibration errors and confusion noise are not included. | HLSW-01 | 2.957 | 425.010.0 | 340.010.0 | 233.011.0 | 14.22 | 11.0 |
| Combes+2012 | HLSA773 | 5.24 | 85.08.0 | 168.08.0 | 203.09.0 | 14.26 | 11.0 |
| Reichers+2013b𝑏bb𝑏bCalibration errors and confusion noise are not included. | HFLS3 | 6.34 | 12.02.3 | 32.42.3 | 47.32.8 | 13.79 | 3.5 |
We select from the literature a sample of 57 galaxies at . We attempt to include all galaxies that are spectroscopically confirmed and have detections in all SPIRE bands in this sample, excluding those with apparent signatures of active galactic nucleus (AGN). The galaxies and their sources are listed in Table 1. Since a considerable number of these galaxies are lensed, the magnification factor of each galaxy is also listed in Table 1. The galaxies in this sample are taken from different works, and therefore are inhomogeneous in selection methods as well as redshift measurements. We shortly describe each work in the following.
Weiß et al. (2013): The SPT sample from Weiß et al. (2013) includes mm selected galaxies in the South Pole Telescope Sunyaev-Zeldovich (SPT-SZ) survey (Carlstrom et al., 2011). Synchrotron dominated sources classified by Vieira et al. (2010) have been removed from this sample. The spectroscopic redshifts of these galaxies are derived from the Atacama Large Millimeter/submillimeter Array (ALMA) observations. Sixteen of these sources are at and have SPIRE detections in all three bands. For three out of the 16 galaxies, Hezaveh et al. (2013) derived the IR luminosities using the MBB model with , and their lens magnification factors from lensing models. There is no measurement of the or lens magnification factor available in the literature for the left sources. We assume no lens magnification for these galaxies in Table 1, however, these galaxies are likely to be lensed.
Magnelli et al. (2012): Magnelli et al. (2012) collected a sample of submillimeter galaxies with spectroscopic redshift and Herschel observations. Sources with no PAH features are considered to be AGN and were excluded from this sample. We select 11 galaxies in their sample with and detections in three SPIRE bands. In their work, the is calculated from multitemperature SED fitting.
Casey et al. (2012): Six out of the 36 Herschel sources of the sample Casey et al. (2012) are at and have no sign of AGNs according to their optical spectra. The redshift of these galaxies was spectroscopically confirmed with the Keck I Low Resolution Imaging Spectrometer (LRIS) and the Keck II DEep Imaging Multi-Object Spectrograph (DEIMOS). The are obtained fitting a single MBB with and a mid-infrared (MIR) power law with a slope of to the IR data.
Saintonge et al. (2013): Saintonge et al. (2013) present a sample of lensed galaxies at – with Herschel/SPIRE data. These galaxies have intrinsic properties similar to ultraviolet (UV)-selected lyman break galaxies (LBGs). A comparison of these lensed galaxies with unlensed galaxies suggests that they are representative of star-forming galaxies at their redshifts. The [NII]/H ratios of these galaxies are in the range expected from star-forming galaxies, indicating that they do not harbor AGNs. Six of these galaxies are at and have detection in each SPIRE band. We remove one galaxy (J1527) from our sample because its SPIRE photometry has very large uncertanties () and is not consistent with its PACS measurement (see their Figure 5). The IR luminosities of these galaxies given by Saintonge et al. (2013) are calculated from the SED fitting using Draine & Li (2007) models.
Dowell et al. (2014): Dowell et al. (2014) selected a sample of ‘ m risers’, which are high-z galaxies, as confirmed by the follow-up observations with CARMA. The IR luminosities for these galaxies are calculated by fitting MBB models (leaving as a free parameter) to the SPIRE photometry and assuming no lensing magnification. We assume the AGN contribution is negligible.
Roseboom et al. (2012): Four of the submillimeter sources of Roseboom et al. (2012) have detections in all three SPIRE bands. They used an MBB model with and constant optical depth to fit the SED of the sources and derive their IR luminosity, assuming AGN contribution is negligible.
Negrello et al. (2010): The two galaxies of Negrello et al. (2010), SDP81 and SDP130, are selected using a flux density cut at 500 m ( mJy). They are strongly lensed with a magnification factor of 19 and 6, respectively. Their total intrinsic are derived by Negrello et al. (2010) from multiwavelength SED fitting using models from da Cunha et al. (2008). The MIR emission of the two galaxies suggests little AGN contribution (Negrello et al., 2014).

Smolčić et al. (2015): AzTEC1 and Vd-17871 have . The redshift of AzTEC1 is confirmed to be by SMA observation (Yun et al. in prep.). The redshift of Vd-17871 is obtained by DEIMOS/VLT follow-up observation. The given in this work is calculated by fitting the SEDs using Draine & Li (2007) models. The widths of lines of the two galaxies rule out the possibility that they are powerful AGNs.
Sklias et al. (2014): We select A68/nn4 from the work of Sklias et al. (2014), who present Herschel observations for several lensed star-forming galaxies with well-determined spectroscopic redshifts at . The object A68/nn4 is at . The in this work is calculated from SED fitting using Chary & Elbaz (2001;CE01) templates.
SPT0538-50: SPT0538-50 is a star-forming galaxy first discovered by the South Pole Telescope. The redshift is measured by Aravena et al. (2013) from CO observation. Bothwell et al. (2013) present the Herschel observation for this galaxy and calculated the IR luminosity using CIGALE222Code Investigating GALaxy Emission, http://cigale.lam.fr, (Noll et al., 2009) SED fitting. The Dale & Helou (2002;DH02) models are used for IR part.
GN20: GN20 is first detected by Pope et al. (2006) with a redshift obtained by Daddi et al. (2009). The SPIRE fluxes were obtained by Magdis et al. (2011), who also estimated the IR luminosity using the models of Draine & Li (2007).
H-ATLAS ID141: H-ATLAS ID141 is a source lying at with an apparent IR luminosity of obtained from an MBB fitting, under the optically thin assumption, and a magnification factor between 10 and 30 (Cox et al., 2011).
HLSW-01: HLSW-01 (HERMES J105751.1+573027) was spectroscopically confirmed at by Riechers et al. (2011). This multiple source is lensed by a group of galaxies resulting in a magnification factor of (Gavazzi et al., 2011). The SPIRE fluxes of HLSW-01 are from the HerMES SCATv3.1 catalog (Smith et al., 2012a), and its IR luminosity is calculated by Conley et al. (2011) using SED fitting with an MBB model.
HLSA773: HLSA773 is a source at with an IR luminosity of obtained from an optically thin MBB model with , and estimated at (Combes et al., 2012).
HFLS3: HFLS3 satisfies , has a redshift of , and a of estimated from an MBB SED fitting (Riechers et al., 2013). According to Cooray et al. (2014), the lensing magnification of this galaxy is less than 3.5.
The IR luminosities from the literature are derived using different wavelength ranges and different SEDs. To present more uniform measurements of IR luminosities, we recalculate by fitting the SEDs using DH02 templates and the three-band SPIRE fluxes. The results are shown in Table 1 (the values are not corrected for lensing magnification). We compared the results with the literature values in Figure 1, and found that our results are in agreement with the estimations given in the literature.
These high-z galaxies are bright in IR, suggesting that they are starbursting galaxies. However, at high-z the definition of main-sequence (MS) galaxies and starbursts (SBs) is not clear. Several works have shown that the extremely high star formation rate (SFR) of high-z sources is due to the large amount of cold gas, and that SBs should be defined according to the compactness of the star-forming region instead of the SFR (Elbaz et al., 2011). In the case of our sample galaxies, further information is needed to be able to state if they belong to the MS or not. Therefore, we do not distinguish MS sources from SBs when we compare them with SED libraries in Section 4.2.
In our sample we have removed galaxies with apparent AGN features, however, we cannot rule out galaxies with less powerful or obscured AGNs. Moreover, the AGN identification is not uniform due to the inhomogenous data used in each work. As a result, some galaxies in our sample may have embedded AGNs. In Section 3.4 we show that the AGN contribution is insignificant for the wavelength range discussed in this work.
2.2 Comparison samples
In addition to the high-z sample of identified objects, we use other samples for comparison. First, a UV-selected sample at and compiled by Heinis et al. (2014) from the Herschel Multi-tiered Extragalactic Survey key program (HerMES, Oliver et al. 2012). The redshifts of these galaxies are taken from the photometric redshift catalogue built from COSMOS data by Ilbert et al. (2009, version 2.0), and the mean error of the redshift is about and at and , respectively. The IR fluxes are estimated from HerMES data using stacking analysis. The IR luminosity of the stacked sample is . We use the UV-selected galaxies to compare with the spectroscopically confirmed high-z sample in Section 4.3.
When discussing the methods to select high-z populations using the SPIRE color-color diagram (Section 5.2), we use a sample of m selected galaxies taken from Rowan-Robinson et al. (2014). These sources are obtained by matching the HerMES SCAT catalog (Oliver et al., 2012; Wang et al., 2014) in the SWIRE-Lockman area (Lonsdale et al., 2003) with the SWIRE catalog (Rowan-Robinson et al., 2008), with the requirement that the m fluxes are brighter than Jy. The redshifts are derived using up to 13 photometric bands available in the Lockman area. When there are multiple counterparts in the SWIRE catalog, the source with the highest m predicted according to the SED is selected. The sample include 1335 SPIRE m selected sources, 967 of which have SWIRE associations and 783 sources are with detections in all the three SPIRE bands. The redshifts of the sample range from to . The photometric redshift error for this sample is about in (Rowan-Robinson et al., 2014). The selection effect and the reliability of the redshifts for this sample are discussed in Section 5.2.
3 SED tracks on the SPIRE color-color diagram
3.1 Single-temperature modified blackbody models
We use an MBB model to derive the dust temperature of the galaxies of our sample, as commonly done in the literature (e.g., Roseboom et al., 2012; Casey et al., 2012; Huang et al., 2014), with
| (1) |
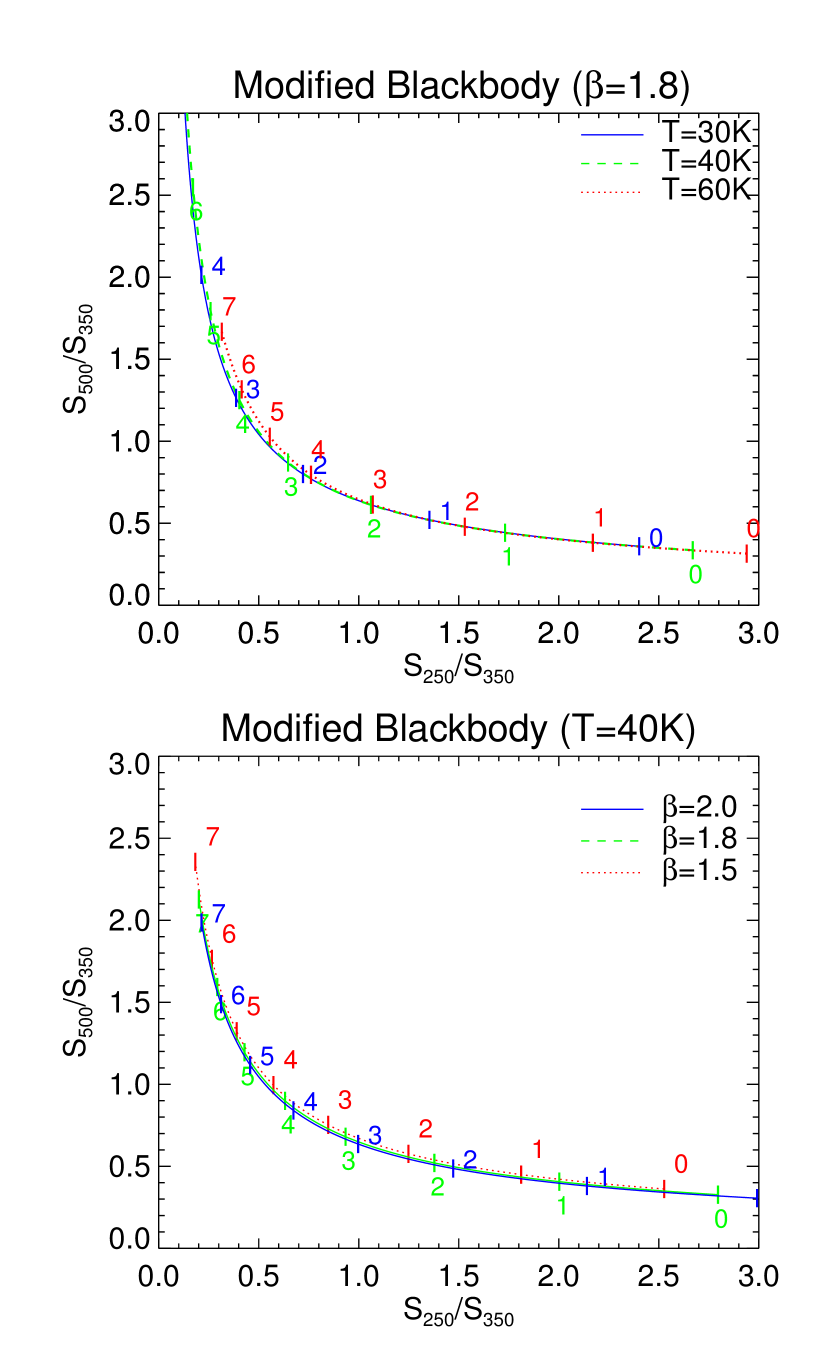
where the optical depth , is the grain emissivity index with values ranging from 1.5 to 2 (Hildebrand, 1983), is the frequency at which the radiation becomes optically thick, and the blackbody spectrum at a dust temperature of . The upper panel of Figure 2 shows the SPIRE color-color diagram of the MBB model with dust temperatures at 30, 40, and 60 K. Here, is assumed to be m and 1.8. We follow the results of Roseboom et al. (2012), who found that a K MBB model with m and can adequately describe the color of their sample of galaxies with . The upper panel of Figure 2 shows that, at the same redshift, cold dust galaxies are above and more to the left than hot dust galaxies, i.e., at higher and lower compared to hot dust galaxies. Therefore, we refer to the upper-left part of the SPIRE color-color diagram as the ‘cold region’, while the lower-right part of the diagram is the ‘hot region’ according to the MBB models. The lower panel of Figure 2 shows that taking different value of can cause systematic differences when estimating the dust temperatures. However, this does not affect our conclusions since we are only interested in the relative dust temperatures. In the following part, we assume m and 1.8 for MBB models.
3.2 SED libraries
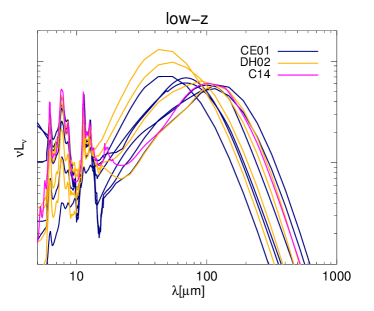
The SED libraries used in this work are CE01, DH02, Elbaz et al. (2011; E11), Magdis et al. (2012; M12), Berta et al. (2013; B13), and Ciesla et al. (2014; C14), shown in Figure 3. Most of these libraries are based on data at . Currently, no library exists for objects. Therefore, we need to extrapolate these templates to higher redshift to compare with the data. According to M12, at the SED of a MS galaxy stops evolving because of the flattening of the evolution of the specific star formation rate (sSFR). Therefore, we assume no evolution after for these libraries. For , only the M12 MS library takes the evolution of IR SEDs with redshifts into account, so we set the templates of M12 as the reference and compare all other templates to them. The color-color diagrams for the templates selected from these libraries are shown in Figure 4. In the following, we introduce the libraries and discuss the position of the templates on the SPIRE color-color diagram.

3.2.1 Pre-Herschel templates
Pre-Herschel libraries, such as CE01 and DH02, are commonly used in the studies of high-z galaxies (e.g., Magdis et al., 2010; Elbaz et al., 2011; Berta et al., 2013; Riechers et al., 2013; Heinis et al., 2014). The templates of CE01 are built to reproduce the ISO, IRAS, and SCUBA observations, using the dust models of Silva et al. (1998) and ISO MIR spectra. These templates are parameterized by the total IR luminosity, ranging from to . The templates of DH02 are based on IRAS, ISO, SIRTF, and SCUBA observations. The local SEDs based on the models of Desert et al. (1990) are combined assuming the distribution of dust mass as , where is the intensity of the radiation field and the exponent ranges from 1 to 2.5 for star-forming galaxies. Galaxies with small values are more actively forming stars.
3.2.2 Post-Herschel templates
Based on GOODS-Herschel data at and local data of AKARI, ISO, and IRAS, Elbaz et al. (2011) found that most ULIRGs at high-z are actually forming stars in a “quiescent” mode similar to local MS galaxies, and their high SFR are due to the large amount of molecular gas. Therefore, they suggest universal SED templates for MS galaxies and for SB galaxies without assuming any evolution. The templates were built by fitting their sample (), using a “diffuse ISM” component and a “star-forming region” component. The models of the two components are given by Galametz et al. (2009) and Galliano et al. (2011). The galactic dust properties are adopted from Zubko et al. (2004). The distribution of dust mass heated by different starlight intensities is assumed to be a power law: .
M12 derive the MS SEDs by fitting the Draine & Li (2007) model to the data of a well-defined set of normal MS galaxies, including nine normal star-forming galaxies at and , three high-z SMGs, and a stacked sample of MS galaxies at , all of which have spectroscopic redshifts, rich rest-frame UV to MIR photometry and Herschel detection. They find that SEDs of MS galaxies can be characterized by the dust-weighted mean starlight intensity scale factor , which is proportional to , and is mildly evolving with cosmic time as . They build eight SED templates (U1 to U8) for MS galaxies at eight redshift bins (Table 2). In addition, they suggest that SB galaxies have a universal SED, and use the fit of GN20 () as the template for SB galaxies.
| MS templates | z |
|---|---|
| U1 | 0 – 0.025 |
| U2 | 0.05 – 0.275 |
| U3 | 0.3 – 0.625 |
| U4 | 0.65 – 0.975 |
| U5 | 1.0 – 1.30 |
| U6 | 1.325 – 1.725 |
| U7 | 1.75 – 2.25 |
| U8 | 2.27 –3.0 |
Berta et al. (2013) built 32 SED templates from PEP and HerMES data. Each template is the median SED of a class of galaxies defined from the multiwavelength color space. Eight of these SED templates are for rare objects (outliers of the main classes defined from the color space), including torus, AGNs or even elliptical galaxies. The SEDs are fitted using MAGPHYS code (da Cunha et al., 2008).
Other post-Herschel templates are derived from local observations (e.g., Smith et al., 2012b, C14). We use the template of C14 to compare with the high-z libraries. Using Draine & Li (2007) models, C14 fit the UV to submillimeter SEDs of a sample of 322 nearby galaxies, the Herschel Reference Survey (HRS, Boselli et al., 2010), which is volume limited and selected in K-band. The fitted SEDs are averaged to provide the mean SED template.
3.3 SPIRE color-color diagram based on different SED libraries
Figure 4 shows the SPIRE color-color diagram predicted by different SED libraries (see more color-color diagrams in the Appendix). The M12 MS templates are plotted in each panel for comparison. At , the U1 to U8 templates are used for the redshift bins, which they are assigned to by M12. Beyond , the U8 template is used to derive the colors considering the flattening of the evolution of the sSFR.
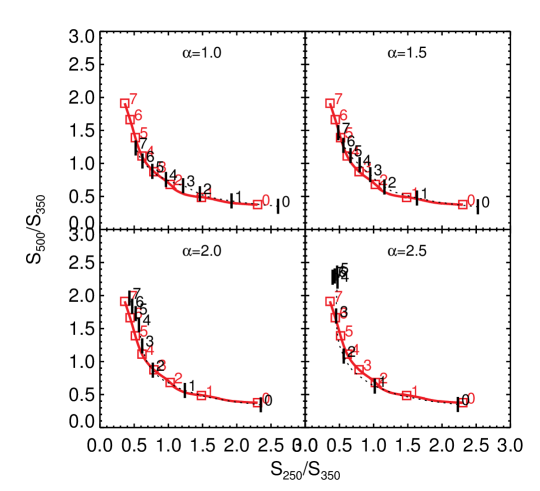
Panels (a) and (b) of Figure 4 present the SPIRE color-color diagram based on the pre-Herschel templates. Panel (a) shows that the template of CE01 with produces a SPIRE color-color relation similar to the MS templates of M12. Panel (b) shows that in the DH02 library, the template with agrees well with the MS templates of M12 in the local universe, whereas as increases to , must reduce to to be consistent with the colors reproduced by the M12 MS templates. Beyond , a template of DH02 with value between and seems to be in agreement with the MS template of M12. Panels (a) and (b) of Figure 4 also show that the templates of CE01 and DH02 do not produce values as large as predicted by the MBB models.
Panel (c) shows the comparison between the templates of E11 with the MS templates of M12 on color-color diagram. Both the MS and SB templates of E11 predict colder colors than M12 galaxies at . The difference is due to the difference of the Rayleigh-Jeans side between E11 and M12 SEDs (Figure 3).
Panel (d) compares the M12 MS template to their SB template, i.e., the SED of GN 20. It appears that at every redshift the SB template is located in hotter regions of the color-color diagram compared to the MS templates. This is not surprising since the star-forming activity in SB galaxies is more intense than in MS galaxies and can thus heat the dust more efficiently.
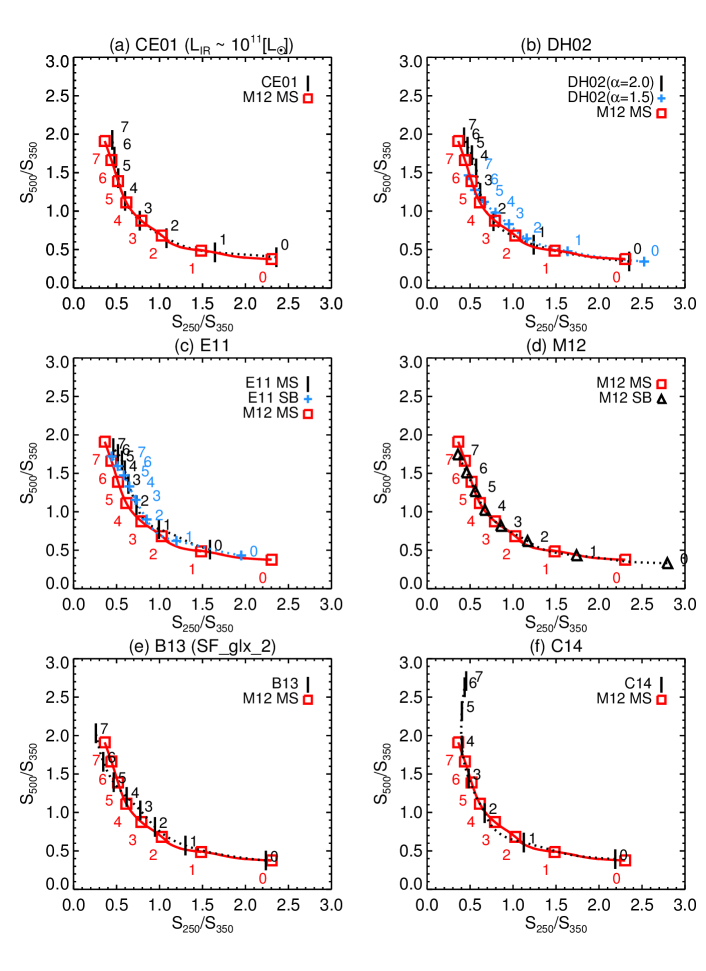
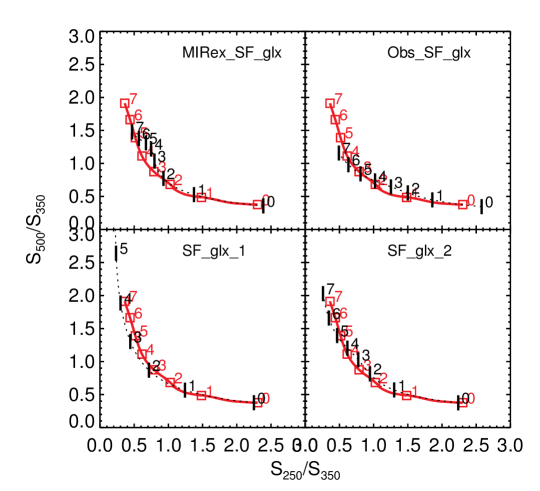
We select four star-forming galaxy templates from B13. We found that, on a color-color diagram, the template SF_glx_2 (derived from star-forming galaxies of the COSMOS field) reproduces SPIRE colors in agreement with M12 MS templates at (Panel [e] of Figure 4). The SF_glx_1 template (star-forming galaxy SED derived from the GOODS-S field) reproduces much colder colors than the M12 templates. The MIRex_SF_glx (MIR excess star-forming galaxies) and Obs_SF_glx (obscured star-forming galaxies) templates have hotter SPIRE colors than the M12 MS templates (see Figure A3).
Panel (f) shows that at the C14 template agrees well with the M12 MS template (U1) on the SPIRE color-color diagram, whereas at high-z the SPIRE colors of the C14 template is much colder than the M12 template.
Many studies have shown that at m the SED can be well approximated by a simple MBB (e.g., Gordon et al., 2010; Davies et al., 2012). Indeed, most of the templates can be well parameterized by a single temperature MBB at the SPIRE wavelength. Therefore, MBB models can be used for simplicity. However, for models with redshift evolution (e.g., M12) ,or those with wide peaks (e.g., E11), MBB is not a good approximation. Also, when going to higher redshifts (), the observed SPIRE bands are moving to shorter wavelength where the dust emission becomes more complicated so that the MBB model is over simplified.
3.4 Contribution from AGNs
Some libraries include contributions from AGNs, however, several works showed that the AGN contribution is negligible (Elbaz et al., 2010, 2011; Casey et al., 2014) at long wavelengths (longer than 30 m). Furthermore, Hatziminaoglou et al. (2010) showed that the SPIRE colors of AGNs and non-AGN, star-forming galaxies are indistinguishable. We also find that the host galaxy dominated AGN template of B13 generates SPIRE colors very similar to M12 templates. To include an AGN contribution, Dale et al. (2014) provided a modified version of DH02 templates in which the contribution of a quasar of different intensity can be added. Comparing the Dale et al. (2014) template containing an AGN emission with its corresponding DH02 template using , we find that when the 5-20 m AGN fraction is less than %, the difference of SPIRE colors given by the two templates are less than . In this paper, since we are working with SPIRE colors where the AGNs hardly affect the results, we do not discuss the possible AGN contamination.
3.5 CMB contribution
At high redshift the impact of cosmic microwave background (CMB) on the observed IR SED can be significant. The CMB affects the observed dust emission with two competing processes: it heats the ISM in galaxies and produces a considerable background against which galaxies are observed (da Cunha et al., 2013). The CMB effect can complicate the comparison between data and templates. Fortunately, according to the results of da Cunha et al. (2013), for the redshift range considered here () the effect of CMB on dust temperatures is K. For galaxies with lower intrinsic dust temperatures (e.g., 18K), the CMB effect on dust temperatures is a function of redshifts. But for galaxies with higher intrinsic dust temperatures (e.g., 40K), the effect is almost constant at different redshifts. In Section 4 we find that our high-z galaxies have dust temperatures higher than 30K. Therefore, the CMB effect on these galaxies is negligible for our discussion in this paper.
4 Results
4.1 Galaxies at on the SPIRE color-color diagram
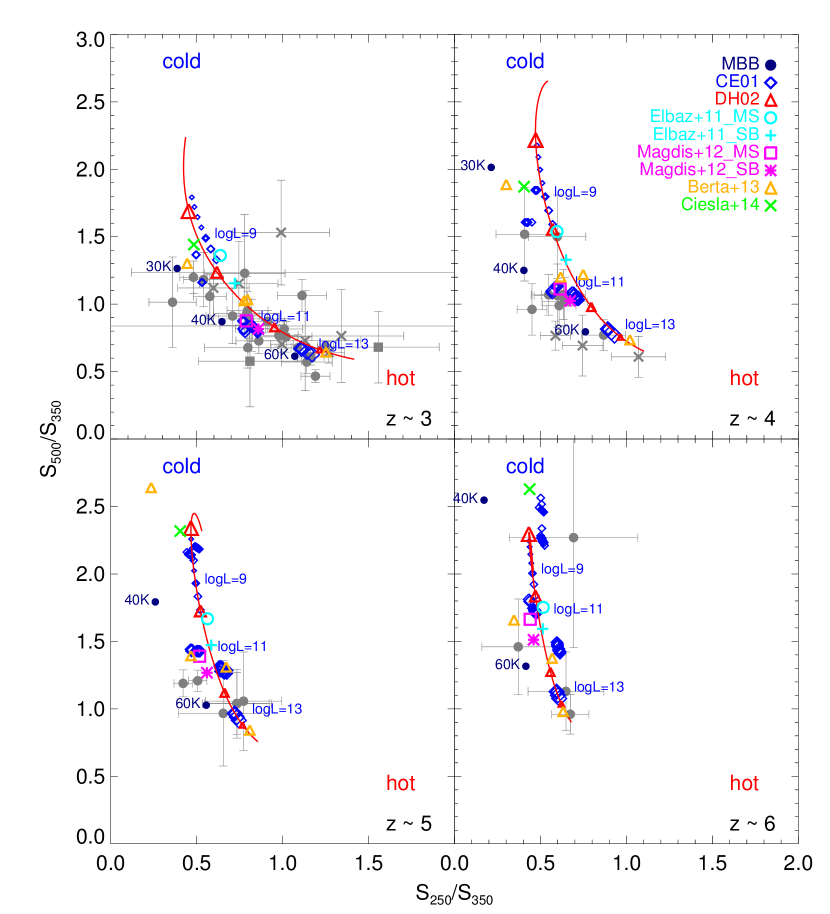
The versus values for our high-z sample are plotted in Figure 5. The sample is divided into four redshift bins: 3 (), 4 (), 5 (), and 6 (). The colors given by MBB models with different dust temperatures are also plotted. We assume optically thick MBB models, with m and 1.8 (see also Section 3.1).
In all panels only three galaxies have colors larger than : the upper left region of the color-color plot is avoided by all the observations. The lack of galaxies with these colors may indicate that at high-z most galaxies have intrinsic high dust temperatures. Before reaching a conclusion we must check if the detection limits of the observations could prevent us from selecting cold dust objects: this is discussed in Section 5.1. The sample of Saintonge et al. (2013) (gray squares) seems to have hotter dust temperatures than the other galaxies, which may be due to the difference between UV- and IR-selected galaxies (Section 4.3).
In our high-z sample, the redshifts are measured from different wavelength. The reliability of optically measured redshifts given in Casey et al. (2012) and Roseboom et al. (2012) depends on the cross-matching methods. These sources are shown as crosses in Figure 5. It seems at these sources have higher dust temperatures comparing to other sources, but removing these sources does not affect our conclusions.
4.2 Comparison of SED templates with data at
| templates | |||||
| all | |||||
| local libraries | |||||
| CE01 | 29.61 | 42.62 | 12.53 | 7.52 | 6.43 |
| CE01 | 7.09 | 9.40 | 4.24 | 1.93 | 3.97 |
| CE01 | 4.78 | 5.87 | 3.97 | 2.62 | 1.09 |
| DH02 | 6.01 | 7.04 | 5.33 | 4.62 | 1.32 |
| DH02 | 4.14 | 5.52 | 2.78 | 0.86 | 1.31 |
| DH02 | 19.77 | 28.21 | 8.83 | 4.82 | 5.08 |
| DH02 | 39.67 | 55.84 | 18.88 | 12.74 | 8.69 |
| C14 | 32.56 | 44.22 | 17.28 | 13.87 | 10.33 |
| high-z libraries | |||||
| E11ms | 22.34 | 33.11 | 7.99 | 3.80 | 4.11 |
| E11sb | 13.79 | 20.37 | 5.11 | 1.86 | 3.05 |
| M12ms | 6.72 | 8.94 | 3.94 | 1.63 | 3.94 |
| M12sb | 4.85 | 6.50 | 2.95 | 0.64 | 2.81 |
| B13 SF_1 | 32.56 | 40.59 | 21.70 | 21.57 | 16.06 |
| B13 SF_2 | 9.78 | 13.59 | 4.61 | 2.13 | 4.98 |
| B13 Obs_SF | 6.87 | 7.80 | 6.37 | 6.17 | 1.59 |
| B13 MIRex_SF | 9.03 | 13.35 | 3.54 | 1.00 | 1.66 |
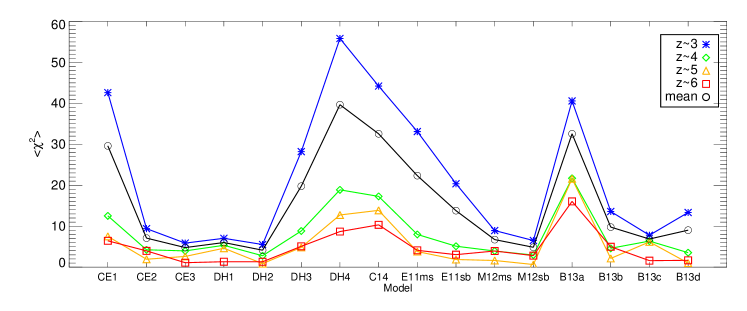
To quantify the coherence between templates and data, we fit each SED template to all the high-z galaxies and calculate the value for each galaxy. The mean value of the () is used as an indicator of the average quality of the fits with a given template. During the fit, we assume a confusion noise of mJy for the galaxies with no confusion noise estimation. The results are shown in Table 3. The colors corresponding to the templates used in this comparison (both local and for high-z objects) are also plotted in Figure 5.
We briefly discuss the case of the local templates from CE01, DH02, and C14: we do not expect a good agreement since the local calibrations are known to be invalid at high-z (Casey et al., 2014; Lutz, 2014). Indeed, Figure 5 shows that the fixed template of C14 is too cold to describe the high-z galaxies. The CE01 and DH02 templates can be adjusted to fit the emission of high-z populations. The template of CE01 corresponding to to can reproduce the SPIRE observations of our high-z sample. However, the local calibration of these templates cannot be used to give correct measurements. For the DH02 templates, the lowest value of is obtained for , a value lower than the average one found for galaxies at (, Buat et al. 2011, 2012).
The high-z libraries include the templates of E11, M12, and B13. The MS template of E11 predicts no evolution with redshift of the SED shape for MS galaxies. With this template indicating the poor quality of the fit. Figure 5 shows that the E11 MS template produces colors colder than most observations at , implying that the template is biased to galaxies with cold dust temperatures. The SB template of E11 gives a better fit to the observation data, but is still colder than most observations and with a high value of ().
Assuming a mild evolution of the MS SEDs, the M12 templates show a better consistency with our high-z sample (). Here we use the U8 template, which is assigned to by M12, assuming no further evolution for redshifts . Figure 5 shows that the U8 template is able to reproduce the average observed colors at , and , in agreement with M12’s assumption that the SEDs evolve very little at because of the flattening of the evolution of the sSFR. The SB template of M12 gives smaller values of (4.85) than the MS template. M12 used G20 to derive their SB template. Removing this galaxy from the high-z sample, the becomes 7.35 for the MS template, and 5.22 for the SB template. The SB template still fits slightly better than the MS template, implying most of our high-z galaxies more likely belong to SB population.
The values obtained with the B13 models are intermediate. The colors of the B13 template for star-forming galaxies in GOODS field (sf_glx_1) extend to colder regions than observations. The bestfit template in the B13 library is the template for obscured star-forming galaxies (Obs_SF_glx), which gives the of 6.87.
We also calculate the in different redshift bins. The result for each template is shown in Table 3 and Figure 6. The for each template at becomes similar, which means that the goodness of the fit becomes less dependent on the templates because of the large uncertainties of the data. The large uncertainties of the data at causes the value of the fitting at to be smaller than at . The the value are smaller at also because there are only four sources at and thus less scatter between the sources.
CE01 template with to , DH02 template with and M12 template fit the data well at each redshift bin. It is possible that galaxies with these kinds of templates are major populations at high-z, but the better fitting can also be due to the data not being sufficient to constrain the SED. The local templates CE01 and DH02 give similar or better than high-z templates, probably because they have flexible parameters ( in DH02 and in CE01).
Since the SPIRE beam is larger at longer wavelengths, the blending affects m fluxes more than m and m fluxes. Therefore, the observed SEDs may be overestimated at longer wavelength. If the effect is non-negligible, the intrinsic colors of the galaxies is bluer than those plotted in Figure 5. The templates of CE01 with , DH02 with , the SB template of M12, and the Obs_SF_glx template of B13 are still preferential.
4.3 UV-selected galaxies on the SPIRE color-color diagram
Saintonge et al. (2013) have shown that their galaxies are similar to UV-selected LBGs, with a lower comparing with the IR/submillimeter-selected galaxies. Figure 5 shows that the galaxies from Saintonge et al. (2013) are located in hotter regions than the other IR/submillimeter-selected galaxies (based on the MBB models), probably indicating hotter dust temperatures for these UV-selected galaxies.
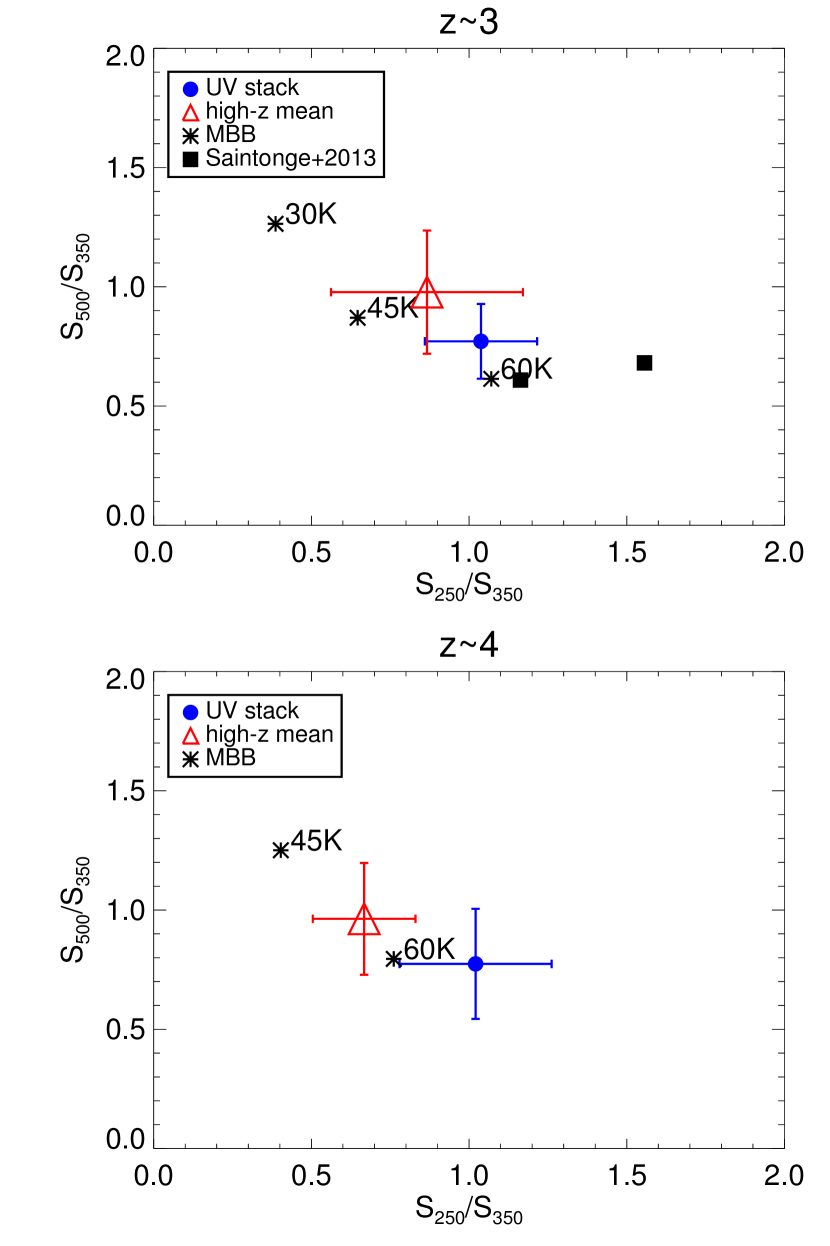
From a stacking analysis in the COSMOS field, Heinis et al. (2014) measured average IR fluxes for samples of UV-selected galaxies at (20849 galaxies) and (6794 galaxies) (see also Section 2.2 for the details of this sample). Comparing these samples with our high-z sample and the sample of Saintonge et al. (2013) in Figure 7, we find that, as with the sample of galaxies in Saintonge et al. (2013), the SPIRE colors of these UV-selected samples are slightly hotter than the average colors of our high-z sample of IR/submillimeter-selected galaxies.
A high dust temperature in a UV-bright galaxy can be caused by a strong UV radiation intensity, which can heat the dust grains in the star-forming regions to high temperatures. The high dust temperatures and low-IR luminosities of the UV-selected sample as compared to those of the IR/submillimeter-selected galaxies indicate that the dust mass of the UV-selected galaxy is also low () (Casey et al., 2014). In IR/submillimeter-selected galaxies, the radiation field may evolve less than estimated by previous studies, which use UV-selected galaxies to probe their evolution (e.g., Saintonge et al., 2013). A detailed comparison of high-z UV-selected and IR/submillimeter-selected galaxies is beyond the scope of this paper and will be addressed in a future work.
In summary, from the comparison between the data and templates we find the following: 1) most galaxies of our sample (except 3 of them) have , inconsistent with MBB models with cold dust temperatures or local mean SED templates (C14); 2) to fit the observations at high-z, the parameter of the CE01 templates should be adjusted to , and the parameter of the DH02 template should be adjusted to ; 3) the E11 MS template corresponds to colder colors than the average of the observations; 4) the MS template of M12 can be used for high-z galaxies () to reproduce the average colors given by the observations; and 5) the colors of UV-selected galaxies correspond to hotter dust temperatures than those of submillimeter/IR-selected galaxies.
5 Discussion
5.1 Detection limits
In Section 4 we showed that there are no observations within the upper left regions of the SPIRE color-color diagram, which is inconsistent with a number of SED libraries. This can be due to the intrinsic high dust temperature of high-z sources and/or a selection effect due to the detection limits. In this section, we check whether the detection limits prevent us from observing objects in the upper left regions of the SPIRE color-color diagram.
First, it is possible that the high-z sample is biased against galaxies with certain types of SEDs, because a galaxy only appears on the color-color diagram if it is detected in the three SPIRE bands (color selection effect). Therefore, we check whether the detection limits of our high-z sample have an impact on the type of SEDs we can probe. We examined five SEDs that are less favored by the observations. They are MBB models with K, the DH02 template with , the CE01 template with , and the SF_glx_1 template of B13 and C14 template. The minimum required to observe them are explored by defining the complete - parameter space for the H-ATLAS, COSMOS, and GOODS-N surveys. The curve is determined as follows:
- 1.
- 2.
The region above the black curve in each panel shows the - range where sources with these five SEDs are all detectable (complete for all SED shapes).
We find that 27 of the 57 galaxies in our sample are within the H-ATLAS completeness limit. For the GOODS detection limits, the number of such galaxies increases to 52. In the worst case of the H-ATLAS detection limits, we have 19 galaxies at and 5 galaxies at within the completeness limits, whereas and samples are not complete. For the deepest field, the nondetection of galaxies with these templates intrinsically indicates there are fewer or no objects with such SED shapes rather than the selection effect at or , implying that the dust temperature is intrinsically high for high-z galaxies. In fact, if a galaxy with K is above the GOODS detection limit, the dust mass required is larger than at . It is not surprising that these kinds of galaxies are rare.
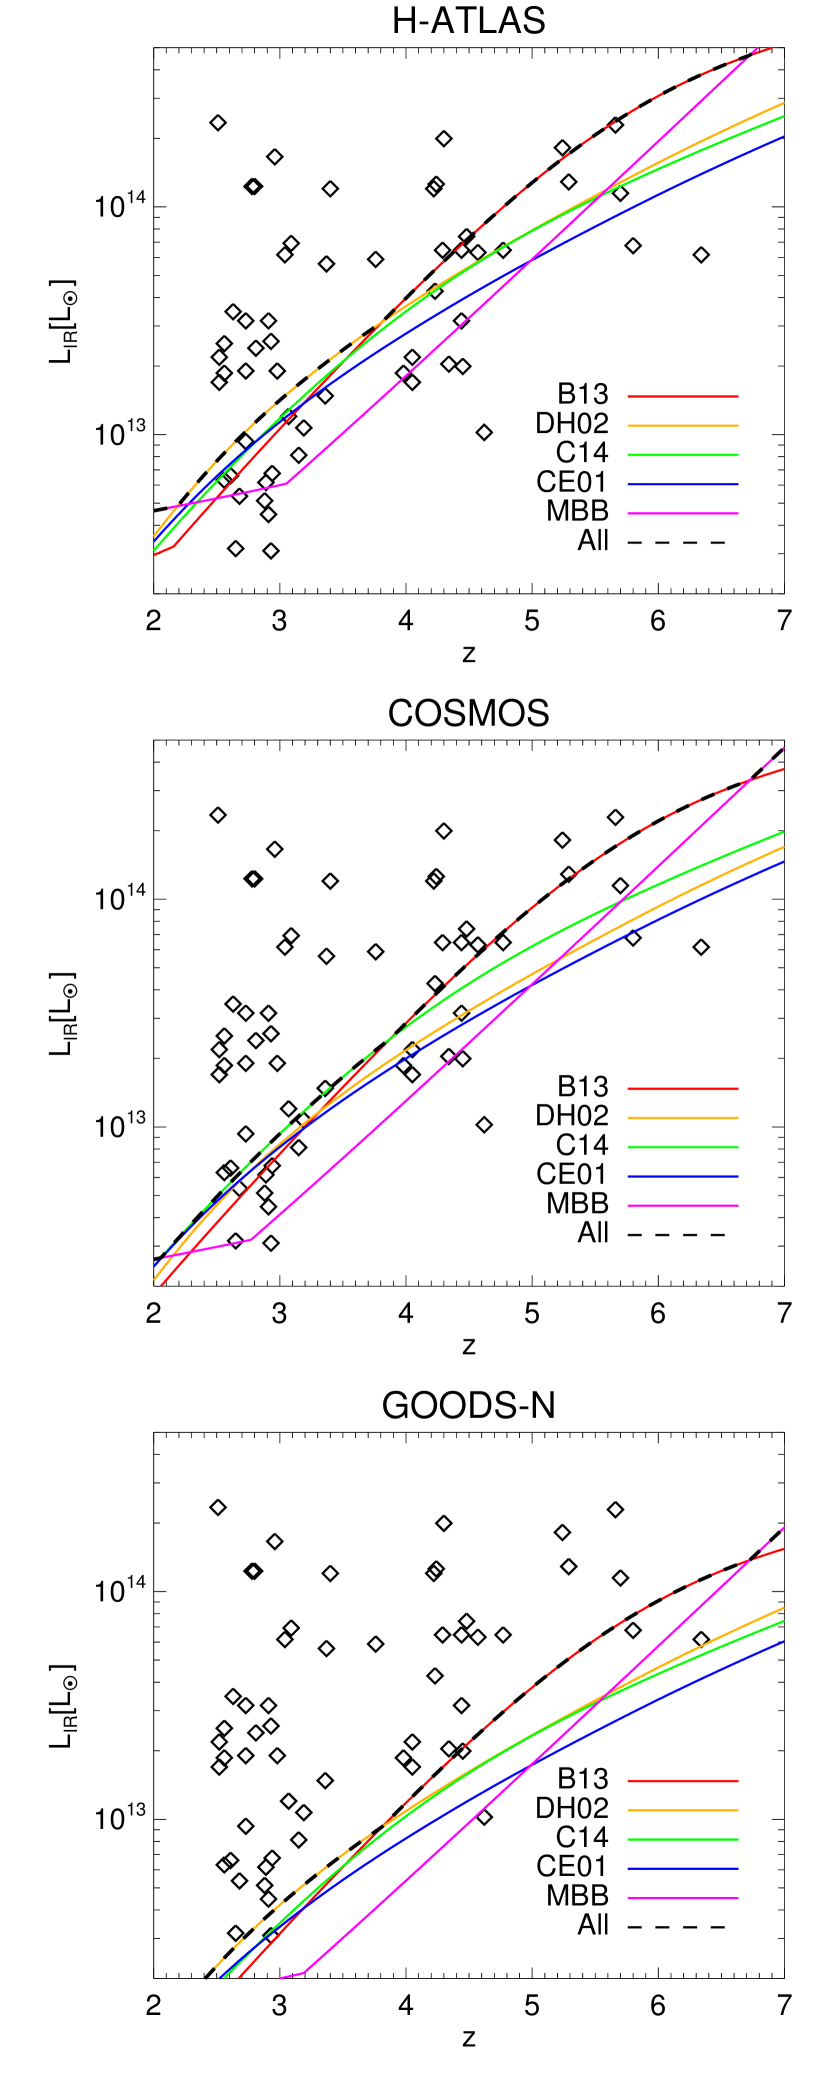
Survey Depths[mJy] reference 250 m 350 m 500 m H-ATLAS 18.0 21.0 27.0 Smith et al. (2011) COSMOS 15.2 17.0 19.2 Oliver et al. (2012) GOODS 5.7 7.2 9.0 Elbaz et al. (2011)
Another question is whether galaxies that are fainter than the completeness limits are colder. Examining the properties of our UV-selected sample, we found that the FIR faint objects at z 4 are not located in the upper left region, suggesting that they on average have high dust temperature. Therefore, the UV-selected galaxies with cold dust temperatures may exist, but should be much rarer than galaxies with high dust temperatures. One might argue that galaxies may exist with no detectable UV nor FIR, however, the lensed galaxies in our sample are intrinsically faint, and there is no galaxy located in the upper left region of the color-color diagram. Therefore, it is likely that the cold dust galaxies are intrinsically few at high-z. The high dust temperature of high-z galaxies may be due to the strong star formation activity in these galaxies.
However, the argument is not conclusive because our sample still has some potential selection biases toward luminous galaxies. First, our requirements that the galaxies have spectroscopic redshifts can bias the sample to be brighter than the formal detection limits. This effect may not be significant since similar results can be found for the sample of Swinbank et al. (2014), who used the ALMA LESS sample with photometric redshifts : few galaxies are found with (see their Figure 5). Second, although we can explore galaxies fainter than the detection limits taking advantage of lensing magnification, the faintest galaxies in our sample have . It is possible that cold dust exists in galaxies fainter than .
5.2 Sampling high-z galaxies using the SPIRE color-color diagram
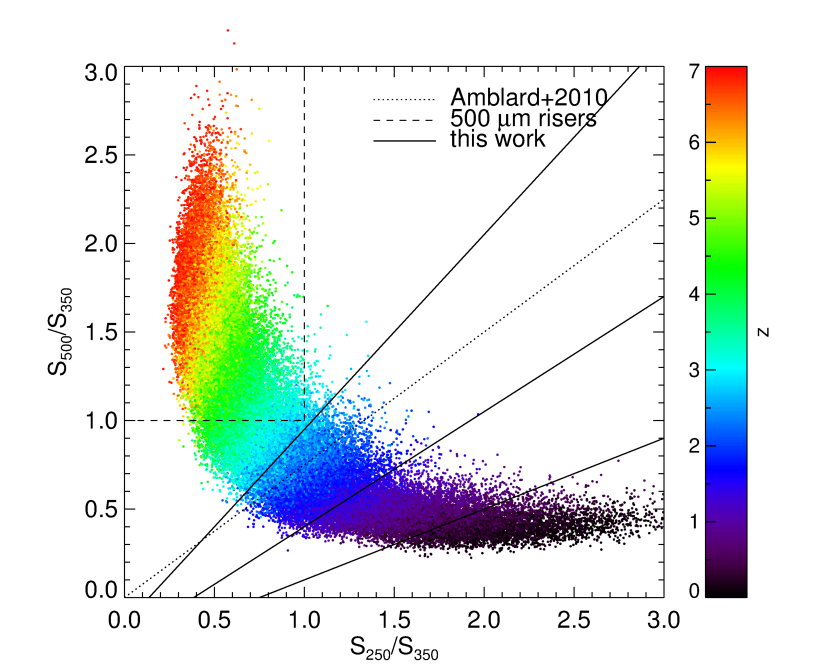
At high redshifts, since the available spectroscopic information is extremely limited, it would be useful to be able to select high-z candidates from photometric data. The SPIRE colors have been used for selecting high-z candidates in several studies. For example, some studies select 500 m risers with (e.g., Riechers et al., 2013; Dowell et al., 2014) as high-z candidates. Galaxies with are likely to be at redshift according to the shape of the IR SED. The galaxy HFLS3 at was found through this method. Another method is to model the redshift distributions on the SPIRE color-color diagram and compare with observations (Amblard et al., 2010; Roseboom et al., 2012). From the redshift distributions, Amblard et al. (2010) also define a color cut with and , which divides their H-ATLAS galaxy sample into and populations.
However, all these methods are based on MBB models, where the redshift evolution of the SEDs is not included. Therefore, more sophisticated SED templates should be used to investigate the correlation between redshift and colors. We showed in Section 4 that the M12 templates can reproduce the SPIRE colors that are consistent with the high-z observations. The M12 library also gives the evolved SEDs for . Therefore, in this section we use the M12 library to re-investigate these methods.
Using the MS templates of M12, we construct 70,000 mock galaxies with . We added an extra Gaussian standard deviation of % to the fluxes and then calculate the colors of these mock galaxies. In previous studies, % is commonly used (e.g., Amblard et al., 2010; Robson et al., 2014). Using reasonably larger values (%) does not affect our conclusion.
We overplotted the selection methods of 500 m riser (dashed line) and Amblard et al. (2010; dotted line) in Figure 9. Both methods are based on MBB models. It seems that the 500 m riser method selects a very pure high-z sample. The color cut defined by Amblard et al. (2010) is able to divide the mock galaxy sample into high-z () and low-z () populations, whereas the redshift range in each population is quite large.
As shown in Figure 9 galaxies are located in a smaller area on the color-color diagram predicted by the M12 library comparing with that predicted by MBB models (see Figure 1 in Amblard et al. 2010). Based on the distribution predicted by the M12 library, we redefine the color cuts as follows:
| (2) | |||
| (3) | |||
| (4) | |||
| (5) |
Equations 2 to 5 define four regions R0(), R1(), R2() and R3() in Figure 9, separated by the three solid lines.

In the case of our spectroscopically confirmed high-z sample (57 galaxies at ), 40 galaxies are in R3 region. Amblard et al. (2010)’s high-z color cut selects 42 of these galaxies. The method of 500 m risers selects 23 of these galaxies. The completeness of the 500 m riser selection is %, worse than both our method work and Amblard et al. (2010). Since the 500 m riser selection method is designed for selecting galaxies, we also check the selection completeness for galaxies in our sample and found the completeness is only (14 of 21).
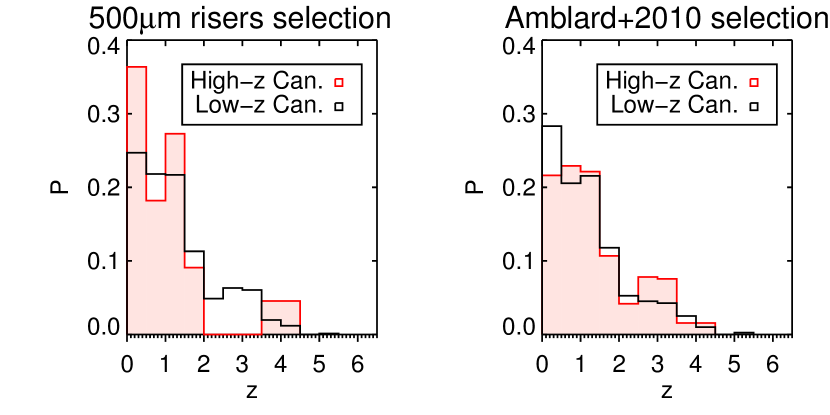
To further test the three methods, we use the m selected sample with photometric redshift information in Rowan-Robinson et al. (2014; 783 galaxies, see Section 2.2 for details of this sample). The large size of this sample is necessary to test the color-cut methods because these methods are designed for statistical use. Figure 10 shows the redshift distributions of the four subsamples of the 783 galaxies divided using the color-cut method defined in this work. The redshift distributions of subsamples divided using the methods of 500 m risers and Amblard et al. (2010) are shown in Figure 11. The mean median redshift, the standard deviation, and the contamination from other redshifts for each subsample are listed in Table 5.
N Mean Median STD contamination All 783 1.31 1.06 1.00 R0 () 15 0.18 0.16 0.09 0% R1 () 90 1.09 0.96 0.94 62% R2 () 463 1.35 1.08 0.99 83% R3 () 215 1.39 1.13 1.03 80% Amblard+() 384 1.39 1.12 1.02 77% Amblard+() 399 1.23 1.02 0.98 18% 500 m risers () 22 1.13 0.96 1.09 95%
From the statistics, we find that at the color cuts defined in this work can separate galaxies into subsamples with different mean redshifts, and the Student’s t-test shows that the difference between these subsamples is significant (the index ). The mean redshift of galaxies is 0.18 in R0 region, and 0.96 in R1 region, consistent with our definition of these regions using mock galaxies. However, at the mean redshifts in R2 and R3 regions are lower than expected. The high- and low-redshift subsamples given by the method of Amblard et al. (2010) have mean redshifts of 1.43 and 1.23, respectively. The Student’s t-test shows that the difference is also significant. However, the mean redshifts are different from Amblard et al. (2010) values for H-ATLAS galaxies (2.6 for the high-z population and 1.8 for the low-z population). The method of 500 m risers selects a high-z sample with mean redshift of 1.53, significantly lower than the expectation for this method. The contamination becomes higher than 50% at for all the methods, and the dispersion of redshifts in all the subsamples in Table 5 is quite large ().
The contamination is partly because of the sample selection. The requirement of association with m source and an entry in the SWIRE Photometric Redshift Catalog biases the sample against sources with as well as sources with (Rowan-Robinson et al., 2008, 2014). Our requirement of detection at m further biases this sample to lower redshifts. The lack of sources in this sample therefore causes poor statistics at . However, assuming galaxies without m or m detection are all perfectly divided by the color-cut methods, we can estimate a minimum contamination rate, which is for R3 ( cut), for Amblard et al. (2010)’s cut, and for m risers cut. The minimum contamination is still high for high-redshift color cut. The error of photometric redshift and the cross-matching accuracy is also relevant to the contamination. The photometric redshift error for this sample is about in (Rowan-Robinson et al., 2014), which increases with the redshift. At higher redshift, the association of submillimeter sources with m sources also becomes less reliable. Apart from the above causes, there is also intrinsic dispersion caused by the variation of galaxy properties because we are considering an average SED in a given redshift bin when designing the method.
From the discussion above, it seems that although the three methods can select samples with different mean redshifts, the resulting samples have either a large dispersion in or miss a considerable number of galaxies (%) at high redshift. Therefore, it is difficult to properly sample galaxy populations at different redshifts using only the three SPIRE bands.
6 Conclusion
We collected a sample of 57 galaxies with reliable redshifts and SPIRE flux measurements at , and compare the SPIRE colors of this sample with those derived from different SED templates at different redshifts. The templates are taken from the pre-Herschel and post-Herschel SED libraries, including local templates of CE01, DH02, and C14, and high-z templates of E11, M12, and B13.
From the SPIRE color-color diagram, we find that of the galaxies at have a SPIRE color , implicating that the dust temperatures in these galaxies are high. Therefore, local SED templates may not be suitable for these galaxies due to dust temperature evolution. From the comparison of the high-z data with the local templates, we find that the SPIRE colors given by the C14 template, which is based on local galaxies that are too cold to describe the average colors of our high-z sample. The local calibrations for CE01 and DH02 libraries are also not able to describe the average SPIRE colors for high-z galaxies. However, both the CE01 and DH02 templates can fit the SPIRE colors better when the parameter of the CE01 templates is adjusted to or the parameter of the DH02 templates fixed to . Among the high-z templates, the templates of M12 give the most satisfying fit, implying that their assumption of the SED evolution is suitable for the high redshift.
Comparing with UV-selected samples at and , we find that the UV-selected sample have even higher dust temperatures than our sample. We discussed the possible bias of the samples due to the detection limits, and find that the higher than local dust temperature for high-z galaxies is unlikely to be due to observational biases.
The efficiency of selecting high-z galaxies using the SPIRE color-color diagram is also discussed. We defined color cuts according to the MS template of M12 to sample galaxies at different redshifts, and compare the method with the method using 500 m risers and the color cut defined by Amblard et al. (2010). We have shown that these methods can divide our m selected sample into subsamples with different mean redshifts., however, the dispersion in each subsample is quite large. Additional information is needed for better sampling.
Acknowledgements.
We thank an anonymous referee for his/her very useful comments and suggestions. YFT is a LAMOST fellow and this work is supported by NSFC with No. 11303070 (PI : YFT), No. 11433003 (PI Shu Chenggang), and No.11173044 (PI HJL). This work is also supported by the Strategic Priority Research Program “The Emergence of Cosmological Structures” of the Chinese Academy of Sciences (CAS; grants XDB09010100 and XDB09030200). SSY is supported by 973 Program CB8845705, SZY is supported by the NSFC Major Project No. 11390373. LC acknowledges financial support from the thales project 383549 that is jointly funded by the European Union and the Greek Government in the framework of the programme “Education and lifelong learning”. SPIRE has been developed by a consortium of institutes led by Cardiff Univ. (UK) and including Univ. Lethbridge (Canada); NAOC (China); CEA, LAM (France); IFSI, Univ. Padua (Italy); IAC (Spain); Stockholm Observatory (Sweden); Imperial College London, RAL, UCL-MSSL, UKATC, Univ. Sussex (UK); Caltech, JPL, NHS C, Univ. Colorado (USA). This development has been supported by national funding agencies: CSA (Canada); NAOC (China); CEA, CNES, CNRS (France); ASI (Italy); MCINN (Spain); SNSB (Sweden); STFC, UKSA (UK); and NASA (USA).References
- Amblard et al. (2010) Amblard, A., Cooray, A., Serra, P., et al. 2010, A&A, 518, L9
- Aravena et al. (2013) Aravena, M., Murphy, E. J., Aguirre, J. E., et al. 2013, MNRAS, 433, 498
- Berta et al. (2013) Berta, S., Lutz, D., Santini, P., et al. 2013, A&A, 551, A100
- Boselli et al. (2010) Boselli, A., Eales, S., Cortese, L., et al. 2010, PASP, 122, 261
- Bothwell et al. (2013) Bothwell, M. S., Aguirre, J. E., Chapman, S. C., et al. 2013, ApJ, 779, 67
- Buat et al. (2011) Buat, V., Giovannoli, E., Takeuchi, T. T., et al. 2011, A&A, 529, A22
- Buat et al. (2012) Buat, V., Noll, S., Burgarella, D., et al. 2012, A&A, 545, A141
- Carlstrom et al. (2011) Carlstrom, J. E., Ade, P. A. R., Aird, K. A., et al. 2011, PASP, 123, 568
- Casey et al. (2012) Casey, C. M., Berta, S., Béthermin, M., et al. 2012, ApJ, 761, 139
- Casey et al. (2014) Casey, C. M., Narayanan, D., & Cooray, A. 2014, Phys. Rep, 541, 45
- Chapman et al. (2010) Chapman, S. C., Ivison, R. J., Roseboom, I. G., et al. 2010, MNRAS, 409, L13
- Chary & Elbaz (2001) Chary, R. & Elbaz, D. 2001, ApJ, 556, 562
- Ciesla et al. (2014) Ciesla, L., Boquien, M., Boselli, A., et al. 2014, A&A, 565, A128
- Combes et al. (2012) Combes, F., Rex, M., Rawle, T. D., et al. 2012, A&A, 538, L4
- Conley et al. (2011) Conley, A., Cooray, A., Vieira, J. D., et al. 2011, ApJ, 732, L35
- Cooray et al. (2014) Cooray, A., Calanog, J., Wardlow, J. L., et al. 2014, ApJ, 790, 40
- Cox et al. (2011) Cox, P., Krips, M., Neri, R., et al. 2011, ApJ, 740, 63
- da Cunha et al. (2008) da Cunha, E., Charlot, S., & Elbaz, D. 2008, MNRAS, 388, 1595
- da Cunha et al. (2013) da Cunha, E., Groves, B., Walter, F., et al. 2013, ApJ, 766, 13
- Daddi et al. (2009) Daddi, E., Dannerbauer, H., Stern, D., et al. 2009, ApJ, 694, 1517
- Dale & Helou (2002) Dale, D. A. & Helou, G. 2002, ApJ, 576, 159
- Dale et al. (2014) Dale, D. A., Helou, G., Magdis, G. E., et al. 2014, ApJ, 784, 83
- Davies et al. (2012) Davies, J. I., Bianchi, S., Cortese, L., et al. 2012, MNRAS, 419, 3505
- Desert et al. (1990) Desert, F.-X., Boulanger, F., & Puget, J. L. 1990, A&A, 237, 215
- Dowell et al. (2014) Dowell, C. D., Conley, A., Glenn, J., et al. 2014, ApJ, 780, 75
- Draine & Li (2007) Draine, B. T. & Li, A. 2007, ApJ, 657, 810
- Elbaz et al. (2011) Elbaz, D., Dickinson, M., Hwang, H. S., et al. 2011, A&A, 533, A119
- Elbaz et al. (2010) Elbaz, D., Hwang, H. S., Magnelli, B., et al. 2010, A&A, 518, L29
- Galametz et al. (2009) Galametz, M., Madden, S., Galliano, F., et al. 2009, A&A, 508, 645
- Galliano et al. (2011) Galliano, F., Hony, S., Bernard, J.-P., et al. 2011, A&A, 536, A88
- Gavazzi et al. (2011) Gavazzi, R., Cooray, A., Conley, A., et al. 2011, ApJ, 738, 125
- Gordon et al. (2010) Gordon, K. D., Galliano, F., Hony, S., et al. 2010, A&A, 518, L89
- Griffin et al. (2010) Griffin, M. J., Abergel, A., Abreu, A., et al. 2010, A&A, 518, L3
- Hatziminaoglou et al. (2010) Hatziminaoglou, E., Omont, A., Stevens, J. A., et al. 2010, A&A, 518, L33
- Heinis et al. (2014) Heinis, S., Buat, V., Béthermin, M., et al. 2014, MNRAS, 437, 1268
- Hezaveh et al. (2013) Hezaveh, Y. D., Marrone, D. P., Fassnacht, C. D., et al. 2013, ApJ, 767, 132
- Hildebrand (1983) Hildebrand, R. H. 1983, QJRAS, 24, 267
- Huang et al. (2014) Huang, J.-S., Rigopoulou, D., Magdis, G., et al. 2014, ApJ, 784, 52
- Ilbert et al. (2009) Ilbert, O., Capak, P., Salvato, M., et al. 2009, ApJ, 690, 1236
- Lonsdale et al. (2003) Lonsdale, C. J., Smith, H. E., Rowan-Robinson, M., et al. 2003, PASP, 115, 897
- Lutz (2014) Lutz, D. 2014, ARA&A, 52, 373
- Magdis et al. (2012) Magdis, G. E., Daddi, E., Béthermin, M., et al. 2012, ApJ, 760, 6
- Magdis et al. (2011) Magdis, G. E., Daddi, E., Elbaz, D., et al. 2011, ApJ, 740, L15
- Magdis et al. (2010) Magdis, G. E., Elbaz, D., Hwang, H. S., et al. 2010, ApJ, 720, L185
- Magnelli et al. (2010) Magnelli, B., Lutz, D., Berta, S., et al. 2010, A&A, 518, L28
- Magnelli et al. (2012) Magnelli, B., Lutz, D., Santini, P., et al. 2012, A&A, 539, A155
- Negrello et al. (2010) Negrello, M., Hopwood, R., De Zotti, G., et al. 2010, Science, 330, 800
- Negrello et al. (2014) Negrello, M., Hopwood, R., Dye, S., et al. 2014, MNRAS, 440, 1999
- Noll et al. (2009) Noll, S., Burgarella, D., Giovannoli, E., et al. 2009, A&A, 507, 1793
- Oliver et al. (2012) Oliver, S. J., Bock, J., Altieri, B., et al. 2012, MNRAS, 424, 1614
- Poglitsch et al. (2010) Poglitsch, A., Waelkens, C., Geis, N., et al. 2010, A&A, 518, L2
- Pope & Chary (2010) Pope, A. & Chary, R.-R. 2010, ApJ, 715, L171
- Pope et al. (2006) Pope, A., Scott, D., Dickinson, M., et al. 2006, MNRAS, 370, 1185
- Riechers et al. (2013) Riechers, D. A., Bradford, C. M., Clements, D. L., et al. 2013, Nature, 496, 329
- Riechers et al. (2011) Riechers, D. A., Cooray, A., Omont, A., et al. 2011, ApJ, 733, L12
- Rieke et al. (2009) Rieke, G. H., Alonso-Herrero, A., Weiner, B. J., et al. 2009, ApJ, 692, 556
- Robson et al. (2014) Robson, E. I., Ivison, R. J., Smail, I., et al. 2014, ApJ, 793, 11
- Roseboom et al. (2012) Roseboom, I. G., Ivison, R. J., Greve, T. R., et al. 2012, MNRAS, 419, 2758
- Rowan-Robinson et al. (2008) Rowan-Robinson, M., Babbedge, T., Oliver, S., et al. 2008, MNRAS, 386, 697
- Rowan-Robinson et al. (2014) Rowan-Robinson, M., Wang, L., Wardlow, J., et al. 2014, MNRAS, 445, 3848
- Saintonge et al. (2013) Saintonge, A., Lutz, D., Genzel, R., et al. 2013, ApJ, 778, 2
- Silva et al. (1998) Silva, L., Granato, G. L., Bressan, A., & Danese, L. 1998, ApJ, 509, 103
- Sklias et al. (2014) Sklias, P., Zamojski, M., Schaerer, D., et al. 2014, A&A, 561, A149
- Smith et al. (2012a) Smith, A. J., Wang, L., Oliver, S. J., et al. 2012a, MNRAS, 419, 377
- Smith et al. (2012b) Smith, D. J. B., Dunne, L., da Cunha, E., et al. 2012b, MNRAS, 427, 703
- Smith et al. (2011) Smith, D. J. B., Dunne, L., Maddox, S. J., et al. 2011, MNRAS, 416, 857
- Smolčić et al. (2015) Smolčić, V., Karim, A., Miettinen, O., et al. 2015, A&A, 576, A127
- Swinbank et al. (2014) Swinbank, A. M., Simpson, J. M., Smail, I., et al. 2014, MNRAS, 438, 1267
- Vieira et al. (2010) Vieira, J. D., Crawford, T. M., Switzer, E. R., et al. 2010, ApJ, 719, 763
- Wang et al. (2014) Wang, L., Viero, M., Clarke, C., et al. 2014, MNRAS, 444, 2870
- Weiß et al. (2013) Weiß, A., De Breuck, C., Marrone, D. P., et al. 2013, ApJ, 767, 88
- Zubko et al. (2004) Zubko, V., Dwek, E., & Arendt, R. G. 2004, ApJS, 152, 211
Appendix A SED tracks on SPIRE color-color diagram predicted by different templates
Figure A1 plots color-color relations for the templates with , , , , , and . templates, and M12 MS templates produce very similar SPIRE color-color relations.

Figure A2 shows that the template agrees well with M12 templates at the local universe. At , must reduce to to agree with the evolution trend suggested by M12 templates. The evolution of M12 MS templates is similar to a variation of the value of between to .
Figure A3 shows the four templates selected from the B13 libraries. The template SF_glx_2 (the template for star-forming galaxies derived from COSMOS field) reproduces the SPIRE colors very similar to the M12 MS templates at . The SF_glx_1 template (star-forming galaxies derived from GOODS-S field) reproduces much colder colors than the M12 templates. The MIRex_SF_glx (MIR excess star-forming galaxies) and Obs_SF_glx (obscured star-forming galaxies) templates have hotter SPIRE colors than the M12 MS templates.