Emergence of competing magnetic interactions induced by Ge doping in the semiconductor FeGa3
Abstract
FeGa3 is an unusual intermetallic semiconductor that presents intriguing magnetic responses to the tuning of its electronic properties. When doped with Ge, the system evolves from diamagnetic to paramagnetic to ferromagnetic ground states that are not well understood. In this work, we have performed a joint theoretical and experimental study of FeGa3-xGex using Density Functional Theory and magnetic susceptibility measurements. For low Ge concentrations we observe the formation of localized moments on some Fe atoms and, as the dopant concentration increases, a more delocalized magnetic behavior emerges. The magnetic configuration strongly depends on the dopant distribution, leading even to the appearance of antiferromagnetic interactions in certain configurations.
pacs:
71.27.+a, 75.50.Bb, 71.15.Mb, 76.80.+yI Introduction
The physics of Fe-based intermetallic semiconductors such as FeSi, FeSb2 and FeGa3 can present very unusual phenomena, creating an important framework for the development of condensed matter physics. These materials can present properties of strongly correlated electron systems, owing to the presence of the Fe levels, concurrent with semiconducting gaps due to the strong hybridization between the Fe and the post-transition metal or metalloid levels. They have been studied mainly for their thermoelectric propertiesAmagai et al. (2004); Haldolaarachchige et al. (2011); Wagner-Reetz et al. (2014). However, they are also interesting from fundamental physical aspectsOsorio-Guillén et al. (2012), still presenting important unsolved puzzles.
Here we address the puzzling magnetic response upon electronic doping of FeGa3, one of the few Fe-based materials known to be diamagnetic. This diamagnetism of the pure compound has also been assigned to the strong hybridization between the Fe levels and the Ga and levels. Starting from this already unusual state, strikingly different magnetic responses can be observed upon chemical substitutions that lead to doping with holes or electronsCabrera-Baez et al. (2013).
There is much controversy in the literature regarding the most stable magnetic configurations of pure and doped FeGa3, as well as on the mechanisms involved. Some works propose an antiferromagnetic ground state for pure and doped FeGa3 Yin and Pickett (2010); Gamża et al. (2014), whereas others report a diamagnetic ground stateOsorio-Guillén et al. (2012); Tsujii et al. (2008); Hadano et al. (2009). There are also authors invoking an itinerant origin for the ferromagnetic ground state Singh (2013), whereas other reports show a localized nature for the magnetic momentsBittar et al. (2010); Kotur et al. (2013), or both Gippius et al. (2014).
In order to understand this system, we have performed a joint theoretical and experimental work using First-principles Density Functional Theory (DFT) calculations and bulk magnetization techniques on Ge-doped FeGa3 single crystals. Our results confirm that, upon doping, the system quickly evolves to a mainly ferromagnetic (FM) ground state. However, the evolution of magnetic response to Ge doping is far from trivial. The magnetic moments are not evenly distributed throughout all Fe atoms as expected in an itinerant picture, and different groupings of magnetic moments on the Fe atoms are resolved, that depend on both doping concentration and dopant distribution. Additionally, some distributions do indeed lead to Fe moments aligned antiparallel to the mostly FM state. Our results point to an evolution from localized to delocalized character and an intricate competition between FM vs. antiferromagnetic (AFM) pictures for the magnetic response in the doped materials, which may lead to the conclusion that almost all of the previous works were providing partially correct but incomplete descriptions of this fascinating system.
II Methodology
Crystal growth and experimental characterizations
Polyhedral single crystals of FeGa3-xGex with were grown by a standard Ga self-flux method Umeo et al. (2012); Ribeiro and Avila (2013). High purity elements were sealed inside evacuated silica ampoules with a Fe:Ga:Ge proportion of 1:[3(3-x)]:[3x]. These ampoules were heated to 1100 ∘C and cooled to 550 ∘C over 150 h, then removed from the furnace and quickly centrifuged for separation of the molten flux. The effective doping level of each crystal was estimated by comparing the Sommerfeld coefficient, transition temperature and effective moment with the results by Umeo et al. Umeo et al. (2012). X-ray diffraction patterns of powdered crystals were obtained on a Bruker D8 Focus machine and are all consistent with the FeGa3 type structure, with refined lattice parameters of the pure FeGa3 in agreement with published works Umeo et al. (2012); Bittar et al. (2010). DC magnetic susceptibility for temperatures between 2 and 300 K was measured on a Quantum Design SQUID-VSM. For applied fields below 30 Oe the flux gate accessory was used to cancel any remnant field in the superconducting magnet, then a sequence of zero field cooled (ZFC), field-cooled cooling (FCC) and field cooled warming (FCW) branches was performed.
Density Functional Theory calculation
Spin-polarized first-principles calculations based on DFT were carried out using the Generalized Gradient Approximation with a parametrization targeted especially for solids, namely PBEsol Perdew et al. (2008). Also, we performed calculations introducing an on-site Coulomb interaction term, the DFT+U method Dudarev et al. (1998a); Bengone et al. (2000), characterized by the Hubbard parameter acting on Fe -states. The Kohn-Sham equations were solved using the Projected Augmented Wave (PAW) method Blöchl (1994), as implemented in the Vienna ab-initio Simulation Package (VASP) Kresse and Furthmüller (1996); Kresse and Joubert (1999). The PAW atomic reference configurations are , , for the Fe, Ga and Ge respectively. These settings reproduce correctly the properties of this material as reported in Ref. Osorio-Guillén et al., 2012. The kinetic energy cut-off for the plane-wave expansion was 400 eV. For each dopant configuration, the lattice parameters were fixed at the FeGa3 equilibrium crystal structure while the atomic positions were allowed to relax without any symmetry constraint. In the relaxation process, Monkhorst-Pack -point meshes were used, and depending of the size of the supercell we used -centered -point meshes of , , and for the calculation of charge and magnetization densities.
III Results and Discussion
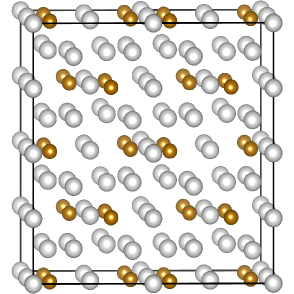
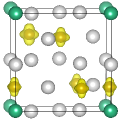
FeGa3 has a tetragonal crystal structure belonging to the space group (136) with one Fe atom located at the Wyckoff position and two types of Ga atoms: Ga1 occupies the Wyckoff position and Ga2 is located at the Wyckoff position Häussermann et al. (2002).
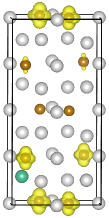
The simplest way to theoretically model -type doping in FeGa3 is by shifting the Fermi level of the system up, which will represent the occurrence of electrons in the conduction band. This preliminary approach leads to the observation that the magnetic response depends on the electron concentration on the system. For low electron densities (f.u.) we do not observe any perturbation of the system, and no magnetic moments are observed in the Fe atoms. As we increase the electron density, we start to observe a magnetic moment in some Fe atoms, i.e., the electrons are not homogeneously distributed through the whole lattice. In this case, the electrons seem to be self-trapped in a lattice distortion. A similar self-trapping behavior has been reported before for the semiconductor MnO Peng and Lany (2012). At higher electron concentration (f.u.) it is observed a more delocalized (itinerant) magnetic state with similar magnetic moments in all Fe atoms (see Fig. 1). Test calculations have shown that these results are robust with respect supercell sizes.
After modeling the system with a preliminary effective doping model, we advance our calculations to an explicit doping approach of FeGa3 with Ge atoms (FeGa3-xGex). For this study, the host system is seen as a layered structure with the Ga1 ions placed at the same plane of Fe and Ga2 occupying its own separate plane. Calculations were performed at concentrations = 0.03, 0.06, 0.09, 0.13, 0.19, 0.25, 0.38 and 0.50 for several different distributions of substitutional Ge impurities throughout the supercell, always on Ga sites, with the appropriate amounts to obtain the desired concentrations. We have also converged different spin configurations for each atomic distribution, including (i) non-spin polarized, (ii) all Fe atoms with parallel spin and (iii) all Fe dimers with antiparallel spins. Along this work we will discuss the most stable spin configuration at each case.
When a single Ge atom is inserted in a supercell at either Ga1 or Ga2 site (), the Ga2 site is preferred by an energy difference of 0.11 eV. In this case, the Ge atom also induces a tiny magnetic moment on its Fe neighbors (/f.u.), whereas at the Ga1 site it does not lead to any magnetic moment on its Fe neighbors. This contrast demonstrates the complex nature of this material, since the exact lattice position where each Ge atom enters directly influences the magnetic configuration, and actual samples will inevitably feature a statistical distribution of the dopant among the nearest neighbors of an Fe atom. Consequently, a complete description of the magnetic behavior can only be achieved through a meticulous and thorough exploration involving many different distributions, which we undertake next.
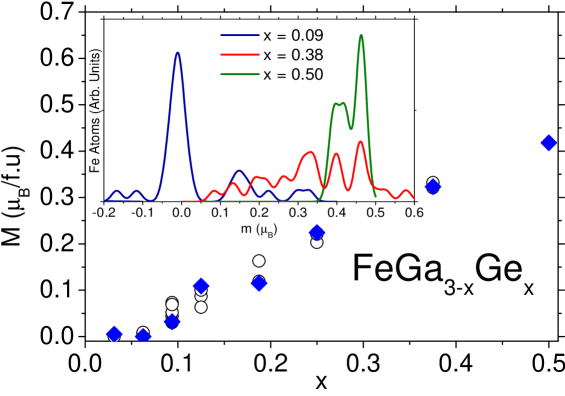
By increasing the dopant concentration in different supercells, we were able to obtain several different magnetic configurations, wherein the total moment per f.u. also resulted different. For a given concentration, there can be different spin configurations that differ simply by the lattice distribution of the Ge atoms. This is exemplified in the main panel of Fig. 2(a), where the total magnetic moment per f.u. is plotted for several different distributions of a fixed dopant concentration. The blue diamonds in this figure indicate the most stable spin configuration. For = 0.03 and 0.06 there exist distributions with null magnetic moment. For each concentration and distribution, we also obtain different values of magnetic moment on the Fe atoms, depending on their positions with respect to the dopants. This result is analyzed by counting the number of Fe atoms with a certain magnetic moment in each configuration, then applying a Gaussian distribution around each value as a simplified representation of configuration distributions in actual samples. The inset of Fig. 2(a) shows the resulting magnetic moment distribution on the Fe atoms for the lowest energy configurations with , 0.38 and 0.50. For , the largest peak (generated by 22 Fe atoms) is around zero magnetic moment. Five Fe moments take values around 0.15 and the others take values around -0.17, -0.12, 0.22, 0.30 and 0.33 . Note that the lower concentrations have a wider distribution of peaks, whereas the higher concentration shows a clear trend towards narrowing the distribution around a single value. These results clearly pose a question on the validity of any calculation performed within the virtual crystal approximation, since through such a method only an average effect can be probed and all the local site information is lost.
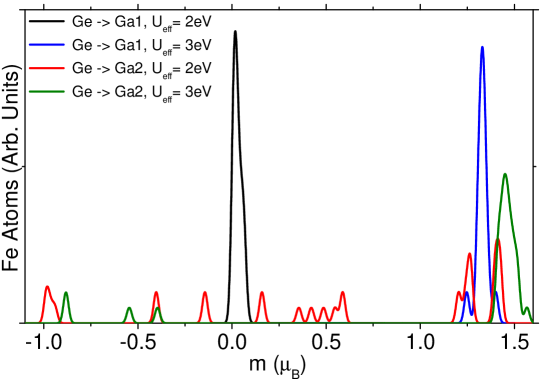
We have also performed calculations adding the Hubbard term to the energy functional (DFT+U) within the simplified rotationally invariant approach Dudarev et al. (1998b) using and 3 eV for the –supercell. Figure 2(b) shows the magnetic moment distribution on the Fe atoms when one Ge impurity occupies either Ga1 or Ga2 positions. The inclusion of the Hubbard term induces a local moment on some Fe atoms that is quantitatively incorrect in comparison to the experimental results. This proves that the use of a semi–local functional is the correct approach to calculate the physical properties of this weakly correlated material.
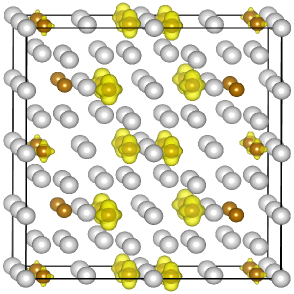
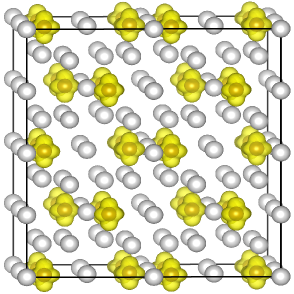
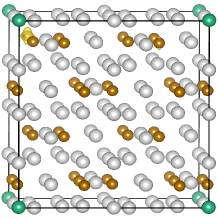
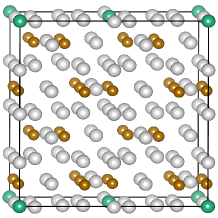
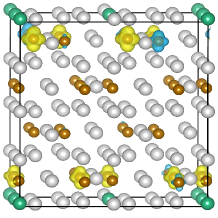
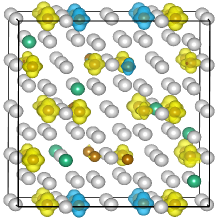
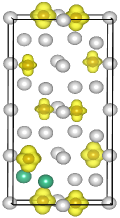
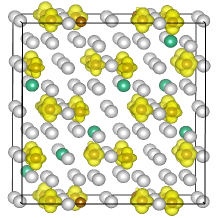
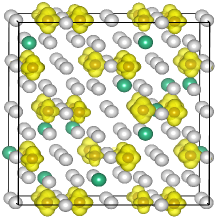
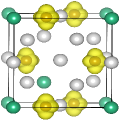
With the aim of visualizing the real-space distributions of magnetic moments in the system, we plot the calculated spin densities for the more stable distribution of Ge atoms at each concentration (Fig. 3(a)-(h)). In these representations one can observe that the induced magnetic moments (yellow surfaces representing spin densities in an arbitrary -direction) are initially localized close to the impurity as we can see in Figs. 3(a)-(d). By increasing the dopant concentration , the magnetization gradually spreads throughout the Fe atoms on the lattice, leading to a more uniform and delocalized character of the magnetization at high concentrations as shown in Figs. 3(f)-(h). Also, our results show that the induced magnetization does not depend on the supercell size, this is clearly observe in Fig. 3(f) ( = 0.25) where the magnetization densities for the unit cell, and supercells are fairly similar. It is also worthy of notice that some of the lowest energy configurations exhibit the formation of a few antiparallel spins on the Fe dimers, exemplified in Fig. 3(c) and (e) by the blue surfaces seen for and 0.19. In most of the distributions the induced magnetic moments are oriented in the same direction, leading to fully ferromagnetic states. Thus, two main points can be derived from the PBEsol calculations which led to the results in Fig 3: (i) an initial emergence of localized moments on some Fe atoms nearby diluted Ge impurities evolves, as a function of dopant concentration, into a more delocalized character at larger concentrations, ending in similar moments on all Fe atoms; (ii) in certain configurations it becomes energetically favorable for a few Fe atoms to align antiparallel to their neighbors, indicating the presence of a minor AFM component over the majority FM interaction.
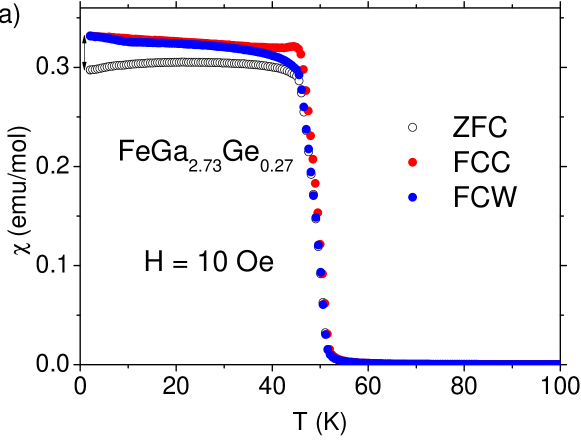
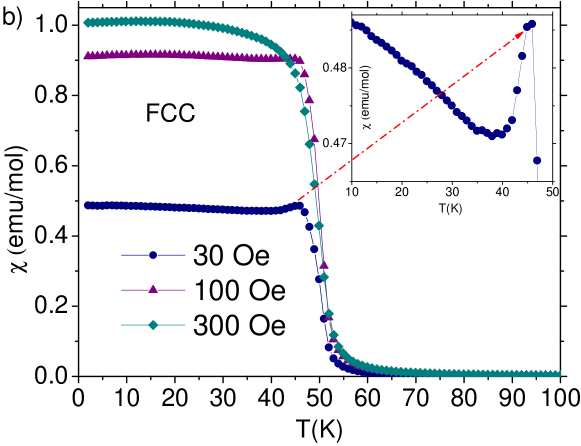
For experimental support of the above simulation results, we performed magnetic susceptibility measurements on a Ge-doped single crystal with , which places it far enough into the magnetically ordered ground state region to avoid issues related to non-Fermi-liquid behaviorUmeo et al. (2012). Fig. 4(a) presents the -dependence of the DC magnetic susceptibility of the FeGa2.73Ge0.27 crystal under external magnetic field of Oe for the ZFC (black), FCC (red), and FCW (blue) branches. In the ZFC branch the response in the saturated region (0.30 ) is lower than the other branches, and shows a small initial increase up to about 20 K. This may be the result of the formation of magnetic domains in the single crystal upon cooling at zero field, which are not realigned at 2 K due to the application of such a weak magnetic field. Increasing temperatures then allow some of the domains to realign themselves. In the subsequent FCC branch, there is a small but well defined, anomalous peak in the magnetic susceptibility around 48 K in which the susceptibility increases sharply upon cooling through , then decreases equally sharply a little but returns to a slowly increasing behavior upon further cooling below 40 K, eventually reaching 0.33 2 K. In this case both the magnetic domains formed at and the magnetic moments were already under an applied field which defined a clear symmetry breaking direction for parallel and anti-parallel alignment. Very similar behavior is visible in previous works reporting only FCC branches Umeo et al. (2012) but was not discussed. This rare behavior disappears in the subsequent FCW branch, that gradually recovers similar behavior to the ZFC branch as the sample is warmed through . Surprisingly, a similar behavior appears in a weak ferromagnet compound MnSi classified as a helimagnet Lamago et al. (2005). This interesting feature is expected for non-centrosymmetric structures, which is not our case.
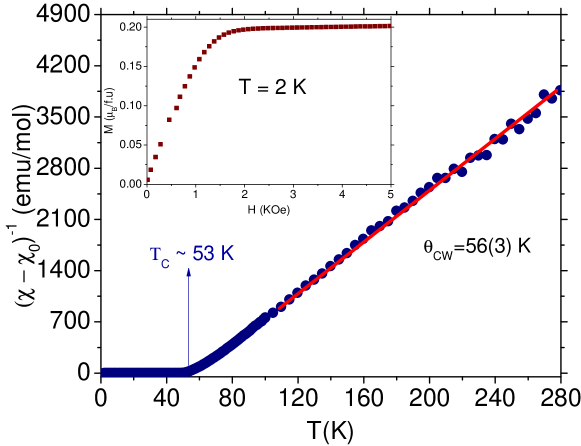
In order to further explore the behavior observed in the FCC curve, measurements under gradually higher applied magnetic fields ( Oe, 100 Oe, 300 Oe, FCC mode) were carried out and are shown in Fig. 4(b). The peak is still clearly visible at Oe and detailed in the inset of Fig. 4(b). Under 100 Oe the FCC peak has practically disappeared, and under 300 Oe the sample recovers the expected shape of FCC curves for traditional ferromagnets, i.e., a sharp increase around followed by further, gradual increase towards saturation as thermal energy is removed from the spin system. The small but sharp decrease just below observed in low-field FCC curves is therefore interpreted as evidence of a minority of antiferromagnetic interactions present in the sample, resulting in some of the Fe moments aligning antiparallel to the majority, as was found in the DFT calculations for and 0.19 lowest energy configurations (Figs. 3(c) and 3(e)). Although we cannot rule out the influence of magnetic domains, we argue that it is only possible to see this weak antiferromagnetic contribution when all of the domains and spins organize under a well-defined alignment axis (FCC case). Also, this is clearly not a trivial case of ferrimagnetism, since the antiparallel moments align themselves at a discernibly lower temperature than the majority (possibly indicating a certain level of frustration) and because the antiferromagnetic component proves to be quite fragile. For higher external fields the peak quickly disappears and the susceptibility curves adopt the more traditional, monotonic increase upon cooling that is expected of a ferromagnet. It is worth noting that the different values of susceptibility saturation at low temperature for these three applied magnetic fields are still compatible with an almost linear behavior of the magnetization curve at low fields, within the resolution of our experiments. By fitting the inverse susceptibility with a modified Curie-Weiss law at high temperatures (see Fig. 5), we extract /f.u, = 56(3) K and = 3.7(8)emu/mol.
The inset of Fig. 5 presents a magnetization measurement showing an almost linear behavior at low fields and no significant hysteresis within the precision of the SQUID measurement. In the fully ferromagnetic state, the saturated magnetic moment /f.u. at K is comparable to the theoretically calculated average of 0.22 /Fe for the more stable configuration with , (see Fig. 2(a)). It is worth noting that the effective moment, , is different compared with the saturation moment, . The itinerant vs. localized character of ferromagnets can be characterized by the Rhodes-Wolhfarth Ratio, RWR = / Zhang et al. . For a localized system, the value of RWR should be close to 1, while it diverges for itinerant ferromagnets. In our case, RWR is about 4.4, supporting the scenario of intermediate behavior between localized and itinerant forms of the ferromagnetism as our DFT results showed. Finally, the evolution from localized towards more delocalized magnetic character as a function of dopant concentration, and also the coexistence of FM and AFM components, were also supported by recent Nuclear Quadrupolar Resonance measurements Majumder et al. (2015).
IV Conclusions
In conclusion, we have shown that the magnetism of Ge-doped FeGa3 is in fact much richer than what had been described so far. Magnetic moment distributions throughout the Fe atoms are complex and strongly dependent on Ge dopant concentration, as well as on the manner in which they are distributed in the lattice. For small dopant concentrations, Fe site symmetry is broken and different types of Fe atoms emerge: some bearing localized moment (induced by nearby Ge) and the rest remaining non spin polarized. This scenario gradually evolves with increasing Ge concentration to a more delocalized character until the dominance of itinerant magnetism is established at the highest experimentally achieved doping levels (). Additionally, the magnetic ordering is found to be mainly FM, but in some cases it is found a minor AFM component brought in by Fe moments that align antiparallel under circumstances not yet fully understood (once again strongly dependent on the dopant concentration and configuration). These predictions made by our meticulous DFT calculations were very well supported by magnetic susceptibility measurements on a FeGa2.73Ge0.27 crystal, that showed a fragile AFM component distinguishable from the major FM transition.
What makes this fascinating system even more compelling is that all these rich features arise even before mixing in the broad range of anomalies that accompanies its reported quantum critical behavior around , which is not contemplated in either the theoretical modeling or the experiments, intentionally performed here on a sample that is well into the magnetically ordered region.
Note added to arXiv version: this paper was originally submitted as a collaboration which included preliminary 57Fe Mössbauer data, but after further consideration the authors involved in those experiments have chosen to prepare a separate, comprehensive publication to be submitted briefly.
Acknowledgments
This work was supported by Brazilian agencies CAPES, CNPq and FAPESP (Contract #’s 2011/19924-2, 2012/17569-2). JMOG would like to thank CIEN-CODI-Vicerrectoría de Investigación-Universidad de Antioquia (Estrategia de Sostenibilidad 2016–2017).
References
- Amagai et al. (2004) Y. Amagai, A. Yamamoto, T. Iida, and Y. Takanashi, Journal of Applied Physics 96, 5644 (2004).
- Haldolaarachchige et al. (2011) N. Haldolaarachchige, A. B. Karki, W. A. Phelan, Y. M. Xiong, R. Jin, J. Y. Chan, S. Stadler, and D. P. Young, Journal of Applied Physics 109 103712 (2011).
- Wagner-Reetz et al. (2014) M. Wagner-Reetz, R. Cardoso-Gil, and Y. Grin, Journal of Electronic Materials 43, 1857 (2014).
- Osorio-Guillén et al. (2012) J. M. Osorio-Guillén, Y. D. Larrauri-Pizarro, and G. M. Dalpian, Physical Review B 86, 235202 (2012).
- Cabrera-Baez et al. (2013) M. Cabrera-Baez, E. T. Magnavita, R. A. Ribeiro, and M. A. Avila, Journal of Electronic Materials 43, 1988 (2013).
- Yin and Pickett (2010) Z. P. Yin and W. E. Pickett, Phys. Rev. B 82, 155202 (2010).
- Gamża et al. (2014) M. B. Gamża, J. M. Tomczak, C. Brown, a. Puri, G. Kotliar, and M. C. Aronson, Physical Review B 89, 195102 (2014).
- Tsujii et al. (2008) N. Tsujii, H. Yamaoka, M. Matsunami, R. Eguchi, Y. Ishida, Y. Senba, H. Ohashi, S. Shin, T. Furubayashi, H. Abe, et al., Journal of the Physical Society of Japan 77, 024705 (2008).
- Hadano et al. (2009) Y. Hadano, S. Narazu, M. A. Avila, T. Onimaru, and T. Takabatake, Journal of the Physical Society of Japan 78, 013702 (2009).
- Singh (2013) D. J. Singh, Physical Review B 88, 064422 (2013).
- Bittar et al. (2010) E. Bittar, C. Capan, G. Seyfarth, P. Pagliuso, and Z. Fisk, Journal of Physics: Conference Series 200, 012014 (2010).
- Kotur et al. (2013) B. Kotur, V. Babizhetskyy, E. Bauer, F. Kneidinger, A. Danner, L. Leber, and H. Michor, Materials Science 49, 211 (2013).
- Gippius et al. (2014) A. A. Gippius, V. Y. Verchenko, A. V. Tkachev, N. E. Gervits, C. S. Lue, A. A. Tsirlin, N. Buttgen, W. Kratschmer, M. Baenitz, M. Shatruk, et al., Physical Review B 89, 104426 (2014).
- Umeo et al. (2012) K. Umeo, Y. Hadano, S. Narazu, T. Onimaru, M. A. Avila, and T. Takabatake, Physical Review B 86, 144421 (2012).
- Ribeiro and Avila (2013) R. A. Ribeiro and M. A. Avila, Philos. Mag. pp. 2492–2507 (2012).
- Perdew et al. (2008) J. P. Perdew, A. Ruzsinszky, G. Csonka, O. Vydrov, G. Scuseria, L. Constantin, X. Zhou, and K. Burke, Physical Review Letters 100, 1 (2008).
- Dudarev et al. (1998a) S. Dudarev, G. Botton, S. Savrasov, C. Humphreys, and A. Sutton, Phys. Rev. B 57, 1505 (1998a).
- Bengone et al. (2000) O. Bengone, M. Alouani, P. Blochl, and J. Hugel, Phys. Rev. B 62, 16392 (2000).
- Blöchl (1994) P. E. Blöchl, Physical review B 50, 17953 (1994).
- Kresse and Furthmüller (1996) G. Kresse and J. Furthmüller, Phys. Rev. B 54, 11169 (1996).
- Kresse and Joubert (1999) G. Kresse and D. Joubert, Phys. Rev. B 59, 1758 (1999).
- Häussermann et al. (2002) U. Häussermann, M. Boström, P. Viklund, Ö. Rapp, and T. Björnängen, Journal of Solid State Chemistry 165, 94 (2002).
- Peng and Lany (2012) H. Peng and S. Lany, Phys. Rev. B 85, 201202 (2012).
- Dudarev et al. (1998b) S. L. Dudarev, G. A. Botton, S. Y. Savrasov, C. J. Humphreys, and A. P. Sutton, Physical Review B 57, 1505 (1998b).
- Lamago et al. (2005) D. Lamago, R. Georgii, and P. Böni, Physica B 359-361, 1171 (2005).
- (26) Y. Zhang, M. Imai, C. Michioka, Y. Hadano, M. A. Avila, T. Takabatake, and K. Yoshimura, to be published.
- Majumder et al. (2015) M. Majumder, M. Wagner-Reetz, R. Cardoso-Gil, P. Gille, F. Steglich, Y. Grin, and M. Baenitz, arXiv (2015), eprint 1510.01974, URL http://arxiv.org/abs/1510.01974.