s-process enrichment in the planetary nebula NGC 3918. Results from deep echelle spectrophotometry ††thanks: Based on observations collected at the European Southern Observatory, Chile, proposal number ESO 090.D-0265(A)
Abstract
The chemical content of the planetary nebula NGC 3918 is investigated through deep, high-resolution (R40000) UVES at VLT spectrophotometric data. We identify and measure more than 750 emission lines, making ours one of the deepest spectra ever taken for a planetary nebula. Among these lines we detect very faint lines of several neutron-capture elements (Se, Kr, Rb, and Xe), which enable us to compute their chemical abundances with unprecedented accuracy, thus constraining the efficiency of the s-process and convective dredge-up in NGC 3918’s progenitor star. We find that Kr is strongly enriched in NGC 3918 and that Se is less enriched than Kr, in agreement with the results of previous papers and with predicted s-process nucleosynthesis. We also find that Xe is not as enriched by the s-process in NGC 3918 as is Kr and, therefore, that neutron exposure is typical of modestly subsolar metallicity AGB stars. A clear correlation is found when representing [Kr/O] log(C/O) for NGC 3918 and other objects with detection of multiple ions of Kr in optical data, confirming that carbon is brought to the surface of AGB stars along with s-processed material during third dredge-up episodes, as predicted by nucleosynthesis models. We also detect numerous refractory element lines (Ca, K, Cr, Mn, Fe, Co, Ni, and Cu) and a large number of metal recombination lines of C, N, O, and Ne. We compute physical conditions from a large number of diagnostics, which are highly consistent among themselves assuming a three-zone ionization scheme. Thanks to the high ionization of NGC 3918 we detect a large number of recombination lines of multiple ionization stages of C, N, O and Ne. The abundances obtained for these elements by using recently-determined state-of-the-art ICF schemes or simply adding ionic abundances are in very good agreement, demonstrating the quality of the recent ICF scheme for high ionization planetary nebulae.
keywords:
(ISM:) planetary nebulae: individual: NGC 3918, ISM: abundances, stars: AGB and post-AGB1 Introduction
About half of the heavy elements () in the Universe are formed by slow neutron(n)-capture nucleosynthesis (the “s-process”) in the asymptotic giant branch (AGB) phase, when neutrons are released in the intershell region between the H- and He-burning shells through the 13C()16O reaction or, in more massive AGB stars (M M⊙), the 22Ne()25Mg reaction. Fe-peak nuclei in this layer, exposed to the neutron flux, experience n-captures interlaced with -decays that transform them into heavier elements, in the process known as the ”s-process”. The s-process- and He-burning-enriched material is later conveyed to the stellar envelope by convective dredge-up and released into the interstellar medium by stellar winds and planetary nebula (PN) ejection (Busso et al., 1999; Herwig, 2005; Käppeler et al., 2009; Karakas & Lattanzio, 2014), where it can eventually be incorporated into a new generation of stars.
The exact details of this scenario are still poorly understood due to the lack of observational constraints to models of AGB nucleosynthesis (Karakas et al., 2009). Two major problems are strong obscuration by dust, which hinders observations in the optical, and the still-evolving surface composition, which complicates the interpretation of data. Fortunately, n-capture elements can also be studied through nebular spectroscopy of PNe. PNe are excellent laboratories for such investigations: they are easily observed in the optical region, which is home to a multitude of s-process element transitions, including lines from multiple ions of Br, Kr, Rb, and Xe; in addition, nucleosynthesis and dredge-up is complete in these objects, whereas the composition of AGB stars is evolving. On the downside, the emission lines of s-elements are intrinsically very weak even in the brightest PNe, so that deep, high-resolution spectroscopy is required to detect them. Because of these stringent technical requirements, only a few detailed abundance analysis have been published so far (see, e.g. Péquignot & Baluteau, 1994; Sharpee et al., 2007; Sterling & Dinerstein, 2008). The determination of total abundances is often limited by the fact that only one ion of each element is detected, leading to large and uncertain corrections for unobserved ions.
To improve the accuracy of s-element abundance determinations in PNe, we embarked on an ambitious observational program aimed at detecting multiple ions of several n-capture species in a small sample of about 8 PNe. The data gathered will enable us to compute accurate total abundances for the object of the sample, as well as verify the consistency of current ICFs based on photoionization modelling for future, less in-depth studies. In addition, the comparison of different lines of the same ionization species will enable us to assess the quality of the (as yet poorly-tested) atomic data for heavy elements. Both aspects are crucial to hone nebular spectroscopy into an effective tool for studying s-process nucleosynthesis.
Two further scientific goals depend crucially on the availability of a sample of several PNe. On one side, we intend to study the correlation, predicted by current AGB models, between the C/O ratio and the s-process enrichment factors. Additionally, we want to explore the correlation between the pattern of s-element abundances and the mass of the progenitor star, which, according to theory, is modulated by the nuclear reaction activated in each mass range (van Raai et al., 2012; Karakas et al., 2012).
Given the deep, high-resolution spectroscopy required to detect optical n-capture element emission lines, such studies naturally reveal numerous weak features of other species. We have detected more than 750 emission lines in NGC 3918, making ours one of the deepest spectra of a PN ever obtained at such a high spectral resolution. These include forbidden lines of several iron-group and other refractory elements, a multitude of permitted features, and a host of diagnostic lines. We determine abundances for all species for which atomic data are available in addition to n-capture elements. For comparison, available very deep PNe spectra at a comparable high-resolution in the literature are those of e. g. Sharpee et al. (2003) who detected 800 lines in the PN IC 418, and Sharpee et al. (2007) who detected between 600 and 900 lines in 4 Galactic PNe.
In this paper, we describe the results for the first PN of our sample, NGC 3918. The paper is organized as follows: in Sect. 2 we describe the observations and the data reduction; in Sect. 3 we present the table of identified lines as well as the reddening correction; in Sect. 4 and 5 we compute the physical conditions and the ionic and total chemical abundances. Finally, in Sect. 6 we discuss our results and draw some conclusions. The work is summarized in Sect. 7.
2 Observations and Data Reduction
The spectra of NGC 3918 were taken with the Ultraviolet-Visual Echelle Spectrograph (UVES, D’Odorico et al., 2000), attached to the 8.2m Kueyen (UT2) Very Large Telescope at Cerro Paranal Observatory (Chile) in service mode on 2013 March 8. The observations were taken under clear/dark conditions and and the seeing remains below 1.5′′ during the whole run (see Table 1).
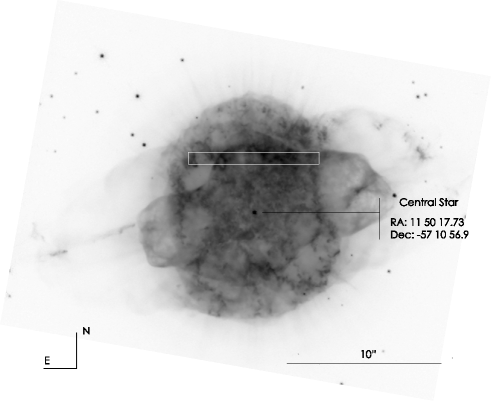
We used two standard settings, DIC1 (346+580) and DIC2 (437+860), in both the red and blue arms of the telescope, covering nearly the full optical range between 3100–10420 Å. In the setting DIC1 (346+580) the dichroic splits the light beam in two wavelengths ranges: 3100–3885 Å in the blue arm and 4785–6805 Å in the red arm; in the setting DIC2 (437+860) the dichroic configuration change to split the light beam in the wavelength ranges: 3750–4995 in the blue arm and 6700–10420 Å in the red arm. The wavelength regions 5773–5833 Å and 8540–8650 Å were not observed because of the gap between the two CCDs used in the red arm. Additionally, there are small gaps at the reddest wavelengths which were not observed because the redmost orders do not fit completely within the CCD. The journal of observations is shown in Table 1. The atmospheric dispersion corrector (ADC) was used to compensate for atmospheric dispersion at the large airmasses the object was observed (between 1.5 and 1.7). The spectra are divided in four spectral ranges (B1, B2, R1 and R2; see Table 1) because the central wavelengths of the two arms were set to two different values to cover the whole optical-NIR range. We obtained 6 exposures of 850 s each in each configuration that were taken consecutively following the sequence DIC1 (346+580) DIC2 (437+860), giving a total exposure time of 1.42 h in each configuration. We have to emphasize that at the end of the observing period, only 42.8% of the total observing time requested was completed. Fortunately, the spectrum was deep enough to reach part of our scientific goals (detection of faint n-capture element lines). Additional single short exposures of 60 s each were taken to obtain non-saturated flux measurements for the brightest emission lines. The slit length was fixed to 10′′ in the two bluest spectral ranges (B1 and B2) and 12′′ in the two reddest ones (R1 and R2), obtaining an adequate interorder separation. The slit width was set to 1′′, which gives an effective spectral resolution of 40,000 (6.5 km s-1), which is needed to deblend some important neutron-capture emission lines from other spectral features (Sharpee et al., 2007). The final one-dimensional spectra analysed in this paper cover an area of 9.35 arcsec2 common to all spectral ranges. In Figure 1 we show a high spatial resolution H image from the HST archive of NGC 3918. The slit center was set 3.8′′ north to the central star of NGC 3918 oriented E-W (PA=90∘), covering the brightest area of NGC 3918.
| Telescope | Date | (Å) | Exp. time (s) | Seeing (′′) |
|---|---|---|---|---|
| 8.2 m VLT | 2013/03/08 | B1: 31003885 | 60, 6850 | 1.0 –1.4 |
| ” | ” | B2: 37504995 | 60, 6850 | 1.0–1.2 |
| ” | ” | R1: 47856805 | 60, 6850 | 1.0–1.4 |
| ” | ” | R2: 670010420 | 60, 6850 | 1.0–1.2 |
The raw frames were reduced using the public ESO UVES pipeline (Ballester et al., 2000) under the GASGANO graphic user interface, following the standard procedure of bias subtraction, aperture extraction, background subtraction, flat-fielding and wavelength calibration. The final products of the pipeline were 2D wavelength calibrated spectra; our own IDL scripts were used thereafter to collapse the spectra in the spatial direction and obtain our final 1D-spectra. The standard star LTT 3218 (Hamuy et al., 1992, 1994) was observed to perform the flux calibration and was also fully reduced with the pipeline. The flux calibration and radial velocity correction were performed using the standard procedures with IRAF111IRAF is distributed by National Optical Astronomy Observatory, which is operated by Association of Universities for Research in Astronomy, under cooperative agreement with the National Science Foundation. (Tody, 1993).
3 Line fluxes, identifications, and extinction correction
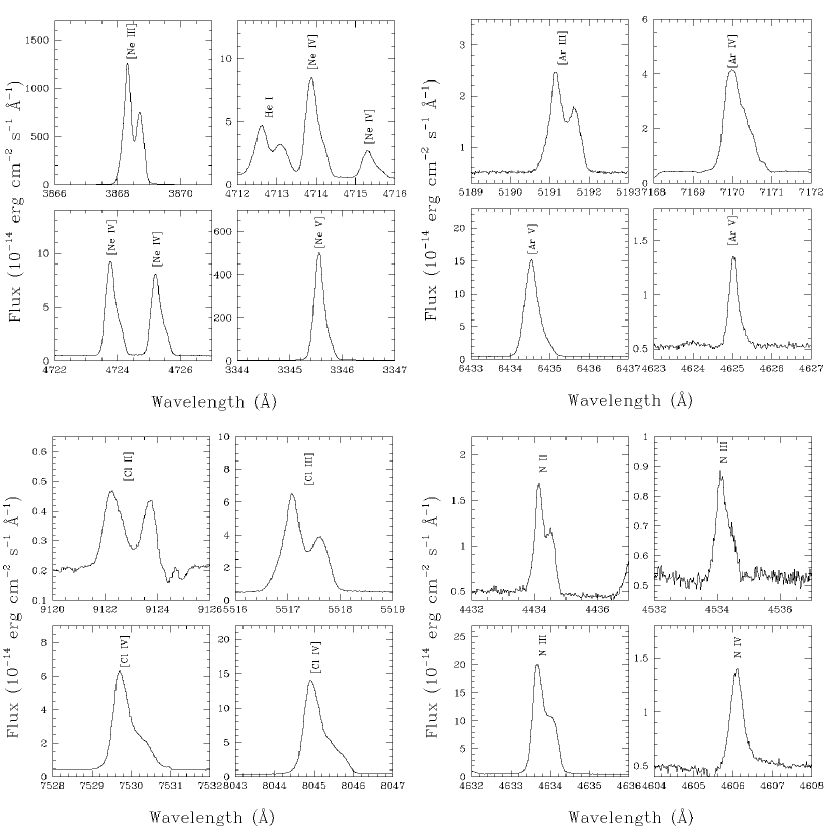
We used the splot routine of the IRAF package to measure the line intensities. The expansion velocity field of the PN is mapped in the line profile pattern, which evolves from the double-peaked line profile of the lowest ionization species to the simpler profile of the highest ionization species. Hence, the total flux of each line was measured by integrating the profile between two given limits, over a local continuum estimated by eye. Owing to the small area covered by our slit, we could not extract a sky spectrum. However, taking into account the peculiar profile of the emission lines in each range of ionization, it was easy to distinguish telluric emission features from nebular emission lines. The cases in which nebular emission lines are severely blended with sky emission features are labelled in the table of line identifications (Table LABEL:lineid). Finally, several lines are strongly affected by atmospheric features in absorption or by internal reflections by charge transfer in the CCD, rendering their intensities unreliable. In some cases, where we consider we could deblend the line from the non-nebular feature, we decided to report the line flux anyway, and included a label in the line identification table as a note of caution. In Fig. 2, we present an example of the line profiles for different ionic species of several elements to show the effect of the expansion velocity field on the line profiles.
The four different spectral ranges covered in the spectra have overlapping regions at the edges. To produce a homogeneous data set of line flux ratios, all the lines fluxes of a given spectrum were normalized to a particular non-saturated bright emission line located in such overlapping region. The selected lines were H9 3835 for the B1 and B2 spectra, [S ii] 6731 Å for R1 and R2, and H for B2 and R1. All line fluxes were eventually referred to H. Some lines that were saturated in the long exposures were measured in the short ones and rescaled to the H flux in a similar way.
The final intensity of a given line in the overlapping regions is the average of the values obtained in both spectra. The differences in the fluxes measured for each line in overlapping spectra do not show any systematic trend and, for the brightest lines, are always lower than 10%. The differences found for the faintest lines in the overlapping regions can be slightly larger (20-25%), and the final adopted errors for each line take into account these uncertainties. Therefore, the final adopted uncertainties are always larger than the differences found between both ranges. These differences are probably caused by the fact that these lines are in the red and blue extremes of the CCDs, where the flat-field correction might be less reliable. We do not expect our final results to be substantially affected by these effects because only line ratios are used in our analysis.
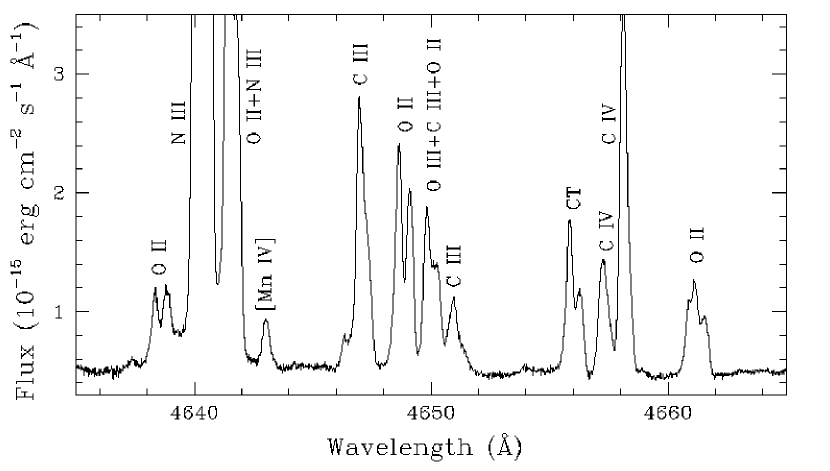
Thanks to the high ionization of NGC 3918, we detect multiple lines of different excitation stages. More than 750 emission lines were measured; most of the lines are permitted lines of H i, He i and He ii, but there is also a large number of permitted lines of heavier ions, such as O ii, O iii, O iv, N ii, N iii, N iv, C ii, C iii, C iv, Ne ii, Ne iii, Si ii, Si iii, Mg i and Mg ii (and, possibly, N v, O v and S ii, see Table LABEL:lineid). We also detect several forbidden and semi-forbidden lines from ions such as [N i], [N ii], [O i], [O ii], [O iii], [F iv], [Ne iii], [Ne iv], [Ne v], [Na iv], Mg i], [P ii], [S ii], [S iii], [Cl ii], [Cl iii], [Cl iv], [Ar iii], [Ar iv], [Ar v], [K iv], [K v], [K vi], [Ca v], [Cr ii], [Cr iii], [Mn iv], [Mn v], [Mn vi],[Fe iii], [Fe iv], [Fe v], [Fe vi], [Fe vii], [Co iv], [Ni v], [Cu v], [Cu vi], [Kr iii], [Kr iv], [Kr v], [Rb iv], [Rb v], [Xe iii] and [Xe iv] (and, tentatively, [Co vi], [Se iii], and [Xe vi]). The depth of our spectra allows us to detect lines as fainter as 10-5(H). The identification and adopted laboratory wavelengths of the lines are based on several previous identifications in the literature (see Baluteau et al., 1995; Clegg et al., 1987; Fang & Liu, 2011; García-Rojas et al., 2009; García-Rojas et al., 2012; Péquignot & Baluteau, 1994; Sharpee et al., 2007; Zhang et al., 2005, and references therein). We also made use of Peter van Hoof’s atomic line list v2.05B18222http://www.pa.uky.edu/peter/newpage/. Details on the identification of neutron-capture element emission lines are given in Sect. 3.2.
For the reddening correction, we assumed the standard extinction law for the Milky Way parametrized by Seaton (1979), with =3.1. We selected this parametrization of the extinction law to be consistent with the analysis of Clegg et al. (1987) which is the deepest study of this object in the optical range. The use of other parametrizations of the standard extinction law would have no significant effects on the results of this paper, as the obtained c(H) is fairly low (see below). The logarithmic redddening coefficient, c(H), was derived by fitting the observed Balmer lines, (H i Balmer)/(H) (from H25 to H3), and the observed (H i Paschen)/(H) lines (from P25 to P9) to the theoretical values computed by Storey & Hummer (1995) for =11000 K and =5000 cm-3, as derived for NGC 3918 by Clegg et al. (1987). We only used those lines neither contaminated by telluric emission/absorptions nor by other nebular emissions. We obtained an averaged value of c(H)=0.260.06. This value is lower than those obtained by Tsamis et al. (2003b), Clegg et al. (1987) and Peña & Torres-Peimbert (1985), which amount to 0.44, 0.43 and 0.40, respectively. However, our value is consistent with the value obtained by Clegg et al. (1987) from the Balmer decrement, which amounts to 0.330.14, and with the value obtained by Torres-Peimbert & Peimbert (1977) (c(H)=0.30).
To determine the line flux uncertainties, we considered individually each spectral range (B1, B2, R1, and R2). Several lines were chosen in each of these ranges so as to cover the whole intensity ranges, and the statistical errors associated to the uncertainties in the continuum measurement were computed using the IRAF splot task. Error propagation and a logarithmic interpolation of ()/(H) vs. (()/(H)) were used to determine (()/(H)) for each line. Finally, the final percentile errors (1) of the )/ ratios were computed taking into account the uncertainties in the determination of (H). The result is presented in column 8 of Table LABEL:lineid. Colons indicate errors higher than 40%.
3.1 Unidentified lines.
There are 18 lines that could not be identified with the available sources, amounting to 2.5% of the measured lines. There are also about 30 dubious identifications, labelled in Table LABEL:lineid with a quotation mark. We checked that these lines are not telluric lines, nor ghosts or charge transfer features. Given the strong dependence of the line profiles (velocity field) with the excitation of the ion, we can at least tentatively classify these lines as low or high ionization ions, with low ionization species having a clear double-peaked line profile and high ionization lines a single-peaked or slightly double-peaked profile. In Table 3 we show the list of unidentified lines with a rough estimation of the laboratory wavelength and the profile type.
| Expected | Profile Typea | |
|---|---|---|
| 3571.09 | 3571.3 | low |
| 4554.64 | 4555.0 | high |
| 5150.60 | 5151.0 | high |
| 5450.62 | 5451.0 | high |
| 5464.91 | 5465.3 | high |
| 5467.17 | 5467.6 | low? |
| 5468.35 | 5468.8 | high |
| 5487.87 | 5488.3 | high |
| 5659.80 | 5660.3 | high |
| 6114.12 | 6114.6 | low-high? |
| 6272.78 | 6273.3 | high |
| 6958.81 | 6959.3 | high |
| 7030.44 | 7031.0 | high |
| 7046.36 | 7046.9 | high |
| 7058.79 | 7059.3 | high |
| 7102.30 | 7102.8 | low |
| 7509.38 | 7509.9 | low |
| 8703.81 | 8704.3 | low |
- a
-
“Low” means a double-peak line profile; “high” means single-peaked or slightly double-peak line profile (see text).
3.2 Identification of neutron-capture lines
The detection of neutron-capture element emission lines in the optical spectra of photoionized nebulae is a hard task, since these lines are intrinsically very faint. However, since the first identification of neutron-capture elements lines twenty years ago by Péquignot & Baluteau (1994) in the optical spectrum of the PN NGC 7027, the reported detections of these lines in the optical spectra of Galactic PNe and H ii regions have grown significantly (e. g. Baldwin et al., 2000; Liu et al., 2004; Fang & Liu, 2011; García-Rojas et al., 2009; García-Rojas et al., 2012; Otsuka et al., 2010, 2011; Otsuka & Tajitsu, 2013; Peimbert et al., 2004; Sharpee et al., 2007; Sterling et al., 2009; Zhang et al., 2005). Other studies have reported the detection of neutron-capture element lines in the near-infrared spectra of Galactic PNe and H ii regions (e. g. Dinerstein, 2001; Sterling & Dinerstein, 2008; Blum & McGregor, 2008) and in other galaxies (e. g. Vanzi et al., 2008).
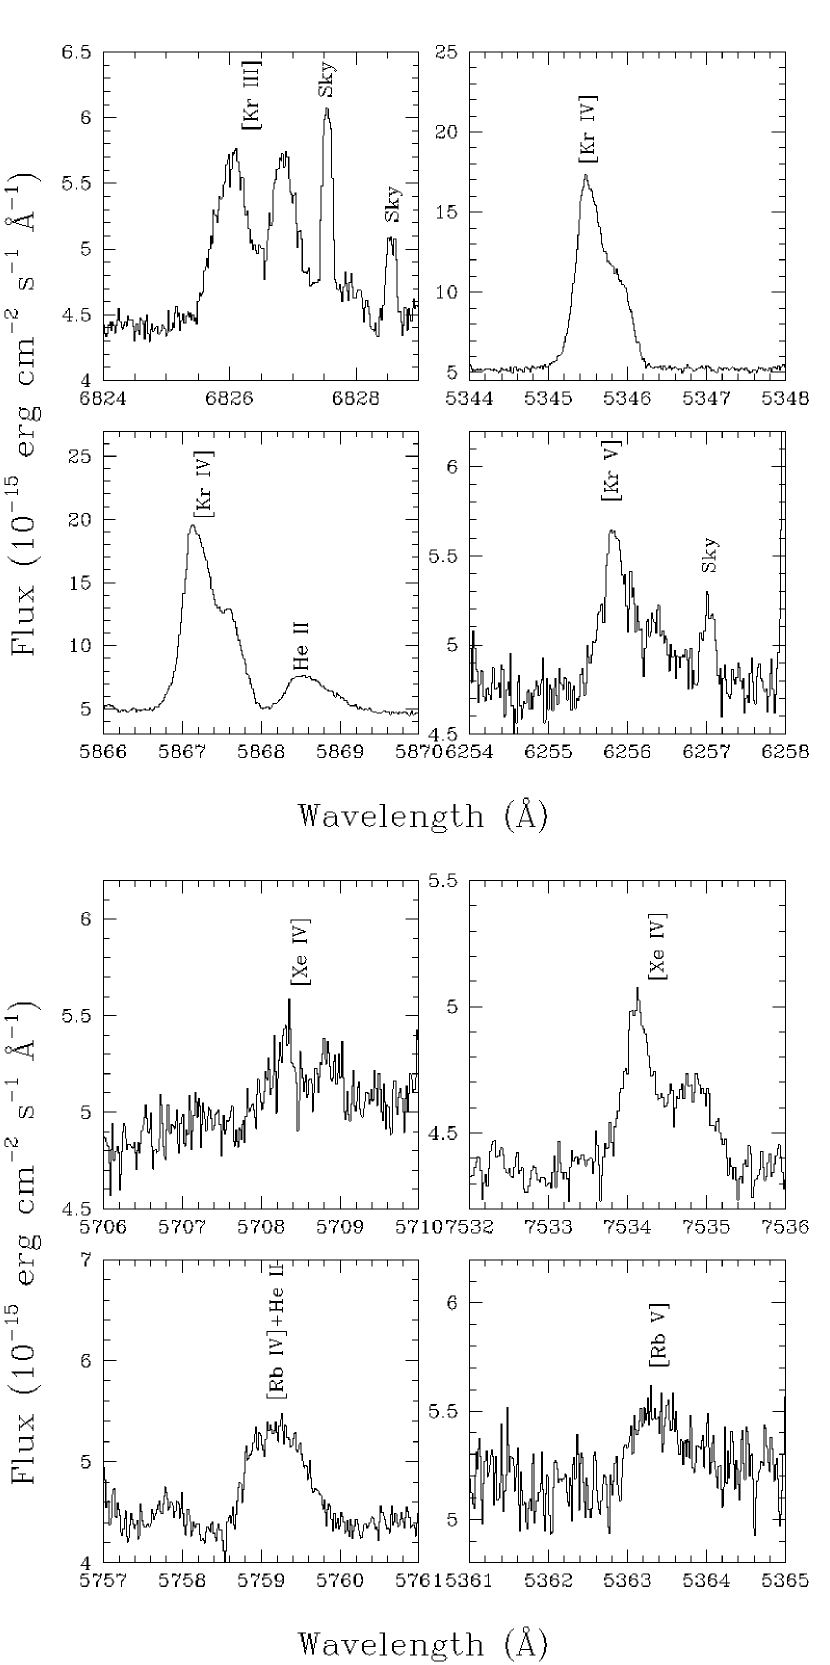
We report the detection of several neutron-capture element lines in NGC 3918. In our analysis, we use all the certain and probable line identifications by Péquignot & Baluteau (1994) and Sharpee et al. (2007) as a reference. The complex velocity structure of NGC 3918 is a double-edged sword. On the one hand, it does not allow us to easily use automatic identification algorithms such as EMILI (Sharpee et al., 2003); on the other hand, it helps us to detect the presence of line blends with ions with different ionization potentials. Additionally, the large number of ghosts and charge-transfer features, as well as the “wiggling” of the continuum which is typical of deep echelle spectra, do not allow us to properly use the PySSN spectrum synthesis code, except in some cases (see below). The PySSN code is a python version of the X-SSN code (Péquignot et al., 2012) and is still in development. PySSN uses a database of emission lines containing identifications, wavelengths and relative intensities for lines of the same multiplets (or emitted by the same process as atmospheric emission and absorption lines). It generates a synthetic spectrum by summing the contributions of all the individual lines, taking into account different profiles for different ions and/or emission processes, and the continuous nebular emission. Reddening and instrumental response are also taken into account. Therefore, in most of the cases, we identify the lines by eye, following several criteria: i) the line profiles agree with what is expected for the ionization potential of the ion; in some cases, this criterion allows us to discard possible blends with other faint lines; ii) the radial velocities of different lines of the same ion agree; iii) the relative intensities of lines arising from the same ion agree with what is expected from the collision strengths and spontaneous emission coefficient calculations for these transitions (this applies to the [Kr iv] and [Xe iv] lines); iv) finally, in some cases of very tight blends we use the PySSN spectrum synthesis code, which makes use of all the previous conditions to perform the line fitting. When the first three criteria are fullfilled we consider the identification to be robust. In Fig. 3 we show some of the neutron-capture element lines detected in our spectrum.
3.2.1 Se line identifications
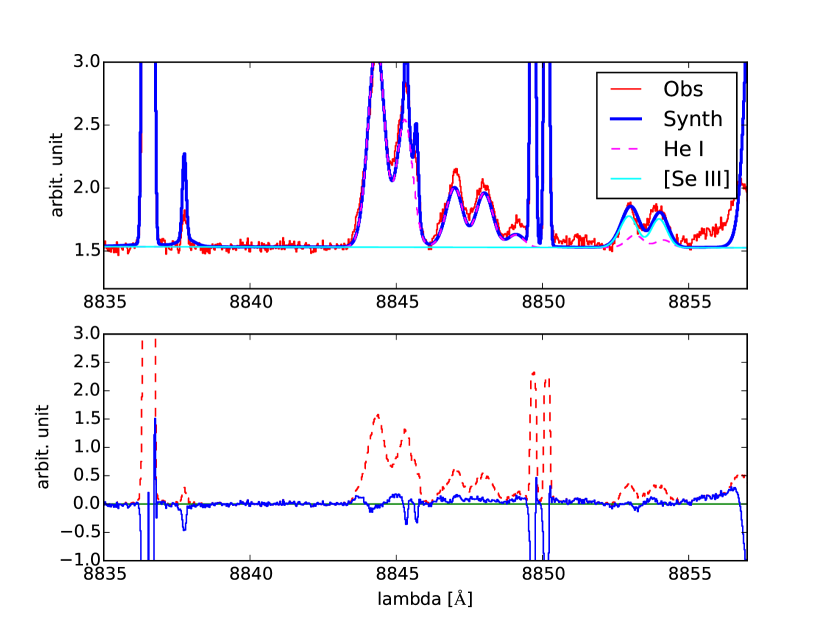
Several authors reported that the identification of the [Se iii] 8854.00 line is quite difficult because of blending with a weak He i 8854.11 line which is at nearly the same wavelength (Péquignot & Baluteau, 1994; Sharpee et al., 2007). We used the PySSN spectral synthesis code to fit the nearby He i lines and estimate the contribution of the He i line to the blend. In Figure 4 we show the best fit we have found. From this fit, a contribution of 75% of the line was considered to come from the [Se iii] emission. Another possible contaminant of this line is the [Mn iii] 8854.2 line, but we discarded this line because we do not detect any other [Mn iii] line in the spectrum of NGC 3918.
3.2.2 Kr line identifications
We identify lines of three ionization stages of Kr. Péquignot & Baluteau (1994) identify the [Kr iii] 6826.70 line as a strong feature, partially blended with the faint C i 6828.12 and He i – 6827.88 lines. Given the high ionization of NGC 3918, we discarded the presence of C i emission. We tentatively assume that the He i line is contributing to the measured flux of the line, given the radial velocity measured. We detect other – transitions of He i in our spectrum, but several of them are strongly affected by telluric absorptions and/or emissions and their intensities are unreliable. Therefore, we used the spectrum synthesis code PySSN to check how this line can affect the measured flux. In Fig. 5 we can see that the He i line is affecting the red end of the [Kr iii] emission; PySSN predicts that the He i line should have a flux 20% the flux of the [Kr iii] line, but, from a close inspection of Fig. 5 only a portion of the He i line (25% ) overlaps the [Kr iii] line and therefore, the contribution to the measured flux is within the uncertainties reported for the [Kr iii] line. Sharpee et al. (2007) report that this line could also be potentially affected by [Fe iv] 6826.50. However, we do not detect other multiplet members that should be brighter than this line in our spectrum and therefore, this possibility was discarded. In Fig. 5 we see that the telluric nightglow OH lines only slightly affect the measured flux of the [Kr iii] line and can be easily deblended. The [Kr iii] 9902.30 line, which arises from the same level as [Kr iii] 6826.70, is also expected in the spectrum. Indeed, a feature is found in our spectrum at the right wavelength, but the line is strongly blended with the C ii multiplet 17.02 9903.46 line. If we estimate the flux of [Kr iii] 9902.30 by subtracting the flux of the C ii 9903.46 line, which yields a C2+ abundance consistent with what is obtained from the average of the other C ii recombination lines (see Sect. 5.2.2), we still have a [Kr iii] 9902.30 line too bright compared to the [Kr iii] 6826.70 line (the theoretical line ratio [Kr iii] 9902.30/6826.70 computed from state-of-the-art atomic data shown in Table 5 is about 0.08). This discrepancy might be explained in terms of either the occurrence of other lines contributing to the measured flux, or errors in the assumed C ii recombination coefficients. In either case, we cannot consider it as a robust identification and we then consider [Kr iii] 6826.70 as the only confirmed line of the [Kr iii] spectrum.
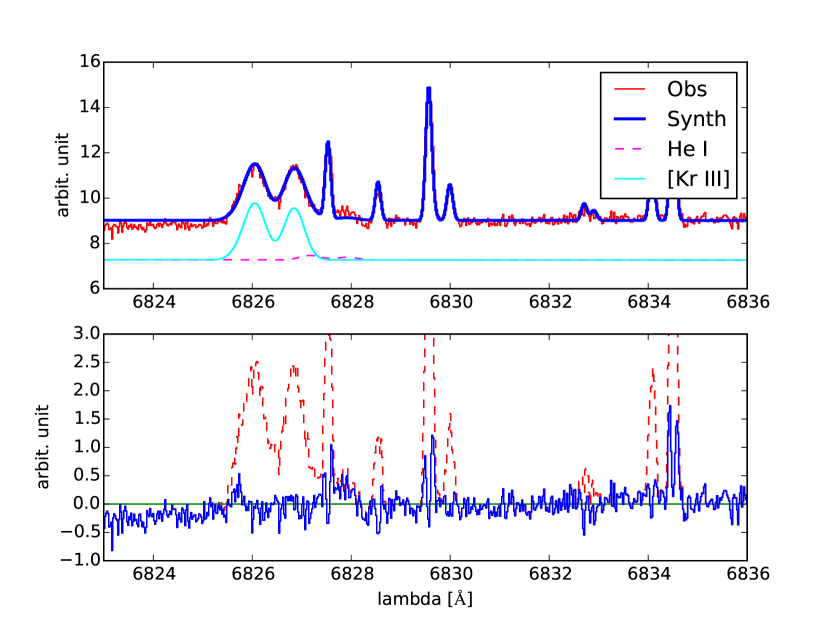
The [Kr iv] 5346.02 and 5867.74 nebular lines are usually the brightest neutron-capture lines in the optical spectra of PNe. As it can be seen in Fig. 3, this is the case in NGC 3918. In principle, these lines are well isolated and, at the excitation of NGC 3918, are not affected by blends. On the other hand, the [Kr iv] 6107.8 auroral line is extremely faint and it seems to be strongly blended with another line, which we identify as the brighest component of the N iii – multiplet. The abundance computed from this line would be a factor of 4 larger than that derived from the nebular lines. The relative intensities of the [Kr iv] 5346.02 and 5867.74 lines agree within 10% with what is expected from their collision strengths. The excellent agreement between the observed and theoretical intensity ratios of the 5346.02 and 5867.74 features strongly supports their identification with [Kr iv].
We identify the [Kr v] 6256.1 line in our spectrum. Péquignot & Baluteau (1994) and Zhang et al. (2005) claim that this line can be affected by the C ii 6257.18 line and/or the dielectronic C ii 6256.52 line. Given our spectral resolution, the expected line profile and the radial velocities measured for other C ii lines, we can discard the presence of the C ii 6257.18 line. Additionally, we discard the presence of the dielectronic C ii 6256.52 line because we do not detect the brightest component of the multiplet at 6250.76 Å. Unfortunately, we could not detect the [Kr v] 8243.39 line to compare the expected theoretical intensity ratio with [Kr v] 6256.1 line with the observed one because this line falls in a zone of the spectrum with a strong telluric absorption feature. Therefore, although the radial velocity is somewhat lower than expected, we consider the identfication of the [Kr v] 6256.1 line as quite robust.
3.2.3 Rb line identifications
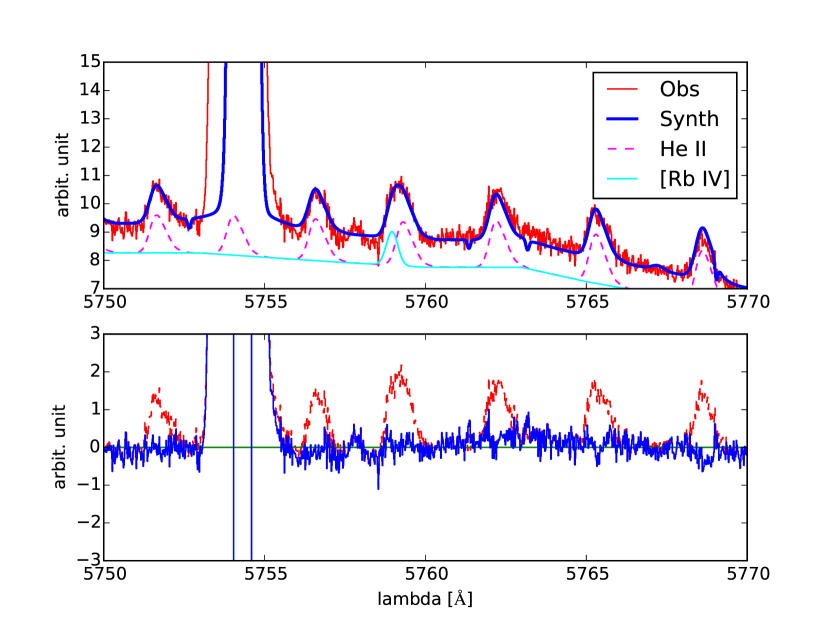
We identify two lines of Rb in the spectrum of NGC 3918. These identifications are complicated by blending with other features, especially the [Rb iv] 5759.55 one. We reported the detection of this line as an excess intensity in the He ii 5–47 5759.74 line. We have assumed He ii (5759.55)/(H)=0.0082 for =12000 K and =1000 cm-3 (Storey & Hummer, 1995) to correct for the contribution of this line. This give us a contribution of 36.4% of the [Rb iv] line to the total measured flux. Moreover, we used PySSN to check this by fitting the expected profile of a He ii line to this line, finding an excess of 35% at the wavelength where we expect to find the [Rb iv] emission (see Fig. 6). Therefore, we consider that this is a quite robust identification. Unfortunately, we could not detect the [Rb iv] 9008.74 line, which arises from the same upper level as 5759.74 line and that could give us an additional constraint for [Rb iv] line identification, because it falls in a zone with a strong telluric absorption band.
Some authors report the identification of the [Rb v] 5363.37 line in the spectra of PNe (Péquignot & Baluteau, 1994; Sharpee et al., 2007). The most likely contaminants to this line would be the [Ni iv] 5363.35 and O ii – 5363.80 lines (Sharpee et al., 2007). We do not detect other [Ni iv] lines belonging to the same multiplet and, therefore, we discard this line as contributing to the measured flux. On the other hand, regarding the possible detection of the O ii line, we inspected our spectra looking for other O ii lines arising from the lower level of the O ii 5363.80 transition () and tentatively detected a feature at 4609.15 Å, corresponding to the – 4609.4 transition, but its flux cannot be properly measured because it is strongly affected by a much brighter charge transfer feature. Other lines arising from the level, such as O ii 4282.02, 4312.11 or ending in this level, such as 5321.97, 5361.74, 5363.80 or 5375.57 were not detected in our spectrum. Additionally, the O ii line profiles are different to the profile observed and, therefore, the [Rb v] 5363.37 identification is tentatively adopted.
3.2.4 Xe line identifications
Several Xe identifications are considered probable in the spectrum of NGC 3918. Péquignot & Baluteau (1994) identify [Xe iii] 5846.77 line as an excess intensity in the He ii 5–31 5846.66 line in NGC 7027. Similarly, Sharpee et al. (2007) also detect this blend in objects in their sample. Following the same procedure of the [Rb iv] line identification and assuming the theoretical He ii (5846.66)/(H)=0.0247 ratio for =12000 K and =1000 cm-3 (Storey & Hummer, 1995) to correct for the contribution of this line, we find a contribution of 8% of the [Xe iii] line to the total measured flux. As this is a rather uncertain estimation, and it lies within the uncertainties of the measured flux, we used the emission line spectral synthesis code PySSN to fit the expected profile of an He ii line finding that, in principle, there is no substantial contribution of the [Xe iii] line to the measured flux. Therefore, we cannot conclude that [Xe iii] 5846.77 is detected in our spectrum. Nevertheless, we do the exercise of computing an upper limit to the Xe2+ abundance adopting the flux excess measured in the He ii line as the flux of the [Xe iii] line.
We identify two possible [Xe iv] lines at 5709.10, 7535.4 Å. The [Xe iv] 5709.21 is well separated from the widely observed N ii multiplet 3 5710.77 line. Other potential contaminants, such as [Fe i] 5708.91 and the intercombination Fe ii] 5709.04 line, can be discarded since no other lines of these ions are observed in the spectrum of NGC 3918 (a situation similar to what Sharpee et al. (2007) report for most of their objects). Sharpee et al. (2007) argue that all the lines most likely to affect the [Xe iv] 7535.4 emission come from low ionization ions (Fe ii] 7535.4, Ne ii 7534.75, [Cr ii] 7534.80, N ii 7535.10 and Ne i 7535.77). Given the profile of the line we detect and the excitation of NGC 3918, we can safely discard all of them as possible contributors to the measured flux and, hence, we consider [Xe iv] 7535.4 as a robust identification. The excellent agreement between the observed and theoretical intensities of the 5709.10 and 7535.4 features strongly supports their identification with [Xe iv]. The intensity ratio of these lines agree within 17% with what is expected from their collisional strengths and is consistent with the uncertainties of these lines.
We do not detect any [Xe v] line in our spectra. Sharpee et al. (2007) report the possible detection of the [Xe v] 7076.8 line in the two most excited PNe of their sample. Although we do detect an emission feature at 7076.5 Å, the feature is strongly affected by telluric absorptions, making its flux unreliable. On the other hand, we do not detect any line near 5228.8 Å or near 6998.7 Å, which correspond to the laboratory wavelengths of the [Xe v] – transitions. In the first case, no emission was detected and in the second case, telluric absorption lines preclude the identification of any emission line.
Péquignot & Baluteau (1994) and Sharpee et al. (2007) report the detection of [Xe vi] 6408.89 line in the spectrum of NGC 7027 on the red wing of the He ii 5–15 6406.38 line. We also detect two extremely faint features at a similar position. We discard the identification of these lines in terms of a double-peaked line of [Fe iii] 6408.50, owing to the low number of [Fe iii] identifications in our spectrum and to the different line profile of [Fe iii] lines. Alternative identifications could be the C iv 6408.1, 6408.8 lines. Sharpee et al. (2007) discard these identifications owing to the high excitation of these lines, although they report the detection of other C iv lines in the spectrum of NGC 7027. Since we detect other brighter lines of the series, we confirm the identification of the C iv – 6408.1. However, the second line can hardly be C iv – 6408.8, since there are no other lines of the series in our spectra. The identification of this line as [Xe vi] 6408.90 is also highly questionable, given the faintness of the line; however, when we compute the Xe5+ abundance from this line, we find a reasonable result (see Sect. 5.1).
Since the intensities of several n-capture element lines are corrected by deblending other nebular or telluric lines, in Table 4 we show the detected n-capture element lines with line intensities corrected for contamination from other features. In the following, we comment on identifications of individual neutron-capture elements.
| (Å ) | Ion | Error(%) | |
|---|---|---|---|
| 5346.02 | [Kr iv] | 0.105 | 6 |
| 5363.37 | [Rb v] | 0.0045 | 38 |
| 5709.21 | [Xe iv] | 0.0065 | 27 |
| 5759.55 | [Rb iv] | 0.0047 | : |
| 5846.77 | [Xe iii] | 0.0021 | : |
| 5867.74 | [Kr iv] | 0.131 | 15 |
| 6256.10 | [Kr v] | 0.0078 | 23 |
| 6408.80 | [Xe vi] | 0.0039 | : |
| 6826.70 | [Kr iii] | 0.0284 | 12 |
| 7535.40 | [Xe iv] | 0.0076 | 23 |
| 8845.00 | [Se iii] | 0.0058 | : |
4 Physical conditions
The large number of emission lines identified and measured in the spectrum of NGC 3918 allows us to derive physical conditions using multiple emission-line ratios. The computations of physical conditions were carried out with PyNeb 1.0.9 (Luridiana et al., 2015), a python-based package dedicated to the analysis of emission line spectra. The methodology followed for the derivation of the electron density, , and the electron temperature, , has been described in previous papers of our group. We have updated the atomic data set to state-of-the-art atomic data, presented in Tables 5 and 6 for collisionally excited lines (CELs) and optical recombination lines (ORLs), respectively. Errors in the diagnostics were computed via Monte Carlo simulations. We generate 1500 random values for each line intensity using a Gaussian distribution centered in the observed line intensity with a sigma equal to the associated uncertainty. For higher number of Monte Carlo simulations, the errors in the computed quantities remain constant. The electron temperatures and densities are presented in Table 7.
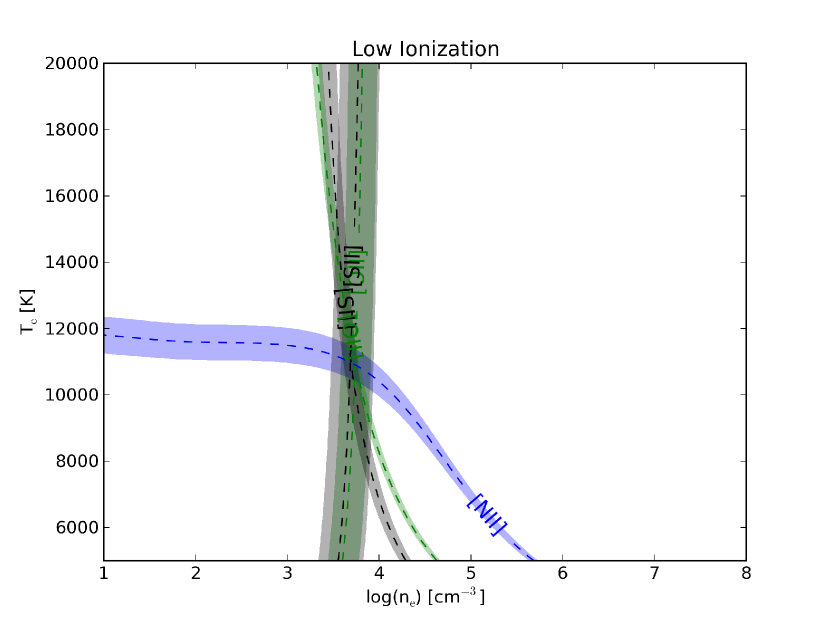
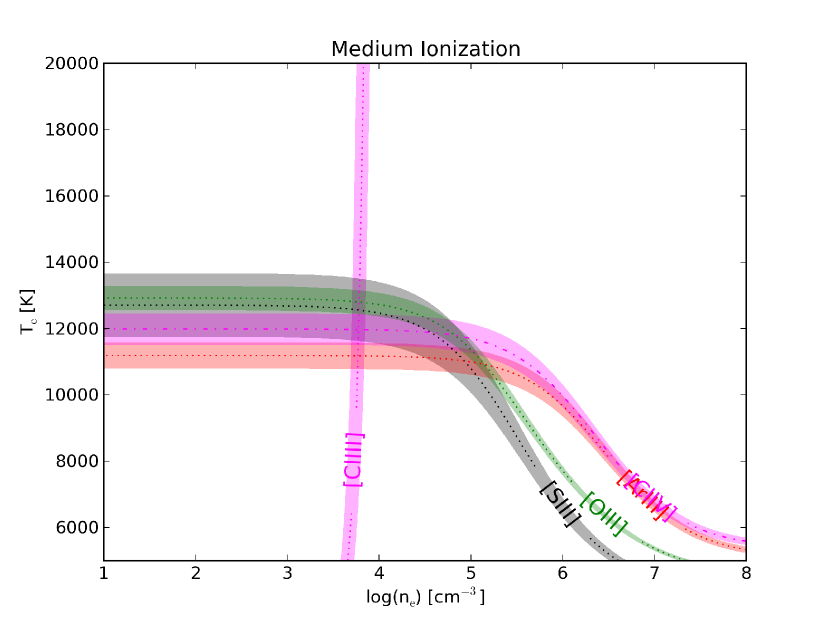
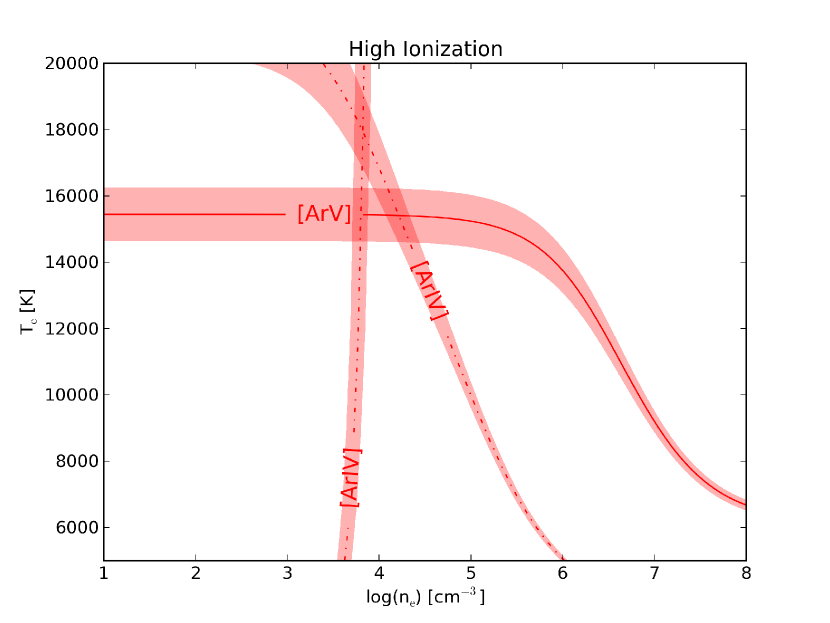
For the calculation of ionic abundances (see Section 5) we assumed a three-zone ionization scheme. For , we obtained very similar results from the different diagnostics; therefore, we adopted the average of ([O ii]), ([S ii]), ([Cl iii]) and ([Ar iv]) as representative of the whole nebula. We adopted the average of electron temperatures obtained from [N ii], [S ii] and [O ii] lines as representative of the low-ionization zone (IP 17 eV); we refer to this value as (low). Similarly, the average of electron temperatures obtained from [O iii], [Ar iii], [S iii] and [Cl iv] lines was assumed as representative of the medium-ionization zone (17 eV IP 39 eV) and designated (mid). Finally, the electron temperature from [Ar v] (see below) was adopted as representative of the high-ionization zone (IP 39 eV) and designated (high) (see Table 7).
Following Eqs. (1) and (2) by Liu et al. (2000), we corrected the intensity of the auroral [N ii] 5755 line and the trans-auroral [O ii] 7320+30 lines from the recombination contribution. We assumed preliminary computations of the N++/H+ and O++/H+ ratios obtained from N ii multiplets 3, 39 and 48 and from the O ii multiplet 1 to compute the recombination contributions to [N ii] 5755 line and [O ii] 7320+30 lines, respectively. These contributions led to a 6% correction in the [N ii] line and in the [O ii] lines, which translate in temperatures lower by 300 K in both temperature diagnostics. Additionally, we also corrected the contribution of the He ii 5–49 5754.67 line ((He ii 5.49)/(H)0.0078). Given the high ionization degree of NGC 3918, the recombination contribution to the auroral 4363 line may also be non-negligible; we estimated it using Eq. (3) of Liu et al. (2000), where the O3+/H+ ratio was estimated assuming O3+/H+=(He/He+)2/3(O+/H++O++/H+). Using the values derived for He+/H+ and He++/H+ from ORLs (see Table 9) and O+/H+ and O++ /H+ from CELs (see Table 8), this contribution amounts to 1%, which has almost no effect on the determination of ([O iii]) and therefore, was not considered.
| Transition | Collisional | |
| Ion | Probabilities | Strengths |
| N+ | Froese Fischer & Tachiev (2004) | Tayal (2011) |
| O+ | Froese Fischer & Tachiev (2004) | Kisielius et al. (2009) |
| O2+ | Froese Fischer & Tachiev (2004) | Storey et al. (2014) |
| Storey & Zeippen (2000) | ||
| Ne2+ | Galavís et al. (1997) | McLaughlin & Bell (2000) |
| Ne3+ | Butler & Zeippen (1989) | Giles (1981) |
| Bhatia & Kastner (1988) | ||
| Ne4+ | Galavís et al. (1997) | Dance et al. (2013) |
| Bhatia & Doschek (1993) | ||
| Unknown | ||
| Na3+ | Becker et al. (1989) | Giles (1981) |
| Bhatia & Kastner (1988) | ||
| S+ | Podobedova et al. (2009) | Tayal & Zatsarinny (2010) |
| S2+ | Podobedova et al. (2009) | Tayal & Gupta (1999) |
| Cl+ | Mendoza & Zeippen (1983) | Tayal (2004) |
| Cl2+ | Mendoza (1983) | Butler & Zeippen (1989) |
| Cl3+ | Kaufman & Sugar (1986) | Galavís et al. (1995) |
| Mendoza & Zeippen (1982a) | ||
| Ellis & Martinson (1984) | ||
| Ar2+ | Mendoza (1983) | Galavís et al. (1995) |
| Kaufman & Sugar (1986) | ||
| Ar3+ | Mendoza & Zeippen (1982b) | Ramsbottom & Bell (1997) |
| Ar4+ | Mendoza & Zeippen (1982a) | Galavís et al. (1995) |
| Kaufman & Sugar (1986) | ||
| LaJohn & Luke (1993) | ||
| K3+ | Kaufman & Sugar (1986) | Galavís et al. (1995) |
| Mendoza (1983) | ||
| K4+ | Kaufman & Sugar (1986) | Butler et al. (1988) |
| Mendoza (1983) | ||
| Ca4+ | Kaufman & Sugar (1986) | Galavís et al. (1995) |
| Mendoza (1983) | ||
| Fe2+ | Quinet (1996) | Zhang (1996) |
| Johansson et al. (2000) | ||
| Fe3+ | Froese Fischer et al. (2008) | Zhang & Pradhan (1997) |
| Fe4+ | Nahar et al. (2000) | Ballance et al. (2007) |
| Fe5+ | Chen & Pradhan (2000) | Chen & Pradhan (1999) |
| Fe6+ | Witthoeft & Badnell (2008) | Witthoeft & Badnell (2008) |
| Se2+ | Biémont & Hansen (1986b) | Schoning (1997) |
| Kr2+ | Biémont & Hansen (1986b) | Schoning (1997) |
| Kr3+ | Biémont & Hansen (1986a) | Schoning (1997) |
| Kr4+ | Biémont & Hansen (1986a) | Schoning (1997) |
| Rb3+ | Biémont & Hansen (1986a) | Schoning (1997)a |
| Rb4+ | Biémont & Hansen (1986b) | Schoning (1997)b |
| Xe2+ | Biémont et al. (1995) | Schoening & Butler (1998) |
| Xe3+ | Biémont et al. (1995) | Schoening & Butler (1998) |
| Xe5+ | Biémont et al. (1995) | Schoening & Butler (1998) |
- a
-
Scaled from Kr3+ effective collision strengths.
- b
-
Scaled from Kr4+ effective collision strengths.
| Ion | Recombination Coefficients |
|---|---|
| H+ | Storey & Hummer (1995) |
| He+ | Porter et al. (2012, 2013) |
| He2+ | Storey & Hummer (1995) |
| C2+ | Davey et al. (2000) |
| N2+ | Fang et al. (2011, 2013) |
| ´ | Escalante & Victor (1992) |
| Kisielius & Storey (2002) | |
| O2+ | Storey (1994) |
| Liu et al. (1995) | |
| CNO3+ | Péquignot et al. (1991) |
| Nussbaumer & Storey (1984) | |
| CO4+ | Péquignot et al. (1991) |
| N4+ | Péquignot et al. (1991) |
| Nussbaumer & Storey (1984) | |
| Ne2+ | Kisielius et al. (1998) |
| Kisielius & Storey (private communication) |
| Diagnostic | |
|---|---|
| (cm-3) | |
| [S ii] 6716/6731 | 5000 |
| [O ii] 3726/3729 | 5600 |
| [Cl iii] 5517/5537 | 6000 |
| [Ar iv] 4711/4741 | 6500 |
| Adopted | 62001250 |
| (K) | |
| [N ii] 5755/6548 | 10950700 |
| [O ii] 3726+29/7320+30 | 113502800 |
| [S ii] 4068+76/6716+31 | 106501800 |
| (low) (adopted) | 110001350 |
| [O iii] 4363/4959 | 12800400 |
| [S iii] 6312/9069 | 12550950 |
| [Ar iii] 5192/7136 | 11200400 |
| [Cl iv] 5323/7531+8046 | 11950450 |
| (mid) (adopted) | 12100300 |
| [Ar iv] 7170+263/4711+40 | 179001250 |
| [Ar v] 4626/6425+7005 | 15400800 |
| (high) (adopted) | 15400800 |
| (BJ) | 117501400 |
In Figure 7 we show the diagnostics diagrams obtained for each ionization zone in NGC 3918. It is worth noting the agreement between the different diagnostics except for the high-ionization zone, where [Ar iv] temperature diagnostic gives a very high . We discarded ([Ar iv]) because we notice in a previous paper (see section 4.3 of García-Rojas et al., 2013) that the ratio between collisional strengths for [Ar iv] 7170+263 and 4711+40 lines might be unreliable. Therefore, only the [Ar v] diagnostic was considered for the high-ionization zone.
The electron temperature can also be derived from the ratio between the Balmer discontinuity end the H i lines belonging to the Balmer serie. We use the expression given by Liu et al. (2001) to compute the electron temperature (BJ) from the ratio of the Balmer discontinuity to (H11).
The physical conditions reported in Table 7 agree within the uncertainties with the physical conditions reported by Clegg et al. (1987) and Tsamis et al. (2003b).
5 Chemical abundances
5.1 Ionic abundances from CELs
Ionic abundances from CELs were computed using PyNeb (Luridiana et al., 2015) and the atomic data in Table 5. To perform the computations required for this paper, we updated PyNeb by including several new ions; the updated version of PyNeb (1.0.9) was uploaded to the PyNeb website333http://www.iac.es/proyecto/PyNeb/. For highly ionized Fe ions, we adopt the data recommended by Delgado-Inglada & Rodríguez (2014), and for neutron-capture elements we use the atomic data references compiled by Sharpee et al. (2007). Errors in the line fluxes and the physical conditions were propagated via Monte Carlo simulations. As pointed out in Sect. 4, we use a three-zone scheme of the nebula, adopting a unique value in the three zones and (low) for ions with IP17 eV (i. e. N+, O+, S+ and Fe2+), (mid) for ions with 17 eV IP 39 eV (i. e. O2+, S2+, Cl2+, Cl3+, Ar2+, Fe3+, Se2+, Kr2+, Kr3+, Xe2+ and Xe3+), and (high) for ions with IP 39 eV (i. e. Ne2+, Ne3+, Ne4+, Na3+, Ar3+, Ar4+, K3+, K4+, Ca4+, Fe4+, Fe5+, Fe6+, Kr4+, Rb3+, Rb4+ and Xe5+). Ionic abundances are presented in Table 8, along with the lines used to compute them. We avoid using auroral lines in abundance computations because they do not affect significantly the computed abundances but can introduce some scatter.
Since transition probabilities and effective collision strengths for several of the detected Fe-peak species ([Cr ii], [Cr iii], [Mn iv], [Mn v], [Co iv], [Ni v], [Cu v], and [Cu vi]) are unknown, we are unable to determine the ionic or elemental abundances of these species. Most of these ions require large model atoms (30-50 levels), as used for Fe ions (e. g. Rodríguez & Rubin, 2005; Delgado-Inglada & Rodríguez, 2014) in order to accurately determine the fractional populations of the upper levels of the observed transitions. Gas-phase abundances of these species would provide valuable information regarding the chemical content of dust grains in PNe and AGB star winds. New atomic data determinations are needed to make such investigations possible.
| Ion | Lines used | 12 + log(Xi+/H+)a |
|---|---|---|
| N+ | [N ii] 6548+84 | 7.12 |
| O+ | [O ii] 3726+29 | 7.58 |
| O2+ | [O iii] 4959, 5007 | 8.470.04 |
| Ne2+ | [Ne iii] 3868, 3967 | 7.800.04 |
| Ne3+ | [Ne iv] 4714+15, 4724+25 | 7.500.15 |
| Ne4+ | [Ne v] 3345, 3425 | 7.200.08 |
| Na3+ | [Na iv] 3242, 3362 | 5.530.08 |
| S+ | [S ii] 6717+31 | 5.57 |
| S2+ | [S iii] 8829, 9069 | 6.450.07 |
| Cl+ | [Cl ii] 9123 | 3.890.11 |
| Cl2+ | [Cl iii] 3353, 5517+37, 8434 | 4.840.05 |
| Cl3+ | [Cl iv] 7531, 8045 | 4.870.04 |
| Ar2+ | [Ar iii] 3109, 7136, 7751 | 6.100.04 |
| Ar3+ | [Ar iv] 4711+40 | 6.100.04 |
| Ar4+ | [Ar v] 6435, 7005 | 5.210.06 |
| K3+ | [K iv] 6102, 6796 | 4.140.06 |
| K4+ | [K v] 4123+63 | 4.100.07 |
| Ca4+ | [Ca v] 5309 | 3.760.06 |
| Fe2+ | [Fe iii] 4701+55, 4881, 5270 | 4.01 |
| Fe3+ | [Fe iv] 6740 | 4.35: |
| Fe4+ | [Fe v] 3891+95, 4181, 4227 | 4.380.07 |
| Fe5+ | [Fe vi] 5278, 5335+70, 5424+27+85, 5631+77 | 4.250.06 |
| Fe6+ | [Fe vii] 5158, 5276, 5720. 6086 | 4.140.06 |
| Se2+ | [Se iii] 8854 | 2.79 |
| Kr2+ | [Kr iii] 6827 | 3.230.06 |
| Kr3+ | [Kr iv] 5346, 5868 | 3.620.05 |
| Kr4+ | [Kr v] 6256 | 2.600.11 |
| Rb3+ | [Rb iv] 5760 | 2.41: |
| Rb4+ | [Rb v] 5364 | 1.83 |
| Xe2+ | [Xe iii] 5847 | 1.47 |
| Xe3+ | [Xe iv] 5709, 7535 | 2.410.08 |
| Xe5+ | [Xe vi] 6409 | 1.37: |
- a
-
Only lines with intensity uncertainties lower than 40% have been considered, except in the case of Fe3+ and neutron-capture lines, where we used all the available lines (see text).
5.2 Ionic abundances from recombination lines
In the following subsections, we present ionic abundances for He, C, N, O and Ne derived from ORLs. We adopt the physical conditions derived from CELs to compute the abundances, as ORLs depend only weakly on electron temperature and are essentially independent on the electron density under the low density conditions of NGC 3918.
5.2.1 He+ and He++ abundances
We detect several He i emission lines in the spectrum of NGC 3918. These lines arise mainly from recombination, but some of them can be affected by collisional excitation and self-absorption effects. We use the effective recombination coefficients compiled in Table 6 for H i and He i. Both collisional contribution effects and the optical depth in the triplet lines are included in the computations. Using PyNeb, we determine the He+/H+ ratio from the three brightest He i emission lines: 4471, 5876 and 6678.
We measure multiple He ii emission lines in the spectrum of NGC 3918, but, to compute the He2+/H+ ratio, we use only the 11 brightest ones among those not affected by telluric features or line blending (3203, 4100, 4200, 4339, 4542, 4686, 4859, 5412, 6560, 7593 and 8237 Å). The computation adopts the recombination coefficients computed by Storey & Hummer (1995). The adopted He+/H+ and He2+/H+ ratios are presented in Table 9.
| Ion | 12+log(Hei+/H+) |
|---|---|
| He+/H+ | 10.770.02 |
| He2+/H+ | 10.630.01 |
5.2.2 Ionic abundances from C, N, O and Ne recombination lines
A well known problem of nebular astrophysics is the difference between the chemical composition of photoionized plasmas as derived from collisionally excited lines and from recombination lines (ORLs). This discrepancy is parametrized in terms of an abundance discrepancy factor (ADF), which is defined as:
| (1) |
where Xi+/H+ is the abundance of -times ionized element X relative to H+. ADFs may reach values of 2-3 in H ii regions (García-Rojas & Esteban, 2007) and up to 120 in PNe, with an average value of about 3 (McNabb et al., 2013; Corradi et al., 2015).
Thanks to the high quality of our data, we could measure a large number of permitted lines of heavy-element ions such as O i, O ii, O iii, O iv, C ii, C iii, C iv, N ii, N iii, N iv, Ne ii, Si ii, Si iii, Mg i, and Mg ii, many of them detected for the first time in NGC 3918, and compute the ADF for several ions. Unfortunately, many of these permitted lines are affected by fluorescence or blended with telluric emission lines, making their measured intensities unreliable. A discussion on the mechanisms of formation of permitted lines can be found in Esteban et al. (1998, and references therein); Esteban et al. (2004, and references therein). We could not estimate the Mg2+/H+ ratio because the pure RL of Mg ii 4481 is affected by charge transfer in the CCD and its flux is unreliable.
The abundances are derived using the atomic data compiled in Table 6. For C3+, N3+, N4+, and O3+ we take also into account the contribution of dielectronic recombination computed by Nussbaumer & Storey (1984). We selected the lines formed by pure recombination to compute ionic abundances from ORLs in PNe (see Liu et al., 2000; Tsamis et al., 2004). For C iv, N iii and N iv lines and some multiplets of O iii and O iv, we adopt the log()s given by the computations in the Atomic Line List v2.05b18444webpage at: http://www.pa.uky.edu/peter/newpage/. The log() values necessary to compute abundances from the remaining lines for which we have assumed LS-coupling have been adopted from the local thermodynamic equilibrium (LTE) computation predictions from Wiese et al. (1996).
C ORLs.
Owing to the high ionization of NGC 3918, we detect lines of C ii, C iii and C iv that are excited by pure recombination and therefore are suitable for abundance determinations (see García-Rojas et al., 2009, and references therein). In Table 10 we show the ionic abundances from recombination lines of C. The results obtained for the different multiplets of each given ion clearly show the excellent agreement between the different lines, strengthening the hypothesis of the recombination origin of these lines. Tsamis et al. (2004) computed the ADF for C2+ and C3+ by comparing the abundances obtained from C ii and C iii ORLs with the abundances obtained from IUE UV data of the C iii] 1906+09 CELs and the C iv 1549 resonant doublet, respectively. Our ORL C2+ abundances are in good agreement with those obtained by Tsamis et al. (2004) but, on the other hand, we obtain C3+ and C4+ abundances that are somewhat higher than those obtained by Tsamis et al. (2004). In our case the comparison between UV CELs and optical ORLs is meaningless because optical and IUE UV observations do not cover the same volume of NGC 3918.
| Mult. | ()/(H) (10-2) | Ci+/H+(10-5) | |
| C2+/H+ | |||
| 6 | 4267.15 | 0.4730.024 | 45 |
| 16.04 | 6151.43 | 0.0210.003 | 47 |
| 17.02 | 9903.46b | 0.1470.016 | 58 |
| 17.04 | 6461.95 | 0.0490.004 | 46 |
| 17.06 | 5342.38 | 0.0250.003 | 45 |
| Adopted | 452 | ||
| C3+/H+ | |||
| 1 | 4647.42c | 0.2350.012 | 19 |
| 16 | 4067.94d | 0.113: | 20 |
| 4068.91d | 0.148: | 20 | |
| 4070.26d | 0.193: | 20 | |
| Sum | 20 | ||
| 18 | 4186.90 | 0.1690.010 | 21 |
| Adopted | 202 | ||
| C4+/H+ | |||
| 8 | 4657.55 | 0.3300.023 | 12 |
| 4658.20 | * | * | |
| 8.01 | 7726.20 | 0.1520.014 | 15 |
| Adopted | 132 | ||
- a
-
Only lines with intensity uncertainties lower than 40% have been considered (see text).
- b
-
Blend with [Kr iii] 9902.3 line.
- c
-
Blend with unknown line.
- d
-
Corrected from the contribution of [S ii] 4068.6 line and O ii 4069.62+.89 lines.
N ORLs.
Several permitted lines of N ii, N iii and N iv are detected in our spectrum. We compute the N2+/H+ ratios from N ii permitted lines of multiplets 3, 12, 39 and 48, which are mainly excited by recombination and are not sensitive to optical depth effects (Liu et al., 2004). We assume the recombination coefficients by Fang et al. (2011, 2013) except in the case of multiplets 12 and 48, for which Fang et al. (2011, 2013) do not compute recombination coefficients and, therefore, we adopt the recombination coefficients by Kisielius & Storey (2002) for multiplet 12 and Escalante & Victor (1992) for multiplet 48.
Lines belonging to multiplets 1 and 2 are the brighest N iii lines detected in our spectrum, but they are not reliable for abundance determinations because they appear to be excited by the Bowen mechanism (Grandi, 1976). However, other N iii lines are detected in our spectrum but the recombination coefficients are only available for the multiplet 18 N iii 4379.11 line (see Péquignot et al., 1991). This is a – transition that cannot be excited by mechanisms other than recombination. Unfortunately, this line is probably blended with the O iii 4379.6 Å line; as the relative strength of this O iii line with other detected lines belonging to the same multiplet is not available, we can only give an upper limit to the N3+/H+ ratio.
We detect several N iv in the spectrum of NGC 3918, but only a handful of them have available recombination coefficients (Péquignot et al., 1991). These lines give relatively similar results for the N4+/H+ ratio and most of them are transitions between high levels and, therefore, are probably excited by pure recombination. The – transition gives very similar results to the other lines and, therefore, recombination is its most probable excitation mechanism. Similarly to the case of C ions, although there are IUE UV CELs data available for N3+ and N4+ ions for NGC 3918, a comparison with our ORL abundances would not be meaningful since optical and UV observations do not cover the same volume of the nebula.
| Mult. | ()/(H) (10-2) | Ni+/H+ (10-5) | |
|---|---|---|---|
| N2+/H+ b | |||
| 3 | 5666.64 | 0.0190.002 | 10 |
| 5676.02 | 0.0080.002 | 8 | |
| 5679.56 | 0.0410.003 | 12 | |
| 5710.76 | 0.0070.002 | 10 | |
| Sum | 10 | ||
| 12 | 3994.98 | 0.0080.003 | 8 |
| 39 | 4041.31 | 0.0210.003 | 16 |
| 48 | 4239.40 | 0.0790.006c | 30 |
| Adopted | 101 | ||
| N3+/H+ | |||
| 18 | 4379.11d | 0.160 | 7 |
| Adopted | 7 | ||
| N4+/H+ | |||
| 3S–3P0 | 3483.00 | 0.0330.013 | 1.6 |
| 1,3G–3H0 | 4606.33 | 0.0760.005 | 1.9 |
| 1,3G–1,3H0 | 7581.90 | 0.0830.019 | 1.2 |
| 1,3H0–1,3I | 7702.96 | 0.0250.003 | 1.9 |
| Adopted | 1.80.5 | ||
- a
-
Only lines with intensity uncertainties lower than 40% have been considered (see text).
- b
- c
-
The reported flux ratio is the sum of the contribution of three individual lines at 4236.91, 4237.05 and 4241.78 Å.
- d
-
Blended with O iii 4379.6 Å.
O ORLs.
We detect a large number of O ii permitted lines in our spectrum. Esteban et al. (2004) argue that the best lines to compute O2+ abundances from ORLs are those belonging to multiplets 1, 2, 10, 20, and from the – transitions, which are mainly excited by recombination. However, we detect other multiplets that, at the excitation of NGC 3918, are not expected to be affected by any fluorescence effects. In Fig. 8 we show the region of the multiplet 1 O ii ORLs, which are the brightest O ii ORLs in the spectrum of NGC 3918 (of order 10 (H)). The upper levels of the transitions of this multiplet may be affected by departures from local thermodynamic equilibrium (LTE) for densities 104 cm-3 (Tsamis et al., 2003a; Ruiz et al., 2003). In such a case, the abundances derived from the various lines assuming LTE may differ from each other by large factors. To account for such effect, we apply the non-LTE corrections estimated by Peimbert et al. (2005), obtaining abundances from individual lines in good agreement; we also derive the abundance using the sum of all lines of the multiplet following the recipe given by Esteban et al. (1998). This abundance, which is not affected by non-LTE effects, agrees with those derived from individual lines. In Table 12 we present the values obtained for the individual lines, as well as those derived from the sum of all the lines of a given multiplet. We only consider lines with errors lower than 40%; for transitions, when available, we average lines with errors 40%, otherwise, we average all available lines and quote the final value with an uncertainty higher than 40%. For 3–3 transitions we use the recombination coefficients assuming LS-coupling by Storey (1994). In all the other cases (3–3 and 3–4 transitions) we use the intermediate-coupling scheme by Liu et al. (1995).
As seen in Table 12, the abundances computed from multiplets 1, 5, 10, 20, and – transitions (averaged value) agree within a 15% uncertainty. However, multiplets 2 and 19 give abundances that are a factor of 1.7-2 lower and multiplet 12 give an abundance that is 10% higher than the abundances derived from the other lines. Liu et al. (2000) report a similar behavior for multiplet 2 and claim that departure from case B to case A could resolve this discrepancy. However, considering case A we obtain abundances that are a factor of 1.4 higher but still too low compared to the other multiplets. Taking into account that multiplet 1 is the most widely used proxy of the O2+/H+ ratio from ORLs and that the derived abundance from this multiplet agrees with the one derived from multiplets 5, 10, 20, and transitions, we finally adopt the average abundance weighted by the uncertainties of multiplets 1, 5, 10, 20, and lines as representative of the O++ abundance from ORLs. From this value, we compute an ADF(O2+)=1.80.3, which is in good agreement with the value obtained by Tsamis et al. (2004) for NGC 3918 for their comparison between optical CELs and ORLs (ADF(O2+)=1.85).
We detect several lines of O iii in the spectrum of NGC 3918. We do not consider the brighest O iii lines (i. e. those belonging to multiplets 2 and 5) because they are probably excited by other mechanisms than recombination (see Grandi, 1976; Clegg & Walsh, 1985). We compute the O3+/H+ ratio from ORLs from multiplet 8 of O iii, which has contributions from both radiative and dielectronic recombination (Liu & Danziger, 1993).
Several O iv lines are detected in our spectrum. We use the 2G–2H0 O iv 4631.89 and the 2G–2H0 O iv 7677.40 lines to compute the O4+/H+ ratio since they are hardly excited by other mechanisms than recombination.
| Mult. | ()/(H) (10-2) | Oi+/H+ (10-5) | |
| O2+/H+ | |||
| 1b | 4638.85 | 0.1140.010 | 66 |
| 4641.81 | 0.1090.030 | 42 | |
| 4649.14 | 0.2190.037 | 65 | |
| 4650.84 | 0.031: | 17: | |
| 4661.64 | 0.1140.027 | 59 | |
| 4676.24 | 0.0510.024 | 55 | |
| Sum | 52 | ||
| 2 | 4317.14 | 0.0190.003 | 27 |
| 4319.63 | 0.0160.003 | 22 | |
| 4336.83 | 0.0110.003 | 36 | |
| 4345.56 | 0.0220.003 | 28 | |
| 4349.43 | 0.0530.005 | 26 | |
| Sum | 27 | ||
| 5 | 4416.97 | 0.0290.004 | 51 |
| 10c | 4069.62 | 0.135: | 53: |
| 4069.89 | * | * | |
| 4072.15 | 0.133: | 55: | |
| 4075.86 | 0.184: | 53: | |
| 4078.84 | 0.0210.003 | 57 | |
| 4092.93 | 0.0180.003 | 51 | |
| Sum | 53 | ||
| 12c | 3882.19 | 0.0210.003 | 61 |
| 19c | 4132.80 | 0.0150.003 | 28 |
| 4153.30 | 0.0260.003 | 33 | |
| Sum | 31 | ||
| 20c | 4110.79 | 0.0070.002 | 30 |
| 4119.22 | 0.0530.005 | 61 | |
| Sum | 57 | ||
| – | 4087.15 | 0.0150.003 | 51 |
| 4095.64 | 0.0070.002 | 32 | |
| 4275.55 | 0.0360.004 | 60 | |
| 4285.69 | 0.0110.003 | 50 | |
| 4288.82 | 0.005: | 87: | |
| 4291.25 | 0.0100.003 | 55 | |
| 4303.61 | 0.0040.001 | 60 | |
| 4303.82 | 0.0280.003 | 60 | |
| 4602.13 | 0.0080.002 | 44 | |
| 4613.68 | 0.003: | 70: | |
| Average | 46 | ||
| Adopted | 527 | ||
| O3+/H+ | |||
| 8 | 3260.86 | 0.2860.026 | 18 |
| 3265.33 | 0.3100.028 | 13 | |
| 3284.45 | 0.024: | 12 | |
| Sum | 15 | ||
| Adopted | 152 | ||
| O4+/H+ | |||
| 2G–2H0 | 4631.89 | 0.1530.009 | 5 |
| 20 | 7677.40 | 0.0240.003 | 5 |
| Adopted | 51 | ||
- a
-
Only lines with intensity uncertainties lower than 40% have been considered (see text).
- b
-
Corrected from non-LTE effects (see text).
- c
-
Recombination coefficients in intermediate coupling (Liu et al., 1995).
Ne ORLs.
We detect several permitted lines of Ne ii, belonging to multiplets 1, 7, 39, 55, and 57. To derive Ne++ abundances, we adopt the effective recombination coefficients by Kisielius et al. (1998) for multiplets 1, 7, and 39 and the computations by Kisielius & Storey (unpublished), assuming LS-coupling for multiplets 55 and 57. Transitions from multiplet 1 and 55 are probably the result of recombination because they correspond to quartets and their ground level has a doublet configuration (Esteban et al., 2004). Transitions from multiplets 7 and 57 correspond to doublets and give abundances similar (m57) or lower (m7) than those derived from the multiplet 1 and 55 lines; however, given the high uncertainty in the flux of multiplet 7 3323.74, we do not include this line in the final average abundance. Taking into account that the multiplet 55 lines correspond to transitions, whose upper levels are unlikely to be populated by fluorescence, it seems that in NGC 3918 all these lines are excited mainly by recombination. The multiplet 39 Ne ii 3829.77 line corresponds to an intercombination transition (3p2P0–3d4D) and the abundance derived from it agrees with that derived from other multiplets, so this multiplet is probably mainly excited by recombination. Therefore, we adopt the averaged value from all multiplets as representative of the Ne++ abundance. From our derived Ne2+/H+ ratio from ORLs and CELs, we compute an ADF(Ne2+)=2.540.37, which is somewhat higher than that derived for O2+, but is within the typical range of PNe. A similar result was found by Tsamis et al. (2004).
| Mult. | ()/(H) (10-2) | Nei+/H+ (10-5) | |
|---|---|---|---|
| Ne2+/H+ | |||
| 1 | 3694.22 | 0.0600.013 | 16 |
| 3709.62 | 0.0340.013 | 25 | |
| 3766.26 | 0.0170.005 | 16 | |
| 3777.14 | 0.015: | 15: | |
| Sum | 18 | ||
| 7 | 3323.74 | 0.031: | 8: |
| 39 | 3829.77 | 0.0130.003 | 11 |
| 55 | 4409.30 | 0.0170.003 | 25 |
| 57 | 4428.54 | 0.0110.003 | 25 |
| Adopted | 162 | ||
- a
-
Only lines with intensity uncertainties lower than 40% have been considered (see text).
5.3 Total abundances
To correct for the unseen ionization stages and then derive the total gaseous abundances of chemical elements in NGC 3918, it is necessary to adopt a set of ionization correction factors (ICFs). For most elements, we adopted the ICFs recently developed by Delgado-Inglada et al. (2014) from a large grid of photoionization models and applied them to the ionic abundances computed from CELs, but also provided alternative computations when possible. The ICFs derived in Delgado-Inglada et al. (2014) were designed for large aperture observations (that cover the whole nebulae) as well as for small aperture observations across the central regions of the nebulae. Our observations avoid the central star but the slit is located sufficiently close to cover different ionization zones in the nebula. Moreover, we obtain similar ionic abundances and ionic fractions [for example, of O++/(O++O++) and He++/(He++He++)] than the ones reported in Clegg et al. (1987) and Tsamis et al. (2003b)), whose observations are adequate for these ICFs, and thus, we feel justified the adoption of these ICFs. The total abundances discussed in this section are shown in Table 14 and the specific criteria adopted in each particular case are discussed in the following. Uncertainties in the total abundances were computed through Monte Carlo simulations that take into account uncertainties in line fluxes, physical conditions and ionic abundances For C, N, O, Ne, S, Cl, and Ar, we include in the Monte Carlo simulations the uncertainties in the ICFs reported by Delgado-Inglada et al. (2014).
The total C abundance is computed only from ORLs. The ICF proposed by Delgado-Inglada et al. (2014) in their Eq. (39) is based on C2+ and O2+ derived from ORLs and the result obtained is shown in Table 14. Alternatively, we also compute the C abundance by adding all the ionic abundances from C ii, C iii, and C iv ORLs and taking into account the contribution of C+ by re-scaling the C+/C2+ obtained by Tsamis et al. (2003b) from CELs. The latter value is only 7% higher than the value derived from an ICF (see Table 14).
When computing the O abundance from CELs, we apply the ICF by Delgado-Inglada et al. (2014) to correct for the unseen high-ionization ions. But we can also compute the O abundance from ORLs. As commented in the previous section, ionic abundances are estimated for several O ions from ORLs. Therefore, we can estimate the total O abundance from ORLs by adding the observed ionic species, and taking into account the contribution of O+ by scaling the O+/O2+ obtained from CELs. Alternatively, we can also compute the O total abundance from O2+ obtained from ORLs and the scaled O+ abundance from CELs and the ICF provided by Delgado-Inglada et al. (2014). As shown in Table 14, there is an excellent agreement between both values, indicating that the ICF seems to estimate correctly the contribution of high ionization ions to the total O abundance.
Thanks to the high ionization of NGC 3918, we detect lines of [Ne iii], [Ne iv], and [Ne v] with a high S/N ratio (see Fig. 2). We need to correct for the contribution of Ne+ to the total abundance. Therefore, we compute the total abundance in two ways: i) by adding the ionic chemical abundances, and ii) by using a classical ICF scheme that corrects the observed ionic abundances for the unseen ionization species. We use the ICFs given by Eqs. (17) and (20) of Delgado-Inglada et al. (2014), which give the total Ne abundance when only [Ne iii] lines are observed and both [Ne iii] and [Ne v] lines are observed. All the results are shown in Table 14. The abundance obtained from the sum of the ionic species agree within the uncertainties with that derived using the ICF when [Ne iii] and [Ne v] lines are detected, but it is 0.1 dex higher than that derived using only [Ne iii] lines. Because auroral [Ne iv] lines are quite sensitive to the electron temperature, these ICFs do not use them. Considering all these factors, we adopt as a representative Ne abundance the value given by Eq. (20) of Delgado-Inglada et al. (2014), which is 8.010.06.
For Cl, we detect [Cl ii], [Cl iii], and [Cl iv] lines and, therefore, we use the ICF recommended by Delgado-Inglada et al. (2014) when all these lines are observed (their Eq. 32), which takes into account the contribution of high Cl ionization states.
Similarly to Ne, we detect several ionization stages of Ar in the spectrum of NGC 3918 (see Fig. 2). We compute the total Ar abundance by adding the ionic chemical abundances and by using the ICF proposed by Delgado-Inglada et al. (2014) when only [Ar iii] lines are detected (Eq. 36). The uncertainties associated with the ICF reported by these authors are very high (see their Table 3 and Figure 13). Note that these uncertainties are likely overestimated since they are derived from the maximum dispersion in the ICF given by the grid of photoionization models. This is the reason why we obtain high errors on the Ar/H determination based on this ICF (see Table 14). Given that the ICFs for Kr and Xe are based on Ar abundances, we have tried to find a value for Ar/H with lower uncertainties. We select from the 3MdB models (Morisset et al., 2015) the ones corresponding to the PNe_2014 reference (used by Delgado-Inglada et al., 2014, to compute their ICFs), adding as a selection criteria the fact that the models must reproduce simultaneously the Ar2+/Ar, Ar3+/Ar, Ar3+/Ar, and O2+/O ionic fractions (within 5%). These models then reproduce well the ionization structure of the nebula. The total Ar/H abundance for these models is found to be very close to the sum Ar2+/H + Ar3+/H + Ar3+/H, with an error being less than 2%. Therefore, we will use from now on the sum of these three ionic abundances as representative of the total Ar abundance.
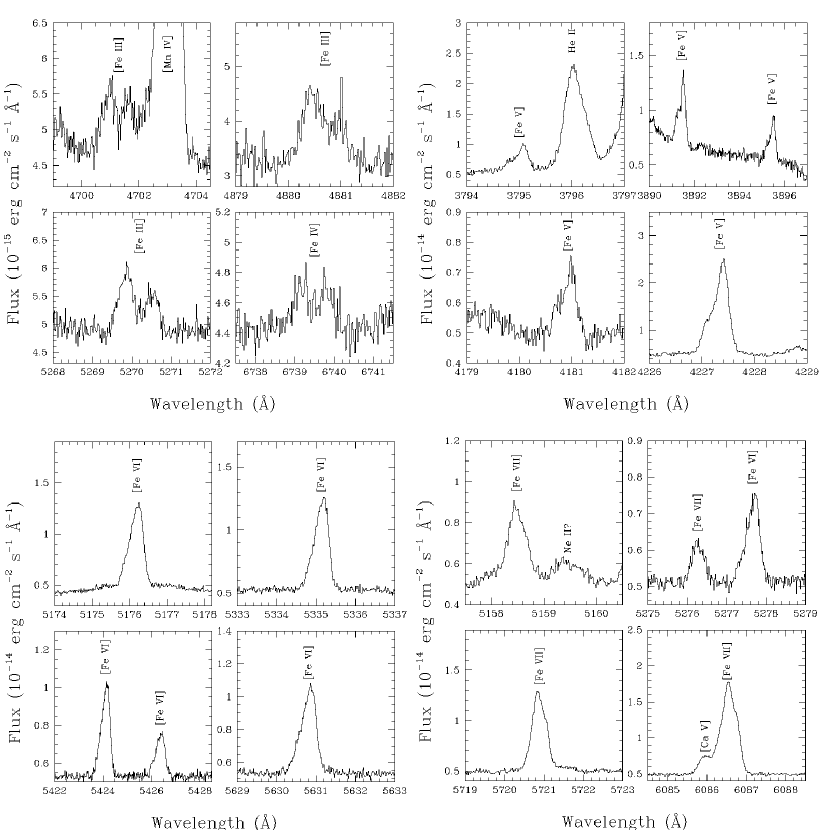
As can be seen in Table 8, we measure several lines of multiple ionization stages of Fe. In Fig. 9 we show some of the lines used to compute ionic chemical abundances. The [Fe iii] lines are usually the brightest iron lines in photoionized nebulae. However, as is shown in Fig 9, this is not the case for NGC 3918, which is an extremely high ionization PN and presents several bright [Fe v], [Fe vi] and [Fe vii] lines. Taking this into account, we use two different approaches to compute the total Fe abundance: i) in the first one, we use the correction scheme suggested by Rodríguez & Rubin (2005), which is based on the detection of [Fe iii] lines and two ICFs, one from photoionization models (their Eq. 2) and one from an observational fit that takes into account all the uncertainties in the atomic data involved in the calculations and that allows us to constrain real iron abundances (Eq. 3); ii) in the second approach, we take advantage of the high ionization degree of the PN and simply compute the total abundance as the sum of all the observed ionic species. The results are shown in Table 14. As can be seen, the sum value is in very good agreement with the value derived from Eq. (2) of Rodríguez & Rubin (2005). Delgado-Inglada & Rodríguez (2014) also find several objects with high-ionization Fe ions. In a similar exercise to ours, they compare the sum of the ionic Fe abundances with the results obtained from the ICFs, but their results do not allow them to conclude which ICF works better. It must be taken into account that their data are more limited than our data both in spectral resolution, which is lower and, thus, prevents deblending some of the lines from other close-by features, and in the S/N ratio of the high-ionization Fe lines, which is also lower. We agree with their conclusion that the inherent limitations of ionization correction schemes are responsible for the different behaviours found and that high-resolution, high-S/N ratio data are needed to improve the ionization correction scheme or to define a new and better one, especially for high ionization PNe.
To estimate the correction for the unseen ions of Ca, K and Na, for which no published ICFs exist, we compute a simple spherical photoionization model of the PN with Cloudy (v. 13.03; Ferland et al., 2013), ionized by a blackbody with =190 kK. The inner and outer radius are set to log()=15.0 and log()=17.16 (in cm); at an assumed distance of 1 kpc, the projected radius equals the observed optical radius (19′′). Using pyCloudy (Morisset, 2013) Cloudy’s output has been corrected to account for the slit used to observe the nebula (9.35′′ 1′′: see Section 2). The density, chemical composition and total H flux are set by design. The model thus computed reproduces the observed line ratios and the general ionization structure as given by O i through O iv and Ne iii through Ne v. According to the model, Na3+ accounts for 35% of the total sodium; K3+ and K4+ together account for the 46% of the total potassium; and Ca4+ accounts for 17% of the total calcium. This leads to an ICF of 2.9 for Na, 2.2 for K and 5.8 for Ca. The validity of the model is supported by the nice agreement between the K3+/K4+ ratios predicted by our model (1.04) and the one derived from the observations (1.100.25).
An alternative method to compute the abundances of these three elements is the ICF scheme by Delgado-Inglada et al. (2014), based on the public database of photoionization models 3MdB developed by Morisset et al. (2015). We preliminarly verify the overall agreement of our model with the predictions by Delgado-Inglada et al. (2014) by comparing the ICFs of that paper with those returned by the model; the differences between both methods are 0 dex, -0.04 dex, -0.05 dex and +0.04 dex for He/H, Ne/H, Ne/O, and C/O and indicate a substantial agreement between the two methods. Based on the values of O2+/(O++ O2+) and He2+/(He++He2+) of the nebula, a rough estimate gives us the following ICFs: 4.0 for Na, 3.2 for K and 10.0 for Ca.
Given the overall agreement between the two methods, we adopt as a representative value of the total abundance for each atomic species the average of the values returned by both methods. The results are shown in Table 14.
The gaseous abundances of Ca, K, and Na relative to hydrogen in the interstellar medium are significantly lower than solar (Morton, 1974), which is generally attributed to depletion into dust grains. The reported abundances of K and Na in PNe are about 1 dex lower than solar and the Ca abundances are between 0.8 and 2.5 dex lower than solar (Aller, 1978; Aller et al., 1981; Aller & Czyzak, 1983; Bohigas et al., 2013; Shields et al., 1981; Keyes et al., 1990). The abundances of Ca, K, and Na obtained here are 1.6, 0.6, and 0.3 dex lower than solar respectively, suggesting a significant depletion of these elements (especially of Ca) into dust grains in NGC 3918.
The high depletion factors in NGC 3198 could be related to the dominant chemistry in the PN. Both the value of C/O (1, this work) and the broad feature at 30 m found in the nebula (Delgado-Inglada & Rodríguez, 2014) and often associated with MgS, reveal a carbon-rich environment. In the particular case of iron, Delgado-Inglada & Rodríguez (2014) found that the highest depletion factors are found in carbon-rich PNe.
Sterling et al. (2007) constructed the first ionization correction scheme for Kr, using approximate atomic data. These authors propose ICFs based on detailed photoionization models and on the detection of multiple Kr ions in the optical and K-band. Very recently, Sterling et al. (2015) incorporated new photoionization and recombination data into the modeling code Cloudy (Ferland et al., 2013) . They compute a large grid of photoionization models to determine a new set of ICFs for calculating the Kr elemental abundance. This new set provides different ICFs depending on the detection of different Kr ionic lines: [Kr iii], [Kr iv], and [Kr v] and therefore, is perfectly fitted for our data. We note that the results obtained by using the different ICFs proposed by Sterling et al. (2015) display a relatively low dispersion, suggesting that the formulae proposed are quite robust. In Table 14 we show the total Kr abundances obtained by using the average of the ICFs proposed by Sterling et al. (2007) and the average of the ICFs obtained with Eqs. (4), (5) and (6) (which are the ones that use more than one ionization stage) of Sterling et al. (2015). We rely more on the second set of ICFs because they were computed from models that incorporated ab initio atomic data calculations(Sterling, 2011; Sterling & Stancil, 2011). Sharpee et al. (2007) also propose an ICF based on the similarity between the ionization potentials of the noble gases. This ICF scheme gives a result which is very similar (0.01 dex higher) to the sum of the observed ionic species, but is much lower than the other ICF schemes.
There are no reliable ICFs for Xe and Rb in the literature. Sharpee et al. (2007) propose a correction for Xe based on the similarity in the ionization potentials of noble gases. We used a similar scheme assuming that Xe/Ar(Xe2+ + Xe3+)/(Ar2+ + Ar3+). This scheme yields an abundance that is slightly lower than the sum of the ionic abundances. Therefore, for Xe and Rb, the total abundance is simply computed as the sum of all the observed ionic species. This gives us a lower limit to the total abundance.
| Ion | 12 + log(X/H) | C87a | T03, T04b | |||||
|---|---|---|---|---|---|---|---|---|
| CELs sum | CELs ICF | ORLs sum | ORLs ICF | CELs | ORLs | CELs | ORLs | |
| He | — | — | 11.010.01 | — | — | 11.03 | — | 11.00 |
| C | — | — | 8.930.04c | 8.900.09d | — | 8.90 | 8.64 | 8.88 |
| N | — | 8.120.09 | — | — | 8.18 | — | 8.02 | — |
| O | — | 8.670.06 | 8.900.05e | 8.900.11f | 8.70 | — | 8.86 | 9.09 |
| Ne | 8.040.06 | 7.950.06/8.010.06g | — | 8.440.08 | 8.08 | — | 7.97 | — |
| Na | — | 6.07: | — | — | — | — | — | — |
| S | — | 6.81 | — | — | 7.20 | — | 6.70 | — |
| Cl | — | 5.170.10 | — | — | — | — | 5.11 | — |
| Ar | 6.430.03 | 6.40h | — | — | 6.30 | — | 6.24 | — |
| K | — | 4.85: | — | — | — | — | — | — |
| Ca | — | 4.66: | — | — | — | — | — | — |
| Fe | 4.950.07 | 4.840.08/4.480.10i | — | — | 5.57 | — | — | — |
| Se | — | 3.52 | — | — | — | — | — | — |
| Kr | 3.800.04 | 3.970.12/3.890.06j | — | — | — | — | — | — |
| Rb | 2.51 | — | — | — | — | — | — | — |
| Xe | 2.490.07 | 2.480.08 | — | — | — | — | — | — |
- a
-
Clegg et al. (1987).
- b
- c
-
Sum of C ionic species from ORLs, with C+ estimated from the CEL C+/C2+ ionic ratio by Tsamis et al. (2003b) (see text).
- d
-
From C ii ORLs and the ICF by Delgado-Inglada et al. (2014).
- e
-
Sum of O ionic species from ORLs, with O+ estimated from the CEL O+/O2+ ionic ratio (see text).
- f
-
From O ii ORLs, O+/O2+ from CELs, and the ICF by Delgado-Inglada et al. (2014).
- g
-
ICF from Eq. (17)/Eq. (20) of Delgado-Inglada et al. (2014).
- h
-
ICF from Eq. (36) of Delgado-Inglada et al. (2014).
- i
-
Sum of all ionic abundances/ICF from Eq. (2)/Eq. (3) by Rodríguez & Rubin (2005).
- j
5.4 Comparison with elemental abundances in the literature
The first attempt to compute chemical abundances in NGC 3918 was made by Torres-Peimbert & Peimbert (1977) from optical photoelectric spectrophotometry using a wide long-slit. Torres-Peimbert et al. (1981) obtain low dispersion spectra and construct ionization structure models to derive physical conditions and chemical content of the PN. Peña & Torres-Peimbert (1985) derive the physical conditions and chemical abundances from high-dispersion spectra. The most detailed chemical analysis of NGC 3918 is the one by Clegg et al. (1987), who use a combination of high- and low-resolution and optical long-slit spectra covering different positions in the nebula. Using UV, optical and far-infrared spectrophotometric data covering the whole nebula, Tsamis et al. (2003b) and Tsamis et al. (2004) study the chemical content of NGC 3918 derived from CELs and ORLs. Finally, Ercolano et al. (2003) construct a realistic photoionization model of NGC 3918 using a three-dimensional Monte Carlo photoionization code.
From Table 14 it is clear that the agreement between our total abundances with those elements in common with Clegg et al. (1987) is very good. For He, C, N, O, and Ne, their derived total abundances agree with ours within 0.05 dex. For Ar, the difference is slightly larger (between 0.1 and 0.2 dex depending on the ICF assumed). The abundances derived by these authors are computed through a tailored photoionization model to constrain UV and optical observations. In Clegg et al. (1987) computations, only the S/H and Fe/H ratios are significantly higher, by 0.4 dex and more than 0.6 dex, respectively. In Table 14 we also include the abundances obtained by Tsamis et al. (2003b) from UV, optical and far-infrared CELs of C, N, O, S, Cl, Ne and Ar and those derived by Tsamis et al. (2004) from C and O ORLs. In this case the agreement between C ORLs abundances is also very good. In general, the abundances agree within 0.1-0.15 dex, with a larger scatter for O (0.2 dex). In the case of CELs O abundances, the difference can be attributed mainly to the fact that they compute a high O3+/H+ ratio from the UV O iv] 1401 line, which is very sensitive to both temperature and extinction effects and, to a lesser extent, to the fact that they use the classical ICF scheme of Kingsburgh & Barlow (1994), which is based on a small grid of photoionization models. In the case of RL abundances, the differences are due to the fact that they scaled O3+/O2+ from CELs, which is quite uncertain and is a factor of 4 higher than the ratio obtained from ORLs.
6 Discussion
6.1 s-process enrichments of n-capture elements
The total abundances of Se, Kr, Rb, and Xe can be used to establish if the central star has undergone a substantial s-process nucleosynthesis and convective dredge-up. As discussed in Sterling & Dinerstein (2008), the enrichment must be measured against a reference element which is neither enriched nor depleted in the object studied; for a metal-rich, non-type-I PN such as NGC 3918, a suitable element seem to be O; in case of a type-I PNe, O can be affected by nucleosynthesis and then we use Ar as a reference (see Sterling & Dinerstein, 2008). In order to establish which level of [X/O], where X is a n-capture element, counts as significant, it is necessary to take into account the primordial scatter in the abundances of the progenitor gas. Based on stellar data by Travaglio et al. (2004) and Burris et al. (2000), Sterling & Dinerstein (2008) estimate that s-process enrichment is statistically likely to have taken place if the [X/O] ratio is found to be in excess of 0.2-0.3 dex.
It should be noted that Delgado-Inglada et al. (2015) have recently found evidence of O enrichment in a group of Galactic PNe with carbon-rich dust, including NGC 3918. This result suggests that the real s-process element enrichment in this PN is likely higher. However, in order to compare our results with those found by Sterling et al. (2007) and Sterling et al. (2015) we still consider O as the metallicity proxy for these PNe.
The [Se/O], [Kr/O], [Xe/O] and [Rb/O]555 [X/O]=log(X/O)-log(X/O)⊙. Solar abundance references are taken from Asplund et al. (2005) ratios determined for NGC 3918 from our data are shown in Table 15. If we adopted the more recent solar composition of Asplund et al. (2009), the derived abundances would change by less than 0.06 dex, with the exception of [Rb/O] which would be 0.11 dex larger. In the calculation, we assume the solar abundances by Asplund et al. (2005) for the sake of a direct comparison with the results by Sterling & Dinerstein (2008). For Kr we obtain [Kr/O]=0.570.18, a value well above the threshold assumed by Sterling & Dinerstein (2008). We can therefore conclude that Kr is strongly enriched in NGC 3918. It is interesting to note that our Kr data, which include all the relevant ionization stages, make it possible to test the predictions of theoretical ICFs; the results support the ICFs proposed by Sterling et al. (2015).
For Se, owing to the difficulties detecting and measuring the line, the value we obtain, i. e. [Se/O] = 0.18 is very uncertain. Taking this result at face value, we find that Kr is more enriched than Se in NGC 3918 ([Kr/Se]=0.42), in agreement with what is observed by Sterling & Dinerstein (2008) in a large sample of PNe with both Kr and Se emission ([Kr/Se]=0.50.2) and with the predictions of theoretical models of s-process nucleosynthesis (Gallino et al., 1998; Goriely & Mowlavi, 2000; Busso et al., 2001; Karakas et al., 2009).
The values obtained for Rb and Xe, in turn, are only marginally positive ([Rb/O]0.17; [Xe/O]0.210.11), so they do not allow us to draw any definite conclusion. It must be stressed, though, that these values are only lower limits to the real abundances, so we cannot exclude that these elements are actually enriched.
These two elements lie on opposite sides of the bottleneck in the s-process path corresponding to isotopes with the magic neutron number . This bottleneck occurs because species with closed neutron shells have very small n-capture cross sections, leading to peaks in the element-by-element distribution of s-process enrichments (e. g. Käppeler et al., 2009). In stellar spectroscopy, n-capture elements produced by the s-process are often categorized as ‘light-s” or “heavy-s” elements if one of their isotopes has a magic number of (e.g., the s-process peak near Zr) or (the peak near Ba), respectively (e. g., Luck & Bond, 2014). The abundance ratio [hs/ls] is a measure of the neutron exposure (the time-averaged neutron flux experienced by Fe-peak nuclei) in AGB stars. Both Kr and Xe have isotopes with a magic number of neutrons, and can be used as nebular proxies for light-s and heavy-s elements, respectively. The ratio [Xe/Kr] corresponds to a neutron exposure typical of modestly subsolar metallicity AGB stars, according to the models of Busso et al. (2001, see their Figures 3 and 4). While this abundance ratio is a lower limit, it appears to be somewhat lower than the average Xe/Kr value found by Sharpee et al. (2007) in their sample of PNe. Theoretical studies have shown that a spread in the sizes of 13C pockets and in average neutron exposures are needed, even in stars with the same mass and metallicity, in order to reproduce observations of s-process enrichments in AGB stars (e. g., Busso et al., 2001; Herwig, 2005; Karakas & Lattanzio, 2014). Herwig et al. (2003) showed that the interplay between convective overshoot and rotationally-induced mixing can naturally lead to a spread in neutron exposures in AGB stars of a given mass and metallicity. In order to draw more robust conclusions from these results, advances on two fronts are needed. First, a reliable ICF scheme is needed for Xe. This requires photoionization and recombination data such as Sterling & Witthoeft (2011) and Sterling (2011) produced for Se and Kr. Secondly, AGB nucleosynthesis model studies are needed to interpret [Xe/Kr] ratios and their relation to the [hs/ls] index used in studies of s-process nucleosynthesis in AGB stars.
Though only a lower limit, the modestly enhanced [Rb/O] value suggests that the reaction 13C(, n)16O was the neutron source in the AGB progenitor of NGC 3918, and not 22Ne(, n)25Mg which operates more efficiently in intermediate-mass AGB stars (van Raai et al., 2012; Karakas et al., 2012). In particular, the high neutron density of the 22Ne source opens branchings in the s-process path that lead to large enrichments of Rb relative to other n-capture elements, unlike the 13C neutron source, which produces lower neutron densities. Therefore the modest Rb enrichment relative to Kr and Xe indicates that the progenitor mass of NGC 3918 is between 1.5 M⊙ (the approximate lower limit for convective dredge-up to occur; Straniero et al., 2006) and 5–6 M⊙ (Karakas et al., 2012). The upper limit to the progenitor mass is consistent with the abundances of other species in NGC 3918, in particular N/O and C/O. NGC 3918 is not a Peimbert Type I PN (Peimbert, 1978), and thus its progenitor mass is expected to be less than 3–4 M⊙. The analysis of n-capture element abundances confirms this expectation, and additionally places a lower limit to the progenitor mass of this PN.
A more definite statement regarding Rb and Xe would require either observing all the relevant ionization stages or correcting the observed ones with an ICF. Although corrections for unseen ions of Se and Kr exist (Sterling et al., 2007, 2015), no ICF expressions are available for Xe and Rb as yet, due to a lack of the atomic data required to derive such corrections. However, theoretical and experimental efforts to produce these atomic data are ongoing (Kerlin et al., 2015), after which photoionization modeling can be used to determine analytical ICF formulae (e. g., Sterling et al., 2015). As already noted above, photoionization models are especially productive if used in combination with data such as those presented in this paper, since the detection of several ionization stages for each element makes it possible to test the predictions of theoretical ICFs.
| Ratio | [X/O]a |
|---|---|
| [Se/O] | 0.18 |
| [Kr/O]b | 0.600.13 |
| [Rb/O]c | 0.17 |
| [Xe/O]c | 0.210.11 |
6.2 Correlation of s-process enrichments with the C/O ratio
Nucleosynthesis models also predict that neutron-capture elements correlate with the C/O ratio, as carbon is brought to the surface of AGB stars along with s-processed material during third dredge-up episodes (Busso et al., 2001; Gallino et al., 1998; Karakas & Lattanzio, 2014). In the upper panel of Figure 10 we show the correlation found by Sterling & Dinerstein (2008) for PNe of their sample with known abundances of C (from UV lines) and their Kr abundances obtained from near IR [Kr iii] line detections (red squares). This correlation is marginal due to the large uncertainties in the Kr/O and C/O ratios. We have overplotted our result for NGC 3918 from optical data for both the C/O and the Kr/O ratios (big blue dot). We adopt C/O=0.870.25 from C ii and O ii recombination lines (see Fig 8 and the ICFs given by Kingsburgh & Barlow, 1994). C/O ratios from ORLs generally agree with those derived from UV/optical CELs (Liu et al., 2004; Delgado-Inglada & Rodríguez, 2014) and, additionally, they are not affected by aperture corrections and extinction uncertainties, which can potentially affect C/O ratios derived from CELs. Additionally, we also include some data from García-Rojas et al. (2009) and García-Rojas et al. (2012) where Kr lines are detected. From García-Rojas et al. (2012) only NGC 6369 has detections of more than one ionization stage of Kr ([Kr iii] and [Kr iv] lines are detected). For the other objects, only [Kr iv] lines are reported. However, a reinspection of the spectra in García-Rojas et al. (2012, 2013) has brought to light detections of the [Kr iii] 6826.70 line in the spectra of He 2-86, PC 14, Pe 1-1 and, possibly NGC 2867. These lines are not reported in García-Rojas et al. (2009) and García-Rojas et al. (2012) because they are strongly affected by charge transfer and telluric emission features. We use PySSN to deblend this line from the charge transfer feature, the telluric emission lines and a close He i line (see Fig. 11). The fluxes we obtain are shown in Table 16. We consider in all cases that the uncertainties in the flux measurements are larger than 40%. Then, to compute the total Kr abundance for these new objects we use Eq. (3) of Sterling et al. (2015) when only [Kr iv] lines are detected (M 1-61 and NGC 2867) and Eq. (4) when both [Kr iii] and [Kr iv] lines are detected (He 2-86, NGC 6369, PC 14, Pe 1-1). We computed C/O ratios by using the C2+ and O2+ abundances reported by García-Rojas et al. (2009) and García-Rojas et al. (2013) for these objects and applying the ICF recipes given by Kingsburgh & Barlow (1994) (green triangles) in order to be consistent with the C/O ratios derived by Sterling et al. (2007). Additionally, we add two objects (M 1-25 and M 1-32) for which Sterling et al. (2007) report [Kr/(O,Ar)] ratios, but reanalyze the data including our log(C/O) ratios derived from C2+/H+ and O2+/H+ from ORLs reported by García-Rojas et al. (2013) and the ICFs by Kingsburgh & Barlow (1994) (yellow squares).
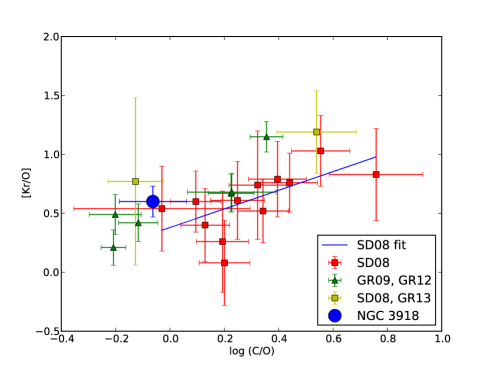
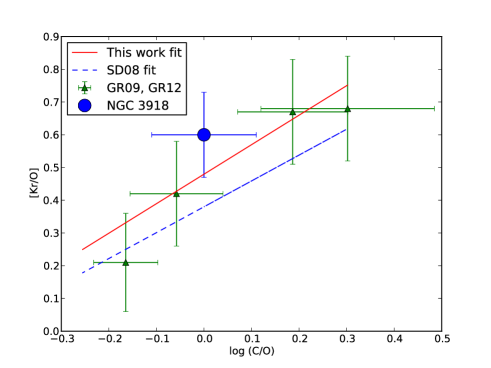
| Object | |
|---|---|
| He 2-86 | 0.0104 |
| NGC 6369 | 0.0210 |
| PC 14 | 0.0229 |
| Pe 1-1 | 0.0436 |

Sterling et al. (2015) find that Eq. (3) seems to produce larger Kr abundances than other equations, especially for low-ionization objetcs, and they do not recommend to use this equation when [Kr iii] emission is clearly detected. In Table 17 we show the total Kr abundances obtained from all equations of Sterling et al. (2015) for NGC 3918 and from Eqs. (2), (3) and (4) for the objects of the García-Rojas et al. (2009) and García-Rojas et al. (2012) sample. Our results are very similar to those of Sterling et al. (2015) and Eq. (3) gave a very high abundance compared to other equations. The exception is NGC 3918, owing to its high ionization.
| PN | 12+log(Kr/H) a | |||||
|---|---|---|---|---|---|---|
| ICF Eq. (1) | ICF Eq. (2) | ICF Eq. (3) | ICF Eq. (4) | ICF Eq. (5) | ICF Eq. (6) | |
| NGC 3918 | 3.80 | 3.860.06 | 3.830.05 | 3.92 | 3.850.04 | 3.920.05 |
| He 2-86 | 3.640.15 | 3.670.17 | 4.080.07 | 3.620.07 | — | — |
| M 1-61 | — | — | 3.780.10 | — | — | — |
| NGC 2867 | — | — | 4.350.04 | — | — | — |
| NGC 6369 | 3.920.11 | 3.480.14 | 4.520.06 | 3.830.07 | — | — |
| PC 14 | 3.930.15 | 3.710.16 | 4.370.09 | 3.810.08 | — | — |
| Pe 1-1 | 3.950.15 | 3.970.16 | 4.640.05 | 3.960.09 | — | — |
- a
-
ICFs Eqs. (1) and (2) based on Kr2+ abundances; ICF Eq. (3) based on Kr3+ abundances; ICF Eq. (4) based on Kr2+ and Kr3+ abundances; ICF Eq. (5) based on Kr3+ and Kr4+ abundances; ICF Eq. (6) based on Kr2+, Kr3+, and Kr4+ abundances.
In the lower panel of Figure 10 we only include the objects with [Kr iii] and [Kr iv] lines detected and compute the C/O ratios using C ii and O ii recombination lines and the ICFs given by Delgado-Inglada et al. (2014). We overplot our result for NGC 3918 adopting C/O=1.000.29 from C ii and O ii recombination lines and the ICFs given by Delgado-Inglada et al. (2014), which is in excellent agreement with the result obtained from the sum of ionic abundances (C/O=1.020.12). A least squares linear fit taking into account uncertainties in both axis yields:
| (2) |
where the uncertainties include both the dispersion and the individual uncertainties for each object. The Spearman coefficient for the two variables is (Spearman) =0.940.06 showing clearly that both quantities follow a monotonic relation. The Pearson coefficient is somewhat lower, but is also close to 1, (Pearson)=0.860.07, indicating that the relation is probably linear; however, these values should be taken with caution given the low number of points in the correlation. Adding more points to the sample will strengthen even further our conclusions. It is important to remark that this fit is very similar to the ones obtained by Sterling & Dinerstein (2008) and Sterling et al. (2015) but with a much better correlation coefficient.
As can be shown, our approach of utilizing multiple Kr ions to derive Kr abundances and determining C/O ratios from ORLs gives gives more precise results than the combined UV and near-IR data, and minimizes the uncertainties given by aperture effects in the different wavelength ranges as well as the uncertainties related to extinction. Additional very deep optical observations of a large sample of PNe could help to confirm this correlation of [Kr/O] with C/O (and also of [Br/O], [Se/O], [Rb/O] and [Xe/O]) to constrain nucleosynthesis models.
Similarly to what we have done for Kr, in Figure 12 we show the correlation found by Sterling & Dinerstein (2008) for a sample of PNe with known abundances of C (from UV lines) and Se abundances obtained from near IR [Se iii] line detections (red squares). The least squares fit to these data is shown as a blue line. We overplot the point for NGC 3918 where the C/O ratio was computed from optical recombination lines and using the ICF scheme by Kingsburgh & Barlow (1994). Our result is consistent with the fit found by Sterling & Dinerstein (2008).
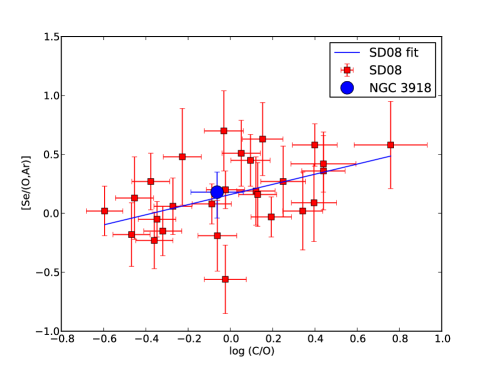
7 Summary
In this work we develop a detailed study of the physical conditions and the chemical content of the planetary nebula NGC 3918, based on deep, high-resolution (R40000) spectrophotometric data obtained with the UVES echelle spectrograph at the VLT. We identify and measure more than 750 emission lines, making ours one of the deepest spectra ever taken for a planetary nebula.
Thanks to the high ionization of NGC 3918, we detect CELs of multiple ionization stages. In addition to the classical CELs of N, O, Ne, S, Cl, and Ar, we detect a large number of CELs of refractory element (Ca, K, Cr, Mn, Fe, Co, Ni and Cu). We also detect very faint CELs of several neutron-capture elements (Se, Kr, Rb, and Xe). ORLs of multiple ionization stages of C, N, O, and Ne are also detected in our spectrum.
We compute physical conditions from a large number of diagnostics, which are highly consistent among themselves assuming a three-zone ionization scheme.
We compute elemental abundances by using a state-of-the-art ICF scheme or simply adding ionic abundances. When multiple ionization stages are detected, both abundance determinations are in very good agreement, demonstrating the quality of the recent ICF scheme for high ionization planetary nebulae. We also determine C/O ratios from pure recombination lines. These ratios derived from C ii and O ii ORLs and ICFs are consistent with those derived from the direct sum of all the ionic species detected, showing that C/O ratios from ORLs have a clear advantage over UV determinations
Several refractory elements lines (Ca, K, Cr, Mn, Co, Ni and Cu) were detected in the spectrum of NGC 3918. We estimate the abundance of Ca and K making use of ICFs derived from simple photoinization models. For several Fe-peak species we could not compute abundances owing to the lack of atomic data. New atomic data (specifically, transition probabilities and effective collision strengths for transitions between the lowest 50 energy levels) for these species are urgently needed to compute gas-phase abundances of these species and provide valuable information about the dust grain chemistry in PNe and AGB winds.
Chemical abundances of Se, Kr, Rb, and Xe are computed, in the case of Kr with unprecedented accuracy, thus constraining the efficiency of the s-process and convective dredge-up in NGC 3918’s progenitor star. We find that Kr is strongly enriched in NGC 3918 and that Se is less enriched than Kr, in agreement with the results of previous papers and with predicted s-process nucleosynthesis. As we compute only lower limits to Rb and Xe enrichments we cannot draw definitive conclutions, but the results suggest that Xe is not as enriched by the s-process in NGC 3918 as is Kr and, therefore, that neutron exposure is typical of modestly subsolar metallicity AGB stars. The modest Rb enrichment relative to Kr and Xe seem to indicate that the progenitor mass of NGC 3918 is between 1.5 M⊙ and 5–6 M⊙.
A clear correlation is found when representing [Kr/O] log(C/O) for NGC 3918 and other objects with detection of multiple ions of Kr in optical data confirming that carbon is brought to the surface of AGB stars along with s-processed material during third dredge-up episodes, as predicted by nucleosynthesis models. Additional deep high-resolution spectrophotometric data are needed for [Br/O], [Se/O], [Rb/O] and [Xe/O] C/O to put narrow constraints to nucleosynthesis models.
Acknowledgments
This work is based on observations collected at the European Southern Observatory, Chile, proposal number ESO 090.D-0265(A). This work has been funded by the Spanish Ministry of Economy and Competitiveness (MINECO) under the grant AYA2011-22614, CONACyT, Mexico under grant CB-2010/153985 and by the DGAPA-UNAM, Mexico under grant PAPIIT-107215. We want to thank the annonymous referee for his/her valuable comments. JGR acknowledges support from Severo Ochoa excellence program (SEV-2011-0187) postdoctoral fellowship. VL acknowledges support of the Spanish Ministry of Science and Innovation through grant AYA 2011-22614. NCS gratefully acknowledges support of this work from an NSF Astronomy and Astrophysics Postdoctoral Fellowship under award AST-0901432 and from NASA grant 06-APRA206-0049. GDI gratefully acknowledges support from a DGAPA postdoctoral grant from the Universidad Nacional Autónoma de México (UNAM) and the GSI Foundation. JGR acknowledges all staff, employees and guests of the Instituto de Astronomía at UNAM, where part of this work was done. We also thank C. Esteban, D. A. García-Hernández, D. Péquignot, and M. Rodríguez for fruitful discussions.
References
- Aller (1978) Aller, L. H. 1978, Planetary Nebulae, 76, 225
- Aller et al. (1981) Aller L. H., Keyes C. D., Ross J. E., Omara, B. J., 1981, MNRAS, 197, 647
- Aller & Czyzak (1983) Aller L. H., Czyzak S. J., 1983, ApJS, 51, 211
- Asplund et al. (2005) Asplund M., Grevesse N., Sauval A. J., 2005, in Barnes III T. G., Bash F. N., eds, ASP Conf. Ser. 336: Cosmic Abundances as Records of Stellar Evolution and Nucleosynthesis p. 25
- Asplund et al. (2009) Asplund, M., Grevesse, N., Sauval, A. J., & Scott, P. 2009, ARA&A, 47, 481
- Baldwin et al. (2000) Baldwin J. A., Verner E. M., Verner D. A., Ferland G. J., Martin P. G., Korista K. T., Rubin R. H., 2000, ApJS, 129, 229
- Ballance et al. (2007) Ballance C. P., Griffin D. C., McLaughlin B. M., 2007, Journal of Physics B Atomic Molecular Physics, 40, 327
- Ballester et al. (2000) Ballester P., Modigliani A., Boitquin O., Cristiani S., Hanuschik R., Kaufer A., Wolf S., 2000, The Messenger, 101, 31
- Baluteau et al. (1995) Baluteau J. -P., Zavagno A., Morisset C., Péquignot D., 1995, A&A, 303, 175
- Becker et al. (1989) Becker S. R., Butler K., Zeippen C. J., 1989, A&A, 221, 375
- Bhatia & Doschek (1993) Bhatia A. K., Doschek G. A., 1993, Atomic Data and Nuclear Data Tables, 55, 315
- Bhatia & Kastner (1988) Bhatia A. K., Kastner S. O., 1988, ApJ, 332, 1063
- Biémont & Hansen (1986a) Biémont E., Hansen J. E., 1986a, Phys. Scr., 34, 116
- Biémont & Hansen (1986b) Biémont E., Hansen J. E., 1986b, Phys. Scr., 33, 117
- Biémont et al. (1995) Biémont E., Hansen J. E., Quinet P., Zeippen C. J., 1995, A&AS, 111, 333
- Blum & McGregor (2008) Blum R. D., McGregor P. J., 2008, AJ, 135, 1708
- Bohigas et al. (2013) Bohigas J., Rodríguez M., Dufour, R. J., 2013, Rev. Mexicana Astron. Astrofis, 49, 227
- Burris et al. (2000) Burris D. L., Pilachowski C. A., Armandroff T. E., Sneden C., Cowan J. J., Roe H., 2000, ApJ, 544, 302
- Busso et al. (2001) Busso M., Gallino R., Lambert D. L., Travaglio C., Smith V. V., 2001, ApJ, 557, 802
- Busso et al. (1999) Busso M., Gallino R., Wasserburg G. J., 1999, ARA&A, 37, 239
- Butler & Zeippen (1989) Butler K., Zeippen C. J., 1989, A&A, 208, 337
- Butler et al. (1988) Butler K., Zeippen C. J., Le Bourlot J., 1988, A&A, 203, 189
- Chen & Pradhan (1999) Chen G. X., Pradhan A. K., 1999, A&AS, 136, 395
- Chen & Pradhan (2000) Chen G. X., Pradhan A. K., 2000, A&AS, 147, 111
- Clegg et al. (1987) Clegg R. E. S., Harrington J. P., Barlow M. J., Walsh J. R., 1987, ApJ, 314, 551
- Clegg & Walsh (1985) Clegg R. E. S., Walsh J. R., 1985, MNRAS, 215, 323
- Corradi et al. (2015) Corradi R., García-Rojas J., Jones D., Rodríguez-Gil P., 2015, 803, 99
- Dance et al. (2013) Dance M., Palay E., Nahar S. N., Pradhan A. K., 2013, MNRAS, 435, 1576
- Davey et al. (2000) Davey A. R., Storey P. J., Kisielius R., 2000, A&AS, 142, 85
- Delgado-Inglada et al. (2014) Delgado-Inglada G., Morisset C., Stasińska G., 2014, MNRAS, 440, 536
- Delgado-Inglada & Rodríguez (2014) Delgado-Inglada G., Rodríguez M., 2014, ApJ, 784, 173
- Delgado-Inglada et al. (2015) Delgado-Inglada G., Rodríguez M., Peimbert M., Stasińska G., Morisset C., 2015, MNRAS, 449, 1797
- Dinerstein (2001) Dinerstein H. L., 2001, ApJL, 550, L223
- D’Odorico et al. (2000) D’Odorico S., Cristiani S., Dekker H., Hill V., Kaufer A., Kim T., Primas F., 2000, in Bergeron J., ed., Proc. SPIE Vol. 4005, Discoveries and Research Prospects from 8- to 10-Meter-Class Telescopes p. 121
- Ellis & Martinson (1984) Ellis D. G., Martinson I., 1984, Phys. Scr., 30, 255
- Ercolano et al. (2003) Ercolano B., Morisset C., Barlow M. J., Storey P. J., Liu X.-W., 2003, MNRAS, 340, 1153
- Escalante & Victor (1992) Escalante V., Victor G. A., 1992, Planet. Space Sci., 40, 1705
- Esteban et al. (2004) Esteban C., Peimbert M., García-Rojas J., Ruiz M. T., Peimbert A., Rodríguez M., 2004, MNRAS, 355, 229
- Esteban et al. (1998) Esteban C., Peimbert M., Torres-Peimbert S., Escalante V., 1998, MNRAS, 295, 401
- Fang & Liu (2011) Fang X., Liu X.-W., 2011, MNRAS, 415, 181
- Fang et al. (2011) Fang X., Storey P. J., Liu X.-W., 2011, A&A, 530, A18+
- Fang et al. (2013) Fang X., Storey P. J., Liu X.-W., 2013, A&A, 550, C2
- Ferland et al. (2013) Ferland G. J., Porter R. L., van Hoof P. A. M., Williams R. J. R., Abel N. P., Lykins M. L., Shaw G., Henney W. J., Stancil, P. C., 2013, Rev. Mexicana Astron. Astrofis., 49, 137
- Froese Fischer et al. (2008) Froese Fischer C., Rubin R. H., Rodríguez M., 2008, MNRAS, 391, 1828
- Froese Fischer & Tachiev (2004) Froese Fischer C., Tachiev G., 2004, Atomic Data and Nuclear Data Tables, 87, 1
- Galavís et al. (1995) Galavís M. E., Mendoza C., Zeippen C. J., 1995, A&AS, 111, 347
- Galavís et al. (1997) Galavís M. E., Mendoza C., Zeippen C. J., 1997, A&AS, 123, 159
- Gallino et al. (1998) Gallino R., Arlandini C., Busso M., Lugaro M., Travaglio C., Straniero O., Chieffi A., Limongi M., 1998, ApJ, 497, 388
- García-Rojas & Esteban (2007) García-Rojas J., Esteban C., 2007, ApJ, 670, 457
- García-Rojas et al. (2013) García-Rojas J., Peña M., Morisset C., Delgado-Inglada G., Mesa-Delgado A., Ruiz M. T., 2013, A&A, 558, A122
- García-Rojas et al. (2012) García-Rojas J., Peña M., Morisset C., Mesa-Delgado A., Ruiz M. T., 2012, A&A, 538, A54
- García-Rojas et al. (2009) García-Rojas J., Peña M., Peimbert A., 2009, A&A, 496, 139
- Giles (1981) Giles K., 1981, MNRAS, 195, 63P
- Goriely & Mowlavi (2000) Goriely S., Mowlavi N., 2000, A&AS, 362, 599
- Grandi (1976) Grandi S. A., 1976, ApJ, 206, 658
- Hamuy et al. (1994) Hamuy M., Suntzeff N. B., Heathcote S. R., Walker A. R., Gigoux P., Phillips M. M., 1994, PASP, 106, 566
- Hamuy et al. (1992) Hamuy M., Walker A. R., Suntzeff N. B., Gigoux P., Heathcote S. R., Phillips M. M., 1992, PASP, 104, 533
- Herwig (2005) Herwig F., 2005, ARA&A, 43, 435
- Herwig et al. (2003) Herwig F., Langer N, Lugaro M, 2003, ApJ, 593, 1056
- Johansson et al. (2000) Johansson S., Zethson T., Hartman H., Ekberg J. O., Ishibashi K., Davidson K., Gull T., 2000, A&A, 361, 977
- Käppeler et al. (2009) Käppeler F., Gallino R., Bisterzo S. Aoki, W., 2011, Reviews of Modern Physics, 83, 157
- Karakas & Lattanzio (2014) Karakas A. I., Lattanzio J. C., 2014, PASA, 31, 62
- Karakas et al. (2009) Karakas A. I., van Raai M. A., Lugaro M., Sterling N. C., Dinerstein H. L., 2009, ApJ, 690, 1130
- Karakas et al. (2012) Karakas A. I., García-Hernández D. A., Lugaro M., 2012, ApJ, 751, 8
- Kaufman & Sugar (1986) Kaufman V., Sugar J., 1986, Journal of Physical and Chemical Reference Data, 15, 321
- Kerlin et al. (2015) Kerlin A. B., Macaluso D. A., Bautista M. A., Bilodeau R. C., Aguilar A., Kilcoyne A. L. D., Dumitriu I., Sterling N. C., 2015, in Laboratory Astrophysics for Beyond Hubble: Fundamental Processes from the NIR to the FUV, in press
- Keyes et al. (1990) Keyes C. D., Aller L. H., Feibelman W. A., 1990, PASP, 102, 59
- Kingsburgh & Barlow (1994) Kingsburgh R. L., Barlow M. J., 1994, MNRAS, 271, 257
- Kisielius et al. (1998) Kisielius R., Storey P. J., Davey A. R., Neale L. T., 1998, A&AS, 133, 257
- Kisielius et al. (2009) Kisielius R., Storey P. J., Ferland G. J., Keenan F. P., 2009, MNRAS, 397, 903
- Kisielius & Storey (2002) Kisielius R., Storey P. J., 2002, A&A, 387, 1135
- LaJohn & Luke (1993) LaJohn L., Luke T. M., 1993, Phys. Scr., 47, 542
- Liu & Danziger (1993) Liu X.-W., Danziger J., 1993, MNRAS, 261, 465
- Luck & Bond (2014) Luck R. E., Bond H. E., 1991, ApJS, 77, 515
- Liu et al. (2001) Liu, X.-W., Luo, S.-G., Barlow, M. J., Danziger, I. J., & Storey, P. J. 2001, MNRAS, 327, 141
- Liu et al. (1995) Liu X.-W., Storey P. J., Barlow M. J., Clegg R. E. S., 1995, MNRAS, 272, 369
- Liu et al. (2000) Liu X.-W., Storey P. J., Barlow M. J., Danziger I. J., Cohen M., Bryce M., 2000, MNRAS, 312, 585
- Liu et al. (2004) Liu Y., Liu X.-W., Barlow M. J., Luo S.-G., 2004, MNRAS, 353, 1251
- Liu et al. (2004) Liu Y., Liu X.-W., Luo S.-G., Barlow M. J., 2004, MNRAS, 353, 1231
- Luridiana et al. (2015) Luridiana V., Morisset C., Shaw R. A., 2015, A&A, 573, A42
- McLaughlin & Bell (2000) McLaughlin B. M., Bell K. L., 2000, Journal of Physics B Atomic Molecular Physics, 33, 597
- McNabb et al. (2013) McNabb I. A., Fang X., Liu X.-W., Bastin R. J., Storey P. J., 2013, MNRAS, 428, 3443
- Mendoza (1983) Mendoza C., 1983, in Flower D. R., ed., IAU Symp. 103, Planetary Nebulae p. 143
- Mendoza & Zeippen (1982a) Mendoza C., Zeippen C. J., 1982a, MNRAS, 199, 1025
- Mendoza & Zeippen (1982b) Mendoza C., Zeippen C. J., 1982b, MNRAS, 198, 127
- Mendoza & Zeippen (1983) Mendoza C., Zeippen C. J., 1983, MNRAS, 202, 981
- Morisset (2013) Morisset C., 2013, Astrophysics Source Code Library, record ascl:1304.020
- Morisset et al. (2015) Morisset C., Delgado-Inglada G., Flores-Fajardo N., 2015, Rev. Mexicana Astron. Astrofis, 51, 103
- Morton (1974) Morton D. C., 1974, ApJL, 193, L35
- Nahar et al. (2000) Nahar S. N., Delahaye F., Pradhan A. K., Zeippen C. J., 2000, A&AS, 144, 141
- Nussbaumer & Storey (1984) Nussbaumer H., Storey P. J., 1984, A&AS, 56, 293
- Otsuka et al. (2011) Otsuka M., Meixner M., Riebel D., Hyung S., Tajitsu A., Izumiura H., 2011, ApJ, 729, 39
- Otsuka & Tajitsu (2013) Otsuka M., Tajitsu A., 2013, ApJ, 778, 146
- Otsuka et al. (2010) Otsuka M., Tajitsu A., Hyung S., Izumiura H., 2010, ApJ, 723, 658
- Peña & Torres-Peimbert (1985) Peña M., Torres-Peimbert S., 1985, Rev. Mexicana Astron. Astrofis., 11, 35
- Peimbert (1978) Peimbert M., 1978, in IAU Symp., Vol. 76, Planetary Nebulae, ed. Y. Terzian (Dordrecht: Reidel), 215
- Peimbert et al. (2005) Peimbert A., Peimbert M., Ruiz M. T., 2005, ApJ, 634, 1056
- Peimbert et al. (2004) Peimbert M., Peimbert A., Ruiz M. T., Esteban C., 2004, ApJS, 150, 431
- Péquignot & Baluteau (1994) Péquignot D., Baluteau J.-P., 1994, A&A, 283, 593
- Péquignot et al. (2012) Péquignot D., Morisset C., Casassus S., 2012, in Manchado A., Stanghellini L., Schönberner D., eds, Planetary Nebulae (IAU S283) Cambridge University Press Vol. 283, Planetary Nebulae (IAU S283). pp 470–471
- Péquignot et al. (1991) Péquignot D., Petitjean P., Boisson C., 1991, A&A, 251, 680
- Podobedova et al. (2009) Podobedova L. I., Kelleher D. E., Wiese W. L., 2009, Journal of Physical and Chemical Reference Data, 38, 171
- Porter et al. (2012) Porter R. L., Ferland G. J., Storey P. J., Detisch M. J., 2012, MNRAS, 425, L28
- Porter et al. (2013) Porter R. L., Ferland G. J., Storey P. J., Detisch M. J., 2013, MNRAS, 433, L89
- Quinet (1996) Quinet P., 1996, A&AS, 116, 573
- Ramsbottom & Bell (1997) Ramsbottom C. A., Bell K. L., 1997, Atomic Data and Nuclear Data Tables, 66, 65
- Rodríguez & Rubin (2005) Rodríguez M., Rubin R. H., 2005, ApJ, 626, 900
- Ruiz et al. (2003) Ruiz M. T., Peimbert A., Peimbert M., Esteban C., 2003, ApJ, 595, 247
- Schoening & Butler (1998) Schoening T., Butler K., 1998, A&AS, 128, 581
- Schoning (1997) Schoning T., 1997, A&AS, 122, 277
- Seaton (1979) Seaton M. J., 1979, MNRAS, 187, 73P
- Sharpee et al. (2003) Sharpee B., Williams R., Baldwin J. A., van Hoof P. A. M., 2003, ApJS, 149, 157
- Sharpee et al. (2007) Sharpee B., Zhang Y., Williams R., Pellegrini E., Cavagnolo K., Baldwin J. A., Phillips M., Liu X.-W., 2007, ApJ, 659, 1265
- Shields et al. (1981) Shields G. A., Aller L. H., Keyes C. D., Czyzak S. J., 1981, ApJ, 248, 569
- Sterling (2011) Sterling N.C., 2011, A&A, 533, A62
- Sterling & Dinerstein (2008) Sterling N. C., Dinerstein H. L., 2008, ApJS, 174, 158
- Sterling et al. (2009) Sterling N. C., Dinerstein H. L., Hwang S., Redfield S., Aguilar A., Witthoeft M. C., Esteves D., Kilcoyne A. L. D., Bautista M., Phaneuf R., Bilodeau R. C., Ballance C. P., McLaughlin B., Norrington P. H., 2009, Proc. Astron. Soc. Aust., 26, 339
- Sterling et al. (2007) Sterling N. C., Dinerstein H. L., Kallman T. R., 2007, ApJS, 169, 37
- Sterling et al. (2015) Sterling N. C., Porter R. L., Dinerstein H. L., 2015, ApJ, in press, arXiv:1505.01162
- Sterling & Stancil (2011) Sterling N. C., Stancil P. C., 2011, A&A, 535, A117
- Sterling & Witthoeft (2011) Sterling N. C., Witthoeft M. C., 2011, A&A, 529, A147
- Storey (1994) Storey P. J., 1994, A&A, 282, 999
- Storey & Hummer (1995) Storey P. J., Hummer D. G., 1995, MNRAS, 272, 41
- Storey et al. (2014) Storey P. J., Sochi T., Badnell N. R., 2014, MNRAS, 441, 3028
- Storey & Zeippen (2000) Storey P. J., Zeippen C. J., 2000, MNRAS, 312, 813
- Straniero et al. (2006) Straniero O., Gallino R., Cristallo S., 2006, Nuclear Physics A, 777, 311
- Tayal (2004) Tayal S. S., 2004, A&A, 426, 717
- Tayal (2011) Tayal S. S., 2011, ApJS, 195, 12
- Tayal & Gupta (1999) Tayal S. S., Gupta G. P., 1999, ApJ, 526, 544
- Tayal & Zatsarinny (2010) Tayal S. S., Zatsarinny O., 2010, ApJS, 188, 32
- Tody (1993) Tody D., 1993, in Hanisch R. J., Brissenden R. J. V., Barnes J., eds, Astronomical Data Analysis Software and Systems II Vol. 52 of Astronomical Society of the Pacific Conference Series, IRAF in the Nineties. p. 173
- Torres-Peimbert & Peimbert (1977) Torres-Peimbert S., Peimbert M., 1977, Rev. Mexicana Astron. Astrofis., 2, 181
- Torres-Peimbert et al. (1981) Torres-Peimbert S., Pena M., Daltabuit E., 1981, in Chapman R. D., ed., NASA Conference Publication Vol. 2171 of NASA Conference Publication, The high-excitation planetary nebulae: NGC 3918 and IC 2448. pp 641–647
- Travaglio et al. (2004) Travaglio C., Gallino R., Arnone E., Cowan J., Jordan F., Sneden C., 2004, ApJ, 601, 864
- Tsamis et al. (2003a) Tsamis Y. G., Barlow M. J., Liu X.-W., Danziger I. J., Storey P. J., 2003a, MNRAS, 338, 687
- Tsamis et al. (2003b) Tsamis Y. G., Barlow M. J., Liu X.-W., Danziger I. J., Storey P. J., 2003b, MNRAS, 345, 186
- Tsamis et al. (2004) Tsamis Y. G., Barlow M. J., Liu X.-W., Storey P. J., Danziger I. J., 2004, MNRAS, 353, 953
- van Raai et al. (2012) van Raai M. A., Lugaro M., Karakas A. I., García-Hernández D. A., Yong D., 2012, A&A, 540, A44
- Vanzi et al. (2008) Vanzi L., Cresci G., Telles E., Melnick J., 2008, A&A, 486, 393
- Wiese et al. (1996) Wiese W. L., Fuhr J. R., Deters T. M., 1996, J. Phys. Chem: Ref. Data, Monograph No. 7, Atomic transition probabilities of carbon, nitrogen, and oxygen: a critical data compilation. American Chemical Society, Washington, DC, and the National Institute of Standards and Technology (NIST)
- Witthoeft & Badnell (2008) Witthoeft M. C., Badnell N. R., 2008, A&A, 481, 543
- Zhang (1996) Zhang H., 1996, A&AS, 119, 523
- Zhang & Pradhan (1997) Zhang H. L., Pradhan A. K., 1997, A&AS, 126, 373
- Zhang et al. (2005) Zhang Y., Liu X.-W., Liu Y., Rubin R. H., 2005, MNRAS, 358, 457
| (Å ) | Ion | Mult. | (km s-1) | a | b | Err(%) | notes | |
|---|---|---|---|---|---|---|---|---|
| 3109.18 | [Ar iii] | 3P-1S | 3108.89 | -27.97 | 0.485 | 0.648 | 9 | |
| 3115.67 | O iii | 3S-3P0 | 3115.42 | -24.06 | 0.165 | 0.219 | 11 | |
| 3118.61 | [Cl iv] | 3P-1S | 3118.42 | -18.28 | 0.104 | 0.138 | 14 | |
| 3121.63 | O iii | 3S-3P0 | 3121.41 | -21.13 | 2.444 | 3.249 | 8 | |
| 3132.79 | O iii | 3S-3P0 | 3132.58 | -20.09 | 53.51 | 70.93 | 8 | |
| 3187.84 | He i | 3 | 3187.50 | -31.99 | 2.492 | 3.255 | 8 | |
| 3203.10 | He ii | 3.5 | 3202.89 | -19.68 | 13.62 | 17.72 | 8 | |
| 3218.19 | Ne ii | 4D0-4F | 3217.95 | -22.36 | 0.0845 | 0.1096 | 16 | |
| 3230.54 | N ii | 3D-3P | 3229.87 | -62.18 | 0.0581 | 0.0751 | 21 | |
| 3241.63 | [Na iv] | 3P-1D | 3241.40 | -21.27 | 0.737 | 0.950 | 8 | |
| 3260.86 | O iii | 8 | 3260.64 | -20.25 | 0.223 | 0.286 | 9 | |
| 3265.33 | O iii | 8 | 3265.12 | -19.28 | 0.242 | 0.310 | 9 | |
| 3280.13 | N iii | 2F0-2D | 3279.78 | -31.98 | 0.0312 | 0.0399 | 35 | |
| 3284.45 | O iii | 8 | 3284.26 | -17.34 | 0.0189 | 0.0241 | : | |
| 3287.65 | O iii | 3P-3P0 | 3287.31 | -30.99 | 0.0236 | 0.0301 | : | ? |
| 3299.39 | O iii | 3 | 3299.16 | -20.90 | 2.983 | 3.793 | 7 | |
| 3312.33 | O iii | 3 | 3312.10 | -20.82 | 7.753 | 9.828 | 7 | |
| 3323.74 | Ne ii | 7 | 3323.59 | -13.52 | 0.0242 | 0.0306 | : | |
| 3328.72 | N ii | 3D-3P0 | 3328.60 | -10.80 | 0.0253 | 0.0319 | : | ? |
| 3328.93 | N ii | 3D-3P0 | * | * | * | * | * | ? |
| 3334.87 | Ne ii | 2 | 3334.61 | -23.38 | 0.0953 | 0.1203 | 14 | |
| 3340.77 | O iii | 3 | 3340.53 | -21.54 | 10.75 | 13.54 | 7 | |
| 3342.50 | [Ne iii] | 1D-1S | 3342.31 | -17.04 | 0.458 | 0.577 | 8 | |
| 3342.85 | [Cl iii] | 4S0-2P0 | * | * | * | * | * | |
| 3345.83 | [Ne v] | 3P-1D | 3345.56 | -24.20 | 21.92 | 27.58 | 7 | |
| 3349.11 | O iv | 2P0-2D | 3348.84 | -24.17 | 0.0306 | 0.0384 | 35 | ? |
| 3350.92 | O iii | 5P-5P0 | 3350.58 | -30.41 | 0.0288 | 0.0362 | : | |
| 3353.21 | [Cl iii] | 4S-2P | 3352.87 | -30.39 | 0.0456 | 0.0573 | 25 | |
| 3354.55 | He i | 8 | 3354.65 | 8.92 | 0.108 | 0.136 | 13 | |
| 3355.02 | Ne ii | 2 | * | * | * | * | * | |
| 3357.70 | N iii | 2S-2P0 | 3357.20 | -35.73 | 0.0142 | 0.0178 | : | ? |
| 3362.24 | [Na iv] | 3P-1D | 3361.99 | -22.29 | 0.220 | 0.275 | 9 | |
| 3381.21 | O iv | 4P0-4D | 3380.95 | -23.06 | 0.359 | 0.448 | 8 | |
| 3381.30 | O iv | 4P0-4D | * | * | * | * | * | |
| 3385.52 | O iv | 4P0-4D | 3385.24 | -24.80 | 0.291 | 0.363 | 8 | |
| 3390.19 | O iv | 4P0-4D | 3389.98 | -18.57 | 0.0197 | 0.0246 | : | |
| 3396.80 | O iv | 4P0-4D | 3396.53 | -23.83 | 0.0729 | 0.0908 | 17 | |
| 3403.55 | O iv | 2P0-2D | 3403.26 | -25.55 | 0.282 | 0.350 | 8 | |
| 3405.72 | O iii | 15 | 3405.46 | -22.89 | 0.270 | 0.336 | 8 | |
| 3408.13 | O iii | 15 | 3407.86 | -23.73 | 0.0775 | 0.0963 | 16 | |
| 3409.70 | O iv | 4P0-4D | 3409.41 | -25.50 | 0.115 | 0.142 | 12 | |
| 3411.69 | O iv | 2P0-2D | 3411.44 | -21.97 | 0.484 | 0.601 | 7 | |
| 3413.63 | O iv | 2P0-2D | 3413.39 | -21.08 | 0.0566 | 0.0702 | 21 | |
| 3415.26 | O iii | 15 | 3415.01 | -21.95 | 0.353 | 0.438 | 8 | |
| 3425.87 | [Ne v] | 3P-1D | 3425.62 | -21.88 | 51.15 | 63.29 | 7 | |
| 3428.65 | O iii | 15 | 3428.39 | -22.74 | 3.518 | 4.352 | 7 | |
| 3430.57 | O iii | 15 | 3430.32 | -21.85 | 0.426 | 0.527 | 8 | |
| 3444.07 | O iii | 15 | 3443.82 | -21.76 | 22.12 | 27.28 | 7 | |
| 3447.59 | He i | 7 | 3447.41 | -15.67 | 0.0948 | 0.117 | 14 | |
| 3453.30 | He i | 3P0-3D | 3453.05 | -21.70 | 0.0190 | 0.0234 | : | |
| 3454.99 | O iii | 5D0-5F | 3454.76 | -20.55 | 0.0351 | 0.0432 | 31 | ? |
| 3456.85 | He i | 3P0-3D | 3456.60 | -21.68 | 0.0222 | 0.0273 | : | |
| 3461.00 | He i | 3P0-3D | 3460.66 | -29.46 | 0.0154 | 0.0189 | : | |
| 3465.94 | He i | P0-3D | 3465.81 | -11.23 | 0.0540 | 0.0663 | 22 | |
| 3471.80 | He i | 44 | 3471.56 | -20.72 | 0.0398 | 0.0488 | 28 | |
| 3478.72 | N iv | 3S-3P0 | 3478.57 | -12.92 | 0.0817 | 0.100 | 16 | |
| 3478.97 | He i | 43 | * | * | * | * | * | |
| 3480.35 | [Co vi] | 5D-3P2 | 3480.23 | -10.35 | 0.0096 | 0.0117 | : | ? |
| 3483.00 | N iv | 3S-3P0 | 3482.72 | -24.10 | 0.0268 | 0.0328 | 39 | |
| 3484.93 | N iv | 3S-3P0 | 3484.83 | -8.59 | 0.0142 | 0.0174 | : | c |
| 3487.73 | He i | 42 | 3487.43 | -25.79 | 0.0499 | 0.0611 | 23 | |
| 3498.64 | He i | 40 | 3498.38 | -22.28 | 0.0654 | 0.0797 | 18 | |
| 3512.51 | He i | 38 | 3512.23 | -23.90 | 0.0869 | 0.106 | 15 | |
| 3530.50 | He i | 36 | 3530.21 | -24.63 | 0.122 | 0.148 | 12 | |
| 3554.42 | He i | 34 | 3554.13 | -24.46 | 0.147 | 0.177 | 10 | |
| 3555.60 | [Fe vi] | 4F-2D | 3555.68 | 6.73 | 0.0091 | 0.0109 | : | ? |
| 3568.50 | Ne ii | 5 | 3568.33 | -14.28 | 0.129 | 0.155 | 11 | c |
| — | ? | — | 3571.09 | — | 0.0441 | 0.0531 | 25 | |
| 3574.61 | Ne ii | 5 | 3574.40 | -17.63 | 0.0300 | 0.0360 | 36 | |
| 3586.32 | [Fe vii] | 3P-1G | 3586.98 | 55.15 | 0.213 | 0.256 | 9 | |
| 3587.28 | He i | 31 | * | * | * | * | * | |
| 3590.86 | C ii | 23 | 3590.47 | -32.58 | 0.0211 | 0.0253 | : | |
| 3599.32 | He i | 30 | 3599.01 | -25.83 | 0.0173 | 0.0207 | : | |
| 3613.64 | He i | 6 | 3613.35 | -24.04 | 0.163 | 0.195 | 10 | |
| 3634.25 | He i | 28 | 3633.95 | -24.75 | 0.309 | 0.368 | 8 | |
| 3660.28 | H i | H32 | 3659.98 | -24.58 | 0.0877 | 0.104 | 15 | |
| 3661.22 | H i | H31 | 3660.94 | -22.93 | 0.130 | 0.154 | 11 | |
| 3662.26 | H i | H30 | 3661.98 | -22.92 | 0.170 | 0.201 | 9 | |
| 3663.40 | H i | H29 | 3663.13 | -22.10 | 0.205 | 0.243 | 9 | |
| 3664.68 | H i | H28 | 3664.39 | -23.73 | 0.242 | 0.286 | 8 | |
| 3664.07 | Ne ii | 1 | * | * | * | * | * | |
| 3666.10 | H i | H27 | 3665.82 | -22.90 | 0.280 | 0.331 | 8 | |
| 3667.68 | H i | H26 | 3667.41 | -22.07 | 0.324 | 0.384 | 7 | |
| 3669.47 | H i | H25 | 3669.18 | -23.70 | 0.380 | 0.450 | 7 | |
| 3671.48 | H i | H24 | 3671.19 | -23.68 | 0.420 | 0.497 | 7 | |
| 3673.76 | H i | H23 | 3673.47 | -23.67 | 0.460 | 0.544 | 7 | |
| 3674.84 | He ii | 4.44 | 3674.60 | -19.58 | 0.0117 | 0.0138 | : | |
| 3676.29 | He ii | 4.43 | 3676.09 | -16.31 | 0.525 | 0.621 | 7 | |
| 3676.37 | H i | H22 | * | * | * | * | * | |
| 3677.83 | He ii | 4.42 | 3677.59 | -19.56 | 0.0178 | 0.0210 | : | |
| 3679.36 | H i | H21 | 3679.07 | -23.63 | 0.569 | 0.672 | 7 | |
| 3679.50 | He ii | 4.41 | * | * | * | * | * | |
| 3681.29 | He ii | 4.40 | 3681.02 | -21.99 | 0.0202 | 0.0238 | : | |
| 3682.81 | H i | H20 | 3682.54 | -21.98 | 0.651 | 0.769 | 7 | |
| 3683.22 | He ii | 4.39 | * | * | * | * | * | |
| 3685.31 | He ii | 4.38 | 3685.03 | -22.78 | 0.0194 | 0.0229 | : | |
| 3686.57 | He ii | 4.37 | 3686.55 | -1.63 | 0.742 | 0.876 | 6 | |
| 3686.83 | H i | H19 | * | * | * | * | * | |
| 3690.02 | He ii | 4.36 | 3689.51 | -41.44 | 0.0570 | 0.0672 | 20 | |
| 3691.56 | H i | H18 | 3691.27 | -23.56 | 0.808 | 0.953 | 6 | |
| 3692.71 | He ii | 4.35 | 3692.49 | -17.86 | 0.0198 | 0.0233 | : | |
| 3694.22 | Ne ii | 1 | 3693.95 | -21.91 | 0.0508 | 0.0600 | 22 | |
| 3695.62 | He ii | 4.34 | 3695.31 | -25.15 | 0.0718 | 0.0847 | 17 | |
| 3697.15 | H i | H17 | 3696.86 | -23.50 | 0.974 | 1.148 | 6 | |
| 3698.82 | He ii | 4.33 | 3698.50 | -25.94 | 0.0878 | 0.104 | 14 | |
| 3702.32 | He ii | 4.32 | 3702.33 | 0.81 | 0.104 | 0.122 | 13 | |
| 3703.86 | H i | H16 | 3703.56 | -24.29 | 1.169 | 1.376 | 6 | |
| 3705.04 | He i | 25 | 3704.69 | -28.33 | 0.501 | 0.590 | 7 | |
| 3706.18 | He ii | 4.31 | 3705.81 | -29.92 | 0.0335 | 0.0394 | 32 | |
| 3707.25 | O iii | 14 | 3706.98 | -21.84 | 0.0995 | 0.117 | 13 | |
| 3709.62 | Ne ii | 1 | 3709.31 | -25.06 | 0.0288 | 0.0338 | 37 | |
| 3710.44 | He ii | 4.30 | 3710.18 | -21.01 | 0.0390 | 0.0459 | 28 | |
| 3711.97 | H i | H15 | 3711.69 | -22.62 | 1.413 | 1.660 | 6 | |
| 3713.08 | Ne ii | 5 | 3712.76 | -25.84 | 0.0496 | 0.0583 | 23 | |
| 3714.03 | O iii | 14 | 3713.75 | -22.61 | 0.0404 | 0.0475 | 27 | |
| 3715.08 | O iii | 14 | 3714.83 | -20.18 | 0.163 | 0.192 | 10 | |
| 3715.16 | He ii | 4.29 | * | * | * | * | * | |
| 3720.40 | He ii | 4.28 | 3720.19 | -16.92 | 0.0706 | 0.0829 | 17 | |
| 3721.83 | [S iii] | 2F | 3721.53 | -24.17 | 3.185 | 3.736 | 6 | |
| 3721.93 | H i | H14 | * | * | * | * | * | |
| 3726.03 | [O ii] | 1F | 3725.71 | -25.75 | 45.52 | 53.36 | 6 | |
| 3726.26 | He ii | 4.27 | * | * | * | * | * | |
| 3728.82 | [O ii] | 1F | 3728.48 | -27.35 | 23.12 | 27.09 | 6 | |
| 3732.83 | He ii | 4.26 | 3732.55 | -22.49 | 0.0895 | 0.1048 | 14 | |
| 3734.37 | H i | H13 | 3734.08 | -23.29 | 2.087 | 2.444 | 6 | |
| 3736.85 | O iv | 6 | 3736.56 | -23.27 | 0.219 | 0.256 | 8 | |
| 3740.22 | He ii | 4.25 | 3739.95 | -21.64 | 0.0629 | 0.0736 | 19 | |
| 3744.89 | O iv | 6 | 3744.58 | -24.80 | 0.0381 | 0.0445 | 29 | |
| 3748.60 | He ii | 4.24 | 3748.36 | -19.19 | 0.0815 | 0.0952 | 15 | |
| 3750.15 | H i | H12 | 3749.86 | -23.17 | 2.686 | 3.138 | 6 | |
| 3754.69 | O iii | 2 | 3754.43 | -20.76 | 0.847 | 0.989 | 6 | |
| 3756.10 | He i | 66 | 3755.85 | -19.96 | 0.0277 | 0.0323 | 38 | |
| 3757.24 | O iii | 2 | 3756.98 | -20.75 | 0.266 | 0.310 | 8 | |
| 3758.14 | He ii | 4.23 | 3757.97 | -13.56 | 0.101 | 0.118 | 13 | |
| 3759.87 | O iii | 2 | 3759.61 | -20.73 | 4.198 | 4.897 | 6 | |
| 3762.47 | O ii | 4S0-4P | 3762.20 | -21.52 | 0.0132 | 0.0154 | 32 | |
| 3766.26 | Ne ii | 1 | 3766.03 | -18.31 | 0.0144 | 0.0168 | 30 | |
| 3768.78 | He i | 65 | 3768.78 | 0.00 | 0.110 | 0.129 | 10 | |
| 3769.14 | He ii | 4.22 | * | * | * | * | * | |
| 3770.63 | H i | H11 | 3770.33 | -23.84 | 3.494 | 4.069 | 6 | |
| 3774.02 | O iii | 2 | 3773.76 | -20.66 | 0.197 | 0.230 | 7 | |
| 3777.14 | Ne ii | 1 | 3776.81 | -26.18 | 0.0132 | 0.0154 | : | |
| 3781.72 | He ii | 4.21 | 3781.42 | -23.79 | 0.110 | 0.128 | 10 | |
| 3783.22 | [Fe v] | 5D-3F | 3783.39 | 13.46 | 0.0090 | 0.0104 | : | |
| 3784.89 | He i | 64 | 3784.56 | -26.13 | 0.0214 | 0.0249 | : | |
| 3791.27 | O iii | 2 | 3791.01 | -20.56 | 0.261 | 0.303 | 7 | |
| 3794.94 | [Fe v] | 5D-3F | 3795.01 | 5.54 | 0.0206 | 0.0239 | : | |
| 3796.33 | He ii | 4.20 | 3796.05 | -22.12 | 0.122 | 0.142 | 9 | |
| 3797.63 | [S iii] | 2F | 3797.60 | -23.67 | 4.625 | 5.366 | 6 | |
| 3797.90 | H i | H10 | * | * | * | * | * | |
| 3805.74 | He i | 63 | 3805.43 | -24.43 | 0.0310 | 0.0359 | 35 | |
| 3806.54 | Si iii | 5 | 3806.27 | -21.27 | 0.0132 | 0.0153 | : | |
| 3810.99 | O iii | 2 | 3810.77 | -17.31 | 0.0145 | 0.0168 | : | |
| 3813.50 | He ii | 4.19 | 3813.26 | -18.87 | 0.159 | 0.184 | 8 | |
| 3819.61 | He i | 22 | 3819.31 | -23.55 | 0.769 | 0.880 | 6 | |
| 3829.77 | Ne ii | 39 | 3829.60 | -13.30 | 0.0114 | 0.0132 | 22 | |
| 3833.57 | He i | 62 | 3833.51 | -4.70 | 0.190 | 0.220 | 7 | |
| 3833.80 | He ii | 4.18 | * | * | * | * | * | |
| 3835.39 | H i | H9 | 3835.09 | -23.44 | 6.343 | 7.320 | 6 | |
| 3839.27 | [Fe v] | 5D-3F | 3839.48 | 16.39 | 0.0274 | 0.0316 | 39 | |
| 3856.02 | Si ii | 1 | 3855.72 | -23.33 | 0.0334 | 0.0384 | 32 | |
| 3858.07 | He ii | 4.17 | 3857.81 | -20.21 | 0.196 | 0.226 | 7 | |
| 3862.59 | Si ii | 1 | 3862.31 | -21.74 | 0.0706 | 0.0811 | 17 | |
| 3868.75 | [Ne iii] | 1F | 3868.45 | -23.25 | 99.45 | 114.4 | 6 | |
| 3882.19 | O ii | 12 | 3881.97 | -16.99 | 0.0181 | 0.0208 | 16 | |
| 3887.44 | He ii | 4.16 | 3887.19 | -19.28 | 0.282 | 0.324 | 6 | |
| 3888.65 | He i | 2 | 3888.60 | -3.84 | 15.85 | 18.17 | 6 | |
| 3889.05 | H i | H8 | * | * | * | * | * | |
| 3891.28 | [Fe v] | 5D-3F | 3891.44 | 12.32 | 0.0403 | 0.0462 | 10 | |
| 3895.22 | [Fe v] | 5D-3P | 3895.45 | 17.70 | 0.0259 | 0.0296 | 13 | |
| 3911.33 | [Fe v] | 5D-3F | 3911.68 | 26.81 | 0.0208 | 0.0238 | 14 | f |
| 3920.68 | C ii | 4 | 3920.43 | -19.12 | 0.0203 | 0.0231 | 15 | |
| 3923.48 | He ii | 4.15 | 3923.22 | -19.87 | 0.301 | 0.343 | 6 | |
| 3926.53 | He i | 58 | 3926.21 | -24.44 | 0.0776 | 0.0885 | 7 | |
| 3928.90 | [Fe vi] | 2F-2D | 3928.95 | 3.82 | 0.0098 | 0.0112 | 25 | e |
| 3945.04 | O ii | 6 | 3944.71 | -25.09 | 0.0266 | 0.0303 | 12 | |
| 3945.31 | O iv | 10 | * | * | * | * | * | f, ? |
| 3948.01 | O iii | 3D-3P0 | 3947.66 | -26.59 | 0.0134 | 0.0153 | 20 | ? |
| 3954.36 | O ii | 6 | 3954.18 | -13.66 | 0.0155 | 0.0177 | 18 | |
| 3956.74 | O iv | 10 | 3956.51 | -17.43 | 0.0171 | 0.0194 | 17 | ? |
| 3964.73 | He i | 5 | 3964.41 | -24.20 | 0.407 | 0.462 | 6 | |
| 3967.46 | [Ne iii] | 1F | 3967.15 | -23.43 | 33.00 | 37.43 | 6 | |
| 3968.43 | He ii | 4.14 | * | * | * | * | * | |
| 3970.07 | H i | H7 | 3969.77 | -22.66 | 13.35 | 15.14 | 6 | |
| 3973.24 | O ii | 6 | 3972.97 | -20.38 | 0.0163 | 0.0184 | 17 | |
| 3994.98 | N ii | 12 | 3994.72 | -19.51 | 0.0075 | 0.0084 | 31 | |
| 3997.21 | P iv | 3S-3P0 | 3996.93 | -21.00 | 0.0097 | 0.0110 | 25 | ? |
| 3998.63 | N iii | 2D-2F0 | 3998.37 | -19.48 | 0.0093 | 0.0105 | 26 | |
| 4003.33 | N iii | 2D-2F0 | 4003.58 | -18.72 | 0.0230 | 0.0260 | 13 | |
| 4009.26 | He i | 55 | 4008.93 | -24.68 | 0.111 | 0.125 | 7 | |
| 4023.98 | He i | 54 | 4023.47 | -38.00 | 0.0255 | 0.0287 | 13 | |
| 4025.60 | He ii | 4.13 | 4025.76 | 11.91 | 1.801 | 2.026 | 6 | |
| 4026.21 | He i | 18 | * | * | * | * | * | |
| 4041.31 | N ii | 39 | 4041.07 | -17.80 | 0.0183 | 0.0205 | 16 | |
| 4043.53 | N ii | 39 | 4043.32 | -15.57 | 0.0097 | 0.0109 | 25 | |
| 4060.22 | [F iv] | 3P-1D | 4059.89 | -24.37 | 0.0329 | 0.0369 | 11 | |
| 4060.60 | O ii | 97 | * | * | * | * | * | ? |
| 4062.94 | O ii | 50 | 4062.73 | -15.49 | 0.0064 | 0.0072 | 35 | |
| 4067.94 | C iii | 16 | 4068.26 | 23.59 | 1.796 | 2.008 | 6 | |
| 4068.60 | [S ii] | 1F | * | * | * | * | * | |
| 4068.91 | C iii | 16 | * | * | * | * | * | |
| 4069.62 | O ii | 10 | 4069.84 | 16.20 | 0.294 | 0.328 | 6 | |
| 4069.89 | O ii | 10 | * | * | * | * | * | |
| 4070.26 | C iii | 16 | * | * | * | * | * | |
| 4071.24 | [Fe v] | 5D-3P | 4071.83 | 43.45 | 0.122 | 0.137 | 6 | ? |
| 4072.15 | O ii | 10 | * | * | * | * | * | |
| 4073.98 | O iii | 3P-3D0 | 4073.74 | -17.66 | 0.0325 | 0.0363 | 11 | |
| 4075.86 | O ii | 10 | 4075.92 | 4.40 | 0.660 | 0.737 | 6 | |
| 4076.35 | [S ii] | 1F | * | * | * | * | * | |
| 4078.84 | O ii | 10 | 4078.56 | -20.58 | 0.0187 | 0.0209 | 15 | |
| 4081.02 | O iii | 3P-3D0 | 4080.67 | -25.72 | 0.0187 | 0.0209 | 15 | |
| 4087.15 | O ii | 48 | 4086.86 | -21.26 | 0.0137 | 0.0153 | 19 | |
| 4088.86 | Si iv | 1 | 4088.45 | -30.06 | 0.0273 | 0.0305 | 12 | f |
| 4089.29 | O ii | 48 | 4088.84 | -32.99 | 0.0598 | 0.0666 | 8 | f |
| 4092.93 | O ii | 10 | 4092.71 | -16.11 | 0.0166 | 0.0184 | 17 | |
| 4095.64 | O ii | 48 | 4095.39 | -18.30 | 0.0062 | 0.0069 | 36 | |
| 4097.22 | O ii | 20 | 4097.02 | -22.69 | 1.797 | 2.001 | 6 | |
| 4097.26 | O ii | 48 | * | * | * | * | * | |
| 4097.33 | N iii | 1 | * | * | * | * | * | |
| 4100.04 | He ii | 4.12 | 4099.77 | -19.74 | 0.565 | 0.629 | 6 | |
| 4101.74 | H i | H6 | 4101.42 | -23.41 | 20.95 | 23.31 | 6 | |
| 4103.43 | N iii | 1 | 4103.07 | -26.33 | 0.861 | 0.958 | 6 | |
| 4104.99 | O ii | 20 | * | * | * | * | * | |
| 4110.79 | O ii | 20 | 4110.39 | -29.17 | 0.0064 | 0.0071 | 35 | |
| 4112.02 | O ii | 47 | 4111.84 | -13.14 | 0.0087 | 0.0097 | 27 | |
| 4116.10 | Si iv | 1 | 4115.79 | -22.57 | 0.0047 | 0.0052 | : | |
| 4119.22 | O ii | 20 | 4118.97 | -18.20 | 0.0481 | 0.0534 | 9 | |
| 4120.82 | He i | 16 | 4120.41 | -29.81 | 0.226 | 0.251 | 6 | f |
| 4122.62 | [K v] | 4S0-2D0 | 4122.25 | -26.92 | 0.0725 | 0.0804 | 7 | |
| 4128.55 | C iii | 3G-3H | 4128.42 | -9.43 | 0.0337 | 0.0374 | 11 | |
| 4132.80 | O ii | 19 | 4132.58 | -15.94 | 0.0139 | 0.0154 | 19 | |
| 4141.93 | O ii | 106 | 4142.11 | 13.01 | 0.0170 | 0.0188 | 17 | |
| 4142.07 | O ii | 106 | * | * | * | * | * | |
| 4143.76 | He i | 53 | 4143.40 | -26.04 | 0.210 | 0.232 | 6 | |
| 4145.90 | O ii | 106 | 4145.77 | -9.39 | 0.0187 | 0.0207 | 15 | |
| 4146.08 | O ii | 106 | * | * | * | * | * | |
| 4153.30 | O ii | 19 | 4153.05 | -18.05 | 0.0233 | 0.0258 | 13 | |
| 4156.50 | C iii | 3D-3F0 | 4156.12 | -27.40 | 0.0478 | 0.0528 | 9 | f |
| 4156.53 | O ii | 19 | * | * | * | * | * | |
| 4163.32 | [K v] | 4S0-2D0 | 4162.95 | -26.62 | 0.0925 | 0.102 | 7 | |
| 4168.97 | He i | 52 | 4168.68 | -20.86 | 0.0407 | 0.0449 | 9 | |
| 4169.22 | O ii | 19 | * | * | * | * | * | |
| 4180.60 | [Fe v] | 5D-3P | 4180.93 | 23.67 | 0.0154 | 0.0170 | 18 | |
| 4185.45 | O ii | 36 | 4185.10 | -25.08 | 0.0367 | 0.0404 | 10 | |
| 4186.90 | C iii | 18 | 4186.59 | -22.20 | 0.154 | 0.169 | 6 | |
| 4189.79 | O ii | 36 | 4189.50 | -20.75 | 0.0364 | 0.0401 | 10 | |
| 4199.83 | He ii | 4.11 | 4199.56 | -19.28 | 0.890 | 0.978 | 5 | f |
| 4201.40 | [Mn v] | 4F-2D | 4201.42 | 1.43 | 0.0081 | 0.0089 | 29 | |
| 4219.76 | Ne ii | 52 | 4219.48 | -19.88 | 0.0095 | 0.0104 | 26 | |
| 4227.20 | [Fe v] | 2F | 4227.34 | 9.90 | 0.137 | 0.150 | 6 | |
| 4229.02 | C iv | 2G-2F | 4228.84 | -12.77 | 0.0146 | 0.0160 | 18 | |
| 4236.91 | N ii | 48 | 4237.24 | 23.35 | 0.0539 | 0.0590 | 8 | |
| 4237.05 | N ii | 48 | * | * | * | * | * | |
| 4241.78 | N ii | 48 | 4241.65 | -9.18 | 0.0187 | 0.0204 | 15 | |
| 4253.90 | O ii | 109 | 4253.60 | -21.13 | 0.0186 | 0.0203 | 15 | f |
| 4253.91 | O ii | 109 | * | * | * | * | * | |
| 4261.47 | [Cu vi] | 3H-1D | 4261.18 | -20.41 | 0.0187 | 0.0205 | 15 | ? |
| 4267.15 | C ii | 6 | 4266.89 | -18.25 | 0.433 | 0.473 | 5 | |
| 4275.55 | O ii | 67 | 4275.42 | -9.11 | 0.0332 | 0.0362 | 11 | d |
| 4281.32 | O ii | 53 | 4281.14 | -12.58 | 0.0090 | 0.0098 | 27 | |
| 4281.45 | O ii | 53 | * | * | * | * | * | |
| 4282.96 | O ii | 67 | 4282.97 | 0.72 | 0.0220 | 0.0239 | 14 | |
| 4283.25 | O ii | 67 | * | * | * | * | * | |
| 4283.72 | O ii | 67 | * | * | * | * | * | |
| 4284.01 | O ii | 67 | * | * | * | * | * | |
| 4285.69 | O ii | 78 | 4285.39 | -20.97 | 0.0097 | 0.0106 | 25 | |
| 4288.82 | O ii | 53 | 4288.57 | -17.48 | 0.0043 | 0.0047 | : | |
| 4291.25 | O ii | 55 | 4291.00 | -17.47 | 0.0088 | 0.0096 | 27 | |
| 4292.21 | O ii | 78 | 4292.06 | -10.47 | 0.0098 | 0.0107 | 25 | |
| 4294.78 | S ii | 49 | 4294.55 | -16.05 | 0.0263 | 0.0286 | 12 | |
| 4294.92 | O ii | 54 | * | * | * | * | * | |
| 4303.61 | O ii | 65 | 4303.51 | -6.97 | 0.0287 | 0.0313 | 12 | |
| 4303.82 | O ii | 53 | * | * | * | * | * | |
| 4317.14 | O ii | 2 | 4316.94 | -13.90 | 0.0176 | 0.0192 | 16 | |
| 4319.63 | O ii | 2 | 4319.33 | -20.81 | 0.0145 | 0.0157 | 19 | |
| 4325.56 | C iii | 1P0-1D | 4325.43 | -22.84 | 0.0216 | 0.0234 | 14 | |
| 4325.76 | O ii | 2 | * | * | * | * | * | |
| 4332.71 | O ii | 65 | 4332.48 | -15.91 | 0.0106 | 0.0115 | 23 | |
| 4336.83 | O ii | 2 | 4336.64 | -13.13 | 0.0098 | 0.0107 | 25 | |
| 4338.67 | He ii | 4.10 | 4338.39 | -19.33 | 1.154 | 1.251 | 5 | |
| 4340.47 | H i | H5 | 4340.13 | -23.51 | 41.01 | 44.44 | 5 | |
| 4344.28 | O iv | — | 4343.66 | -42.79 | 0.0388 | 0.0420 | 10 | ? |
| 4345.56 | O ii | 2 | 4345.28 | -18.63 | 0.0204 | 0.0221 | 14 | |
| 4347.41 | O ii | 2D-2D0 | 4347.17 | -16.57 | 0.0078 | 0.0084 | 30 | |
| 4349.43 | O ii | 2 | 4349.13 | -20.70 | 0.0485 | 0.0525 | 9 | |
| 4363.21 | [O iii] | 2F | 4362.86 | -24.06 | 19.63 | 21.21 | 5 | |
| 4366.89 | O ii | 2 | 4366.65 | -16.49 | 0.0532 | 0.0574 | 8 | |
| 4366.99 | O iii | F[5/2]-G[7/2] | * | * | * | * | * | |
| 4368.77 | [Co iv] | 5D-3P2 | 4368.38 | -26.77 | 0.0155 | 0.0167 | 18 | |
| 4369.56 | O iii | F[5/2]-G[7/2] | 4369.33 | -15.78 | 0.0226 | 0.0244 | 13 | |
| 4375.01 | C ii | 4P0-4D | 4374.67 | -23.29 | 0.0123 | 0.0132 | : | ? |
| 4376.53 | O iii | F[7/2]-G[9/2] | 4376.24 | -19.84 | 0.0314 | 0.0338 | 11 | |
| 4379.11 | N iii | 18 | 4378.91 | -13.67 | 0.149 | 0.160 | 6 | |
| 4379.60 | O iii | F[7/2]-G[9/2] | * | * | * | * | * | |
| 4387.93 | He i | 51 | 4387.57 | -24.62 | 0.366 | 0.394 | 5 | |
| 4391.94 | Ne ii | 55e | 4392.38 | 30.03 | 0.0982 | 0.106 | 6 | f |
| 4408.27 | O iii | 46a | 4408.00 | -18.36 | 0.0126 | 0.0135 | 21 | |
| 4409.30 | Ne ii | 55e | 4409.04 | -17.66 | 0.0156 | 0.0167 | 18 | |
| 4414.85 | O iii | 46a | 4414.57 | -19.03 | 0.0477 | 0.0511 | 9 | |
| 4414.90 | O ii | 5 | * | * | * | * | * | |
| 4416.97 | O ii | 5 | 4416.60 | -25.12 | 0.0270 | 0.0290 | 12 | |
| 4428.54 | Ne ii | 57 | 4428.18 | -24.36 | 0.0102 | 0.0109 | 24 | |
| 4431.42 | [Mn v] | 4F-2P | 4430.85 | -38.55 | 0.0076 | 0.0082 | 30 | ? |
| 4432.74 | N ii | 55a | 4432.55 | -12.88 | 0.0045 | 0.0048 | : | |
| 4434.61 | O iii | G[9/2]-H[11/2]0 | 4434.27 | -22.98 | 0.108 | 0.115 | 6 | f |
| 4437.55 | He i | 50 | 4437.19 | -24.31 | 0.0489 | 0.0523 | 8 | |
| 4448.15 | O iii | G[9/2]-H[11/2]0 | 4447.76 | -26.30 | 0.0208 | 0.0221 | 14 | |
| 4452.38 | O ii | 5 | 4452.54 | 10.78 | 0.0503 | 0.0535 | 8 | |
| 4452.82 | O iii | G[9/2]-H[9/2]0 | * | * | * | * | * | |
| 4454.03 | O iii | D[5/2]-F[7/2] | 4453.76 | -18.18 | 0.0155 | 0.0165 | 18 | |
| 4458.55 | O iii | D[5/2]-F[7/2] | 4458.41 | -9.39 | 0.0468 | 0.0498 | 9 | |
| 4465.41 | O ii | 94 | 4465.10 | -20.82 | 0.0194 | 0.0206 | 15 | |
| 4467.92 | O ii | 94 | 4467.56 | -24.15 | 0.0096 | 0.0102 | 25 | |
| 4469.37 | O ii | 4D-4P | 4469.06 | -20.80 | 0.0077 | 0.0081 | 30 | |
| 4471.47 | He i | 14 | 4471.14 | -22.13 | 3.117 | 3.310 | 5 | |
| 4475.20 | O iii | 45b | 4474.89 | -20.77 | 0.0131 | 0.0139 | 20 | |
| 4481.21 | Mg ii | 4 | 4481.33 | 8.04 | 0.0416 | 0.0441 | 9 | f |
| 4491.22 | C ii | 2F0-2G | 4490.96 | -18.03 | 0.0165 | 0.0174 | 17 | |
| 4491.23 | O ii | 86a | * | * | * | * | * | |
| 4510.92 | [K iv] | 1D-1S | 4510.57 | -23.27 | 0.0833 | 0.0879 | 7 | |
| 4510.92 | N iii | 3 | * | * | * | * | * | |
| 4514.85 | N iii | 3 | 4514.53 | -21.27 | 0.0282 | 0.0297 | 12 | |
| 4516.79 | C iii | 3P-3S | 4516.48 | -20.58 | 0.0079 | 0.0083 | 29 | |
| 4518.14 | N iii | 3 | 4517.84 | -19.93 | 0.0187 | 0.0197 | 15 | |
| 4523.56 | N iii | 3 | 4523.23 | -21.88 | 0.0216 | 0.0227 | 14 | |
| 4530.41 | N ii | 58b | 4530.41 | 0.00 | 0.0193 | 0.0203 | 15 | |
| 4530.86 | N iii | 3 | * | * | * | * | * | |
| 4534.58 | N iii | 3 | 4534.19 | -25.80 | 0.0317 | 0.0333 | 11 | |
| 4539.70 | N iii | 12 | 4539.27 | -28.41 | 0.0179 | 0.0188 | 16 | |
| 4541.59 | He ii | 4.9 | 4541.29 | -19.79 | 1.585 | 1.662 | 5 | |
| 4544.84 | N iii | 12 | 4544.47 | -24.38 | 0.0311 | 0.0326 | 11 | |
| 4546.33 | N iii | 4S-4P0 | 4545.96 | -24.41 | 0.0033 | 0.0035 | : | |
| 4549.04 | [Mn iv] | a5D-a3F | 4548.82 | -14.51 | 0.0059 | 0.0061 | 37 | |
| 4552.52 | N ii | 58a | 4552.32 | -13.18 | 0.0066 | 0.0069 | 34 | |
| — | ? | — | 4554.64 | — | 0.0036 | 0.0038 | : | |
| 4562.60 | Mg i] | 1 | 4562.19 | -26.95 | 0.096 | 0.101 | 6 | |
| 4571.10 | Mg i] | 1 | 4570.69 | -26.90 | 0.423 | 0.442 | 5 | f |
| 4587.72 | O iii | 3P-3P0 | 4587.23 | -32.04 | 0.0046 | 0.0048 | : | |
| 4590.97 | O ii | 15 | 4590.66 | -20.25 | 0.0368 | 0.0383 | 10 | |
| 4595.95 | O ii | 15 | 4595.85 | -6.53 | 0.0305 | 0.0317 | 11 | |
| 4596.18 | O ii | 15 | * | * | * | * | * | |
| 4602.13 | O ii | 92b | 4601.74 | -25.38 | 0.0080 | 0.0083 | 29 | |
| 4603.74 | N v | 2S-2P0 | 4603.43 | -20.19 | 0.0056 | 0.0058 | 38 | ? |
| 4606.33 | N iv | 3G-3H0 | 4606.12 | -13.67 | 0.0734 | 0.0762 | 7 | |
| 4613.68 | O ii | 92b | 4613.15 | -34.46 | 0.0032 | 0.0034 | : | |
| 4621.39 | N ii | 5 | 4620.18 | -78.51 | 0.0152 | 0.0158 | 18 | d |
| 4624.22 | C iii | 3H0-3I | 4624.02 | -12.98 | 0.0041 | 0.0042 | : | ? |
| 4624.93 | [Ar v] | 1D-1S | 4625.04 | 7.12 | 0.0472 | 0.0489 | 9 | |
| 4630.54 | N ii | 5 | 4630.19 | -22.67 | 0.0246 | 0.0255 | 13 | |
| 4631.89 | O iv | 2G-2H0 | 4631.73 | -10.37 | 0.148 | 0.153 | 6 | |
| 4634.14 | N iii | 2 | 4633.80 | -22.02 | 1.772 | 1.833 | 5 | |
| 4638.86 | O ii | 1 | 4638.70 | -10.32 | 0.110 | 0.114 | 6 | |
| 4640.64 | N iii | 2 | 4640.29 | -22.62 | 3.543 | 3.663 | 5 | |
| 4641.81 | O ii | 1 | 4641.54 | -17.44 | 0.500 | 0.517 | 5 | |
| 4641.85 | N iii | 2 | * | * | * | * | * | |
| 4643.30 | [Mn iv] | b3G-d3F | 4643.04 | -16.77 | 0.0274 | 0.0283 | 12 | |
| 4647.42 | C iii | 1 | 4647.04 | -24.51 | 0.228 | 0.235 | 5 | c |
| 4649.13 | O ii | 1 | 4648.82 | -19.99 | 0.212 | 0.219 | 5 | |
| 4649.97 | O iii | 3P-3P0 | 4650.21 | 15.46 | 0.224 | 0.231 | 5 | |
| 4650.25 | C iii | 1 | * | * | * | * | * | |
| 4650.84 | O ii | 1 | * | * | * | * | * | |
| 4651.47 | C iii | 1 | * | * | * | * | * | |
| 4657.55 | C iv | 2F-2G | 4657.29 | -16.72 | 0.0872 | 0.0899 | 6 | |
| 4658.05 | [Fe iii] | 3F | 4658.14 | -3.87 | 0.232 | 0.240 | 5 | |
| 4658.20 | C iv | 2G-2H | * | * | * | * | * | |
| 4661.63 | O ii | 1 | 4661.19 | -28.30 | 0.111 | 0.114 | 6 | f |
| 4665.86 | C iii | — | 4665.31 | -35.33 | 0.0205 | 0.0211 | 14 | |
| 4668.87 | O iii | 3P-3P0 | 4668.43 | -28.25 | 0.0156 | 0.0161 | 17 | c |
| 4673.48 | O iii | 3P-3P0 | 4673.39 | -5.76 | 0.0193 | 0.0198 | 15 | |
| 4676.24 | O ii | 1 | 4675.87 | -23.73 | 0.0492 | 0.0506 | 8 | |
| 4679.83 | N iii | 2P0-2P | 4679.61 | -14.11 | 0.0248 | 0.0255 | 13 | |
| 4685.68 | He ii | 3.4 | 4685.41 | -17.28 | 46.73 | 47.98 | 5 | |
| 4688.83 | N iv | 3D-3P0 | 4688.49 | -21.74 | 0.0156 | 0.0160 | 17 | ? |
| 4688.99 | N iv | 3P0-3D | * | * | * | * | * | ? |
| 4701.62 | [Fe iii] | 3F | 4701.16 | -29.33 | 0.0111 | 0.0114 | 22 | |
| 4707.22 | [Mn iv] | b3G-d3F | 4706.86 | -22.95 | 0.0143 | 0.0147 | 19 | |
| 4711.37 | [Ar iv] | 1F | 4711.02 | -22.28 | 6.702 | 6.856 | 5 | |
| 4713.14 | He i | 12 | 4712.79 | -22.27 | 0.521 | 0.533 | 5 | |
| 4714.36 | [Ne iv] | 2D-2P | 4713.91 | -28.60 | 0.608 | 0.622 | 5 | |
| 4715.80 | [Ne iv] | 2D-2P | 4715.35 | -28.59 | 0.160 | 0.164 | 6 | |
| 4724.15 | [Ne iv] | 1F | 4723.81 | -21.57 | 0.664 | 0.678 | 5 | |
| 4725.62 | [Ne iv] | 1F | 4725.25 | -23.48 | 0.557 | 0.568 | 5 | |
| 4740.17 | [Ar iv] | 1F | 4739.86 | -19.61 | 8.369 | 8.525 | 5 | |
| 4754.69 | [Fe iii] | 3F | 4754.10 | -37.20 | 0.0049 | 0.0050 | : | |
| 4769.43 | [Fe iii] | 3F | 4769.11 | -20.14 | 0.0062 | 0.0063 | 35 | |
| 4802.70 | C ii | 17.08 | 4802.22 | -29.96 | 0.0168 | 0.0169 | 17 | |
| 4859.32 | He ii | 4.8 | 4859.00 | -19.73 | 2.323 | 2.324 | 5 | |
| 4861.33 | H i | H4 | 4860.95 | -23.43 | 100.0 | 100.0 | 5 | |
| 4881.00 | [Fe iii] | 2F | 4880.60 | -24.56 | 0.0166 | 0.0165 | 17 | |
| 4921.93 | He i | 48 | 4921.53 | -24.39 | 0.876 | 0.869 | 5 | |
| 4924.50 | [Fe iii] | 2F | 4924.23 | -16.44 | 0.0169 | 0.0168 | 16 | |
| 4924.53 | O ii | 28 | * | * | * | * | * | |
| 4930.50 | [Fe iii] | 2F | 4930.85 | -28.56 | 0.180 | 0.178 | 5 | |
| 4931.32 | [O iii] | 1F | * | * | * | * | * | |
| 4958.91 | [O iii] | 1F | 4958.55 | -21.79 | 526.0 | 518.5 | 5 | |
| 4985.90 | [Fe iii] | 2F | 4984.59 | -78.79 | 0.0064 | 0.0063 | : | ? |
| 4987.20 | [Fe iii] | 2F | 4986.71 | -29.47 | 0.0116 | 0.0114 | : | |
| 5006.84 | [O iii] | 1F | 5006.47 | -22.13 | 1596 | 1563 | 5 | |
| 5015.68 | He i | 4 | 5015.29 | -23.32 | 1.281 | 1.253 | 5 | f |
| 5040.72 | N ii | 19 | 5040.46 | -15.48 | 0.0840 | 0.0818 | 6 | f |
| 5055.98 | Si ii | 5 | 5055.86 | -7.12 | 0.0340 | 0.0330 | 9 | f |
| 5058.85 | N iii | 27 | 5058.20 | -38.52 | 0.0097 | 0.0094 | 22 | |
| 5121.82 | C ii | 12 | 5121.53 | -16.98 | 0.0140 | 0.0135 | 16 | |
| 5131.17 | [Ni v] | 3F-1D | 5130.65 | -30.39 | 0.0784 | 0.0755 | 6 | |
| 5145.75 | [Fe vi] | 4F-2G | 5145.63 | -7.00 | 0.0798 | 0.0768 | 6 | d |
| 5147.87 | N iii | 2G-2H0 | 5147.61 | -15.16 | 0.0274 | 0.0264 | 10 | |
| 5148.90 | O iii | G[7/2]-1F0 | 5148.24 | -38.43 | 0.0096 | 0.0092 | 22 | ? |
| — | ? | — | 5150.60 | — | 0.0170 | 0.0163 | 14 | |
| 5158.41 | [Fe vii] | 3F-3P | 5158.48 | 4.06 | 0.0304 | 0.0292 | 10 | h |
| 5159.94 | O ii | 2P0-2P | 5159.45 | -28.46 | 0.0113 | 0.0108 | 19 | h, ? |
| 5176.04 | [Fe vi] | 4F-2G | 5176.17 | 7.52 | 0.0599 | 0.0574 | 7 | |
| 5179.72 | N ii | 70 | 5179.45 | -15.63 | 0.0129 | 0.0124 | 17 | |
| 5191.82 | [Ar iii] | 3F | 5191.31 | -29.44 | 0.214 | 0.204 | 5 | |
| 5197.90 | [N i] | 1F | 5197.43 | -27.09 | 0.391 | 0.373 | 5 | |
| 5200.26 | [N i] | 1F | 5199.80 | -26.52 | 0.266 | 0.254 | 5 | |
| 5249.11 | C iii | 23 | 5248.71 | -22.84 | 0.0043 | 0.0041 | : | |
| 5270.40 | [Fe iii] | 1F | 5270.07 | -18.78 | 0.0135 | 0.0128 | 17 | |
| 5275.79 | [Fe vii] | 3F-3P | 5276.27 | 27.27 | 0.0073 | 0.0069 | 27 | |
| 5277.80 | [Fe vi] | 4F-4P | 5277.66 | -7.93 | 0.0172 | 0.0163 | 14 | |
| 5304.55 | C iii | 46 | 5303.89 | -37.29 | 0.0124 | 0.0117 | 18 | |
| 5304.93 | C iii | 46 | 5304.65 | -15.84 | 0.0159 | 0.0150 | 15 | |
| 5309.11 | [Ca v] | 3P-1D | 5308.89 | -12.41 | 0.0991 | 0.0933 | 6 | |
| 5322.99 | [Cl iv] | 1D-1S | 5322.66 | -18.59 | 0.0596 | 0.0560 | 7 | |
| 5335.18 | [Fe vi] | 4F-4P | 5335.13 | -2.83 | 0.0538 | 0.0505 | 7 | |
| 5342.38 | C ii | 17.06 | 5342.03 | -19.65 | 0.0268 | 0.0251 | 11 | |
| 5346.02 | [Kr iv] | 1F | 5345.60 | -23.55 | 0.112 | 0.105 | 6 | |
| 5363.37 | [Rb v] | — | 5363.39 | 1.12 | 0.0048 | 0.0045 | 38 | |
| 5370.29 | [Fe vi] | 4F-2G | 5370.25 | -2.24 | 0.0054 | 0.0051 | 34 | |
| 5411.52 | He ii | 4.7 | 5411.17 | -19.40 | 3.969 | 3.691 | 5 | |
| 5412.00 | [Fe iii] | 1F | * | * | * | * | * | |
| 5424.22 | [Fe vi] | 4F-4P | 5424.10 | -6.64 | 0.0363 | 0.0337 | 9 | |
| 5426.64 | [Fe vi] | 4F-4P | 5426.36 | -15.48 | 0.0175 | 0.0163 | 14 | |
| — | ? | — | 5450.62 | — | 0.0027 | 0.0025 | : | |
| 5460.99 | [Cu v] | 4F-4P | 5460.50 | -26.91 | 0.0027 | 0.0025 | : | ? |
| — | ? | — | 5464.91 | — | 0.0065 | 0.0060 | 30 | |
| — | ? | — | 5467.17 | — | 0.0034 | 0.0032 | : | |
| — | ? | — | 5468.35 | — | 0.0050 | 0.0046 | 37 | |
| 5470.68 | C iv | 2G-2F | 5470.27 | -22.48 | 0.0232 | 0.0214 | 12 | |
| 5484.84 | [Fe vi] | 4F-4P | 5484.83 | -0.53 | 0.0316 | 0.0291 | 10 | |
| — | ? | — | 5487.87 | — | 0.0052 | 0.0048 | 36 | |
| 5517.71 | [Cl iii] | 1F | 5517.24 | -25.52 | 0.656 | 0.602 | 5 | |
| 5537.88 | [Cl iii] | 1F | 5537.39 | -26.51 | 0.979 | 0.896 | 5 | |
| 5577.34 | [O i] | 3F | 5576.50 | -45.15 | 0.0516 | 0.0470 | 8 | |
| 5592.37 | O iii | 5 | 5591.92 | -24.14 | 0.119 | 0.108 | 6 | |
| 5602.44 | [K vi] | 3P-1D | 5601.76 | -36.40 | 0.0052 | 0.0048 | 35 | |
| 5604.99 | N iv | 3P0-3D | 5604.56 | -23.01 | 0.0011 | 0.0010 | : | |
| 5622.30 | N iv | 3P0-3D | 5621.82 | -25.60 | 0.0082 | 0.0074 | 25 | |
| 5631.10 | [Fe vi] | 4F-4P | 5630.81 | -15.44 | 0.0427 | 0.0386 | 8 | |
| — | ? | — | 5659.80 | — | 0.0114 | 0.0103 | 19 | |
| 5666.64 | N ii | 3 | 5666.28 | -19.07 | 0.0208 | 0.0187 | 13 | |
| 5676.02 | N ii | 3 | 5675.61 | -21.66 | 0.0086 | 0.0078 | 24 | |
| 5677.00 | [Fe vi] | 4F-4P | 5676.79 | -11.09 | 0.0381 | 0.0342 | 9 | |
| 5679.56 | N ii | 3 | 5679.21 | -18.48 | 0.0459 | 0.0411 | 8 | |
| 5685.35 | [Fe iv] | 4P-4F | 5684.90 | -23.74 | 0.0113 | 0.0102 | 19 | |
| 5686.21 | N ii | 3 | * | * | * | * | * | |
| 5691.98 | [Mn v] | 4F-2G | 5691.67 | -16.33 | 0.0113 | 0.0101 | 20 | |
| 5701.82 | [Mn v] | 4F-2G | 5701.61 | -11.04 | 0.0196 | 0.0175 | 13 | |
| 5709.21 | [Xe iv] | — | 5708.56 | -34.13 | 0.0073 | 0.0065 | 27 | |
| 5710.76 | N ii | 3 | 5710.37 | -20.46 | 0.0079 | 0.0071 | 26 | |
| 5720.71 | [Fe vii] | 3F-1D | 5720.89 | 9.44 | 0.0635 | 0.0566 | 7 | |
| 5726.45 | He ii | 5.67 | 5725.94 | -26.72 | 0.0013 | 0.0011 | : | |
| 5727.43 | He ii | 5.66 | 5727.09 | -17.82 | 0.0016 | 0.0015 | : | |
| 5728.45 | He ii | 5.65 | 5728.04 | -21.47 | 0.0029 | 0.0025 | : | |
| 5729.53 | He ii | 5.64 | 5729.12 | -21.44 | 0.0029 | 0.0026 | : | |
| 5730.65 | He ii | 5.63 | 5730.28 | -19.36 | 0.0037 | 0.0033 | : | |
| 5731.83 | He ii | 5.62 | 5731.47 | -18.82 | 0.0033 | 0.0029 | : | |
| 5733.07 | He ii | 5.61 | 5732.65 | -21.96 | 0.0036 | 0.0032 | : | |
| 5734.38 | He ii | 5.60 | 5734.01 | -19.35 | 0.0044 | 0.0039 | : | |
| 5735.48 | [Fe iv] | 4P-4F | 5735.34 | -7.33 | 0.0047 | 0.0042 | 39 | ? |
| 5735.75 | He ii | 5.59 | * | * | * | * | * | |
| 5737.19 | He ii | 5.58 | 5736.77 | -21.94 | 0.0059 | 0.0053 | 32 | |
| 5738.71 | He ii | 5.57 | 5738.26 | -23.52 | 0.0046 | 0.0041 | 39 | |
| 5739.73 | Si iii | 4 | 5739.85 | 6.27 | 0.0057 | 0.0051 | 33 | |
| 5740.32 | He ii | 5.56 | * | * | * | * | * | |
| 5742.01 | He ii | 5.55 | 5741.60 | -21.39 | 0.0062 | 0.0055 | 31 | |
| 5743.80 | He ii | 5.54 | 5743.38 | -21.92 | 0.0070 | 0.0062 | 28 | |
| 5745.69 | He ii | 5.53 | 5745.30 | -20.36 | 0.0057 | 0.0050 | 33 | |
| 5747.70 | He ii | 5.52 | 5747.30 | -20.89 | 0.0088 | 0.0078 | 24 | |
| 5749.82 | He ii | 5.51 | 5749.48 | -17.72 | 0.0079 | 0.0070 | 26 | |
| 5752.08 | He ii | 5.50 | 5751.73 | -18.25 | 0.0076 | 0.0067 | 26 | |
| 5754.47 | He ii | 5.49 | 5754.08 | -20.33 | 1.886 | 1.675 | 6 | |
| 5754.64 | [N ii] | 3F | * | * | * | * | * | |
| 5757.02 | He ii | 5.48 | 5756.66 | -18.74 | 0.0074 | 0.0066 | 27 | |
| 5758.11 | C iii | 1F0-1D | 5757.85 | -13.53 | 0.0021 | 0.0019 | : | ? |
| 5759.55 | [Rb iv] | — | 5759.21 | -17.69 | 0.0145 | 0.0129 | 16 | |
| 5759.74 | He ii | 5.47 | * | * | * | * | * | |
| 5762.64 | He ii | 5.46 | 5762.32 | -16.66 | 0.0109 | 0.0097 | 20 | |
| 5837.06 | He ii | 5.32 | 5836.65 | -21.07 | 0.0291 | 0.0255 | 10 | |
| 5846.66 | He ii | 5.31 | 5846.27 | -20.01 | 0.0305 | 0.0268 | 10 | |
| 5846.77 | [Xe iii] | — | * | * | * | * | * | ? |
| 5857.26 | He ii | 5.30 | 5856.87 | -19.94 | 0.0349 | 0.0306 | 9 | |
| 5861.00 | [Mn v] | 4F-2G | 5860.94 | -3.07 | 0.0249 | 0.0218 | 11 | |
| 5865.40 | C iv | 2K0-2I | 5864.94 | -23.51 | 0.0061 | 0.0054 | 31 | |
| 5867.74 | [Kr iv] | 4S-2D | 5867.29 | -23.00 | 0.149 | 0.131 | 6 | |
| 5869.02 | He ii | 5.29 | 5868.62 | -20.43 | 0.0310 | 0.0271 | 10 | |
| 5875.64 | He i | 11 | 5875.19 | -22.97 | 11.10 | 9.706 | 6 | |
| 5882.13 | He ii | 5.28 | 5881.73 | -20.38 | 0.0363 | 0.0317 | 9 | |
| 5885.40 | [Mn v] | 4F-2G | 5885.34 | -3.06 | 0.0229 | 0.0200 | 12 | |
| 5896.78 | He ii | 5.27 | 5896.28 | -25.42 | 0.0486 | 0.0424 | 8 | i |
| 5913.24 | He ii | 5.26 | 5912.84 | -20.30 | 0.0474 | 0.0412 | 8 | |
| 5931.83 | He ii | 5.25 | 5931.43 | -20.21 | 0.0547 | 0.0475 | 8 | |
| 5952.93 | He ii | 5.24 | 5952.53 | -20.17 | 0.0631 | 0.0547 | 7 | |
| 5977.03 | He ii | 5.23 | 5976.63 | -20.06 | 0.0704 | 0.0609 | 7 | |
| 5990.10 | [Mn v] | 4F-4P | 5989.24 | -43.04 | 0.0044 | 0.0038 | : | ? |
| 6004.73 | He ii | 5.22 | 6004.31 | -20.97 | 0.0794 | 0.0684 | 7 | |
| 6024.40 | [Mn v] | 4F-4P | 6024.44 | 1.99 | 0.0058 | 0.0050 | 33 | |
| 6036.70 | He ii | 5.21 | 6036.38 | -15.91 | 0.0909 | 0.0781 | 7 | |
| 6074.10 | He ii | 5.20 | 6073.79 | -15.30 | 0.105 | 0.0901 | 7 | |
| 6083.30 | [Mn v] | 4F-4P | 6083.28 | -0.99 | 0.0148 | 0.0126 | 16 | |
| 6086.29 | [Fe vii] | 3F-1D | 6086.51 | 10.82 | 0.121 | 0.103 | 7 | |
| 6086.40 | [Ca v] | 3F-1D | * | * | * | * | * | |
| 6101.83 | [K iv] | 1F | 6101.28 | -27.04 | 0.502 | 0.428 | 6 | |
| 6107.60 | N iii | 2P0-2D | 6107.19 | -29.94 | 0.0094 | 0.0081 | 22 | |
| 6107.80 | [Kr iv] | 2D-2P | * | * | * | * | * | |
| — | ? | — | 6114.12 | — | 0.0047 | 0.0040 | : | |
| 6118.20 | He ii | 5.19 | 6117.85 | -17.16 | 0.121 | 0.103 | 7 | |
| 6130.30 | C iii | 3H0-3G | 6129.89 | -20.04 | 0.0114 | 0.0097 | 20 | |
| 6134.33 | Ne iii | 5P-5D0 | 6134.15 | -8.81 | 0.0097 | 0.0082 | 22 | |
| 6134.61 | Ne iii | 5P-5D0 | * | * | * | * | * | |
| 6141.48 | Ne iii | 5P-5D0 | 6141.17 | -15.14 | 0.0090 | 0.0077 | 23 | |
| 6151.43 | C ii | 16.04 | 6150.94 | -23.89 | 0.0249 | 0.0211 | 12 | |
| 6157.60 | [Mn v] | 4F-4P | 6156.97 | -30.67 | 0.0154 | 0.0131 | 16 | |
| 6166.00 | [Mn v] | 4F-4P | 6165.33 | -32.58 | 0.0109 | 0.0092 | 20 | |
| 6167.75 | N ii | 36 | 6167.38 | -17.99 | 0.0046 | 0.0039 | 39 | |
| 6170.16 | N ii | 36 | 6170.29 | 6.31 | 0.148 | 0.126 | 7 | |
| 6170.60 | He ii | 5.18 | * | * | * | * | * | |
| 6228.60 | [K vi] | 3P-1D | 6227.83 | -37.07 | 0.0126 | 0.0106 | 18 | |
| 6233.80 | He ii | 5.17 | 6233.42 | -18.27 | 0.174 | 0.147 | 7 | |
| 6256.10 | [Kr v] | — | 6256.04 | -2.88 | 0.0093 | 0.0078 | 23 | |
| — | ? | — | 6272.78 | — | 0.0185 | 0.0155 | 14 | |
| 6300.30 | [O i] | 1F | 6299.77 | -25.21 | 6.433 | 5.389 | 6 | |
| 6310.85 | He ii | 5.16 | 6311.58 | 34.67 | 3.199 | 2.677 | 6 | |
| 6312.10 | [S iii] | 3F | * | * | * | * | * | |
| 6343.60 | [Mn v] | 4F-4P | 6343.20 | -18.90 | 0.0169 | 0.0141 | 15 | |
| 6347.11 | Si ii | 2 | 6346.58 | -25.03 | 0.0364 | 0.0303 | 10 | |
| 6363.78 | [O i] | 1F | 6363.21 | -26.85 | 2.238 | 1.864 | 6 | |
| 6371.36 | Si ii | 2 | 6370.86 | -23.53 | 0.0759 | 0.0631 | 8 | |
| 6393.60 | [Mn v] | 4F-4P | 6393.31 | -13.60 | 0.0255 | 0.0212 | 12 | |
| 6406.30 | He ii | 5.15 | 6405.96 | -15.90 | 0.258 | 0.214 | 7 | |
| 6408.10 | C iv | 9/17 | 6407.72 | -17.78 | 0.0027 | 0.0023 | : | |
| 6408.80 | [Xe vi] | — | 6408.39 | -19.18 | 0.0048 | 0.0039 | : | ? |
| 6435.10 | [Ar v] | 3P-1D | 6434.56 | -25.16 | 1.121 | 0.927 | 7 | |
| 6461.95 | C ii | 17.04 | 6461.44 | -23.67 | 0.0598 | 0.0493 | 8 | |
| 6515.70 | C ii | 2G-2F0 | 6515.58 | -5.53 | 0.0330 | 0.0271 | 10 | |
| 6527.11 | He ii | 5.14 | 6526.67 | -20.21 | 0.323 | 0.265 | 7 | |
| 6548.03 | [N ii] | 1F | 6547.51 | -23.81 | 30.83 | 25.25 | 7 | |
| 6560.00 | He ii | 4.6 | 6559.68 | -14.62 | 7.701 | 6.301 | 7 | |
| 6562.82 | H i | H3 | 6562.31 | -23.29 | 322.3 | 263.6 | 7 | |
| 6578.05 | C ii | 2 | 6577.64 | -18.67 | 0.218 | 0.178 | 7 | |
| 6583.41 | [N ii] | 1F | 6582.87 | -24.59 | 95.06 | 77.63 | 7 | |
| 6601.00 | O iv | 2D-2D0 | 6600.40 | -27.25 | 0.0074 | 0.0060 | 27 | ? |
| 6641.03 | O ii | 4 | 6640.57 | -20.77 | 0.0040 | 0.0032 | : | |
| 6678.15 | He i | 46 | 6677.63 | -23.35 | 3.255 | 2.638 | 7 | |
| 6683.20 | He ii | 5.13 | 6682.76 | -19.76 | 0.410 | 0.332 | 7 | |
| 6716.47 | [S ii] | 2F | 6715.89 | -25.89 | 3.640 | 2.941 | 7 | |
| 6721.39 | O ii | 4 | 6720.96 | -19.19 | 0.0064 | 0.0052 | 31 | |
| 6727.48 | C iii | 3 | 6727.03 | -20.06 | 0.0034 | 0.0027 | : | |
| 6730.85 | [S ii] | 2F | 6730.27 | -25.84 | 6.617 | 5.340 | 7 | |
| 6734.00 | C ii | 21 | 6733.52 | -21.37 | 0.0036 | 0.0029 | : | |
| 6739.80 | [Fe iv] | 4G-2I | 6739.50 | -13.34 | 0.0035 | 0.0028 | : | g, ? |
| 6742.15 | C iii | 3 | 6741.69 | -20.45 | 0.0028 | 0.0022 | : | |
| 6744.39 | C iii | 3 | 6743.93 | -20.45 | 0.0162 | 0.0130 | 16 | |
| 6746.80 | C iv | 9/16 | 6746.45 | -15.55 | 0.0055 | 0.0044 | 34 | |
| 6762.17 | C iii | 3 | 6761.74 | -19.05 | 0.0033 | 0.0026 | : | |
| 6779.93 | C ii | 14 | 6779.59 | -15.05 | 0.0318 | 0.0256 | 11 | |
| 6780.59 | C ii | 14 | * | * | * | * | * | |
| 6783.91 | C ii | 14 | 6783.42 | -21.67 | 0.0029 | 0.0023 | : | |
| 6787.22 | C ii | 14 | 6786.73 | -21.66 | 0.0072 | 0.0058 | 27 | |
| 6791.47 | C ii | 14 | 6790.98 | -21.64 | 0.0114 | 0.0092 | 21 | |
| 6795.00 | [K iv] | 1F | 6794.47 | -23.38 | 0.119 | 0.0955 | 8 | |
| 6800.69 | C ii | 14 | 6800.21 | -21.16 | 0.0065 | 0.0052 | 30 | |
| 6826.70 | [Kr iii] | — | 6826.66 | -1.76 | 0.0354 | 0.0284 | 12 | |
| 6827.88 | He i | 1/16 | * | * | * | * | * | |
| 6849.92 | [Mn vi] | 1F | 6849.61 | -13.56 | 0.0163 | 0.0130 | 17 | ? |
| 6890.88 | He ii | 5.12 | 6890.49 | -16.95 | 0.4829 | 0.3852 | 7 | |
| 6895.10 | O ii | 4F-4D | 6894.72 | -16.52 | 0.0185 | 0.0147 | 16 | |
| 6906.44 | O ii | 4F-4D | 6906.08 | -15.62 | 0.0064 | 0.0051 | 29 | |
| 6933.89 | He i | 1/13 | 6933.13 | -32.87 | 0.0057 | 0.0045 | 31 | |
| — | ? | — | 6958.81 | — | 0.0085 | 0.0068 | 25 | g |
| 6975.60 | C iii | 3H0-3I | 6975.19 | -17.63 | 0.0025 | 0.0020 | : | |
| 6989.47 | He i | 1/12 | 6989.01 | -19.75 | 0.0082 | 0.0065 | 25 | |
| 7004.10 | O iv | 2P0-2P | 7003.93 | -7.27 | 0.0031 | 0.0025 | : | |
| 7005.67 | [Ar v] | 3P-1D | 7005.21 | -19.68 | 2.682 | 2.123 | 7 | |
| — | ? | — | 7030.44 | — | 0.0052 | 0.0041 | 33 | |
| 7032.30 | O iv | 12.01 | 7031.85 | -19.17 | 0.0037 | 0.0029 | : | |
| — | ? | — | 7046.36 | — | 0.0055 | 0.0044 | 32 | |
| 7053.60 | O iv | 12.01 | 7053.40 | -8.51 | 0.0197 | 0.0155 | 16 | |
| — | ? | — | 7058.79 | — | 0.0146 | 0.0115 | 18 | |
| 7062.26 | He i | 1/11 | 7061.82 | -18.68 | 0.0565 | 0.0445 | 10 | |
| 7065.28 | He i | 10 | 7064.68 | -25.44 | 5.760 | 4.539 | 7 | |
| — | ? | — | 7102.30 | — | 0.0077 | 0.0061 | 26 | |
| 7112.48 | C ii | 20 | 7112.41 | -2.94 | 0.0090 | 0.0071 | 24 | |
| 7113.04 | C ii | 20 | * | * | * | * | * | |
| 7115.63 | C ii | 20 | 7115.04 | -24.85 | 0.0086 | 0.0068 | 25 | |
| 7135.78 | [Ar iii] | 1F | 7135.25 | -22.26 | 26.79 | 21.01 | 7 | |
| 7160.61 | He i | 1/10 | 7160.12 | -20.51 | 0.0173 | 0.0136 | 17 | |
| 7170.62 | [Ar iv] | 2F | 7170.08 | -22.58 | 0.462 | 0.362 | 8 | |
| 7177.50 | He ii | 5.11 | 7176.95 | -22.97 | 0.566 | 0.443 | 8 | |
| 7206.40 | C iv | 9/15 | 7205.91 | -20.38 | 0.0020 | 0.0016 | : | e |
| 7231.34 | C ii | 3 | 7230.93 | -16.98 | 0.0836 | 0.0651 | 9 | |
| 7236.42 | C ii | 3 | 7236.98 | 23.20 | 0.550 | 0.429 | 8 | |
| 7237.17 | C ii | 3 | * | * | * | * | * | |
| 7237.40 | [Ar iv] | 2F | * | * | * | * | * | |
| 7262.76 | [Ar iv] | 2F | 7262.43 | -13.61 | 0.411 | 0.320 | 8 | |
| 7281.35 | He i | 45 | 7280.78 | -23.48 | 0.679 | 0.528 | 8 | |
| 7298.05 | He i | 1/9 | 7297.43 | -25.46 | 0.0221 | 0.0172 | 15 | |
| 7306.85 | O iii | 24.03 | 7306.58 | -11.08 | 0.0085 | 0.0066 | 25 | |
| 7307.12 | O iii | 24.03 | * | * | * | * | * | |
| 7318.92 | [O ii] | 2F | 7319.33 | 16.80 | 6.260 | 4.852 | 8 | |
| 7319.99 | [O ii] | 2F | * | * | * | * | * | |
| 7329.66 | [O ii] | 2F | 7329.57 | -3.69 | 5.483 | 4.247 | 8 | |
| 7330.73 | [O ii] | 2F | * | * | * | * | * | |
| 7414.04 | O iii | 24.03 | 7413.52 | -21.03 | 0.0043 | 0.0033 | 37 | |
| 7455.36 | O iii | 24.03 | 7454.75 | -24.53 | 0.0101 | 0.0078 | 23 | |
| 7486.59 | C iii | 41 | 7486.29 | -12.01 | 0.0085 | 0.0065 | 25 | |
| 7499.85 | He i | 1/8 | 7499.25 | -23.99 | 0.0396 | 0.0303 | 12 | |
| 7504.96 | O ii | 2G-G[5]0 | 7504.52 | -17.57 | 0.0042 | 0.0033 | 37 | |
| 7507.20 | C iii | 3H0-3I | 7506.87 | -13.18 | 0.0049 | 0.0037 | 34 | |
| — | ? | — | 7509.38 | — | 0.0037 | 0.0028 | : | |
| 7514.40 | C iii | 3I-3K0 | 7513.85 | -21.94 | 0.0028 | 0.0022 | : | |
| 7515.99 | O iii | 24.03 | 7515.48 | -20.35 | 0.0061 | 0.0047 | 30 | |
| 7519.49 | C ii | 16.08 | 7519.26 | -9.19 | 0.0039 | 0.0030 | 39 | |
| 7519.86 | C ii | 16.08 | * | * | * | * | * | |
| 7530.54 | [Cl iv] | 1F | 7529.84 | -27.88 | 0.708 | 0.542 | 8 | |
| 7535.40 | [Xe iv] | 4S-2D | 7534.38 | -40.59 | 0.0100 | 0.0076 | 23 | |
| 7578.15 | C iii | 35 | 7577.44 | -28.09 | 0.0063 | 0.0048 | 30 | |
| 7581.50 | N iv | 1G-1Ho | 7580.69 | -32.04 | 0.0040 | 0.0031 | 39 | |
| 7582.30 | N iv | 22 | 7581.83 | -18.57 | 0.0068 | 0.0052 | 28 | |
| 7592.00 | O v | 29 | 7590.59 | -55.69 | 0.0047 | 0.0036 | 35 | h, ? |
| 7592.28 | C iii | 35 | 7592.24 | -1.56 | 1.070 | 0.816 | 8 | |
| 7592.74 | He ii | 5.10 | * | * | * | * | * | |
| 7677.40 | O iv | 20 | 7675.79 | -62.88 | 0.0321 | 0.0244 | 13 | |
| 7702.96 | N iv | 23 | 7702.80 | -6.23 | 0.0330 | 0.0250 | 13 | |
| 7726.20 | C iv | 8.01 | 7725.65 | -21.35 | 0.201 | 0.152 | 9 | g |
| 7735.84 | C iv | 2G-2F | 7735.33 | -19.76 | 0.0235 | 0.0178 | 15 | |
| 7751.10 | [Ar iii] | 2F | 7750.53 | -22.06 | 6.890 | 5.208 | 8 | |
| 7816.13 | He i | 1/7 | 7815.52 | -23.39 | 0.0577 | 0.0435 | 11 | |
| 7839.38 | O iii | 3S-3P0 | 7838.85 | -20.26 | 0.0030 | 0.0023 | : | |
| 7860.40 | C iv | 9/14 | 7860.19 | -8.01 | 0.0104 | 0.0080 | 22 | g |
| 7876.03 | [P ii] | 1D-1S | 7875.18 | -32.34 | 0.0470 | 0.0354 | 11 | d |
| 8018.90 | N iii | 2F0-2G | 8018.33 | -21.30 | 0.0169 | 0.0126 | 17 | |
| 8019.50 | N iii | 2F0-2G | * | * | * | * | * | |
| 8045.63 | [Cl iv] | 1F | 8045.05 | -21.62 | 1.694 | 1.263 | 8 | |
| 8160.10 | [Cr ii] | 4G-2D | 8159.62 | -17.63 | 0.0379 | 0.0281 | 12 | |
| 8196.48 | C iii | 43 | 8196.04 | -16.11 | 0.310 | 0.230 | 9 | |
| 8236.77 | He ii | 5.9 | 8236.24 | -19.27 | 1.633 | 1.204 | 8 | |
| 8267.94 | H i | P34 | 8267.57 | -13.42 | 0.109 | 0.0804 | 10 | g |
| 8271.93 | H i | P33 | 8271.23 | -25.34 | 0.0902 | 0.0664 | 10 | e |
| 8281.12 | H i | P31 | 8280.61 | -18.46 | 0.102 | 0.0751 | 10 | e,g |
| 8286.43 | H i | P30 | 8285.96 | -17.00 | 0.150 | 0.110 | 9 | g |
| 8292.31 | H i | P29 | 8291.69 | -22.39 | 0.135 | 0.0992 | 9 | |
| 8298.83 | H i | P28 | 8298.57 | -9.38 | 0.221 | 0.163 | 9 | g |
| 8306.11 | H i | P27 | 8305.77 | -12.30 | 0.131 | 0.0960 | 9 | e |
| 8314.26 | H i | P26 | 8313.60 | -23.81 | 0.183 | 0.134 | 9 | g |
| 8323.42 | H i | P25 | 8322.81 | -21.99 | 0.192 | 0.141 | 9 | |
| 8333.78 | H i | P24 | 8333.08 | -25.19 | 0.221 | 0.162 | 9 | e |
| 8345.55 | H i | P23 | 8344.79 | -27.30 | 0.394 | 0.289 | 9 | g |
| 8345.65 | He i | 7/22 | * | * | * | * | * | |
| 8359.00 | H i | P22 | 8358.40 | -21.51 | 0.253 | 0.185 | 9 | |
| 8361.08 | He i | 7/21 | 8361.05 | -1.09 | 0.0885 | 0.0647 | 10 | |
| 8374.48 | H i | P21 | 8373.86 | -22.20 | 0.275 | 0.201 | 9 | |
| 8386.38 | N iii | 5.01 | 8385.93 | -16.09 | 0.0413 | 0.0301 | 12 | |
| 8388.96 | He ii | 6.40 | 8388.41 | -19.65 | 0.0120 | 0.0088 | 21 | |
| 8392.40 | H i | P20 | 8391.78 | -22.15 | 0.351 | 0.256 | 9 | |
| 8413.32 | H i | P19 | 8412.70 | -22.10 | 0.401 | 0.292 | 9 | |
| 8421.67 | He ii | 6.37 | 8421.13 | -19.23 | 0.0232 | 0.0169 | 15 | |
| 8433.85 | [Cl iii] | 3F | 8433.31 | -19.20 | 0.0538 | 0.0391 | 11 | |
| 8437.96 | H i | P18 | 8437.34 | -22.03 | 0.464 | 0.337 | 9 | |
| 8446.25 | O i | 4 | 8445.67 | -20.59 | 0.126 | 0.0915 | 10 | |
| 8446.36 | O i | 4 | * | * | * | * | * | |
| 8446.76 | O i | 4 | * | * | * | * | * | |
| 8448.39 | He ii | 6.35 | * | * | * | * | * | g |
| 8463.70 | He ii | 6.34 | 8463.18 | -18.44 | 0.0186 | 0.0135 | 17 | |
| 8467.25 | H i | P17 | 8466.44 | -28.67 | 0.648 | 0.469 | 9 | g |
| 8480.67 | He ii | 6.33 | 8480.07 | -21.20 | 0.0547 | 0.0395 | 12 | |
| 8480.90 | [Cl iii] | 3F | * | * | * | * | * | |
| 8486.27 | He i | 6/16 | 8485.62 | -22.94 | 0.0158 | 0.0114 | 18 | |
| 8499.00 | He ii | 6.32 | 8499.01 | 0.34 | 0.0567 | 0.0409 | 11 | |
| 8499.70 | [Cl iii] | 3F | * | * | * | * | * | |
| 8502.48 | H i | P16 | 8501.86 | -21.87 | 0.655 | 0.473 | 9 | |
| 8519.40 | He ii | 6.31 | 8518.74 | -23.23 | 0.0241 | 0.0174 | 15 | |
| 8528.99 | He i | 6/15 | 8528.38 | -21.46 | 0.0187 | 0.0135 | 17 | |
| 8661.40 | He ii | 6.26 | 8660.88 | -18.02 | 0.0560 | 0.0398 | 12 | g |
| 8662.90 | C iii | 45 | 8664.37 | 50.85 | 1.287 | 0.913 | 9 | |
| 8663.90 | C iii | 45 | * | * | * | * | * | |
| 8665.02 | H i | P13 | * | * | * | * | * | |
| 8665.40 | C iii | 45 | * | * | * | * | * | g |
| 8668.25 | Ne ii | 2G-2F0 | 8667.84 | -14.19 | 0.0150 | 0.0107 | 19 | |
| 8680.37 | Ne ii | 2G-2F0 | 8679.95 | -14.50 | 0.0119 | 0.0084 | 21 | g |
| 8701.30 | He ii | 6.25 | 8700.79 | -17.56 | 0.0487 | 0.0344 | 12 | g |
| — | ? | — | 8703.81 | — | 0.0136 | 0.0096 | 20 | |
| 8706.60 | C iii | 2G-2H0 | 8706.19 | -14.09 | 0.0062 | 0.0044 | 30 | |
| 8727.13 | [C i] | 3F | 8726.47 | -22.68 | 0.0563 | 0.0397 | 12 | |
| 8733.43 | He i | 6/12 | 8732.75 | -23.33 | 0.0379 | 0.0267 | 13 | |
| 8736.04 | He i | 7/12 | 8735.39 | -22.32 | 0.0124 | 0.0088 | 21 | |
| 8747.00 | He ii | 6.24 | 8746.30 | -24.00 | 0.0615 | 0.0433 | 12 | |
| 8750.47 | H i | P12 | 8749.83 | -21.92 | 1.543 | 1.086 | 9 | |
| 8776.60 | He i | 4/9 | 8776.23 | -12.61 | 0.0901 | 0.0632 | 11 | |
| 8794.97 | [Cr iii] | 18F | 8794.38 | -20.11 | 0.0156 | 0.0109 | 19 | |
| 8798.90 | He ii | 6.23 | 8798.41 | -16.70 | 0.0632 | 0.0443 | 12 | |
| 8806.76 | Mg i | 7 | 8806.03 | -24.83 | 0.0079 | 0.0055 | 27 | |
| 8816.50 | He i | 10/12 | 8816.05 | -15.31 | 0.0085 | 0.0059 | 25 | |
| 8829.40 | [S iii] | 3F | 8829.05 | -11.90 | 0.0131 | 0.0092 | 20 | |
| 8845.38 | He i | 6/11 | 8844.74 | -21.68 | 0.0546 | 0.0381 | 12 | |
| 8848.05 | He i | 7/11 | 8847.45 | -20.32 | 0.0203 | 0.0142 | 17 | |
| 8854.00 | [Se iii] | — | 8853.48 | -17.61 | 0.0111 | 0.0077 | 22 | |
| 8854.11 | He i | 5/11 | * | * | * | * | * | |
| 8857.40 | C iv | 9/13 | 8856.66 | -25.06 | 0.0114 | 0.0080 | 22 | |
| 8859.10 | He ii | 6.22 | 8858.53 | -19.27 | 0.0633 | 0.0441 | 12 | |
| 8862.79 | H i | P11 | 8862.13 | -22.33 | 1.964 | 1.368 | 10 | |
| 8929.21 | He ii | 6.21 | 8928.43 | -26.20 | 0.0748 | 0.0518 | 11 | |
| 8996.99 | He i | 6/10 | 8996.26 | -24.34 | 0.0668 | 0.0461 | 12 | |
| 8999.40 | He i | 7/10 | 8998.85 | -18.35 | 0.0139 | 0.0095 | 20 | |
| 9014.91 | H i | P10 | 9014.26 | -21.63 | 2.630 | 1.810 | 10 | e |
| 9063.29 | He i | 4/8 | 9062.69 | -19.83 | 0.0574 | 0.0394 | 12 | e |
| 9068.60 | [S iii] | 1F | 9068.17 | -14.21 | 33.51 | 22.98 | 10 | |
| 9108.50 | He ii | 6.19 | 9107.94 | -18.42 | 0.0500 | 0.0342 | 13 | e |
| 9123.60 | [Cl ii] | 1F | 9122.83 | -25.29 | 0.0724 | 0.0495 | 12 | |
| 9210.28 | He i | 6/9 | 9209.66 | -20.19 | 0.0886 | 0.0604 | 11 | |
| 9213.20 | He i | 7/9 | 9212.44 | -24.72 | 0.0274 | 0.0187 | 15 | e |
| 9225.23 | He ii | 6.18 | 9224.51 | -23.42 | 0.120 | 0.0817 | 11 | e |
| 9229.01 | H i | P9 | 9228.31 | -22.75 | 3.682 | 2.506 | 10 | |
| 9344.94 | He ii | 5.8 | 9344.85 | -2.91 | 0.162 | 0.110 | 11 | e |
| 9367.03 | He ii | 6.17 | 9365.92 | -35.54 | 0.0474 | 0.0322 | 13 | e |
| 9516.57 | He i | 4/7 | 9515.52 | -33.11 | 0.0623 | 0.0422 | 12 | e |
| 9526.16 | He i | 6/8 | 9525.74 | -13.22 | 0.114 | 0.0774 | 11 | e |
| 9530.60 | [S iii] | 1F | 9530.41 | -5.96 | 78.52 | 53.09 | 10 | |
| 9542.06 | He ii | 6.16 | 9541.67 | -12.24 | 0.0844 | 0.0571 | 11 | e |
| 9545.97 | H i | P8 | 9545.40 | -17.88 | 2.652 | 1.793 | 10 | e |
| 9702.50 | He i | 3/7 | 9702.66 | 4.95 | 0.0061 | 0.0041 | 31 | e |
| 9708.20 | C iii | 3H0-3I | 9707.69 | -15.74 | 0.0097 | 0.0065 | 24 | |
| 9719.62 | C iii | 3I-3K0 | 9718.98 | -19.73 | 0.0174 | 0.0117 | 18 | g |
| 9824.13 | [C i] | — | 9823.37 | -23.19 | 0.132 | 0.0890 | 11 | g |
| 9850.26 | [C i] | — | 9849.26 | -30.44 | 0.490 | 0.331 | 10 | g |
| 9902.30 | [Kr iii] | — | 9902.88 | 17.56 | 0.218 | 0.147 | 11 | |
| 9903.46 | C ii | 17.02 | * | * | * | * | * | |
| 9982.45 | O ii | G[5]0-2[6] | 9981.94 | -15.31 | 0.0161 | 0.0109 | 19 | |
| 9988.54 | O ii | G[5]0-2[6] | 9989.58 | 31.21 | 0.0620 | 0.0419 | 12 | |
| 9990.08 | O ii | D[3]0-0[4] | * | * | * | * | * | |
| 9991.48 | O ii | D[3]0-0[4] | * | * | * | * | * | |
| 10008.90 | O ii | G[4]0-1[5] | 10008.18 | -21.59 | 0.0122 | 0.0082 | 21 | |
| 10027.70 | He i | 6/7 | 10026.94 | -22.72 | 0.237 | 0.160 | 10 | g |
| 10031.20 | He i | 7/7 | 10030.40 | -23.90 | 0.0754 | 0.0510 | 12 | |
| 10045.20 | He ii | 6.14 | 10044.47 | -21.80 | 0.410 | 0.277 | 10 | g |
| 10049.40 | H i | P7 | 10048.63 | -22.99 | 9.655 | 6.525 | 10 | |
| 10110.40 | O ii | F[4]0-2[5] | 10109.92 | -14.25 | 0.0115 | 0.0078 | 22 | |
| 10123.60 | He ii | 4.5 | 10122.97 | -18.65 | 25.33 | 17.12 | 10 | g |
| 10138.40 | He i | 10/7 | 10137.55 | -25.15 | 0.0418 | 0.0282 | 13 | |
| 10310.70 | He i | 4/6 | 10310.09 | -17.75 | 0.254 | 0.172 | 10 | g |
| 10320.50 | [S ii] | 3F | 10319.60 | -26.16 | 0.911 | 0.616 | 10 | |
| 10336.40 | [S ii] | 3F | 10335.51 | -25.83 | 0.688 | 0.465 | 10 | |
| 10370.50 | [S ii] | 3F | 10369.64 | -24.87 | 0.328 | 0.222 | 10 | |
| 10397.50 | [N i] | 3F | 10396.68 | -23.65 | 0.526 | 0.356 | 10 | g |
| 10407.40 | [N i] | 3F | 10406.33 | -30.83 | 0.141 | 0.0954 | 11 | |
| 10419.80 | He ii | 6.13 | 10418.64 | -33.38 | 1.256 | 0.849 | 10 | g |
| a Where is the unreddened flux in units of erg cm-2 s-1. | ||||||||
| b Where is the reddened corrected flux, with c(H)=0.27, in units of erg cm-2 s-1. | ||||||||
| c Blended with an unknown line. | ||||||||
| d Affected by ghost. | ||||||||
| e Affected by atmospheric absorption bands. | ||||||||
| f Affected by charge transfer. | ||||||||
| g Affected by telluric emission. | ||||||||
| h Partially blended with other emission line. | ||||||||
| i Affected by interstellar Na I absorption. | ||||||||