[a]J.E. Gudmundsson
The Thermal Design, Characterization,
and Performance of the Spider Long-Duration Balloon Cryostat
Abstract
We describe the Spider flight cryostat, which is designed to cool six millimeter-wavelength telescopes during an Antarctic long-duration balloon flight. The cryostat, one of the largest to have flown on a stratospheric payload, uses liquid to deliver cooling power to stages at 4.2 and 1.6 K. Stainless steel capillaries facilitate a high flow impedance connection between the main liquid helium tank and a smaller superfluid tank, allowing the latter to operate at 1.6 K as long as there is liquid in the 4.2 K main tank. Each telescope houses a closed cycle adsorption refrigerator that further cools the focal planes down to 300 mK. Liquid helium vapor from the main tank is routed through heat exchangers that cool radiation shields, providing negative thermal feedback. The system performed successfully during a 17 day flight in the 2014–2015 Antarctic summer. The cryostat had a total hold time of 16.8 days, with 15.9 days occurring during flight.
1 Introduction
Numerous experiments have characterized the spectrum, morphology and, most recently, the polarization of the Cosmic Microwave Background (CMB) [1, 2, 3, 4, 5]. Many of these experiments rely on cryogenically-cooled receivers to suppress thermal noise that would otherwise dominate the CMB signal. Spider is a microwave polarimeter employing cryogenic bolometers sensitive to broad band radiation at 95 and 150 GHz, that is designed to image the CMB polarization with the aim of constraining models of the early universe [6, 7].
Spider deploys multiple arrays of superconducting transition edge sensors on a stratospheric balloon platform supplied by NASA’s Columbia Scientific Balloon Facility (CSBF). The design requirements include the cooling of six telescopes, representing a total aperture of nearly 0.5 square meters, to 300 mK for approximately 20 days while providing continuous cooling power to auxiliary temperature stages at 1.6, 4.2, 30, and 150 K, and staying within the mass and power constraints set by the balloon platform. A helium-only system that employs two cryogenic volumes, a 1284 L main tank and a 16 L superfluid tank, meets these requirements. The superfluid tank is continuously supplied via capillaries that connect it to the main tank while maintaining a one-atmosphere pressure differential between the two tanks [8]. Vapor cooled aluminum shells surround the two tanks and provide radiation shielding and negative thermal feedback.
 |
The construction of the Spider flight cryostat was preceded by the initial fabrication of three smaller test cryostats. Each of these test cryostats accommodated a single telescope, and helped verify both the design and manufacturing methods applied to the larger flight cryostat. Thermal qualification of those systems showed that a helium-only cryostat with two vapor cooled shields could successfully cool an entire Spider telescope while maintaining minimal in-band loading from warmer temperature stages, and a reasonable cryogen boil-off rate. Additionally, the test cryostats demonstrated the performance of: 1) the heat exchangers cooling intermediate stages; 2) multilayer insulation and its distribution across radiation shields; and 3) thermal conduction paths to sub-kelvin stages, critical for the operation of adsorption refrigerators. After qualification, one of the three Spider cryostats was provided to the BICEP2 instrument, maintaining that system at cryogenic temperatures continuously for three years at the South Pole [9]. Based on the performance of these test cryostats, the decision was made to go ahead with the construction of the Spider flight cryostat.
The construction of the Spider flight cryostat, by Redstone Aerospace, began in the fall of 2008 and was completed in the summer of 2009.111Redstone Aerospace, Longmont, CO. After preliminary testing at Redstone, the cryostat was transported to Princeton in January 2010 where numerous cryogenic runs were conducted. A description of the cryostat along with an early performance evaluation can be found in [10]. In 2012, the vacuum integrity of the flight cryostat was tested in the Spacecraft Propulsion Research Facility at the NASA Glenn Research Center in Sandusky, Ohio. This allowed us to verify the performance of numerous hermetic seals under flight-like pressure conditions. Integration and testing of the entire balloon payload was performed at CSBF in Palestine, Texas, in the summer of 2013, with the aim of deploying the payload later that year. The shutdown of the United States federal government in the fall of 2013 caused a one-year delay in our Antarctic operations.
The Spider flight cryostat was launched on a long-duration balloon (LDB) from McMurdo station in Antarctica on January 1, 2015. The cryostat ran out of liquid helium 16 days after its last fill. The flight was terminated 16.5 days after launch, as the payload was warming up and beginning to drift out to sea.
2 Design
2.1 Volume, Mass, and General Cryogenic Layout
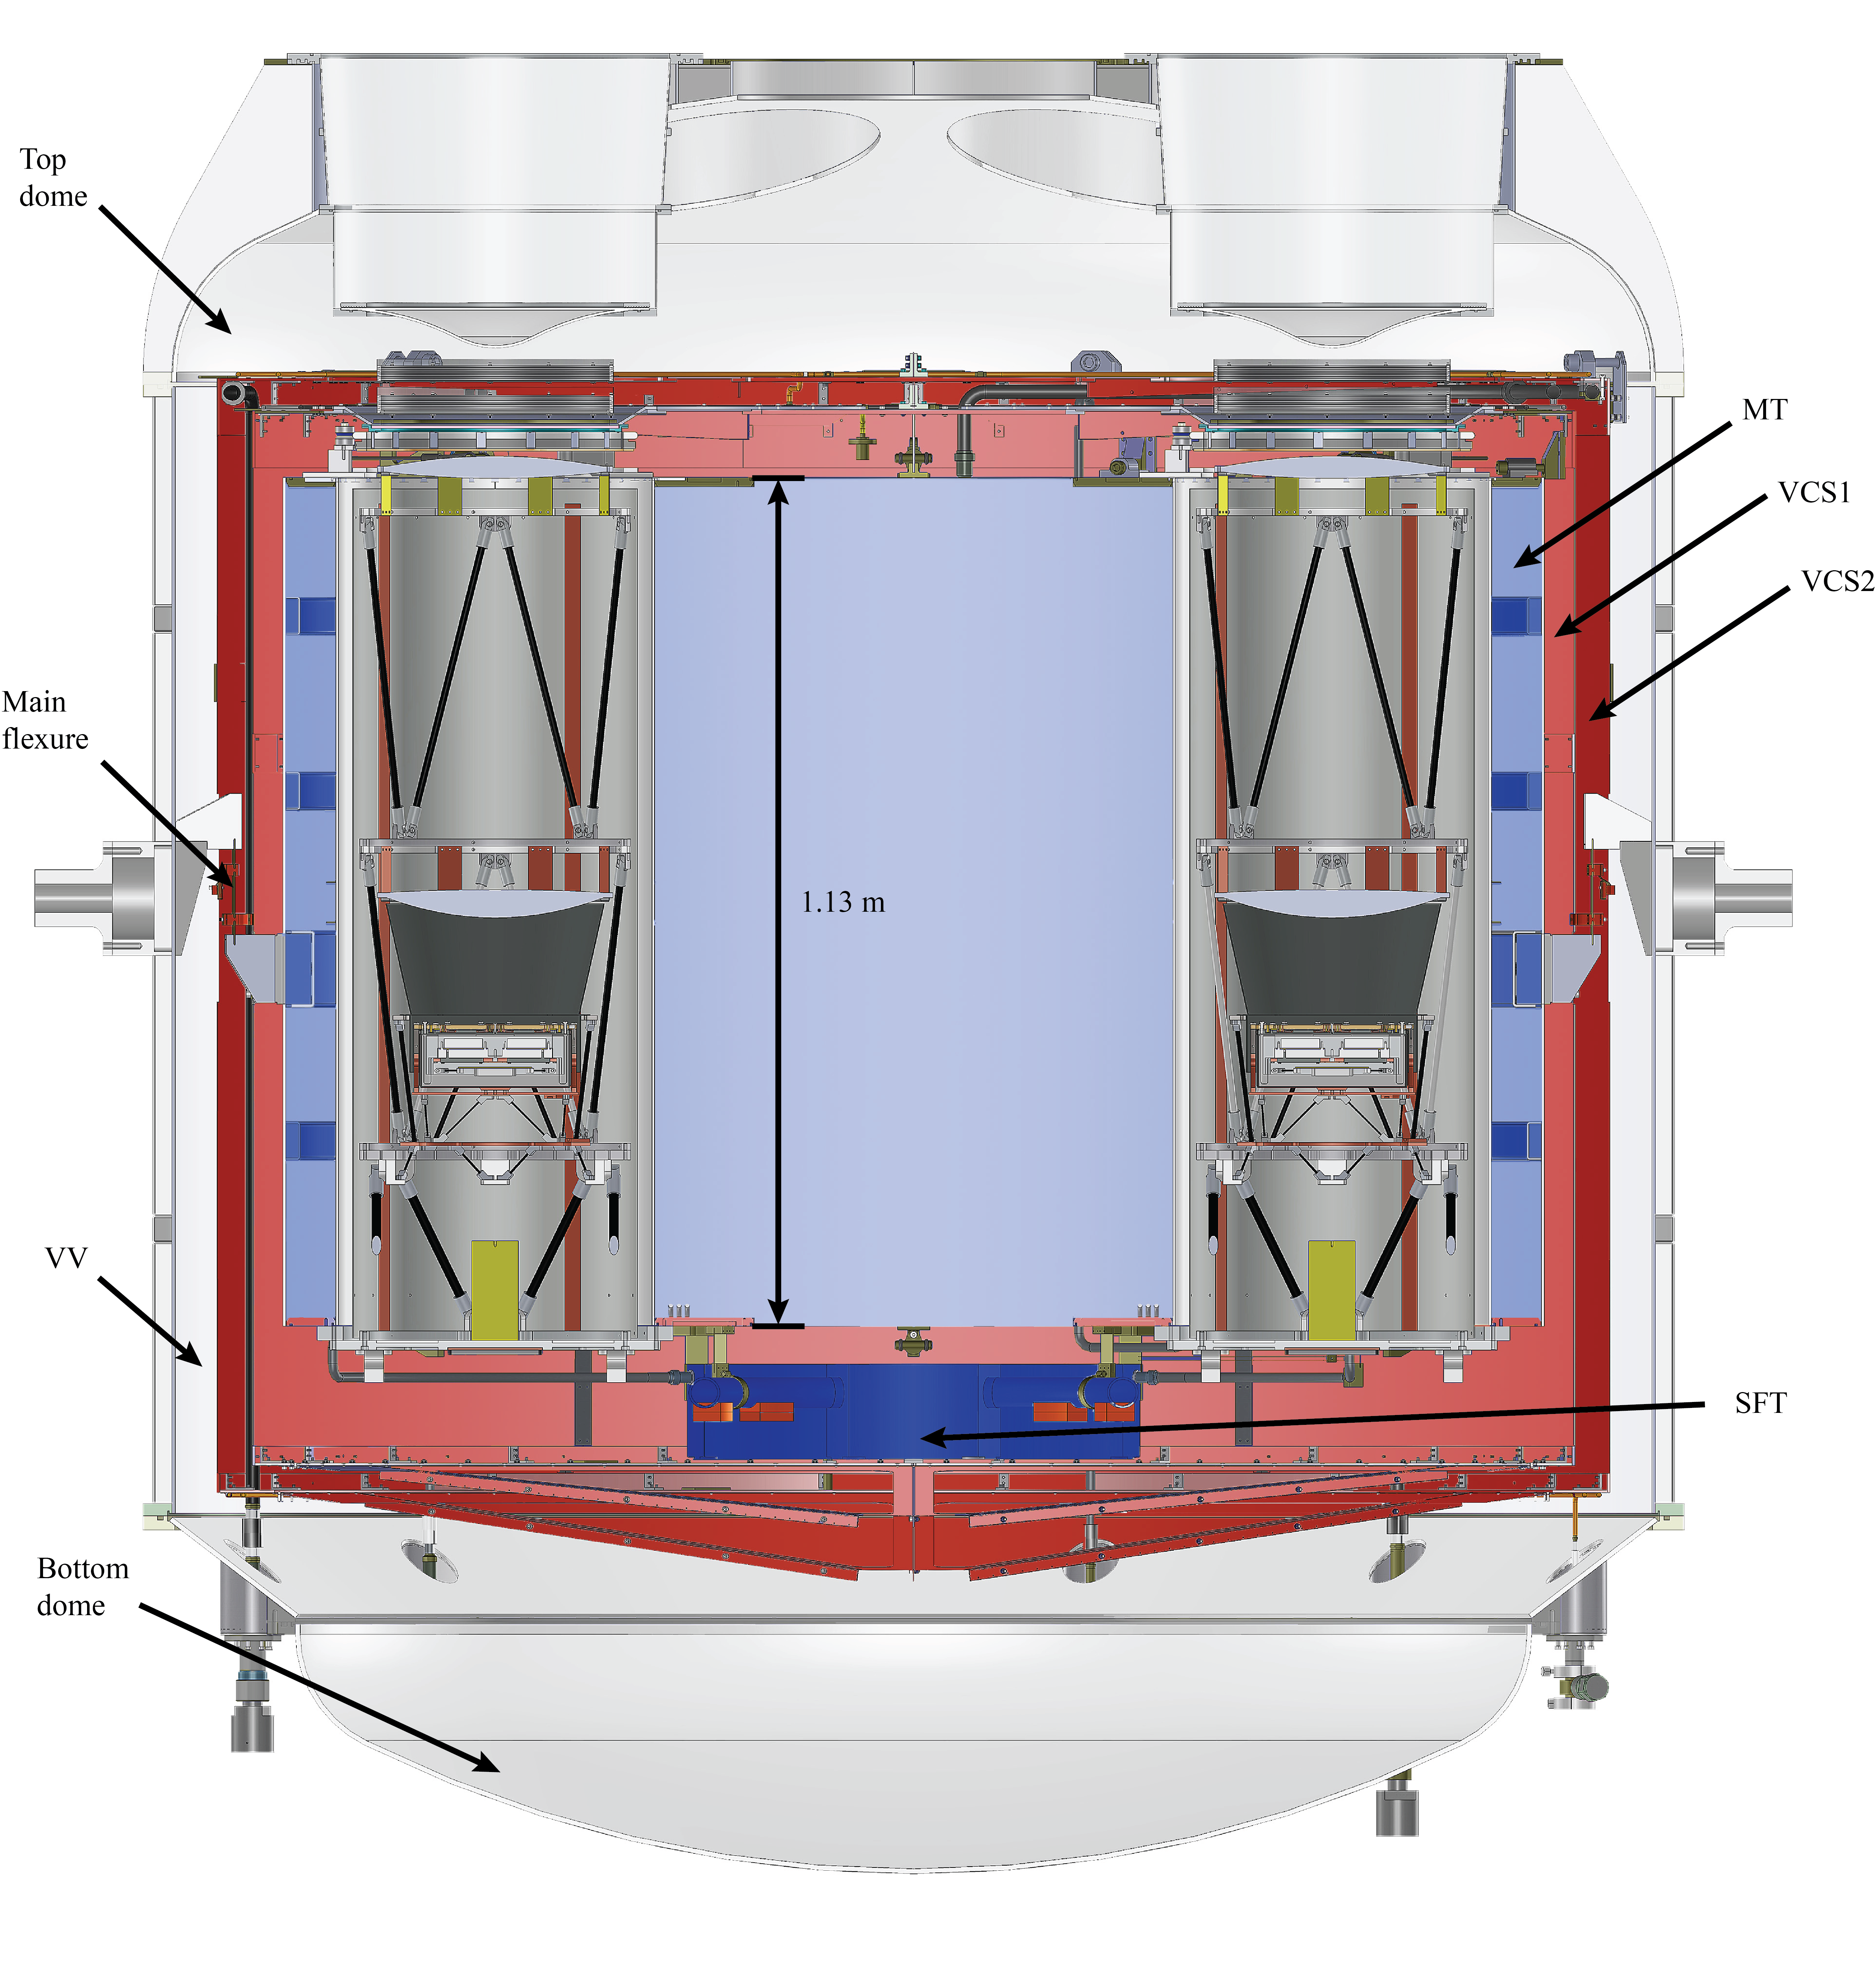
The cylindrical flight cryostat has five main components that are illustrated in Figure 1. Starting from the inside, the components are named: Superfluid Tank (SFT), Main Tank (MT), Vapor Cooled Shields 1 and 2 (VCS1, VCS2), and Vacuum Vessel (VV). The bulk of the cryostat is made of aluminum 1100 (VCS1, VCS2), chosen for its high thermal conductivity, and aluminum 5083 (VV, MT, SFT), that, although a poor thermal conductor, maintains its strength after welding. The cryogenic assembly consists of a 1284 L liquid helium (LHe) main tank, in the shape of a cylinder penetrated completely by seven cylindrical holes. This shape allows each telescope to be surrounded by a uniform 4 K environment. The main tank is connected by a capillary system to a 16 L superfluid tank (see Sections 2.5 and 2.6). The steady state parasitic load of the instruments and open apertures results in a base mass flow rate of helium that obviates the need for a liquid nitrogen guard; the enthalpy of the helium vapor is sufficient to provide the required cooling power above 80 K. VCS1 and VCS2 surround both tanks and serve as radiation shields, while intercepting conduction and accommodating filters, which need to be maintained at low temperatures to reduce in-band parasitics (see Section 2.9).
The lightweight design of the main tank, superfluid tank, and the vacuum vessel, each with an average wall thickness of approximately 4 mm, allows such a large system to be deployed on a long-duration balloon. The whole cryogenic assembly, excluding telescope parts, cryogens, and cabling, weighs 850 kg. In total, the entire Spider payload weighed approximately 2810 kg, not including the support instrumentation package and ballast, both supplied by CSBF.
 |
 |
2.2 Gondola and Sun-Shields
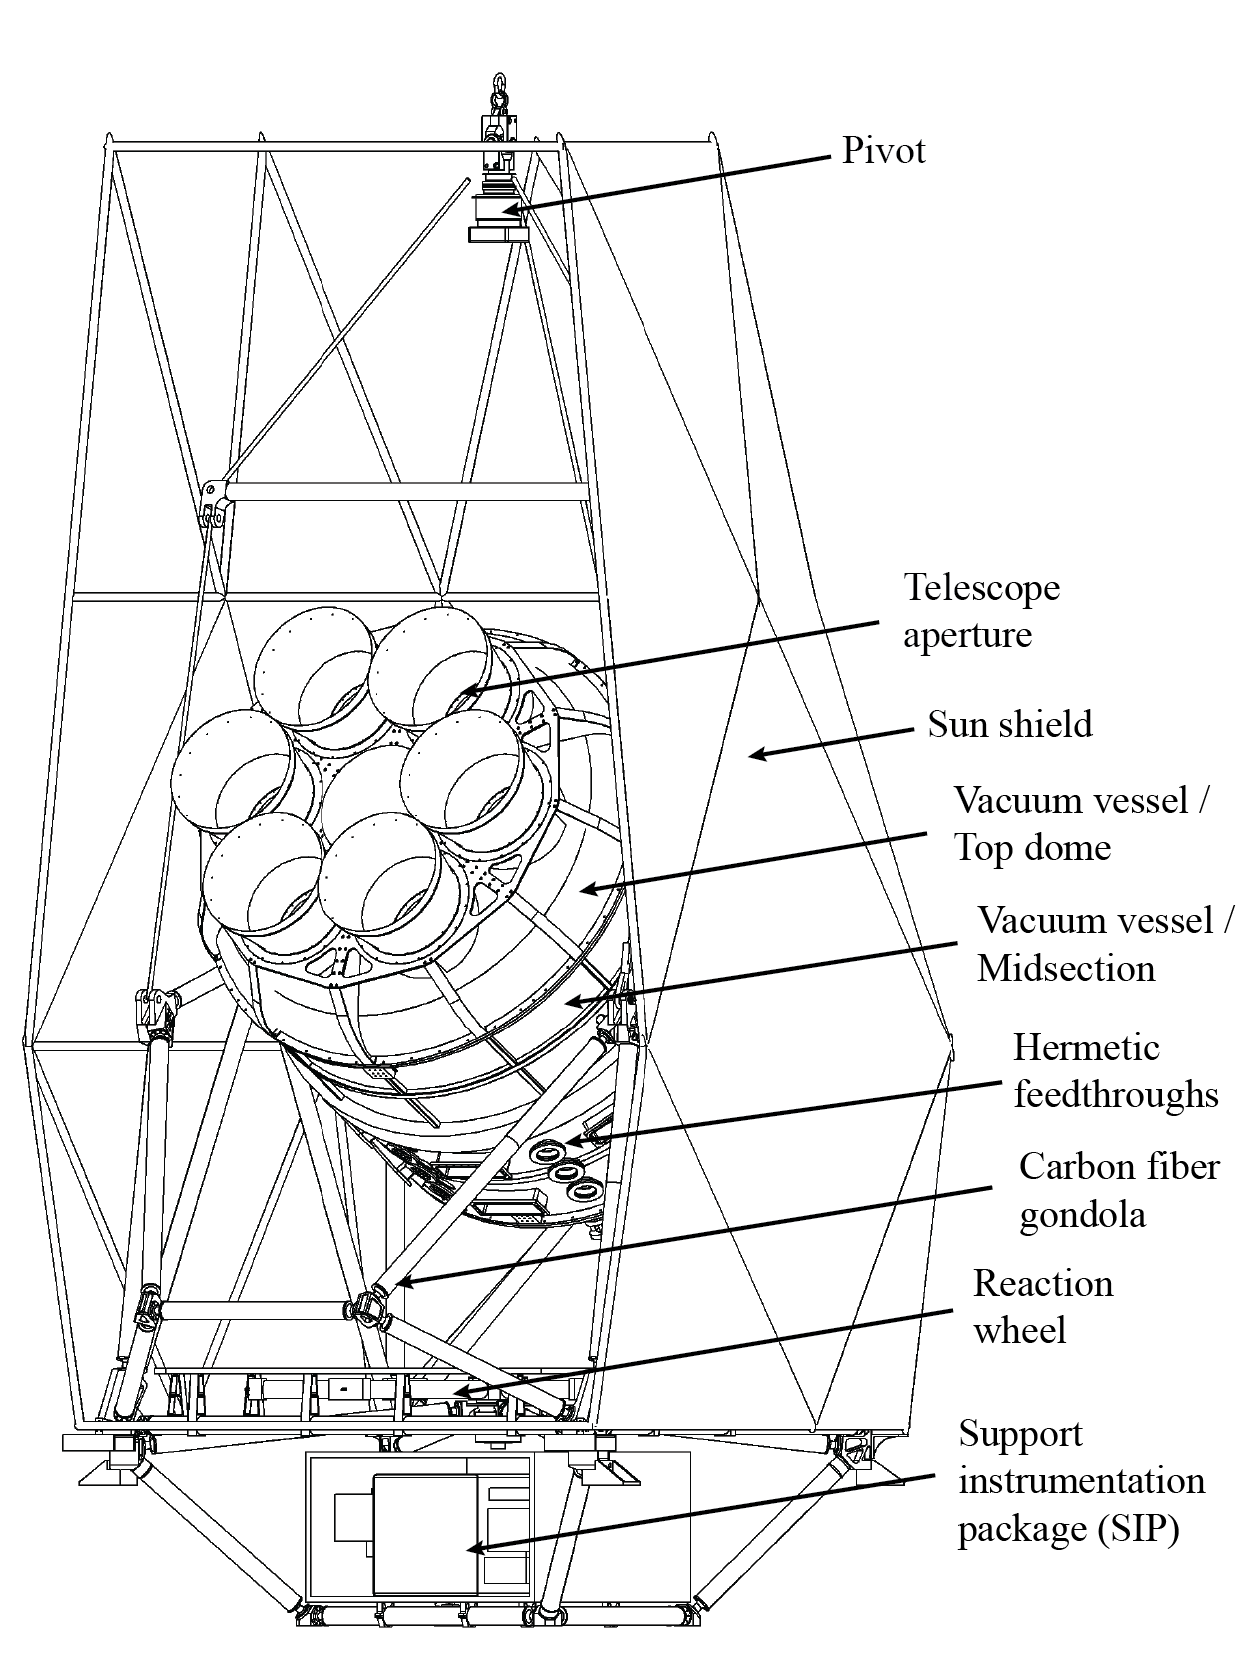
The flight cryostat is mounted on a lightweight gondola structure made of reinforced carbon fiber that houses the drive mechanisms for scanning in both elevation and azimuth (see Figure 2). Aluminum inserts are glued into hollow carbon fiber-reinforced polymer tubes and then bolted into custom-made aluminum joints. The gondola is designed to sustain large angular acceleration from the initial balloon jerk during launch, as well as a maximum 10 vertical acceleration resulting from the parachute shock upon termination [11, 12].
Spider’s sun-shields prevent direct illumination of the telescope baffles by the sun and provide shadowing of the cryostat. The vacuum vessel was painted with white Aero-glaze A276, providing well controlled emissivities at infrared and optical wavelengths.222LORD Corporation, Cary, NC. Radiative modeling of the integrated payload, that included shielding to help thermalize the VV shell, suggested that a 30 K temperature gradient would develop over the surface of the vacuum vessel at altitude, with the equilibrium temperature of the upper dome and vacuum windows expected to approach –20 ∘C. Because of low ambient temperatures, a combination of copper gaskets and EPDM O-rings were used for hermetic connections on the vacuum vessel. Additionally, telescope windows were shock tested with liquid nitrogen to simulate rapid cooling during ascent.
2.3 Radiation Shields, Heat Exchangers, and MLI
Two intermediate vapor cooled radiation shields, VCS1 and VCS2, serve as thermal sinks for Multi-Layer Insulation (MLI), cabling, and infrared blocking filters. These nested shields are mechanically supported from the main tank and vacuum vessel, respectively. Six compact heat exchangers are symmetrically placed on the top sides of both VCS1 and VCS2. Helium vapor is routed through these flow-restrictive heat exchangers, cooling the respective stages, and thus providing negative thermal feedback [13, 14]. The heat exchangers are made of stainless steel blocks enclosing densely packed copper mesh (VCS1) or pellets (VCS2).
Thermal radiative loading on the MT is reduced by the VCSs and MLI. The MLI is a layer construction of 6.4 thick thermoplastic polymer (Mylar) coated with highly reflective, thick, aluminum layer separated by 0.1 mm thick spun bound polyester sheets.333CAD Cut, Middlesex, VT. The compression of the MLI was optimized for minimum pump down time and maximum radiative shielding between the VV and VCS2 and between VCS2 and VCS1. For both, the value is 14 layers/cm, resulting in 52 and 16 layers of MLI between the VV and VCS2 and between VCS2 and VCS1, respectively.
2.4 Flexures, Plumbing, and Thermal Connections
The main tank is supported by the vacuum vessel through six G–10/aluminum flexures symmetrically placed around the cylinder sides (see Figure 3). G–10 is a high yield strength, low thermal conductivity fiberglass commonly used for cryogenic flexures [15]. The flexures are attached with copper straps to VCS1 and VCS2 to minimize conducted heat flow to the MT [10].
Plumbing lines are made of type 304 stainless steel, due to its low thermal conductivity and suitability for welding. There are five plumbing lines leading from the outside of the VV to either the MT or the SFT. These are: the MT fill and vent lines, which have a inch outer diameter (OD); the SFT fill and vent lines, which have a inch OD; and the VCS vent line, which has a inch OD. All plumbing lines have a 0.010 inch wall thickness. Note that the VCS line represents a high flow-impedance connection from the MT to the outside.
Vent lines are positioned on the cryogenic tanks such that vapor can exit the cryostat when it is tilted through a 22–49 deg elevation range while full of liquid. All plumbing lines (excluding the VCS vent line itself) are heat sunk at VCS2, but not at VCS1, to prevent thermal shorts between the two shields. Aluminum-to-stainless steel transitions are made where needed from explosion-bonded blocks that are welded in place. During flight, the MT fill and vent lines are sealed so that all of the helium vapor from the MT is routed through the VCS heat exchangers. The length of the MT/SFT vent and fill lines is approximately 2.7 m, while the average travel of gas through the VCS vent line system is about 12 m. When cooled to 4 K and at equilibrium, we find that approximately 50 torr of differential pressure between the main tank and the VCS outlet will maintain 20 SLPM of flow.
In flight the MT must be maintained at a pressure near one atmosphere so that it does not rapidly evaporate to reach ambient pressure (as the SFT does). A set of Tavco absolute pressure flow regulators are mounted to the main tank and VCS vent lines to regulate this pressure and prevent any back flow (see Section 4.1).444Tavco, Inc., Chatsworth, CA, e-mail: tavcoinc@aol.com, fax: +1–818–998–8391.
2.5 Superfluid Tank
The SFT is pumped to the ambient pressure of float altitude, approximately 36 km. This maintains the SFT at about 1.6 K.
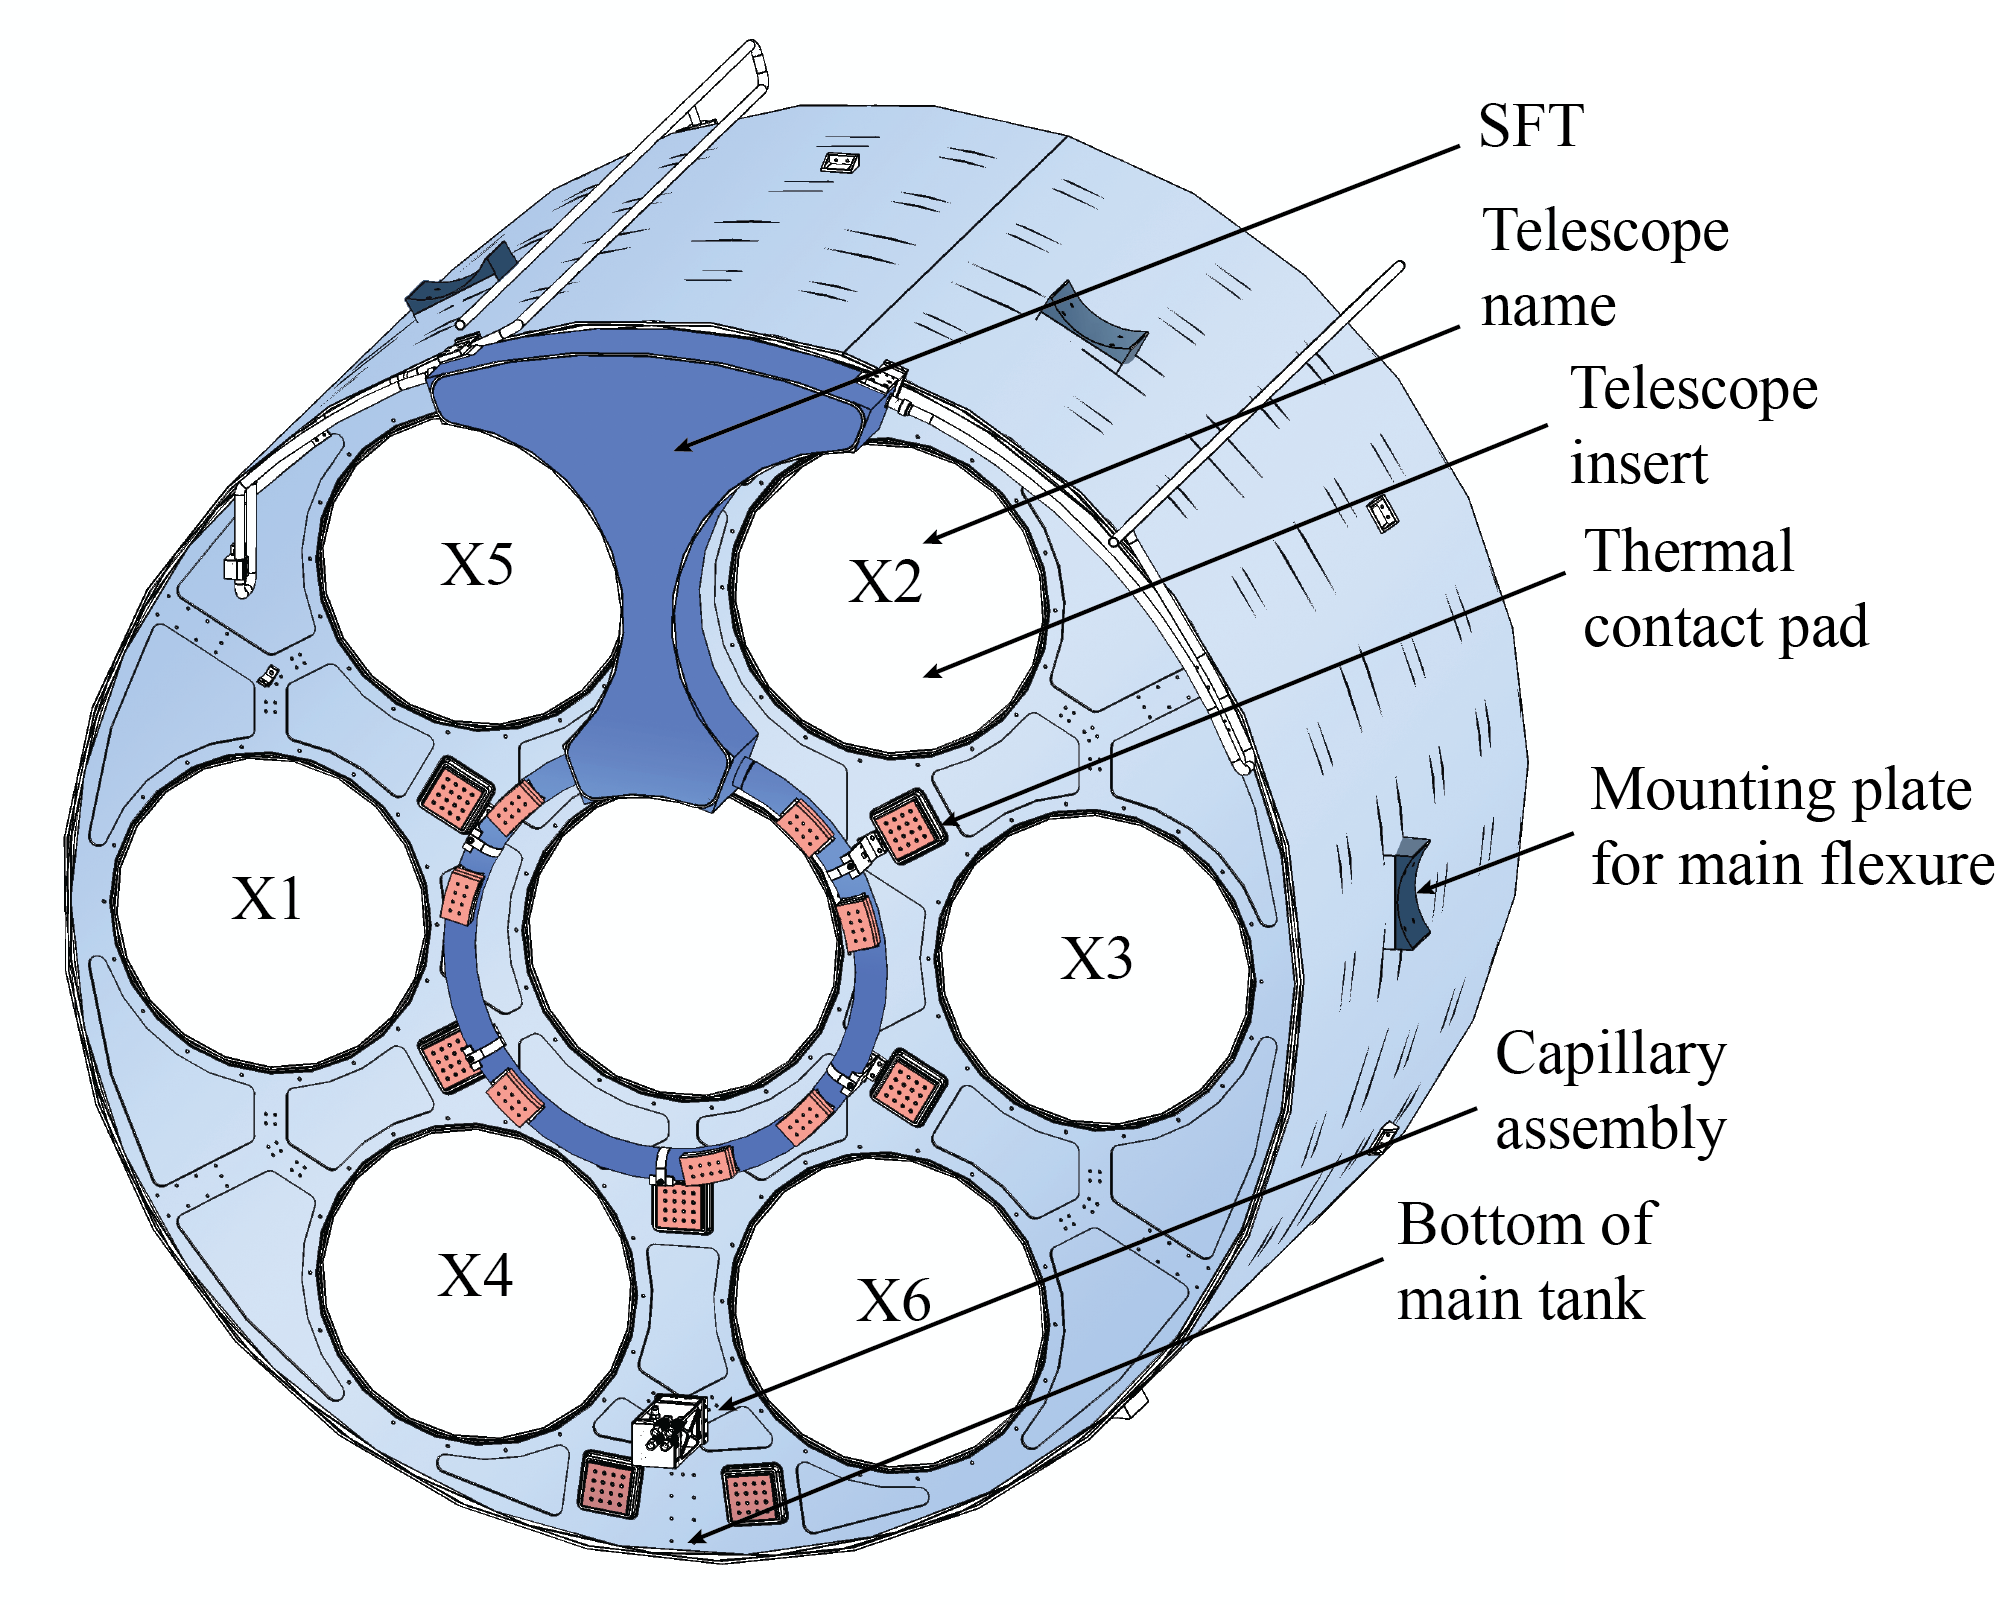
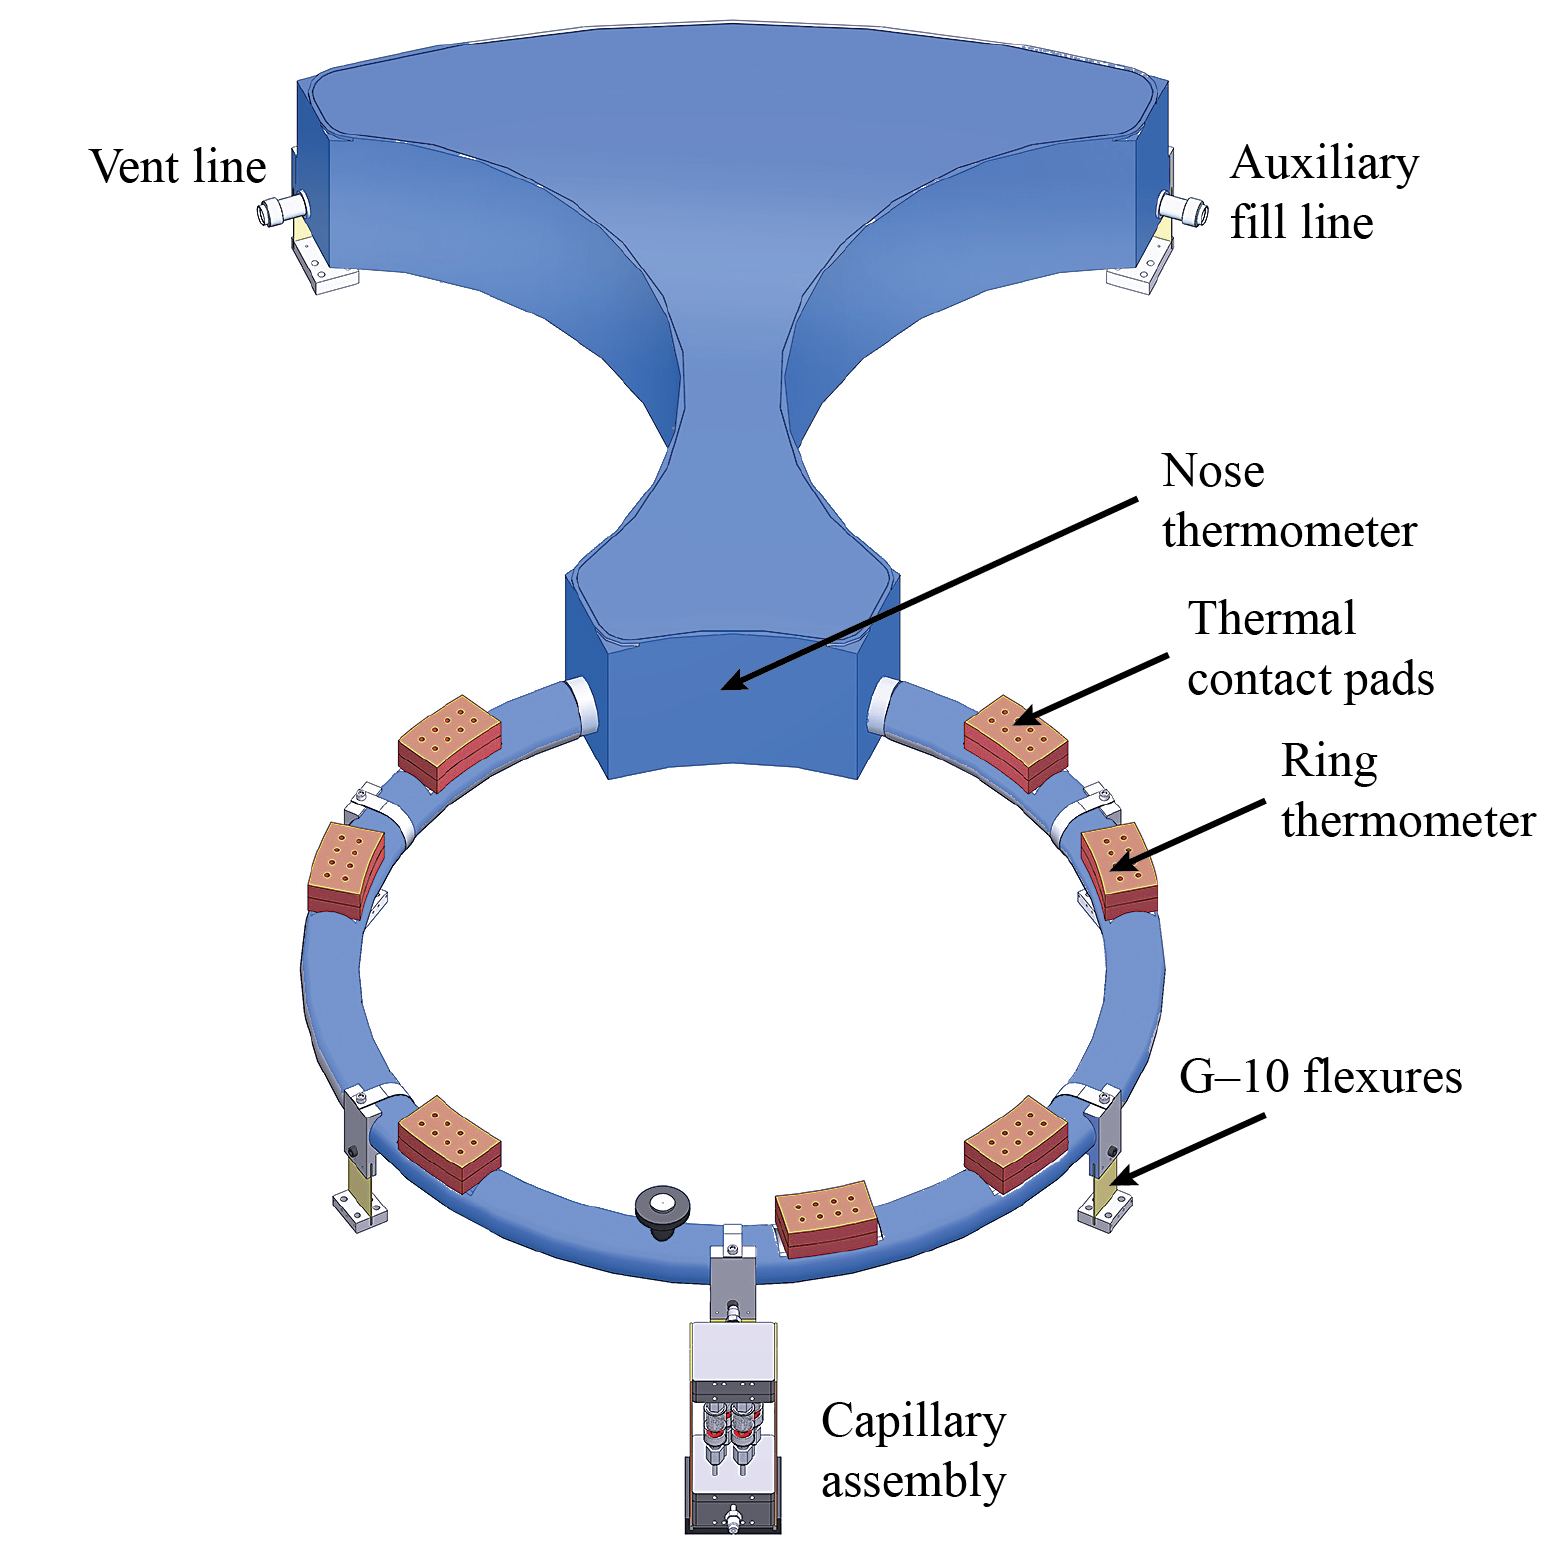
Two major requirements motivate the design of the SFT. The first is conductance: the thermal link between the six science instruments and the SFT must be strong enough to maintain a small temperature gradient when cycling the closed-cycle refrigerators, which results in a 5 mW transient load (per refrigerator) on the 1.6 K cooling stage during this period. Due to the extremely high thermal conductivity of superfluid (ten times that of high-purity copper at the same temperature), the least-mass solution is to use the superfluid itself as the thermal link. Secondly, the instruments must remain in good contact with the superfluid while Spider scans between 22–49 degrees of elevation, such that the liquid level does not lie in the plane defined by the bottom of the main tank. Together, these requirements motivate the unusual design shown in Figure 3. A superfluid-filled ring connects to the capillary system and provides excellent thermal conductance to the receivers. The superfluid surface lies in the larger “nose” tank at the top of the assembly, ensuring that the ring remains full over the full range of elevation angles. The instruments are cooled via a series of thermal contact pads around the circumference of the ring.
Some care is needed to make an effective thermal connection between the inserts and the superfluid. Due to the superfluid’s high conductivity, the thermal impedance between bath and instruments is dominated by Kapitza boundary resistance. To reduce this liquid-to-metal boundary resistance, explosion-bonded aluminum-to-copper transition plates are used to provide thermal contact areas on both the MT and the SFT.555High Energy Metals, Inc., Sequim, WA. Areas of the aluminum are milled out such that the copper is in direct contact with the liquid cryogen. The transition plates are connected to custom-made copper heat straps which are fabricated by folding 0.005 inch thick high purity copper shim into an 18 layer, 2 inch wide flexible assembly. At an average length of 15 inches, we estimate that the straps conduct approximately 200 mW/K, and find that they supply necessary cooling power to both the 4 K telescope and sub-kelvin cooling stages. The MT thermal contact areas can also be seen in Figure 3.
2.6 Capillary Assembly
The Spider capillary system provides continuous flow of from the main tank to the superfluid tank (see Figure 4). The capillaries are critical for a successful flight because the hold time of the superfluid tank, when fully charged, is only 4 days, compared to the targeted 20 day flight duration. The capillaries provide the superfluid tank with liquid helium as long as there is liquid in the main tank.
 |
The following list describes the main design criteria for the Spider capillary assembly:
-
1.
Continuous cooling power of approximately 60 mW to counter the steady state loading to the superfluid tank.
-
2.
Base temperature of at most 1.8 K for effective cycling of the six adsorption refrigerators that supply cooling power to the focal planes.
-
3.
No mechanical valves or other moving parts.
-
4.
Robust operations for at least 50 days to accommodate cooldown, characterization, and flight.
The general design principles of the capillary system are based on DeLong et al. [8], wherein they describe a two stage cryogenic system for a dilution refrigerator. Similar designs are described in various publications [16, 17, 18, 19].
The steady state loading on the superfluid volume shown in Figure 4 has been measured during flight-like conditions. This measurement, made with the superfluid volume empty and disconnected from the capillary assembly, suggested a steady state loading of 40 mW. This measurement is consistent with the measured hold time of the superfluid tank before the capillaries were installed. Implementing a 1.5 safety factor we conclude that the capillary assembly must provide at least 60 mW of continuous cooling power to the superfluid tank.
Cycling the adsorption refrigerators creates an approximate 5 mW transient loading on the superfluid tank that lasts for an hour. The superfluid tank must sustain transients from cycling all six refrigerators every 24 hours.
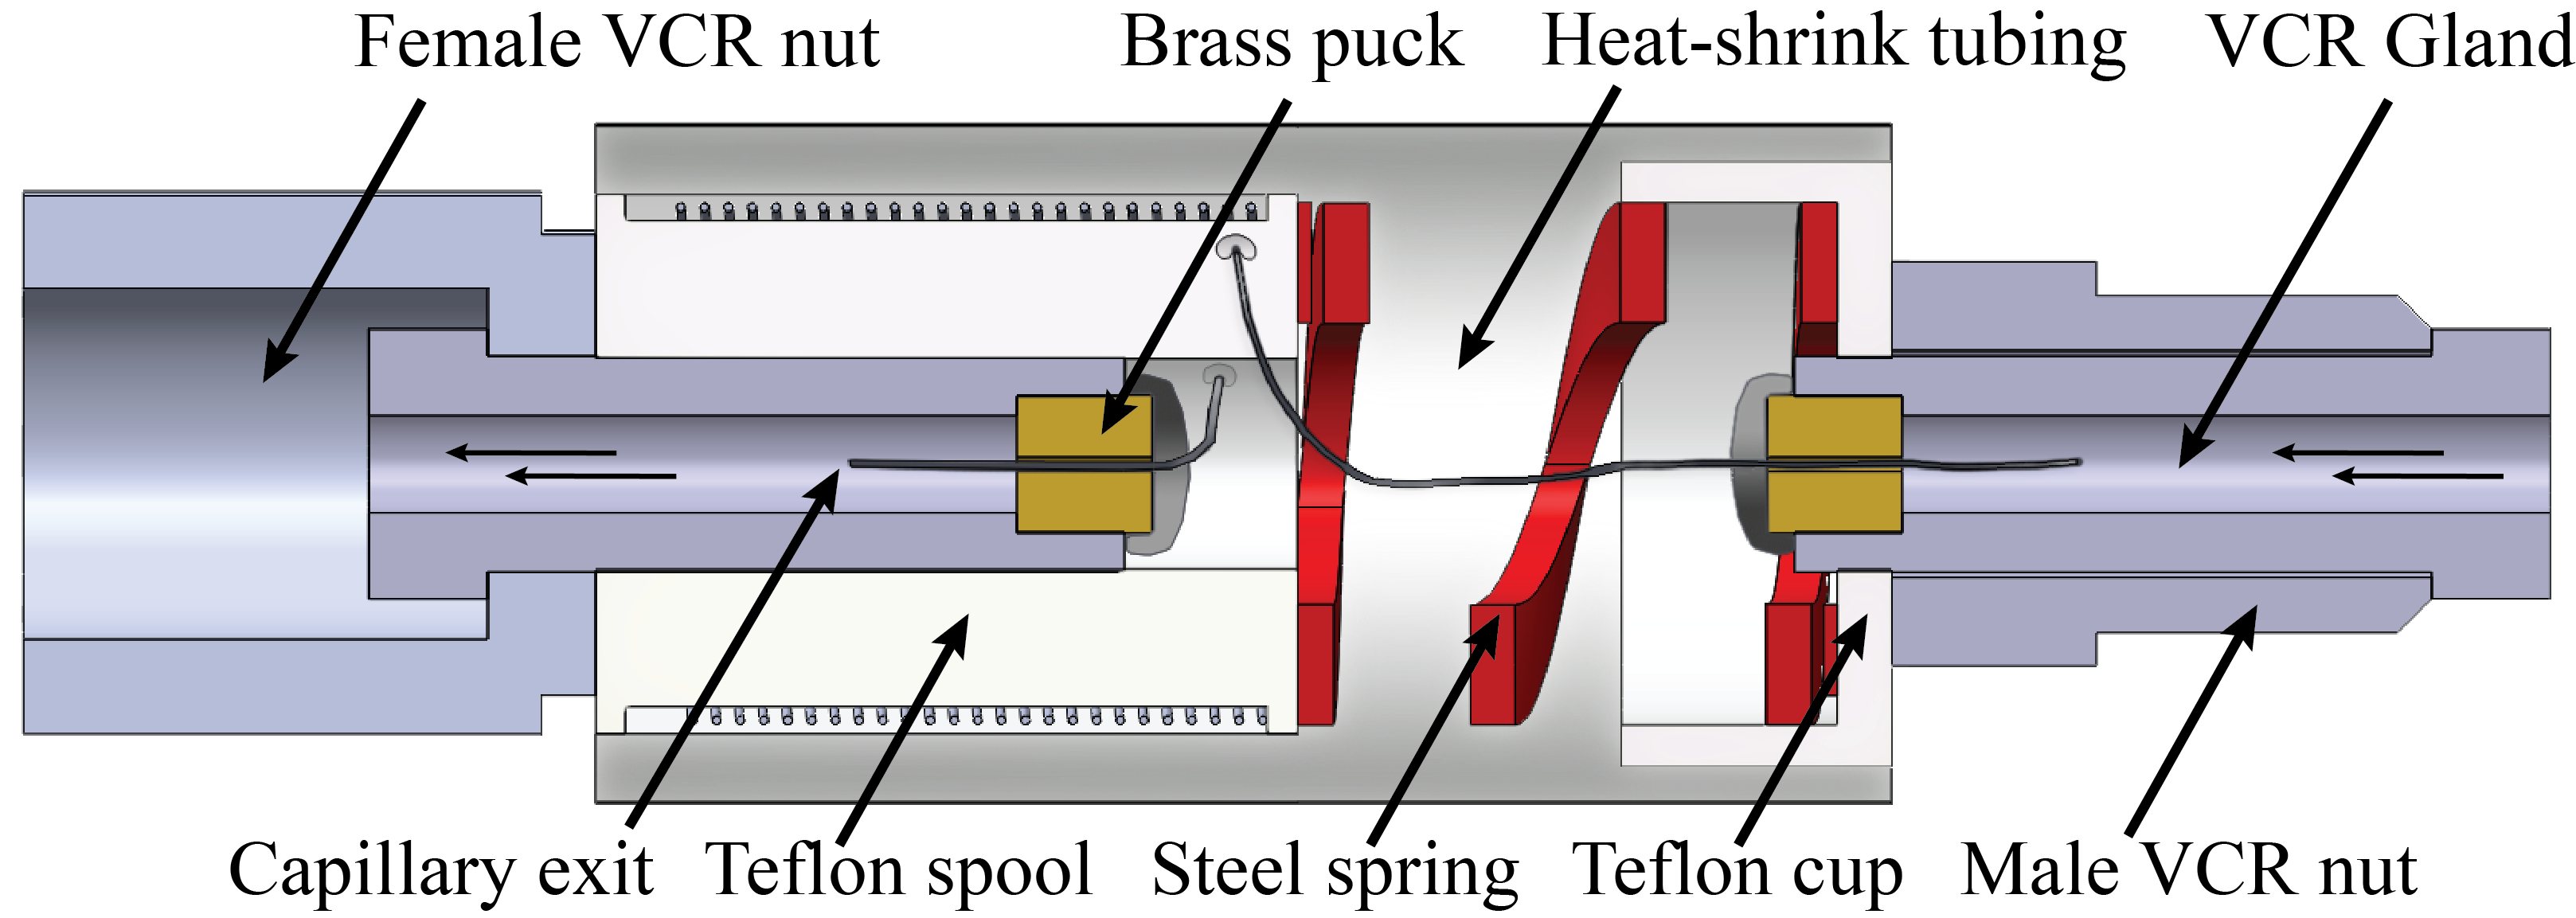
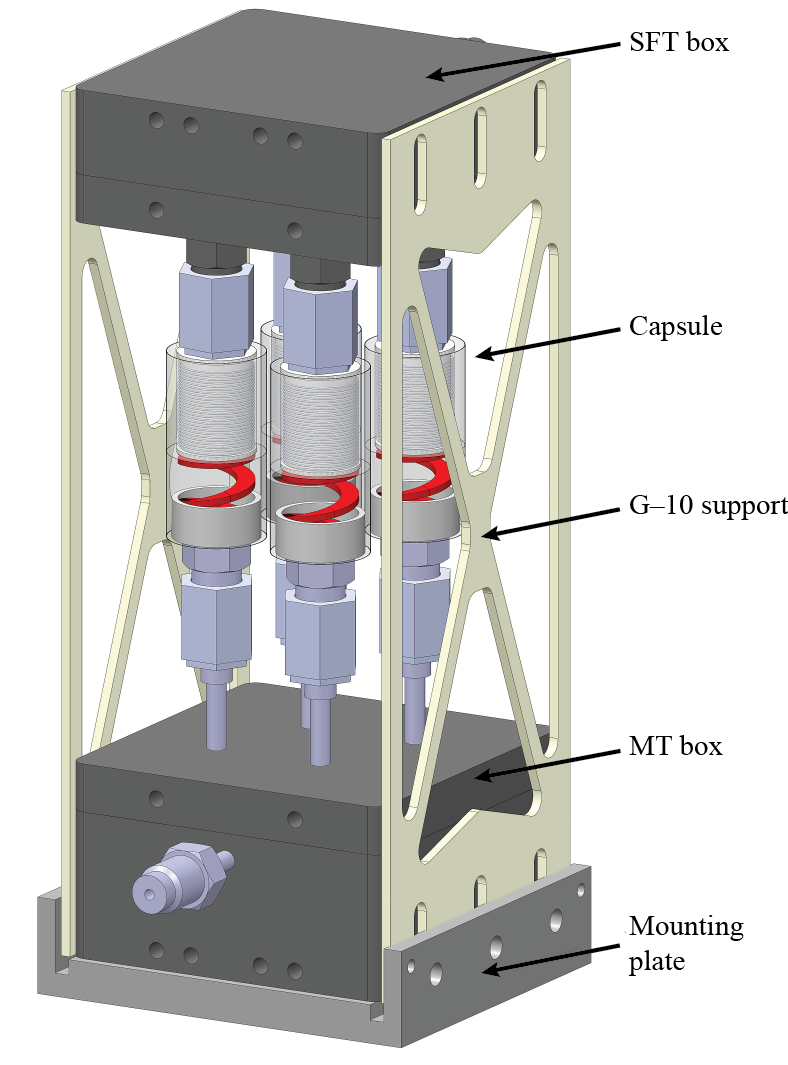
The Spider capillary system achieves this using three 35 cm long capillaries wrapped around Teflon spools and silver soldered into 1/8 inch Swagelok glands with gender preserving VCR fittings (see Figures 5 and 6).666Swagelok, Solon, OH. Note that Figure 5 shows an assembly that is able to support four capillaries; the fourth capillary was removed and replaced with caps to reduce loading of the main tank. Having 3–4 capillaries reduces susceptibility to constrictions from potential ice slush in the main tank. Failure of one capillary, most likely due to an ice plug, should not reduce the performance of the superfluid tank if safety factors are chosen appropriately. The capillaries couple two 50 mL volumes that are connected to the main tank and the superfluid tank through 1/8 inch bellows tubing. The capillary material is extruded SS 304 with a 0.0035 inch inner diameter and a 0.0025 inch wall thickness.777Capillaries provided by Eagle Stainless, Warminster, PA. The dimensions were chosen to resemble one of the assemblies described in [8].
Small, custom-made, brass pucks with 0.009 inch diameter center-drilled holes are made to fit snugly into the Swagelok glands. A capillary is threaded through one of the pucks before solder is allowed to flow into gaps that exist between the gland, puck, and capillary. The capillaries are then wrapped around hollow Teflon spools and subsequently routed back into the center of the spools and through stainless steel compression springs that provide structural support to the whole assembly while keeping heat conduction at a minimum. As the capillaries are internal to the springs, there is little chance that spring compression can pinch the capillaries. The springs allow us to gently modify the overall length of the assembly to fit perfectly between the two glands that are welded to each of the small boxes while conducting negligible heat between the two temperature stages. Transparent heat-shrink tubing helps align the Teflon components with the two ends of the VCR fittings and provides structural rigidity. Together, the capillaries along with VCR fittings, Teflon components, and springs, are referred to as capsules. Figure 6 shows a cross section of an individual capsule.
Stainless steel Mott filters are spot welded to the inside of the MT box so as to intercept large particles before they enter the capillaries.888Filters purchased from Mott Corporation, Farmington, CT. We use media grade 20 filters. If correctly installed, the particle capture efficiency of these filters is such that they collect 99.9% of particles whose diameter is larger than 20% of the capillary diameter. This should allow for effective operations of the capillaries without contributing significantly to the overall flow impedance of the system.
Measurements show that the capillary assembly provides approximately 100 mW of cooling power to a superfluid volume while conducting only 2 mW between the two temperature stages. This corresponds to an equilibrium flow through the capillaries of about SLPM.999 SLPM stands for Standard Liter Per Minute, where standard refers to 273.15 K temperature and 1 atm pressure. For , we find that 2.00 SLPM corresponds to 5.87 mg/s. By boiling off the SFT and measuring the flow rate we estimate an equilibrium superfluid liquid volume of approximately 2.0 L, only 1/8 of the total volume of the SFT. This value is mainly determined by the geometry and capillary flow rates.
The net cooling power can be changed by simply altering the length of the capillaries in a way that does not require any other changes to the design. With a collection of interchangeable capsules having different flow impedances we can quickly arrive at an optimal cooling power.
2.7 Telescope Architecture and Adsorption Refrigerators
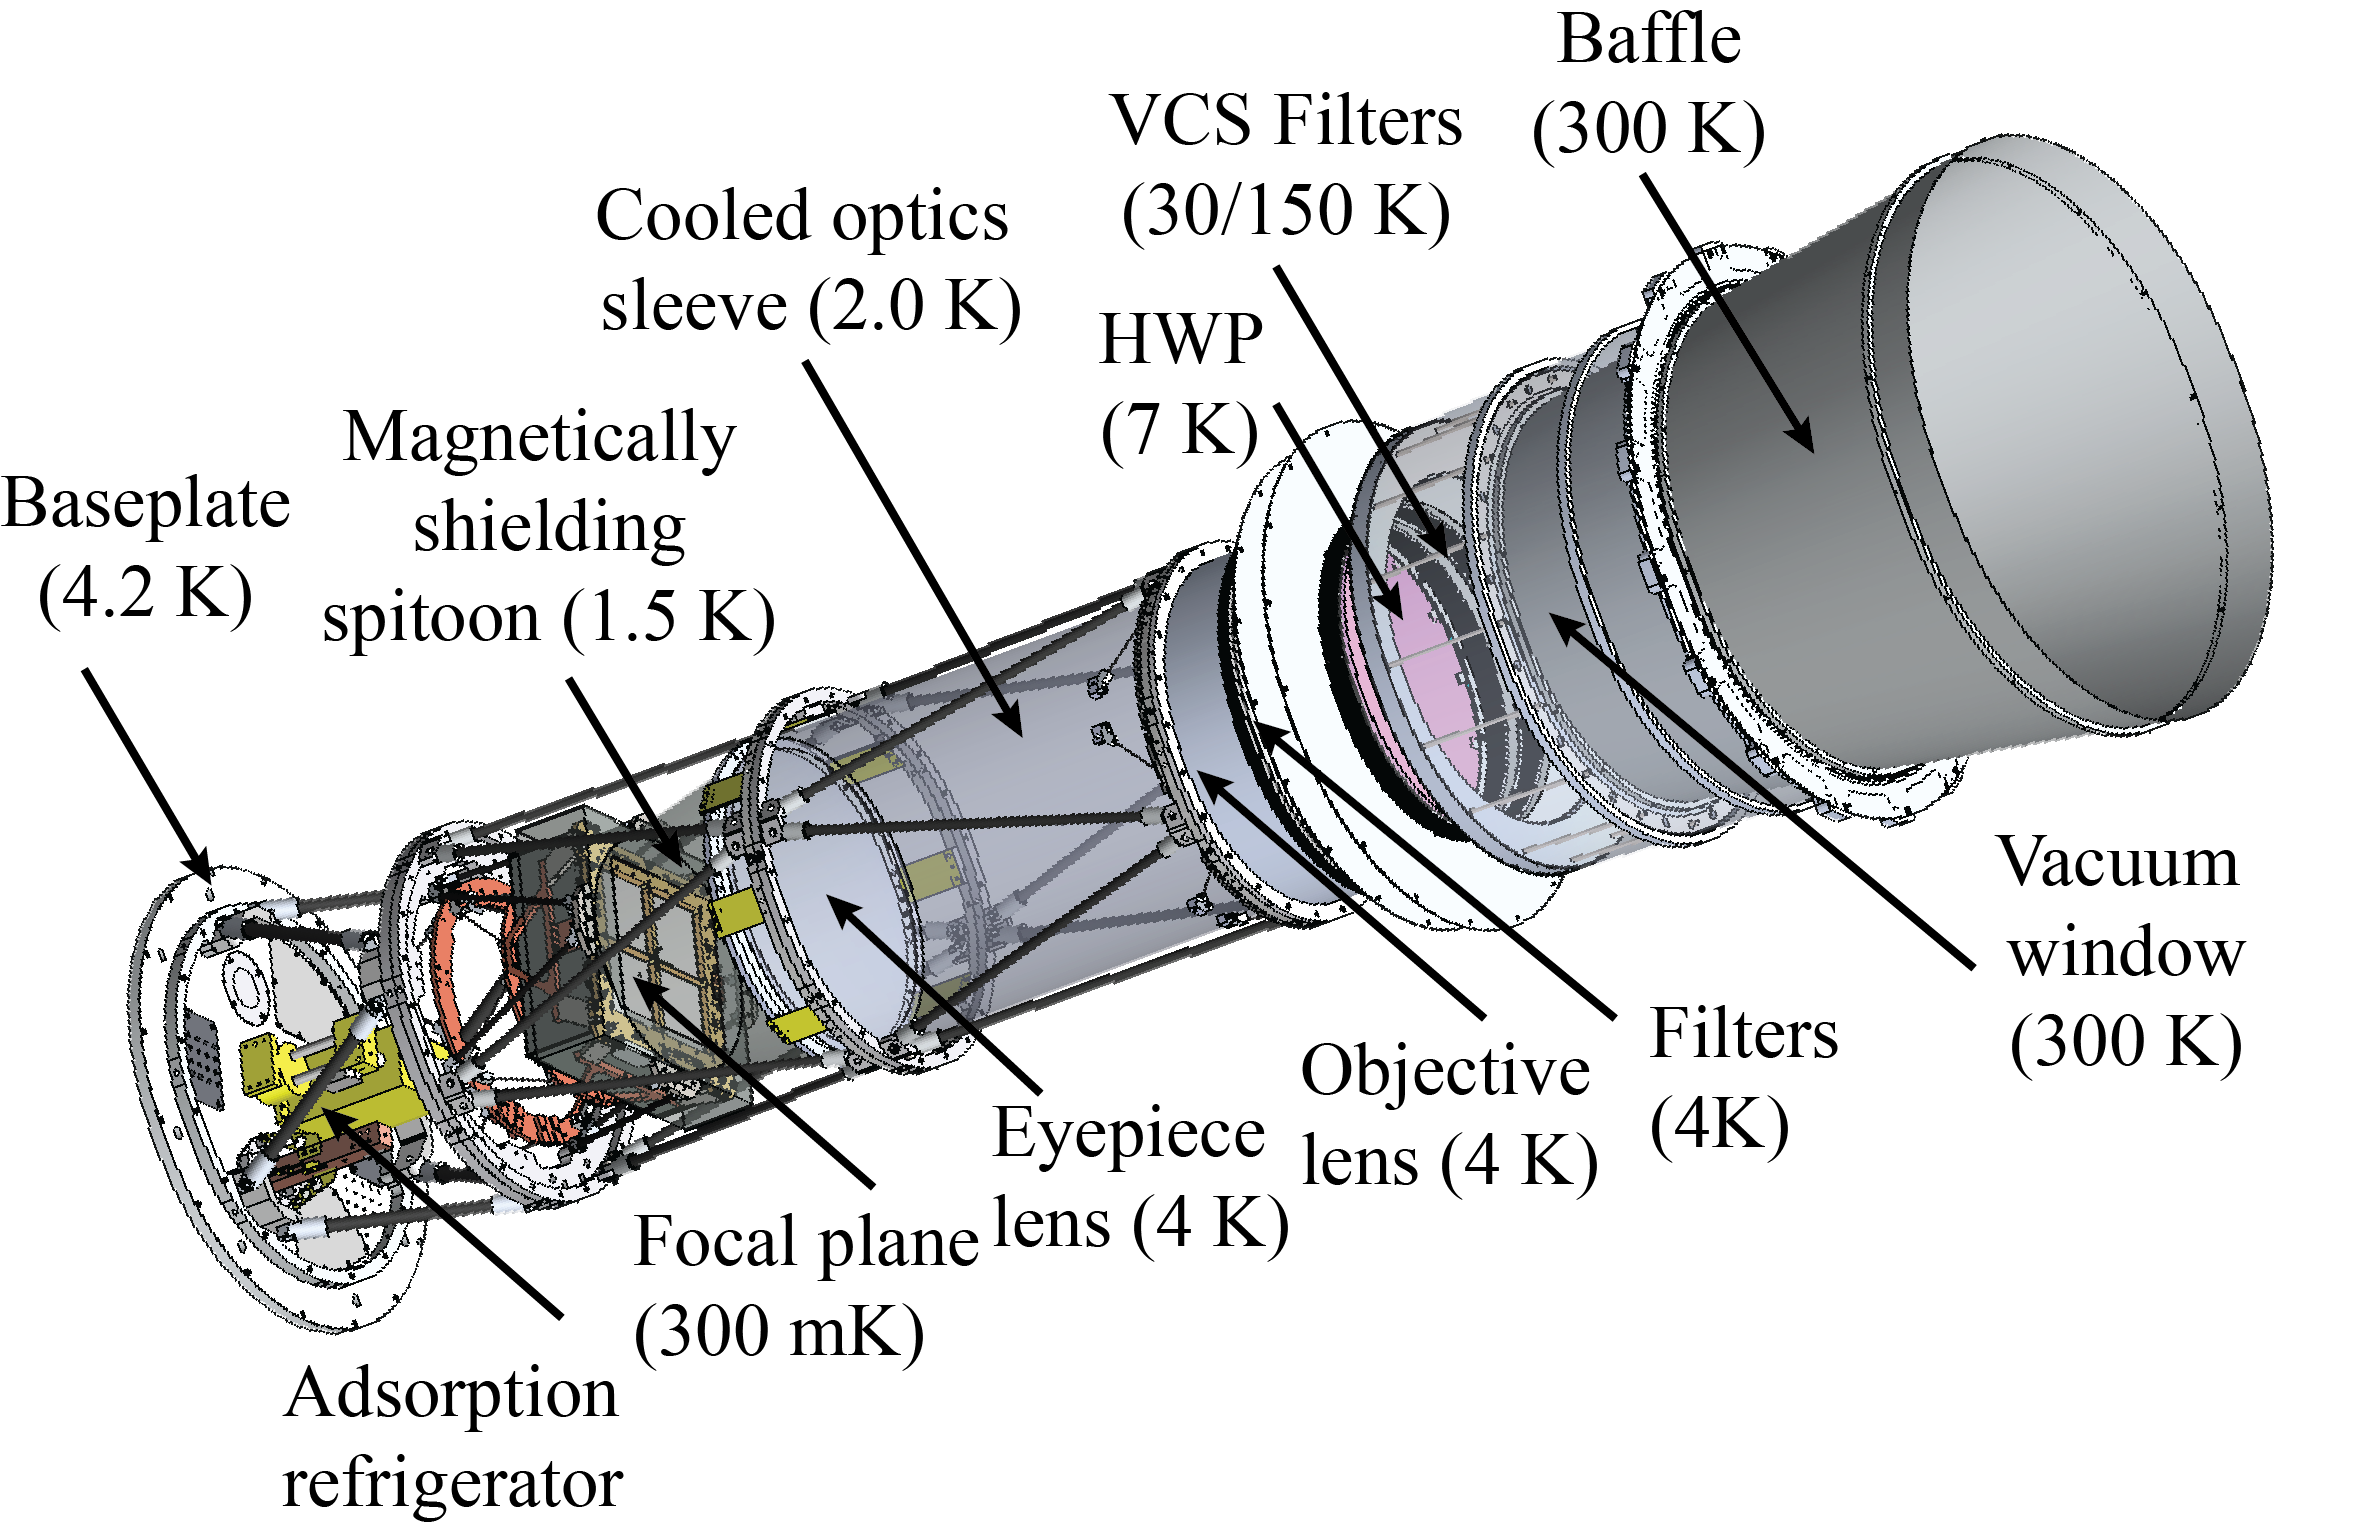
The Spider telescopes are based on an optical design that is similar to that of the BICEP1 telescope (see Figure 7) [20, 21]. Because of the small aperture, the entire optics assembly can be cooled to 4 K, up to and including the cryogenic waveplate mounted in front of the objective lens (see Section 2.8). A set of filters are mounted on both vapor cooled shields (see Section 2.9) and a 1/8 inch thick, mm-wavelength transparent, ultra-high-molecular-weight polyethylene window is mounted in front of the optics in a reentrant window bucket that is bolted to the top dome of the vacuum vessel. The six telescopes that flew on Spider’s 2015 flight are referred to as X1–X6.
The telescope frame is constructed from carbon fiber structural members epoxied into aluminum fixtures and mounted to four aluminum rings. These four rings are connected to the baseplate, focal plane, eyepiece lens, and objective lens, respectively. The carbon fiber provides a conductive and lightweight structure with outstanding rigidity. At the telescope operating temperatures (0.3–4 K), the carbon fiber supports have a relatively high ratio of elastic modulus to thermal conductivity (approx. 10 MPa-K-m/W at 2 K) when compared to other polymeric and composite structures, including G–10 [15]. Carbon fiber, however, can not be used for the structural flexures supporting the main tank, as the thermal conductivity of carbon fiber becomes exceedingly large at temperatures above 4 K. For example, the ratio of carbon fiber to G–10 thermal conductivity is approximately 2 and 300 at 20 and 100 K, respectively.
A flexible copper shim heat strap is routed internally to the telescope, creating a thermal link between the focal plane and the still of the adsorption refrigerator that is mounted to the baseplate. This heat strap ensures that the focal plane is cooled to 300 mK. Another heat strap connects the superfluid temperature stage to the magnetically shielding spittoon and a cooled optics sleeve located between the two lenses. A third copper strap provides a robust 4 K connection from the baseplate to the two lenses. During flight, the temperature of the objective lenses was measured to be 0.5–1.0 K above the temperature of the baseplates.
The telescopes use high magnetic permeability materials to reduce susceptibility to magnetic disturbances. Informed by finite element modeling, the focal plane, as well as the SQUID readout system are surrounded by a 1.6 K spittoon made of Amumetal 4K (A4K), a proprietary nickel and iron alloy.101010Amuneal Manufacturing Corp., Philadelphia, PA. The SQUID mux chips are further shielded by a combination of superconducting niobium backshort, a superconducting niobium enclosure, and A4K sleeves [22, 23]. Finally, the telescope tubes are surrounded by a two-layer concentric A4K or Cryoperm 10 magnetic shield assembly which are expected to equilibrate at approximately 5 K.111111Cryoperm 10 was superseded by A4K during the fabrication process.
Heat straps connect the superfluid tank to each of the telescope tubes, providing a base temperature for the 10 STPL closed-cycle adsorption refrigerators that cool each focal plane.121212STPL stands for Standard Temperature and Pressure Liter.,131313Refrigerators supplied by Chase Research Cryogenics, Sheffield, U.K. Of order 10 g of activated charcoal are installed inside the pump of a single refrigerator. When cooled to 4 K, this charcoal is capable of adsorbing all gaseous in the refrigerator. The adsorption refrigerator is equipped with a helium gas-gap heat switch which can thermally link the pump to the 4 K base temperature of the main tank. With the heat switch open, and with the charcoal pump maintained at approx. 35 K, any gas in the refrigerator will cool, condense, and eventually fall into a small reservoir, located below the condensation point, which is maintained near 1.6 K by the SFT. The heat switch is closed 30–45 min after the charcoal pump has been heated. This ensures that all 10 STPL are gaseous at the time when liquefaction begins. As the pump cools, gas above the liquid bath will begin to adsorb again, causing a reduction in the vapor pressure of the bath and, therefore, the temperature of the still [24, 25]. A successful fridge cycle results in a 300 mK still temperature with hold times of 3–4 days, although we choose to cycle our fridges more frequently than that (see Sections 3.2 and 4.2).
2.8 Cryogenic Half-Wave Plate
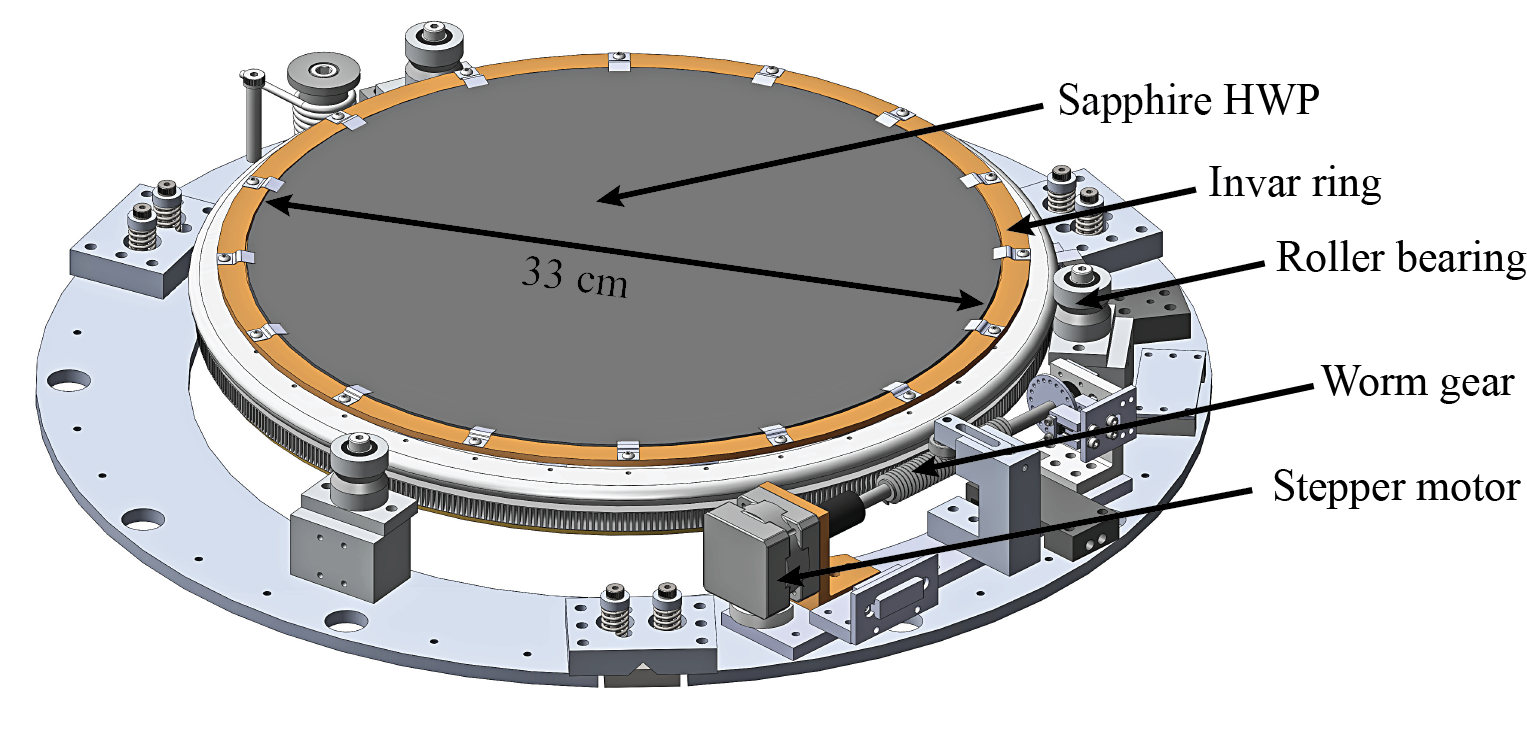
Spider uses birefringent sapphire half-wave plates (HWP) to modulate polarization on the sky [26]. This modulation, together with sky rotation, differentiates a polarization signal from the sky from spurious instrumental polarization produced below the HWP. Each Spider half-wave plate is mounted on a gold-plated Invar ring with compression clips holding the sapphire in place (see Figure 8).
A slightly customized cryogenic stepper motor (Mycom PS445-01A) spins a worm-gear that couples to teeth on the plate assembly with steady rotation facilitated by three roller bearings that are distributed evenly around the plate.141414Mycom Technology, www.mycom.com.sg Quadrature optical encoders read out the angular orientation of the sapphire plate. The half-wave plates are mounted on top of the main tank, right in front of the objective lens (see Figure 7). Measurements suggest bearing and motors equilibrate at around 7 K, but the weak thermal link between the plate and the bearings, and therefore the main tank, causes the sapphire plate and anti-reflection coatings to equilibrate closer to 30 K.
A single HWP assembly weighs 6.5 kg. During flight, each HWP was rotated by a few tens of degrees every 12 sidereal hours. Measurements suggest that stepping the six HWPs at this rate does not load the main tank by more than 60 mW (1 L/day). This includes loading from cryogenic wiring.
2.9 Filters
Radiative loading from the six 300 mm diameter telescope apertures creates a difficult thermal shielding problem. Millimeter-wavelength photons ( GHz) must pass through the VCS apertures with good efficiency, while preventing higher-frequency thermal radiation from the atmosphere, ambient-temperature window, and warmer temperature stages from overloading the cooler cryogenic stages. We use a combination of reflective metal-mesh “shaders” and low-pass filters [27, 28] located at the vacuum window, VCS2, and VCS1 to reduce the cryogenic loads to acceptable levels. Two shaders with a 1–2 THz low-pass edge are suspended below the vacuum window to attenuate the majority (90%) of the infrared emission from both the atmosphere and the window itself. Four such shaders at VCS2, followed by three more shaders and a 12 (360 GHz) low-pass filter at VCS1, further attenuate more than 95% of the incident radiative load at each stage. Under float conditions, we estimate about 9 W, 300 mW, and 3 mW of loading through all six filter stacks to VCS2, VCS1 and the MT, respectively. See further discussion of filter modeling in Section 3.4.
2.10 Cryogenic Wiring
The Spider flight cryostat uses an ensemble of copper, Manganin, and phosphor bronze wiring. Wiring for each telescope requires 400 conductors of 36 gauge Manganin wire, 300 of those are employed for detector readout while the remaining 100 are reserved for general telescope housekeeping, including thermometer and heater wiring. Each HWP requires 32 conductors with a combination of 32- and 36-gauge phosphor bronze wire. All conductors are heat sunk on VCS1, but not on VCS2, in order to prevent a thermal short between the two shields. Copper is only used internal to each temperature stage. Assuming the housekeeping cables are properly heat sunk at VCS1, we expect a total of approximately 5 mW loading to the main tank through wiring.
3 Ground Operations and Characterization
| Task | Time |
|---|---|
| Multiple purge cycles | 36–48 hours |
| Pump with turbomolecular pump | 3–4 days |
| Fill and equilibrate at temperatures | 4–5 days |
| Cool to LHe temperatures | 3 days |
| Total | 11–14 days |
3.1 Evacuation and Pre-Cooling
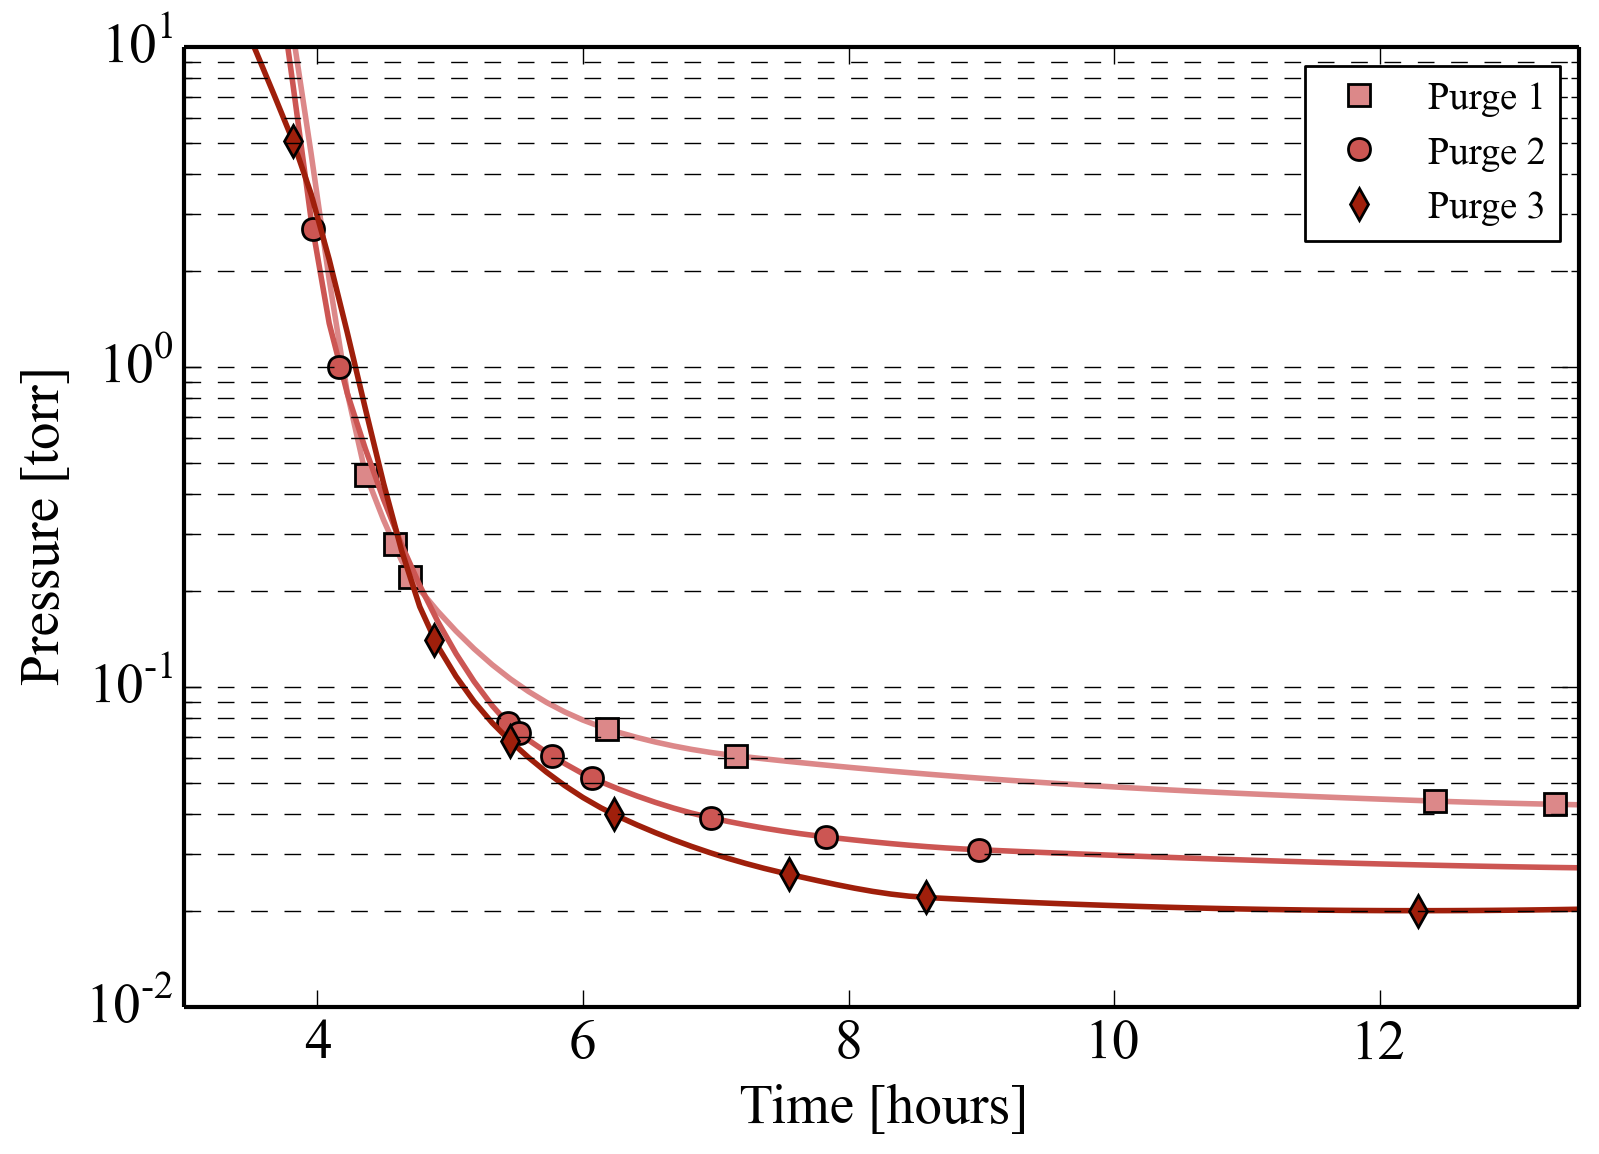
The vacuum vessel requires approximately one week of pumping before the initial liquid nitrogen cooldown can begin. During the pumpdown procedure, we find that backfilling with dry nitrogen helps to reduce the asymptotic absolute pressure, presumably by freeing water vapor adsorbed on the interior surfaces. Our experience suggests three to four gaseous nitrogen (GN2) backfilling procedures are useful, but any subsequent purge does not seem to help reduce the asymptotic pressure. We find that purging to higher pressure (760 torr rather than 100 torr) is generally more effective, with the caveat that time is also a significant parameter in this process. We use a dry scroll pump (Agilent TriScroll 600) for this initial “rough-out” phase of the pumpdown.151515Agilent Technologies, Santa Clara, CA. Figure 9 shows the pressure profiles following three consecutive purge operations with the pumpdown manifold fixed between purges. The reduction in asymptotic pressure values suggests the purge operations are helpful.
After this initial phase we install a turbomolecular pump directly at the KF-50 pump-out flange on the vacuum vessel so as to minimize the flow impedance between the vacuum vessel and the pump. When moving the pump further away from the pumpout flange, we observe significant degradation in pumping speed in accordance with the expected inverse length scaling.
When the pressure reading at the vacuum vessel pumpout port indicates approximately torr (while pumping), we can begin the liquid nitrogen pre-cooling. This process removes 90% of the combined enthalpy of the telescopes and cryostat, requiring 300–400 L of liquid nitrogen. The subsequent cooldown to 4 K consumes approximately 500 L of liquid helium before the cryostat has fully equilibrated. The cooldown operation is performed by filling with 100–200 L of liquid a few times over a 48 hour time period. Table 1 highlights the main aspects of the evacuation and cooldown schedule and their approximate duration. The considerable time requirement is set by the net volume of the vacuum vessel, approximately , as well as the total mass that is cooled to the 4 K base temperature, about 240 kg from the main tank and an additional 48 kg per telescope (an approximate total of 550 kg is cooled to 4K).
During liquid nitrogen pre-cooling and beginning period of helium cooling, the thermally isolated capillary assembly is maintained at 300 K using heaters mounted to the SFT box. The SFT is also pressurized to 21 psia with high-purity helium gas in order to prevent flow of liquid nitrogen into the capillaries, potentially causing flow restrictions. After a significant amount of liquid helium has accumulated in the main tank and the VCSs are nearing their equilibrium temperature, we turn off heat to the capillary assembly and begin pumping on the SFT vent line. This initiates the flow of liquid helium through the capillaries, becoming superfluid in the process, with its evaporation providing cooling power to the SFT. With the capillaries heated to 300 K during LN2 operations, we have not yet observed a flow restriction in the capillaries when cooling the SFT down to operational temperatures. The SFT reaches superfluid temperatures about 18 hours after turning off heat to the capillaries. We can typically cycle fridges within 24 hours of the SFT temperature falling below 2 K.
3.2 Helium Leak
The main and superfluid tanks of the Spider flight cryostat each have at least one microscopic fissure that leaks helium. The leaks were first detected during the construction phase and we have had mixed success in locating and sealing them. The presence of the leaks can be detected at room temperature, but only by pressurizing the tanks with gaseous helium while pumping on the vacuum vessel; the leak rates are minuscule, making then impossible to localize at room temperature. The leaks become more apparent as the cryostat is cooled to liquid nitrogen temperatures, and early attempts at localizing them by covering the affected area with liquid nitrogen proved successful. The involved network of flow impedances between the leak and the vacuum vessel pumpout port prevents accurate determination of the absolute leak rates.
We have applied Stycast 2850FT to suspect areas and noticed a marked reduction in helium backgrounds, but also found that these epoxy seals can worsen with time. The large number of aluminum welds (17 m in total) as well as the complex shape and high density of threaded holes make this design relatively susceptible to manufacturing errors resulting in micro-fissures. Our results suggest that the aluminum welds are the most likely culprits. Based on experience dealing with recurring leaks, we decided to apply Stycast to all suspect areas during the pre-flight closeup in November 2014, with particular attention to the welds.
The increased helium background in the vacuum vessel can negatively affect the performance of the transition edge sensors populating each focal plane, in addition to adding a parasitic heat load to the cryogenic stages. The prevailing theory posits that a superfluid film builds up on the focal planes, effectively changing the thermal properties of the detectors and therefore both their gain and the noise properties. This phenomenon is time-dependent, has an abrupt onset, and a predictable cycle. In order to negate this build-up of superfluid film we cycle the fridges more often than required based on the hold-time alone (see Sections 2.7 and 4.2) as the fridge cycles clear the films. The result is a slight decrease in duty cycle relative to the design, with no other impact on detector performance.
3.3 Results from Ground-Testing
The Antarctic long-duration balloon program has launc-hed approximately 40 payloads to date, and the average flight time is 20 days [29, 30]. Based on this observation, we defined a 20 day hold time requirement during the design phase of the Spider flight cryostat.
A lab measurement with all six telescopes mounted, flight-ready, and observing a room temperature load, shows a 40 SLPM average flow from the main tank. This corresponds to approximately of daily liquid loss and 12 days of cryogenic hold time assuming an initial charge of liquid helium. During these tests, the two vapor cooled shields, VCS1 and VCS2, equilibrate at 42 and 157 K, respectively, with approximately 2 SLPM of helium gas flow from the main tank to the superfluid tank. Similar cryogenic tests that were conducted with both vapor cooled shields fully sealed (filters replaced with aluminum plates and covered in MLI), and without the science instruments installed, showed significantly lower flow rates and loading. During those tests we observed an average main tank flow rate of 23 SLPM with VCS1 and VCS2 equilibrating at 28 and 157 K, respectively. We attribute the difference in loading primarily to optical power penetrating the telescope filter stacks. Table 2 summarizes observations from cryogenic testing.
| LN2 | LHedark | LHelight | Flight | |
|---|---|---|---|---|
| VCS1 [K] | 120 | 28 | 42 | 30 |
| VCS2 [K] | 220 | 157 | 157 | 118 |
| Flow [SLPM] | 2.5 | 23 | 38 | 28 |
3.4 Cryostat Thermal Modeling
A thermal model was developed to inform the equilibrium loading and performance of the Spider flight cryostat both in flight and during ground tests in various configurations. The model accounts for conductive loads via the support flexures, wiring, and plumbing, gas conduction within plumbing lines, the feedback from the enthalpy of the helium vapor and several sources of radiative loading. Conductive and radiative loading between the bulk vapor-cooled shields is modeled using the Keller model [31] for multilayer insulation.
Radiative loading along the optical path of each telescope is modeled using measured reflection, transmission, and bulk absorption properties of filter elements. The total power incident on any temperature stage is the sum of 1) incident radiation from the CMB and ambient atmosphere and 2) emission from each of the skyward filters, all attenuated by the net transmission through the intervening filters.
Negative feedback is accounted for in the cooling power provided by enthalpy of the boil-off gas through the heat exchangers to the intermediate stages. Equilibrium temperatures and loads are found by iteratively solving for zero heat flow across the vapor-cooled stages. During flight-like conditions, VCS1 and VCS2 are expected to intercept approximately 5 and 20 W, respectively.
In practice, our thermal model struggles to reproduce the observed main tank loading under all operational conditions [10]. Careful accounting of conductive and radiative loading to the main tank suggests upper limits of 800 mW and 200 mW, respectively, when telescope apertures are replaced with aluminum covers (corresponding to column LHedark in Table 2). In this scenario, about 400 mW of power input to the helium bath is missing from the model. A macroscopic bolometer instrumented with an ensemble of heaters and thermometers was mounted on the main tank to help estimate the radiative environment. Using this bolometer we calculated a 200 mW upper limit to the radiative loading on the main tank, which is consistent with the thermal model predictions. However, the bolometer is not sensitive to light-leaks that would most likely penetrate openings in MLI surrounding apertures and main flexures. We suspect that unmodeled light-leaks might help to explain the discrepancy between model predictions and realized performance and note that incorporating such a feature into the thermal model does improve consistency with observations. We also note that interstitial residual helium, due to a leak, can increase the effective conductivity of MLI in ways that are difficult to model (see Section 3.2).
Pressure oscillations in plumbing lines can in some cases add significant thermal loads to cryogenic systems [32]. Careful heat sinking of the MT and SFT fill and vent lines hopefully ensure smooth thermal gradients from 300 to 4 K (see Section 2.4). In-flight pressure data from the valved-off MT vent line, shows that the amplitude of 0.1–30 Hz pressure oscillations does not exceed 0.005 torr/rtHz with the exception of a narrow line at 0.04 torr/rtHz at 3.2 Hz.
Despite the excess of the observed loading above the model predictions, it is worth noting that Spider’s cryogenic performance is nonetheless impressive. A naïve scaling of effective areas from the test cryostats (including BICEP2) to the Spider flight cryostat would predict a load double that which Spider actually experiences.
Despite significant reduction in atmospheric loading, a stratospheric payload is still subject to Earth’s atmosphere. The pressure and temperature at float altitude is approximately 5 torr and 250 K, respectively. These conditions require a vacuum vessel, which inevitably intercepts of order 100 W of radiative loading per square meter. In space, passive cooling can reduce the base temperature of payloads down to 50 K [33]. This significantly reduces loading to the first active cryogenic state relative to a stratospheric payload.
The mass of the entire cryogenic assembly, including cryogens, was 990 kg. With a total cryogen volume of 1300 L, the effective density of the cryostat is 0.76 . Using a metric that combined depletion rate, , with radiative loading, , we find that 60 W day/L [34]. This compares favorably to cryostats designed for space.
4 Flight Performance
4.1 Pre-flight Configuration, Launch, and Ascent
A number of cryogenic operations both shortly before launch and during ascent are critical for a successful flight. Spider rolled out to the launch pad on January 1, 2015, and successfully launched about nine hours later. Spider was launched cold, with the detectors at 300 mK and the superfluid tank maintained at low pressure with an auxiliary pump mounted on the launch vehicle. At launch, the entire payload weighed 3065 kg (including everything from the pivot and below).
Ground operations require a dedicated pump to maintain the superfluid tank below 2 K. At float, the SFT is open to the atmosphere, which at 36 km altitude easily reduces the vapor pressure of helium below the -point. During the 3–4 hours required for ascent, we pumped on the superfluid volume with a low-power KNF N950.50 diaphragm pump driven by one of our two 24 V flight battery systems.161616KNF Neuberger Inc., Trenton, NJ. The pump drew approximately 1 A at 24 V, providing a 2 SLPM pumping rate at 50 torr and exceeded our expectations from ground testing, presumably because of reduced backing pressure at the pump outlet. Ground based testing suggested this pump would prevent the thermal transients associated with valving off the superfluid tank entirely while letting it pressurize due to the constant flow of helium from the MT to the SFT.
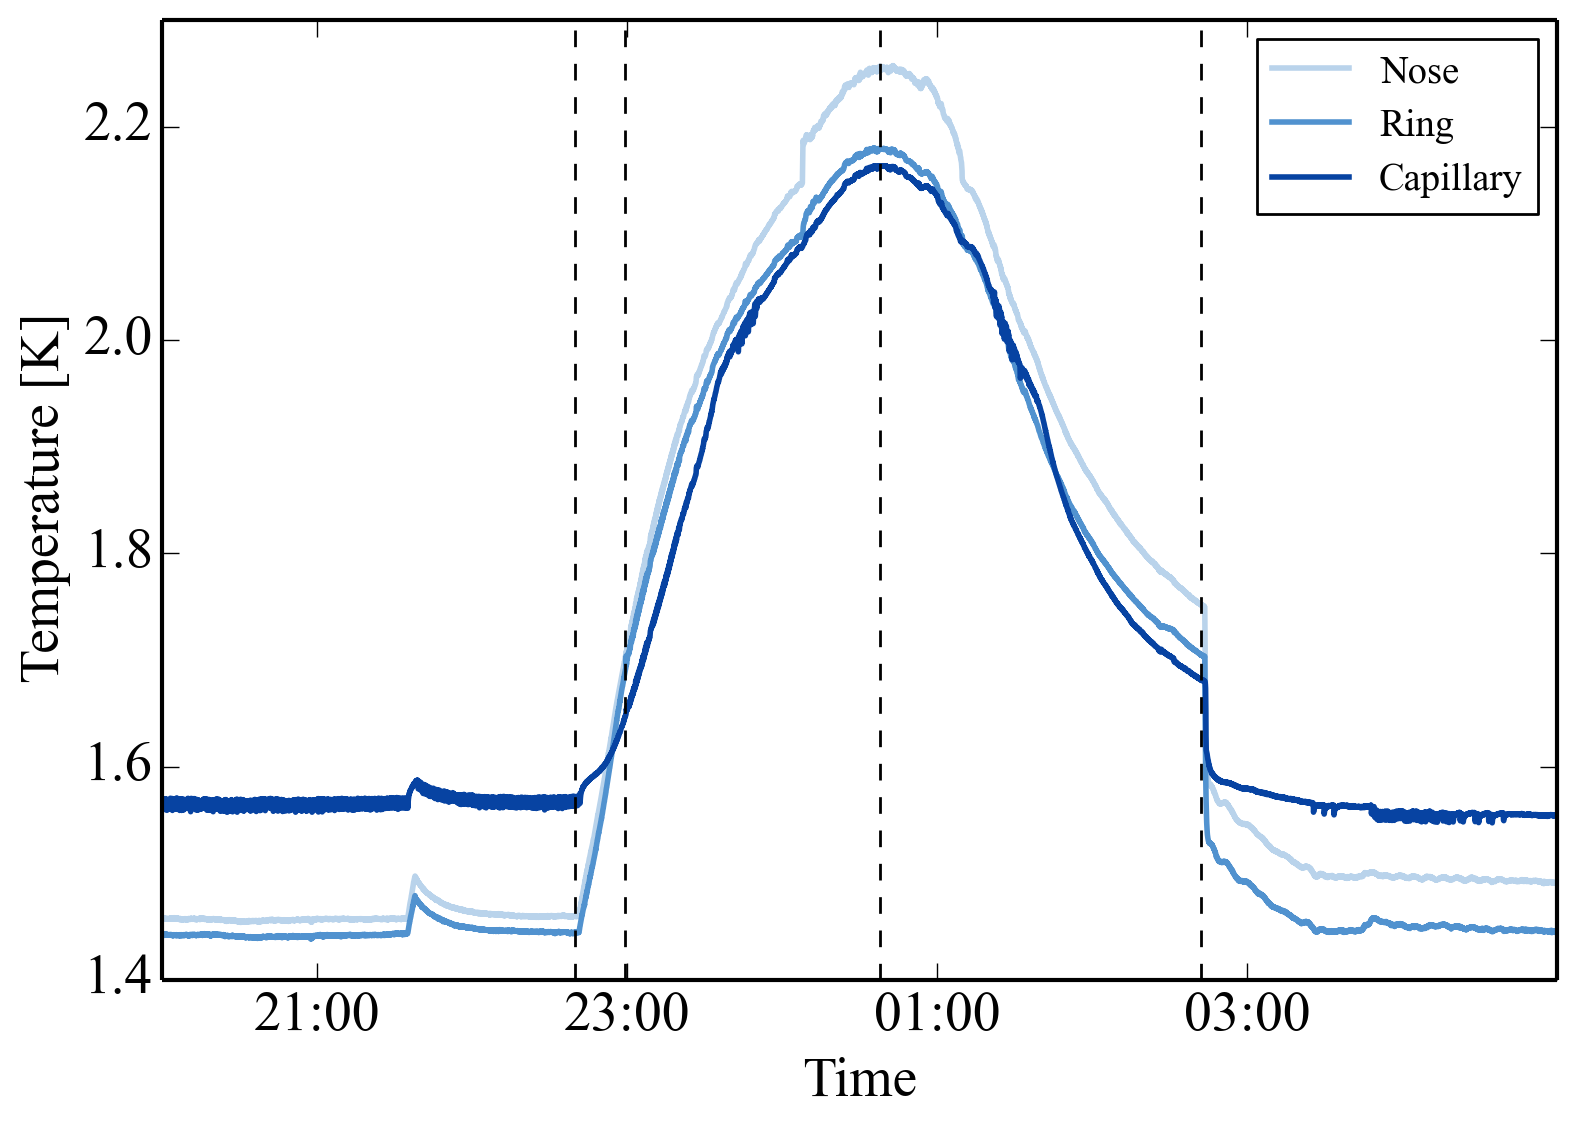
Approximately 10 min before launch, we commanded a motorized bellows valve shut, isolating the SFT vent line from a scroll pump located on the launch vehicle. The diaphragm pump was then turned on and allowed to pump on the superfluid volume during launch and ascent. During this time, the temperature of the SFT only barely exceeded the -point. Figure 10 shows the temperature of the superfluid tank during a nine hour period that includes Spider’s launch.
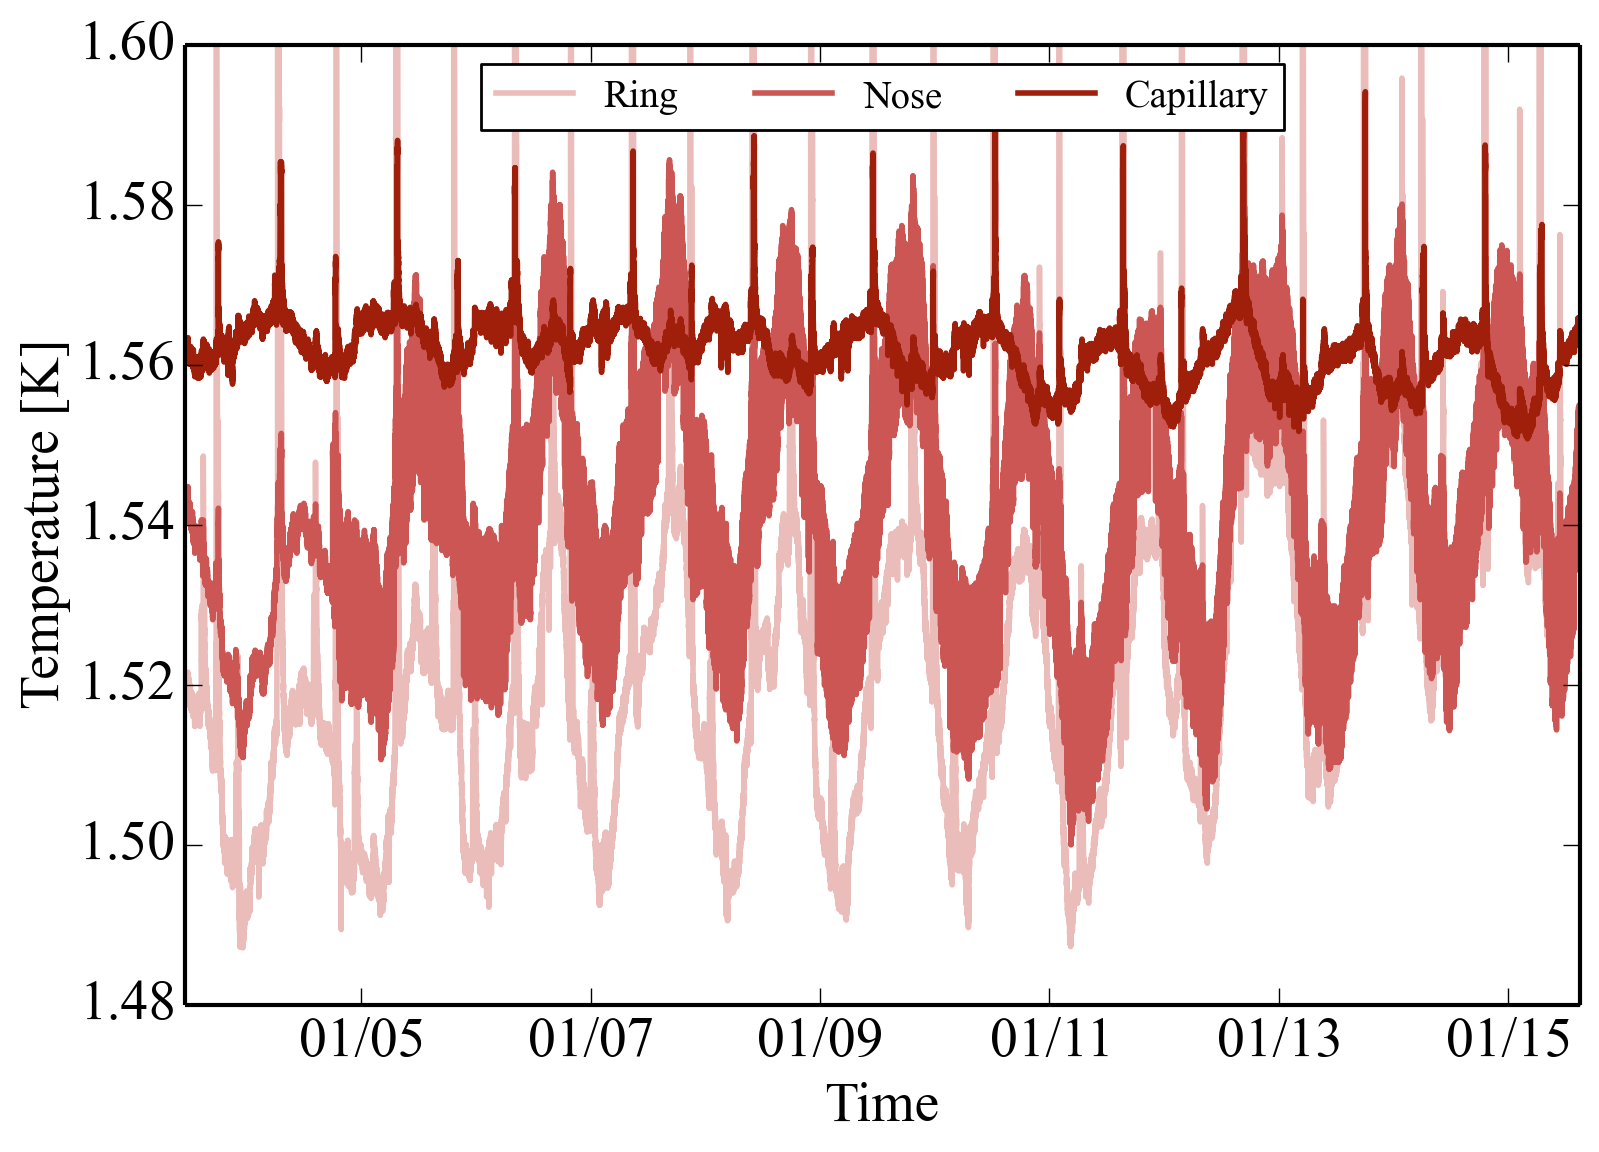
About 3.7 hours into launch, and with the payload 33.3 km above sea level, we commanded a motorized valve to open the SFT vent line to the atmosphere and subsequently turned off the diaphragm pump. Figure 11 shows the temperature profile of the SFT and capillaries during flight. The tank was stable at 1.5–1.6 K for the entire flight. Spider equilibrated at a float altitude of 36.4 km, approximately 4.5 hours after launch; the majority of the flight was spent at an altitude of km, with the variance mostly driven by diurnal fluctuations. At this altitude our ambient pressure sensors recorded torr.
Two Tavco absolute pressure regulators set to vent at 13.5 psia were installed in parallel at the VCS vent where all gas exiting the MT is routed. After exiting the vacuum vessel, but before passing through these regulators, the cold helium gas passes through a heat exchanger block which is thermally connected to the power supplies for the multichannel electronics used to read out our detector signals [35]. This heat exchanger, a critical source of cooling for the power supplies, which operate in near vacuum, provides approximately 40 W of power to the cold gas. We employ two Tavcos at the VCS vent line to split the flow and therefore reduce the effective cooling power and the physical stresses experienced by each regulator. Given the system’s flow impedance and the estimated equilibrium flow, we expected that the main tank would equilibrate at approximately 14.7 psia (1 atm) at float. Our in-flight pressure gauges suggest that the main tank pressure equilibrated at psia. Another Tavco regulator set to crack at 17.5 psia was installed on the MT vent line in case of a sudden over-pressurization. That regulator only opened at the conclusion of the flight, when the sudden loss of cooling power from evaporation of liquid helium resulted in transient heating of residual vapor.
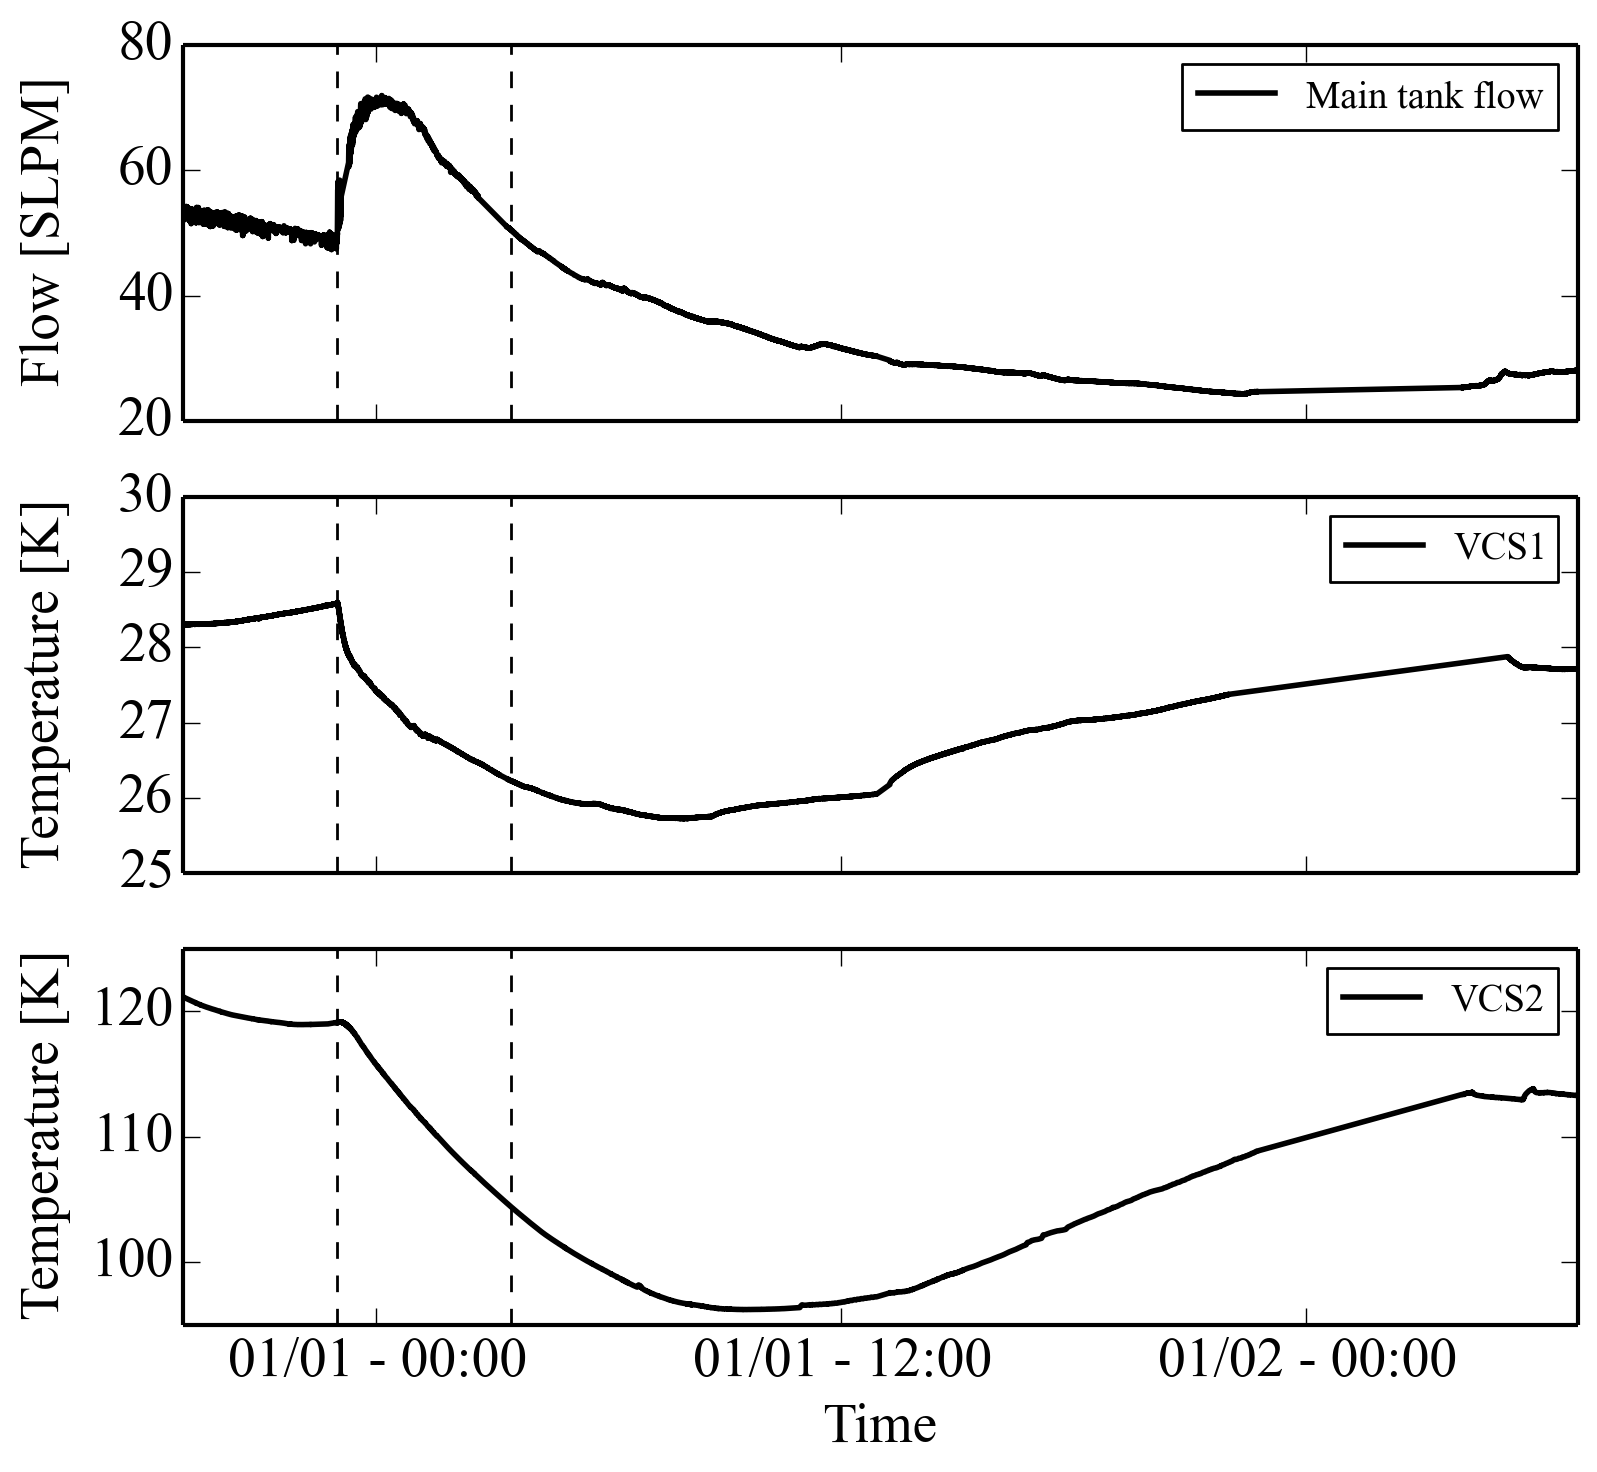
During ascent, the atmospheric pressure dropped rap-idly. This resulted in a significant change in the pressure differential driving flow out of the main tank through the vapor cooled shields. This abrupt change in the pressure boundary conditions caused a temporary increase in flow out of the VCS, which in turn super-cooled the shields. Figure 12 shows the flow and VCS temperatures during a 36 hour period that includes the launch. Note that 40.0 SLPM corresponds to 2.46 W of loading to the main tank.
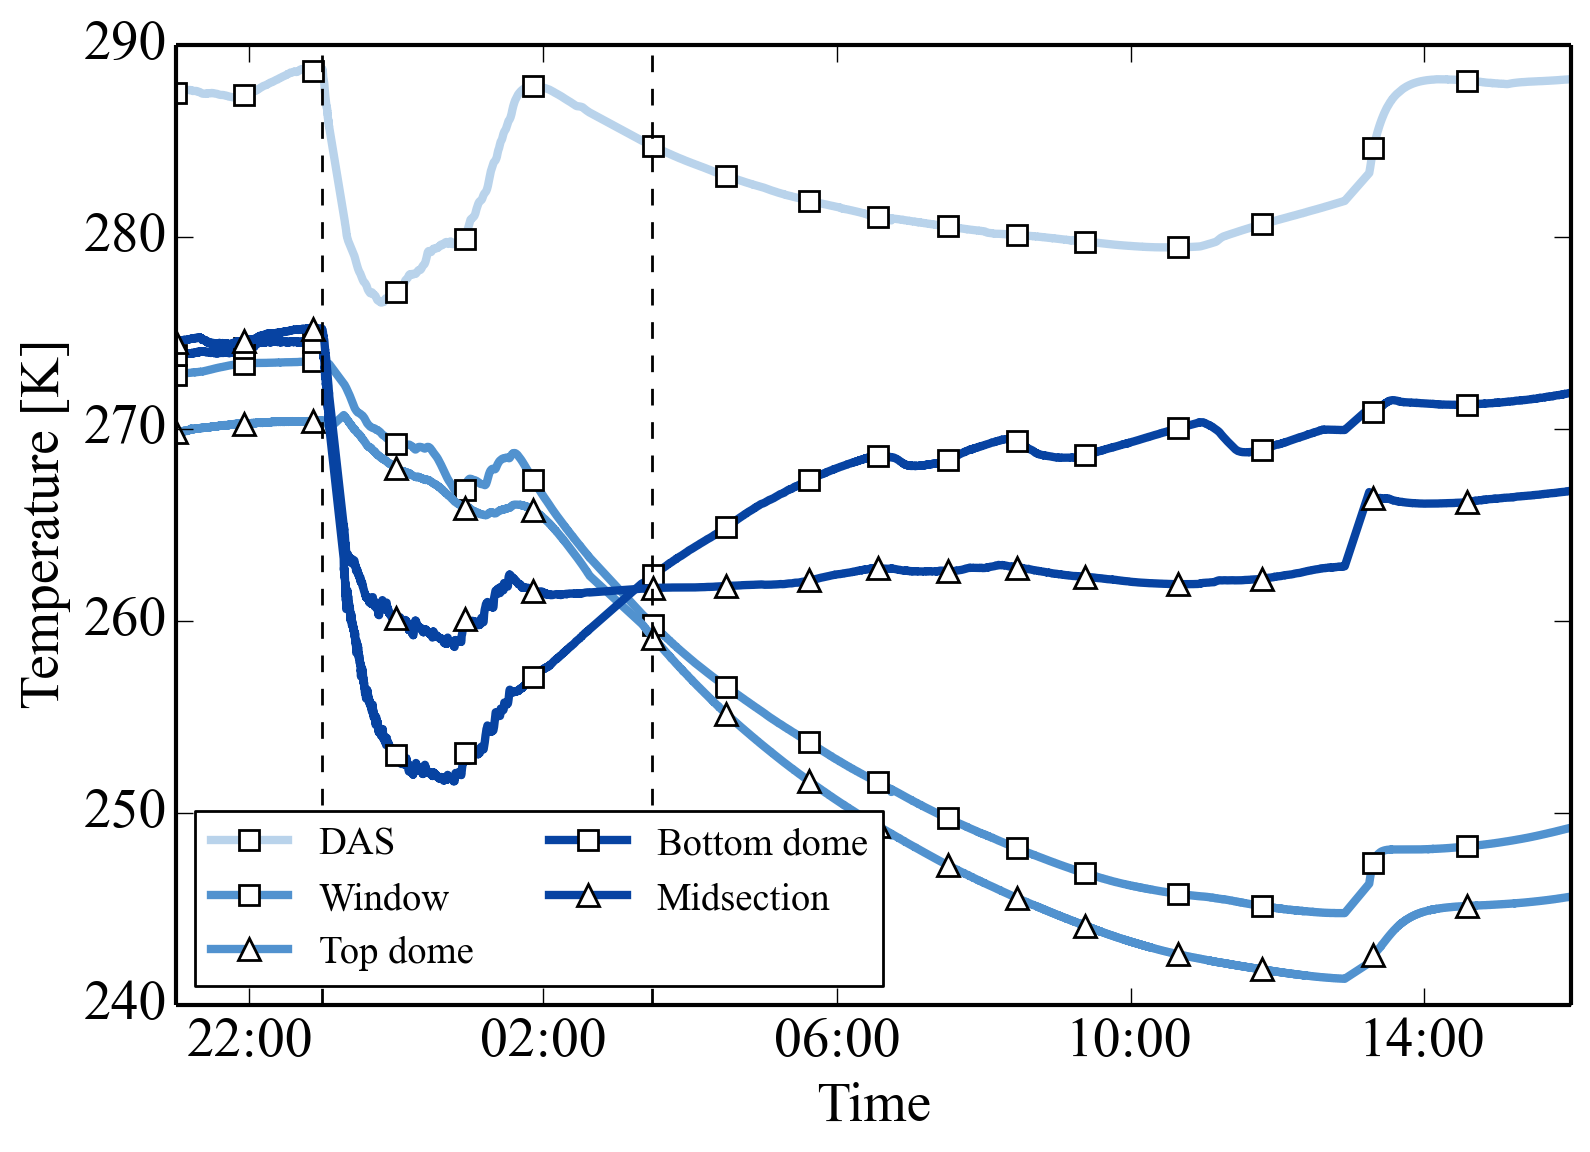
The payload surfaces experienced a significant temperature change as the balloon ascended through the troposphere. Figure 13 shows the temperature at a few key locations of the vacuum vessel. The largest transient lasted for about two hours during ascent and can be most clearly seen by the temperature of the bottom dome and midsection of the vacuum vessel. About 15 hours after launch, the vacuum vessel began to equilibrate to its nominal temperature.
4.2 In-Flight Thermal Behavior
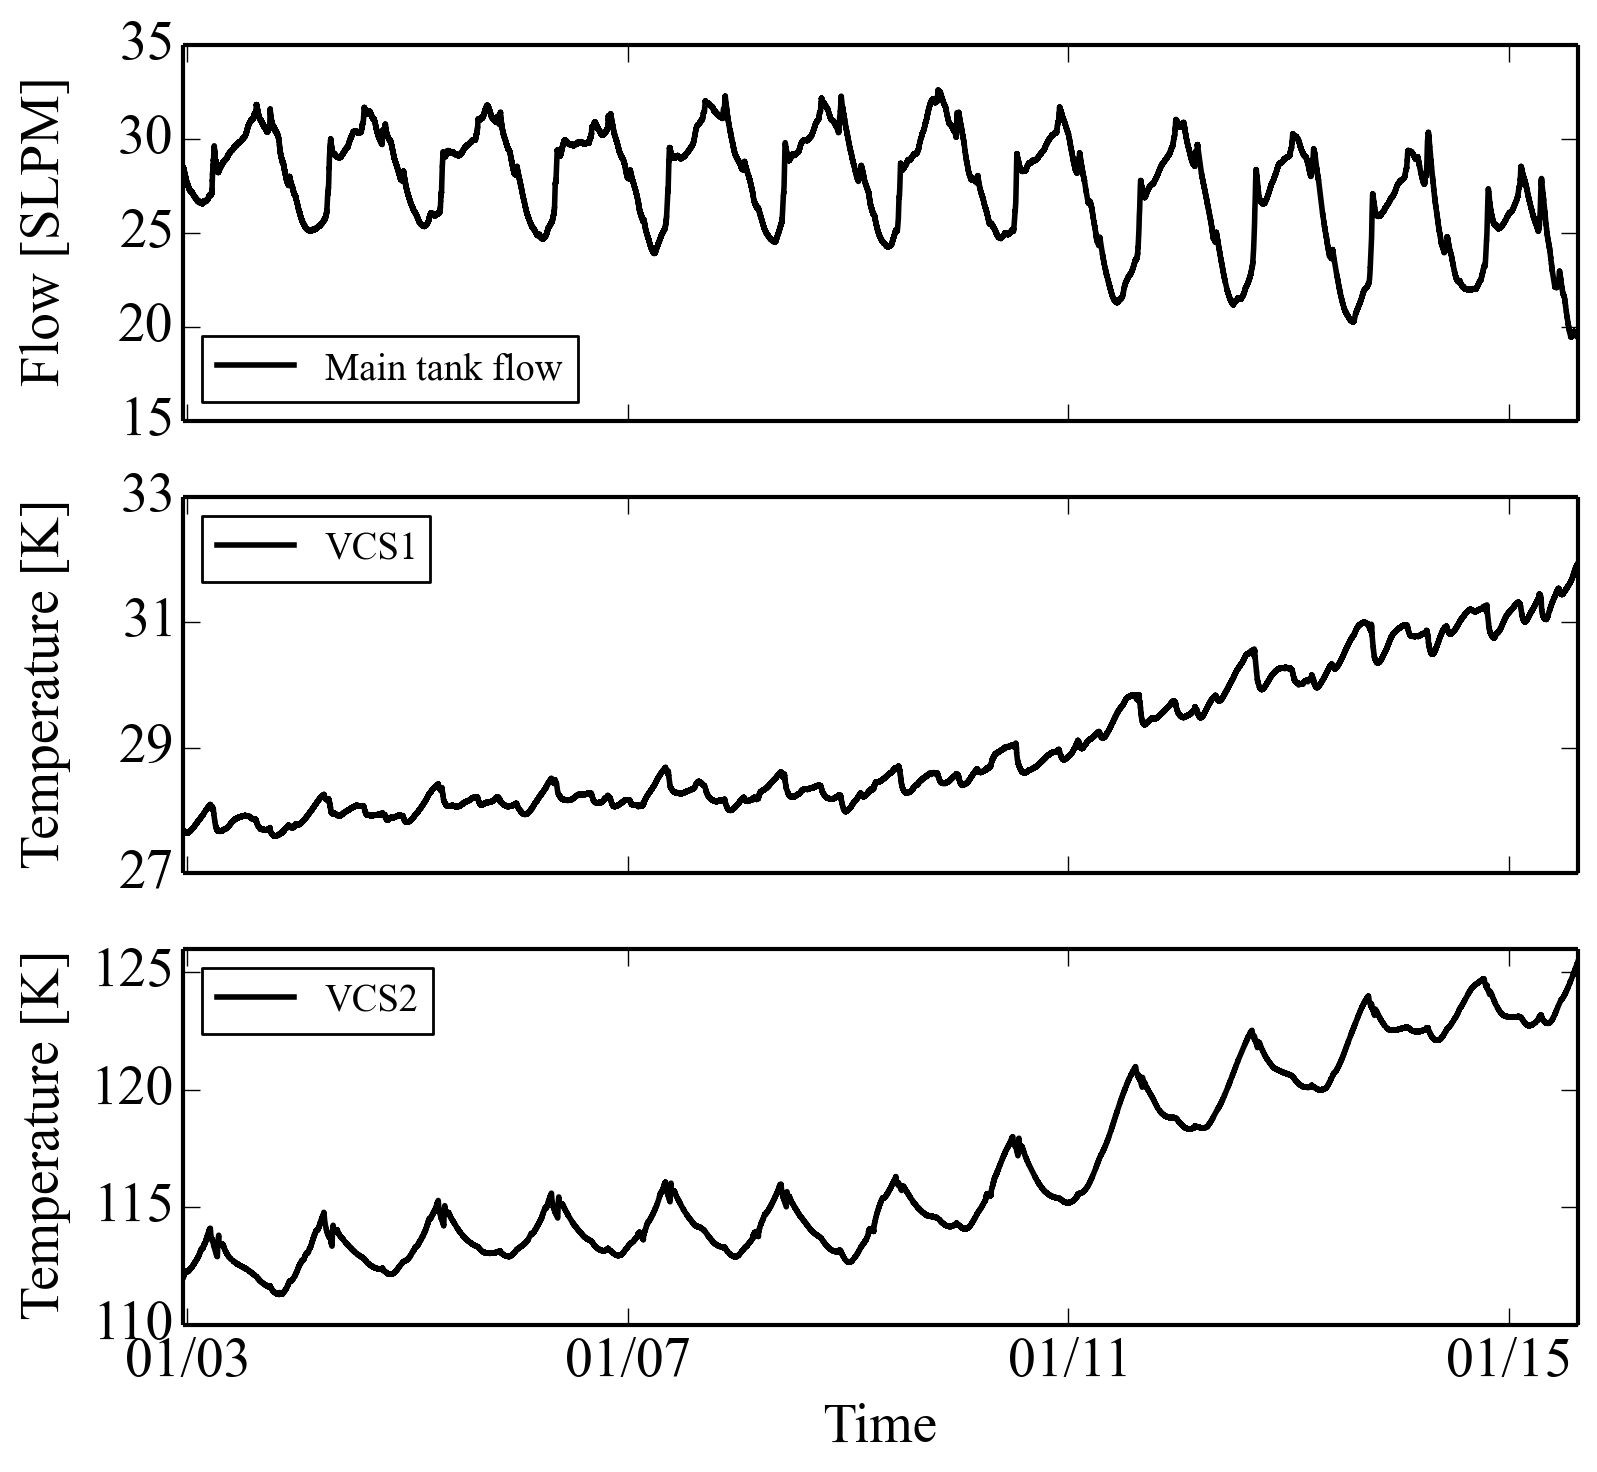
Approximately 28 hours after launch, the flow out of the main tank had stabilized to 28 SLPM, corresponding to an equilibrium loading on the MT of about 1.7 W and a 58 L/day loss. This represents a 0.8 W reduction in loading compared to that seen on the ground and is caused by a decrease in vacuum vessel temperature as well as less sky loading. Table 2 compares the in-flight equilibrium flow and VCS temperatures with that measured on the ground. Diurnal and fridge cycling variation resulted in a 3 SLPM root mean square variations in the flow rate on a daily basis. We note that the loading at float is still greater than what we see on the ground with all apertures blanked off (see Section 3.3), suggesting that radiative loading through telescopes contributes more significantly to the MT loading than a 25 K reduction in the temperature of the vacuum vessel shell. Figure 14 shows the steady state main tank flow and VCS temperatures during the majority of flight.
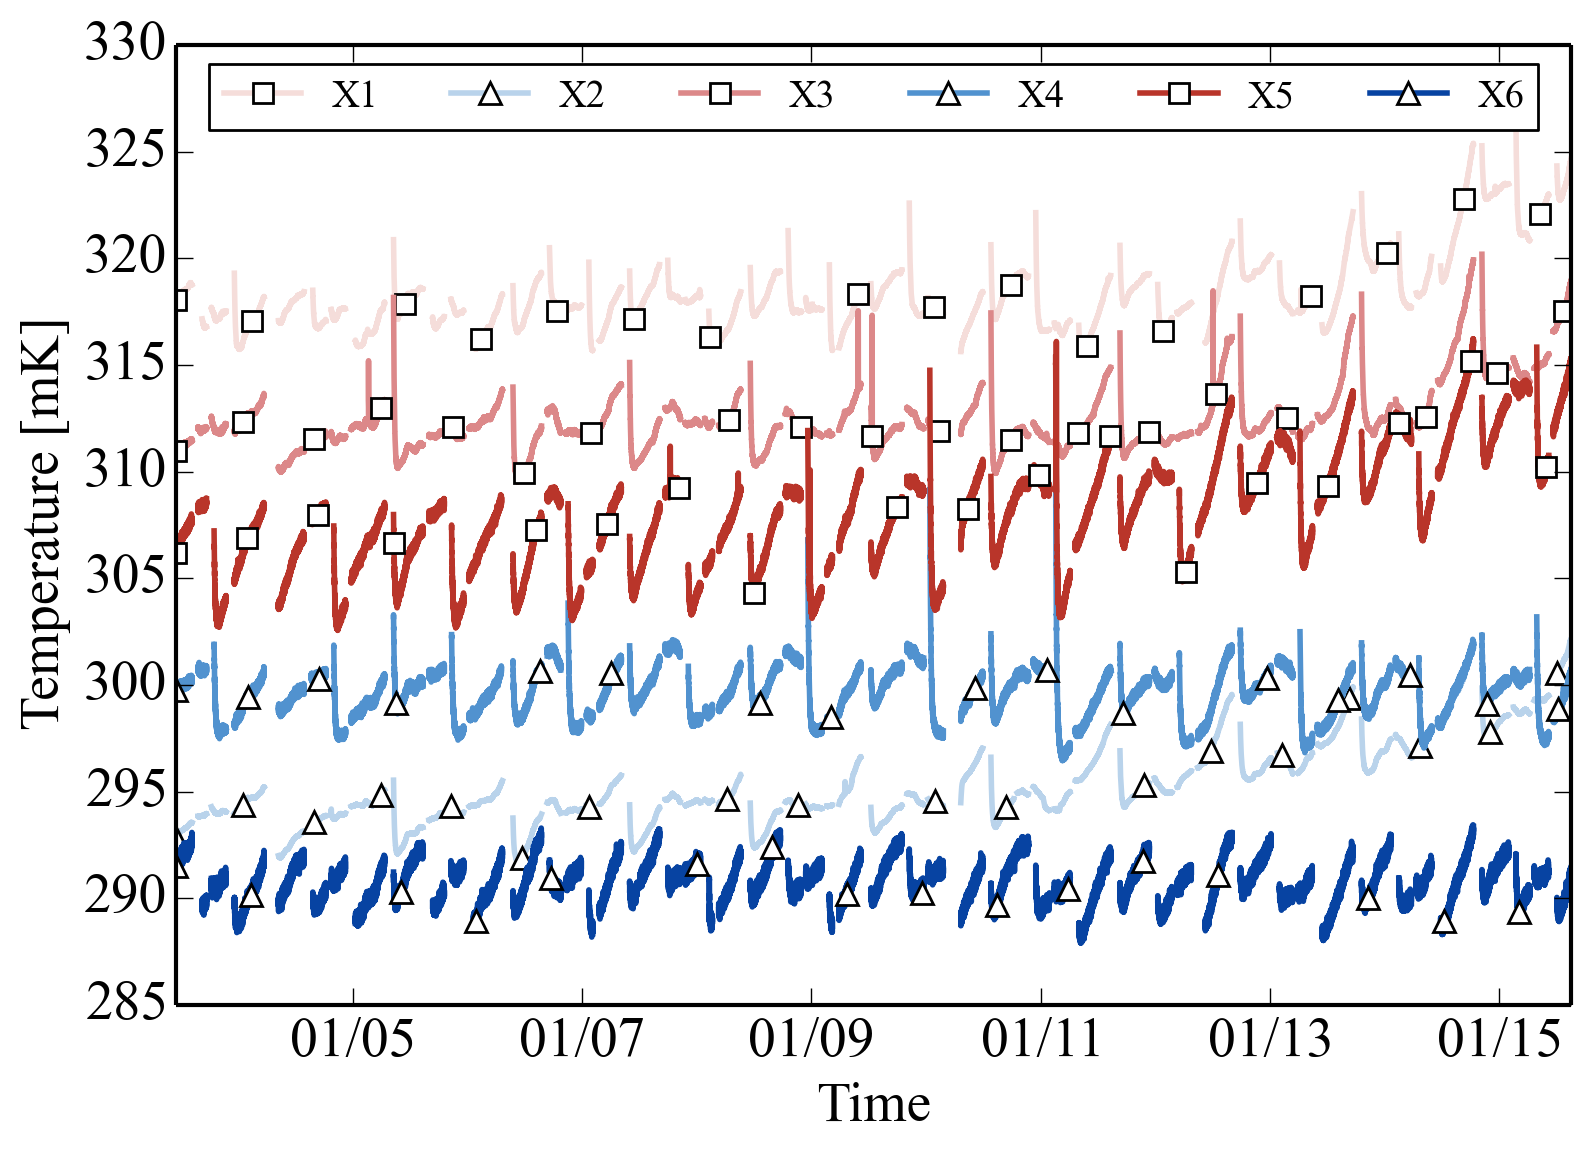
The six telescopes operated nominally for the duration of the flight. As expected, the baseplates warmed up with time as liquid level decreased, but their temperatures remained suitable for operations throughout the flight. Figure 15 shows the temperature profiles of the six telescopes baseplates over the majority of the flight duration. Telescopes X2 and X5 were mounted in the ports furthest from the bottom of the main tank (see Figure 3), and therefore rose most significantly in temperature with decreasing liquid level. Telescopes X1 and X3 were mounted in the two middle ports and also saw some temperature rise as liquid level dropped while the telescopes mounted in the bottom two inserts, X4 and X6, did not change significantly in temperature until the cryostat began to run out of liquid, around January 16. Strong thermal connections between the baseplate and telescope ensured that components such as the eyepiece and objective lenses did not deviate from the baseplate temperatures by more than 0.5–1.0 K.
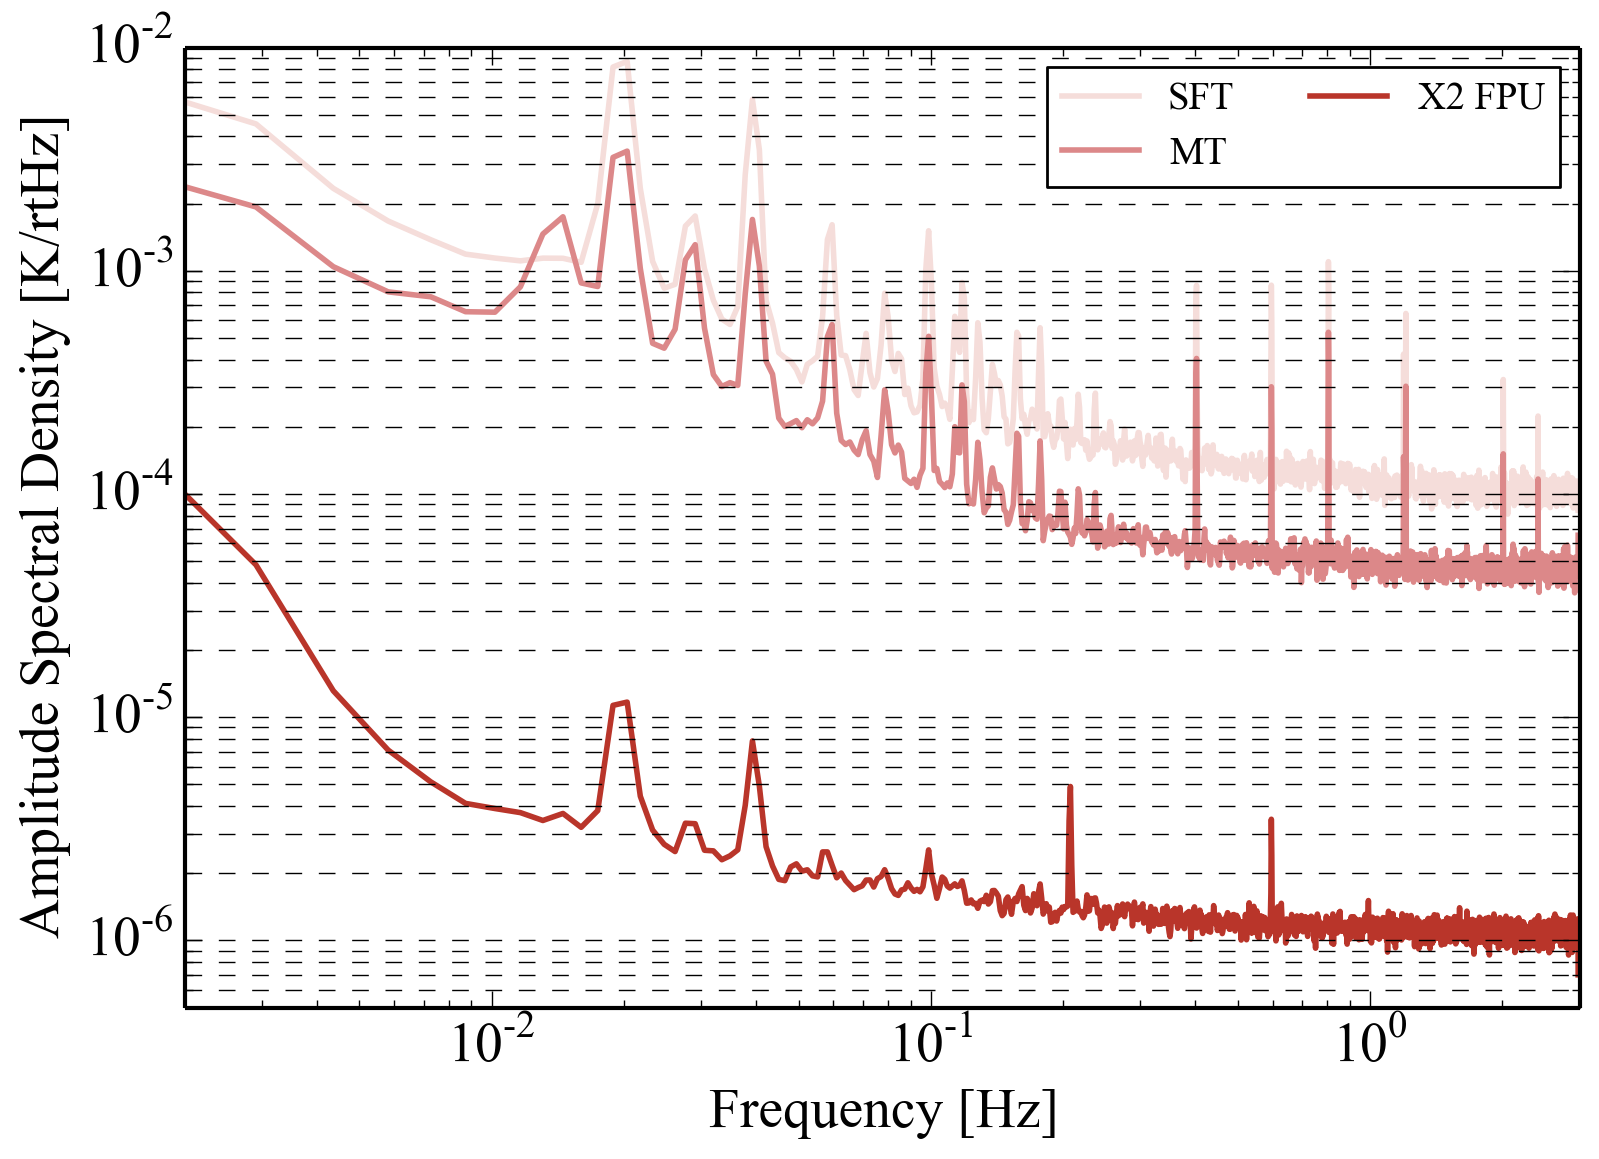
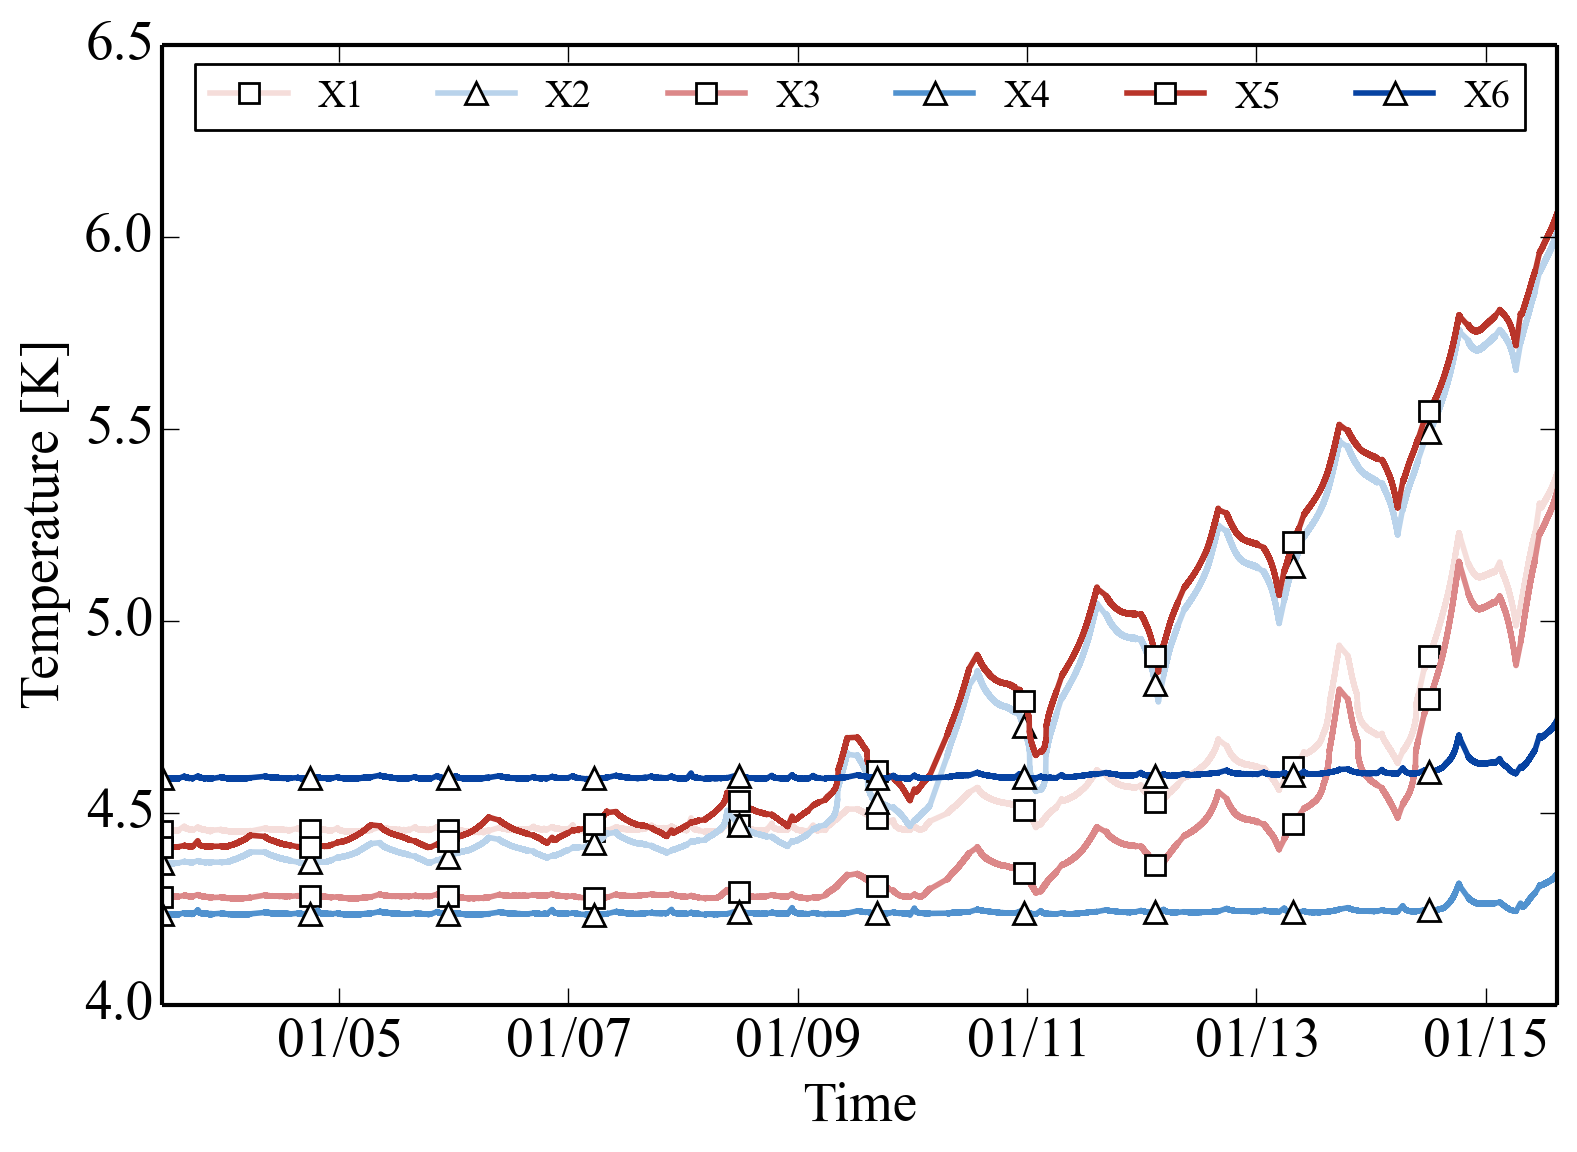
Throughout flight, the half-wave plates were stepped every 12 sidereal hours and the six adsorption refrigerators were cycled at 8–24 hour intervals. Figure 16 shows the temperature of the six Spider focal planes over the duration of the flight. Low-amplitude temperature drifts between fridge cycles are clear, but overall the focal planes were relatively stable. We note that the focal plane temperatures for all but the two telescopes mounted in the lowest ports begins to rise when the main tank liquid level has dropped below 30% of its full charge. Thankfully, this has a negligible effect on the detector sensitivity. On average, a focal plane spent 14.9% of the flight duration above 350 mK due to scheduled fridge cycles. Figure 17 shows the temperature spectral density as measured by MT and SFT thermometers (Silicon Diode DT-470) as well as a Cernox thermometer mounted on the edge of the X2 focal plane.171717Lake Shore Cryotronics, Inc., Westerville, OH. The data, derived from a five hour period during which all telescopes were operational, provide an upper limit for focal plane temperature fluctuations.
Based on integrated flow, we estimate that the final cryostat top-off resulted in a net charge of 1100 L and that the payload was launched with approximately 1050 L of liquid helium. During this flight, the payload successfully observed 10% of the sky for 16 days.
5 Conclusions
In this paper we have reviewed the design of the Spider balloon-borne cryostat and highlighted primary results of ground and flight performance. Despite significant difference between modeled and realized behavior (see Sections 3.4 and 4.2), the cryostat behaved adequately on the ground and during flight. We have demonstrated the suitability of this cryogenic design for future long-duration ballooning flights.
The recovery of the Spider payload is scheduled for the 2015–2016 Antarctic summer. Another flight cryostat, intended for a subsequent flight of the Spider experiment, is currently under construction.
6 Acknowledgements
We would like to acknowledge the valuable contributions of Robert Levenduski, Edward Riedel and Larry Kaylor of Redstone Aerospace to the design and fabrication of the Spider flight cryostat.
Spider is supported in the U.S. by National Aeronautics and Space Administration under Grant No. NNX07-AL64G and NNX12AE95G issued through the Science Mission Directorate, with support for ASR from NESSF NNX-10AM55H, and by the National Science Foundation through PLR-1043515. Logistical support for the Antarctic deployment and operations was provided by the NSF through the U.S. Antarctic Program. The collaboration is grateful for the generous support of the David and Lucile Packard Foundation, which has been crucial to the success of the project.
Support in Canada is provided by the National Sciences and Engineering Council and the Canadian Space Agency.
References
- [1] The Polarbear Collaboration: P. A. R. Ade, Y. Akiba, A. E. Anthony, et al. A measurement of the cosmic microwave background b-mode polarization power spectrum at sub-degree scales with polarbear. The Astrophysical Journal, 794(2):171, 2014.
- [2] P. A. R. Ade, R. W. Aikin, D. Barkats, et al. Detection of -mode polarization at degree angular scales by bicep2. Phys. Rev. Lett., 112:241101, Jun 2014.
- [3] S. Naess, M. Hasselfield, J. McMahon, et al. The Atacama Cosmology Telescope: CMB Polarization at . Journal of Cosmology and Astroparticle Physics, 2014(10):007, 2014.
- [4] A. T. Crites, J. W. Henning, P. A. R. Ade, et al. Measurements of E-Mode Polarization and Temperature-E-Mode Correlation in the Cosmic Microwave Background from 100 Square Degrees of SPTpol Data. The Astrophysical Journal, 805(1):36, 2015.
- [5] Planck Collaboration, P. A. R. Ade, N. Aghanim, et al. Planck 2015 results. XIII. Cosmological parameters. ArXiv e-prints, February 2015.
- [6] A. A. Fraisse, P. A. R. Ade, M. Amiri, et al. SPIDER: Probing the Early Universe with a Suborbital Polarimeter. J. Cosmology Astropart. Phys., 4:47, April 2013.
- [7] A. S. Rahlin, P. A. R. Ade, M. Amiri, et al. Pre-Flight Integration and Characterization of the SPIDER Balloon-Borne Telescope. In Society of Photo-Optical Instrumentation Engineers (SPIE) Conference Series, Society of Photo-Optical Instrumentation Engineers (SPIE) Conference Series, June 2014.
- [8] L. E. DeLong, O. G. Symko, and J. C. Wheatley. Continuously Operating He-4 Evaporation Refrigerator. Review of Scientific Instruments, 42(1):147–150, 1971.
- [9] BICEP2 Collaboration, P. A. R Ade, R. W. Aikin, et al. Bicep2. ii. experiment and three-year data set. The Astrophysical Journal, 792(1):62, 2014.
- [10] J. E. Gudmundsson, P. A. R. Ade, M. Amiri, et al. Thermal Architecture for the SPIDER Flight Cryostat. In Society of Photo-Optical Instrumentation Engineers (SPIE) Conference Series, volume 7741 of Society of Photo-Optical Instrumentation Engineers (SPIE) Conference Series, July 2010.
- [11] J. D. Soler, P. A. R. Ade, M. Amiri, et al. A Light-weight Gondola for the Balloon-borne SPIDER Experiment. In Society of Photo-Optical Instrumentation Engineers (SPIE) Conference Series, Society of Photo-Optical Instrumentation Engineers (SPIE) Conference Series, June 2014.
- [12] J. A. Shariff, P. A. R. Ade, M. Amiri, et al. Pointing Control for the Spider Balloon-borne Telescope. In Society of Photo-Optical Instrumentation Engineers (SPIE) Conference Series, Society of Photo-Optical Instrumentation Engineers (SPIE) Conference Series, June 2014.
- [13] W. M. Kays and A. L. London. Compact Heat Exchangers. McGraw-Hill, New York, second edition, 1964.
- [14] F. P. Incropera, D. P. DeWitt, T. L. Bergman, and A. S. Lavine. Fundamentals of Heat and Mass Transfer. John Wiley & Sons, Hoboken, NJ, sixth edition, 2006.
- [15] M. C. Runyan and W. C. Jones. Thermal conductivity of thermally-isolating polymeric and composite structural support materials between 0.3 and 4 K. Cryogenics, 48:448–454, September 2008.
- [16] M. D. P. Truch, P. A. R. Ade, J. J. Bock, et al. The Balloon-borne Large Aperture Submillimeter Telescope: BLAST. volume 41 of Bulletin of the American Astronomical Society, pages 400–414, jan 2009.
- [17] J. Wrubel, G. Gabrielse, W.S. Kolthammer, et al. Pumped Helium System for Cooling Positron and Electron Traps to 1.2 K. Nuclear Instruments and Methods in Physics Research Section A: Accelerators, Spectrometers, Detectors and Associated Equipment, 640(1):232 – 240, 2011.
- [18] N. K. Das, J. Pradhan, Md. Z. A. Naser, et al. Design and Performance of a -Evaporator at 1.0 K. Cryogenics, 52(12):679–684, 2012.
- [19] Y. Fujiyoshi, T. Mizusaki, K. Morikawa, et al. Development of a Superfluid Helium Stage for High-Resolution Electron Microscopy. Ultramicroscopy, 38:241–251, 1991.
- [20] K. W. Yoon, P. A. R. Ade, D. Barkats, et al. The Robinson Gravitational Wave Background Telescope (BICEP): a bolometric large angular scale CMB polarimeter. In Society of Photo-Optical Instrumentation Engineers (SPIE) Conference Series, volume 6275 of Society of Photo-Optical Instrumentation Engineers (SPIE) Conference Series, July 2006.
- [21] R. W. Aikin, P. A. Ade, S. Benton, et al. Optical performance of the BICEP2 Telescope at the South Pole. In Society of Photo-Optical Instrumentation Engineers (SPIE) Conference Series, volume 7741 of Society of Photo-Optical Instrumentation Engineers (SPIE) Conference Series, July 2010.
- [22] M. C. Runyan, P. A. R. Ade, M. Amiri, et al. Design and Performance of the SPIDER Instrument. In Society of Photo-Optical Instrumentation Engineers (SPIE) Conference Series, volume 7741 of Society of Photo-Optical Instrumentation Engineers (SPIE) Conference Series, July 2010.
- [23] J. P. Filippini, P. A. R. Ade, M. Amiri, et al. SPIDER: a Balloon-Borne CMB Polarimeter for Large Angular Scales. In Society of Photo-Optical Instrumentation Engineers (SPIE) Conference Series, volume 7741 of Society of Photo-Optical Instrumentation Engineers (SPIE) Conference Series, July 2010.
- [24] L. Duband, L. Hui, and A. Lange. Space-borne He-3 refrigerator. Cryogenics, 30:263–270, March 1990.
- [25] L. Duband, A. Lange, and A. Ravex. A miniature adsorption He-3 refrigerator. In ESA, 4th European Symposium on Space Environmental Control Systems, Volume 1 p 407-409 (SEE N92-25828 16-18), pages 407–409, December 1991.
- [26] S. A. Bryan, P. A. R. Ade, M. Amiri, et al. Modeling and characterization of the SPIDER half-wave plate. In Society of Photo-Optical Instrumentation Engineers (SPIE) Conference Series, volume 7741 of Society of Photo-Optical Instrumentation Engineers (SPIE) Conference Series, July 2010.
- [27] P. A. R. Ade, G. Pisano, C. Tucker, and S. Weaver. A review of metal mesh filters. In Society of Photo-Optical Instrumentation Engineers (SPIE) Conference Series, volume 6275 of Society of Photo-Optical Instrumentation Engineers (SPIE) Conference Series, page 0, June 2006.
- [28] C. E. Tucker and P. A. R. Ade. Thermal filtering for large aperture cryogenic detector arrays. In Society of Photo-Optical Instrumentation Engineers (SPIE) Conference Series, volume 6275 of Society of Photo-Optical Instrumentation Engineers (SPIE) Conference Series, page 0, June 2006.
- [29] D. D. Gregory and W. E. Stepp. NASA’s long duration balloon program: the last ten years and the next ten years. Advances in Space Research, 33:1608–1612, January 2004.
- [30] D. D. Gregory. Private communications, 2014.
- [31] CW Keller. Final NASA report: Thermal performance of Multilayer Insulations. NASA CR-134477, page 446, April 1974.
- [32] K.W. Taconis, J.J.M. Beenakker, A.O.C. Nier, and L.T. Aldrich. Measurements concerning the vapour-liquid equilibrum of solutions of he3 in he4 below 2.19°k. Physica, 15(8–9):733 – 739, 1949.
- [33] Planck Collaboration. Planck early results. I. The Planck mission. Astronomy and Astrophysics, 536:A1, 2011.
- [34] W. Holmes, H. Cho, I. Hahn, et al. Performance comparisons of space borne cryostats. Cryogenics, 41:865–870, November 2001.
- [35] M. Dobbs, M. Halpern, K. D. Irwin, et al. Multiplexed Readout of CMB Polarimeters. Journal of Physics: Conference Series, 155(1):012004, 2009.