The peculiar distribution of CH3CN in IRC +10216 seen by ALMA††thanks: Based on observations carried out with ALMA and the IRAM 30m Telescope. ALMA is a partnership of ESO (representing its member states), NSF (USA) and NINS (Japan), together with NRC (Canada) and NSC and ASIAA (Taiwan), in cooperation with the Republic of Chile. The Joint ALMA Observatory is operated by ESO, AUI/NRAO and NAOJ. IRAM is supported by INSU/CNRS (France), MPG (Germany) and IGN (Spain). This paper makes use of the following ALMA data: ADS/JAO.ALMA#2011.0.00229.S.
Abstract
IRC +10216 is a circumstellar envelope around a carbon-rich evolved star which contains a large variety of molecules. According to interferometric observations, molecules are distributed either concentrated around the central star or as a hollow shell with a radius of 15′′. We present ALMA Cycle 0 band 6 observations of the rotational transition of CH3CN in IRC +10216, obtained with an angular resolution of . The bulk of the emission is distributed as a hollow shell located at just 2′′ from the star, with a void of emission in the central region up to a radius of 1′′. This spatial distribution is markedly different from those found to date in this source for other molecules. Our analysis indicate that methyl cyanide is not formed neither in the stellar photosphere nor far in the outer envelope, but at radial distances as short as 1-2′′, reaching a maximum abundance of molecules cm-3 at 2′′ from the star. Standard chemical models of IRC +10216 predict that the bulk of CH3CN molecules should be present at a radius of , where other species such as polyyne radicals and cyanopolyynes are observed, with an additional inner component within 1′′ from the star. The non-uniform structure of the circumstellar envelope and grain surface processes are discussed as possible causes of the peculiar distribution of methyl cyanide in IRC +10216.
Subject headings:
astrochemistry — line: identification — molecular processes — stars: AGB and post-AGB — circumstellar matter — stars: individual (IRC +10216)1. Introduction
The chemical structure of the well known carbon-rich envelope IRC +10216 and, in general, of circumstellar envelopes around asymptotic giant branch (AGB) stars is in general terms well described by an scenario in which stable molecules are formed in the warm and dense surroundings of the star under chemical equilibrium (Tsuji, 1973) while radicals and more exotic species are produced in the outer layers due to the photochemistry induced by the penetration of interstellar ultraviolet (UV) photons (Glassgold, 1996).
However, in recent years there have been evidences of a growing number of chemical aspects that do not fit into this general scenario. Perhaps, the most clear example is the detection of warm water vapour in IRC +10216 and other carbon-rich envelopes (Decin et al., 2010; Neufeld et al., 2011), as well as the observation of HCN in oxygen-rich envelopes (Bujarrabal et al., 1994; Bieging et al., 2000), NH3 in O- and C-rich envelopes (Keady & Ridgway, 1993; Menten et al., 2010), and PH3 in IRC +10216 (Agúndez et al., 2014). Observations indicate that these molecules are formed in the inner regions of the envelope with abundances much larger than predicted by chemical equilibrium. Indeed, these inner layers are complex regions where a variety of non-equilibrium processes such as shocks driven by the pulsation of the star (Cherchneff, 2012), processes related to the condensation of dust grains (Gail & Sedlmayr, 1988), and even photochemical processes driven by interstellar UV photons able to penetrate through the clumpy envelope (Agúndez et al., 2010), can affect the abundances of some species. Yet, the role of these processes on the chemistry has to be fully understood.
The use of (sub-)mm interferometers able to probe the distribution of different molecules in the inner regions of circumstellar envelopes are a very promising tool to unveil the role of the non-equilibrium processes at work in these inner regions. Some recent works have presented interferometric observations of the inner envelope of IRC +10216, revealing the compact emission distribution of some molecules around the star (Patel et al., 2011; Fonfría et al., 2014). The Atacama Large Millimeter Array (ALMA) has also started to provide observations of the chemical complexity in the inner envelope of IRC +10216 with a high angular resolution (Cernicharo et al., 2013; Velilla Prieto et al., 2015). Here we present ALMA Cycle 0 band 6 observations of IRC +10216 with sub-arcsec resolution and report a peculiar emission distribution for the rotational transition of CH3CN.
2. Observations
The ALMA Cycle 0 observations of IRC +10216 were carried out in April 2012 using receiver band 6. Part of these observations has been previously presented by Cernicharo et al. (2013) and by Velilla Prieto et al. (2015). Here we are concerned with the rotational transition of CH3CN, whose strongest components lie at 257.5 GHz, within the spectral setup covering the 255.3-260.2 GHz frequency range.
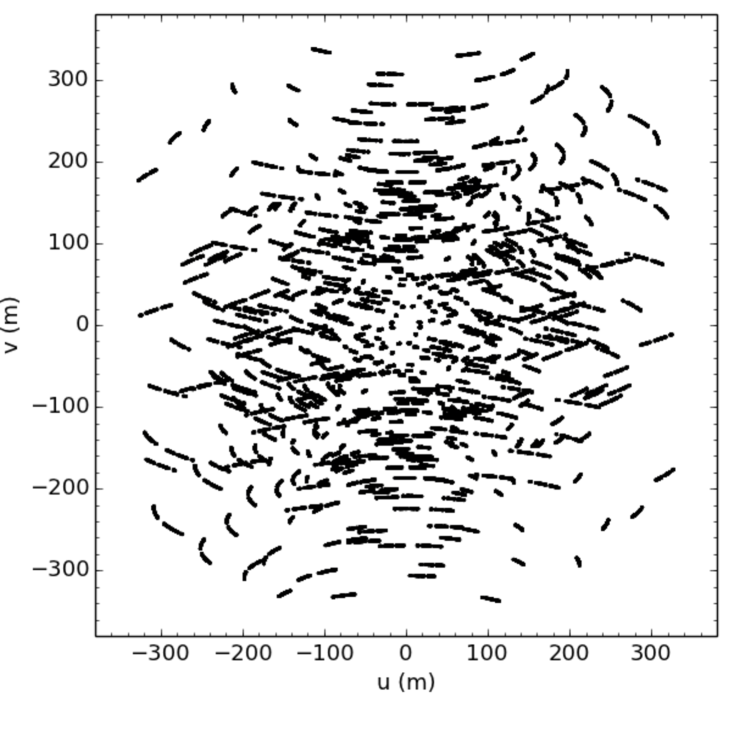
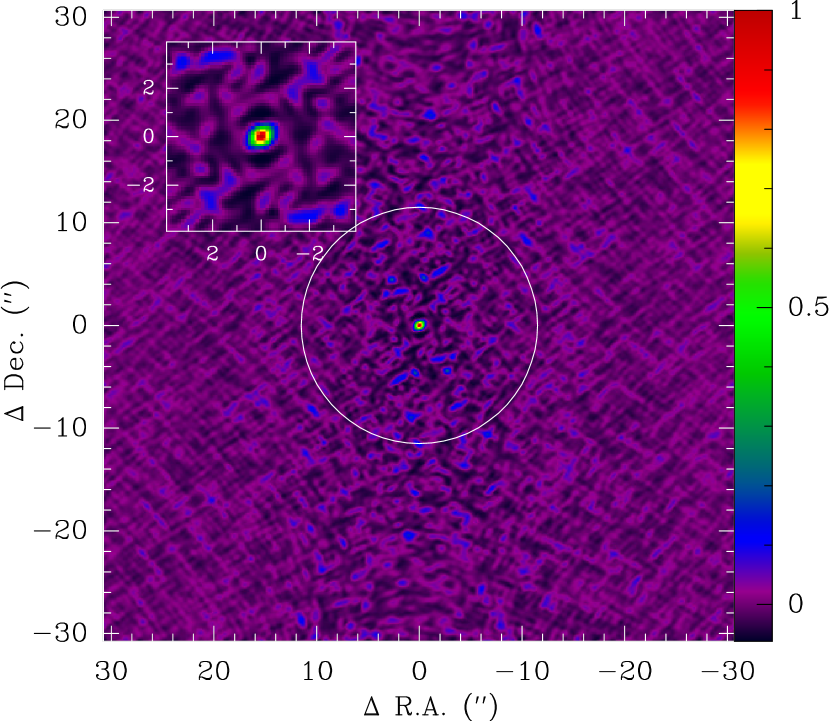
An array of 16 antennas with baselines ranging from 15.7 m to 384.1 m was used in three observing tracks of 21 minutes of correlations on source. The field of view (primary beam) of the ALMA 12m antennas has a diameter of at 257.5 GHz. The adopted spectral resolution is 0.98 MHz, with a channel spacing of 0.49 MHz. The bright point-like source J0854+201 was observed to calibrate the bandpass, while the amplitude and phase were calibrated by observing J0854+201 and J0909+013 every 10 and 20 minutes, respectively. The uncertainty in the flux calibration is estimated to be 8 %. Calibration was done with the software CASA111See http://casa.nrao.edu and further data processing was done using the package GILDAS222See http://www.iram.fr/IRAMFR/GILDAS. A good coverage of the plane was obtained, with 156,865 visibilities (see left panel in Fig. 1). The continuum was subtracted by carefully selecting spectral windows free of line emission located in spectral regions near the CH3CN lines. The associated dirty beam has minor contributions from sidelobes (less than 10 % of the main beam, see right panel in Fig. 1). Image deconvolution was carried out using the Högbom clean algorithm with no support, i.e., no a priori structure was assumed for the CH3CN brightness distribution. This choice is adequate because the sidelobes of the dirty beam are not important and because CH3CN line emission in IRC +10216 does not have a simple structure. The resulting synthesized beam is and the final rms per 0.49 MHz channel is 3.6 mJy beam-1.
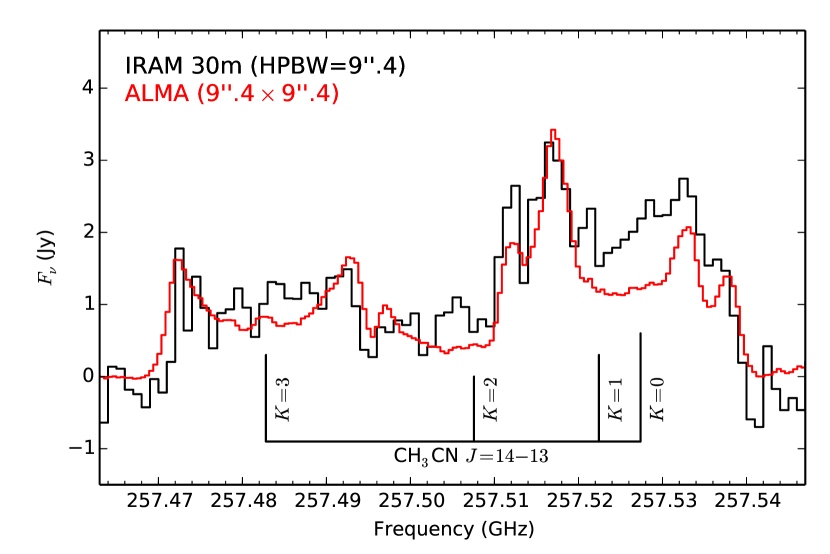
We carried out observations with the IRAM 30m telescope in June 2014 to estimate the degree of flux that could have been filtered out by ALMA. We used the EMIR E230 receiver connected to a fast Fourier Transform spectrometer providing a spectral resolution of 0.2 MHz (data were later on resampled to the channel spacing of 0.49 MHz of the ALMA data). We performed a scan over a region during 18 h of on source integration time using the ‘onthefly’ observing mode. The half power beam width (HPBW) of the IRAM 30m telescope at 257.5 GHz is 9.′′4. System temperatures were in the range 300-350 K, resulting in a rms of 0.02 K (0.17 Jy) per 0.49 MHz channel in the central region of the map. The spectrum obtained with the IRAM 30m telescope at the position of the star is compared in Fig. 2 with the ALMA spectrum integrated over a region , i.e., similar to the HPBW of the 30m telescope. It is seen that the flux filtered out by ALMA is negligible at the line edges of the different lines, which correspond to the terminal expansion velocity of the envelope and therefore show a rather compact distribution, although it can be as high as 30-40 % in some channels located around the center of the lines, where the emission is more extended.
3. Results
Some conclusions can be drawn after inspecting the brightness distribution in the different channels covering the most intense components () of the CH3CN transition. Hereafter, we refer to , i.e., the local standard rest velocity corrected for the systemic velocity of the source, as simply . In the case of IRC +10216, the systemic velocity is 26.5 km s-1 and the terminal expansion velocity of the envelope is 14.5 km s-1 (Cernicharo et al., 2000). At velocities close to the terminal expansion velocity, the emission appears compact and centered on the star while at velocities around the emission is distributed as a ring around the central position. This is the typical pattern of a molecule which is not concentrated around the central star but distributed in a hollow shell at a certain distance from the star. We must however note that in the case of CH3CN , this pattern is less clearly appreciated for the and components because these two lines overlap (their rest frequencies are closer than the line width of 29 km s-1), and therefore some of the channels have contributions from both components at different velocities.
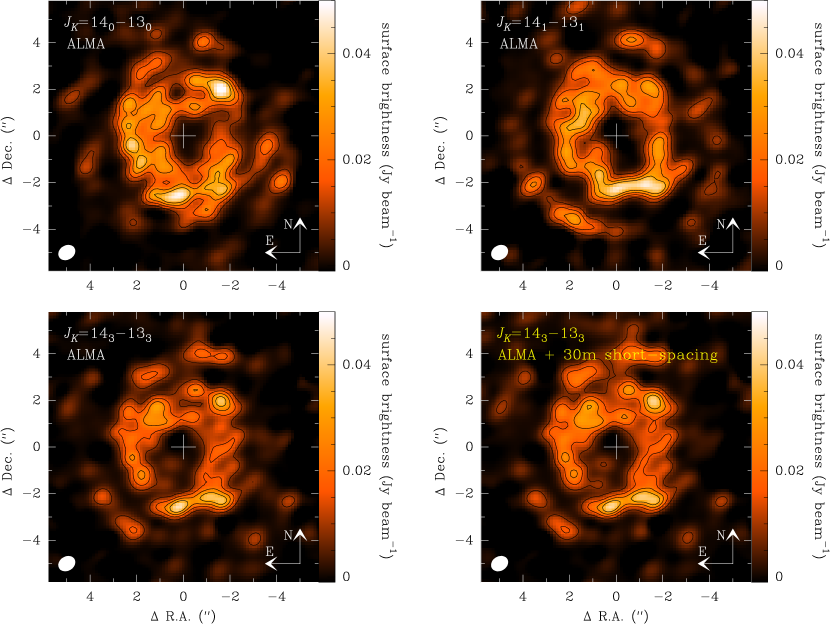
In Fig. 3 we show the brightness distribution of the strongest components () of the transition of CH3CN at . We first focus on the maps based on ALMA data without including short-spacing (top and bottom left panels in Fig. 3). It is seen that the maximum of the emission appears as a ring with a radius of and that there is a hole within from the position of the star. The map corresponding to the transition contains also emission from the component at km s-1, which makes the ring to broaden inwards. The same occurs in the map of the transition, which is contaminated by the component at km s-1. In the case of the and lines, emission at is free of blending with other components. In particular, the map of the transition, which is more intense than the transition, allows to see clearly the ring structure. It is also worth to note that a second ring of emission located at from the star is barely apparent at a few in the map, suggesting a spiral structure which has been also observed with ALMA in other molecular lines (Cernicharo et al. in preparation) and at large scales in the line of CO (Cernicharo et al., 2015), and that has been interpreted in terms of a binary system.
To evaluate whether the brightness distributions of the different lines at could be significantly affected by the ALMA flux loss, we have combined the ALMA data with the IRAM 30m short-spacing data to include visibilities at shorter baselines than the shortest one in the ALMA data (15.7 m). We however note that, given the modest sensitivity of the IRAM 30m data and the fact that the CH3CN emission is restricted to a region much smaller than the primary beam of ALMA (), we do not expect great changes in the emission structure. As an example, we compare in the bottom panels of Fig. 3 the brightness distribution of the line at , as obtained using ALMA data alone and after combining ALMA and 30m short-spacing data. It is seen that, appart from a slight recovery of flux at extended scales, the emission structure remains essentially unaltered.
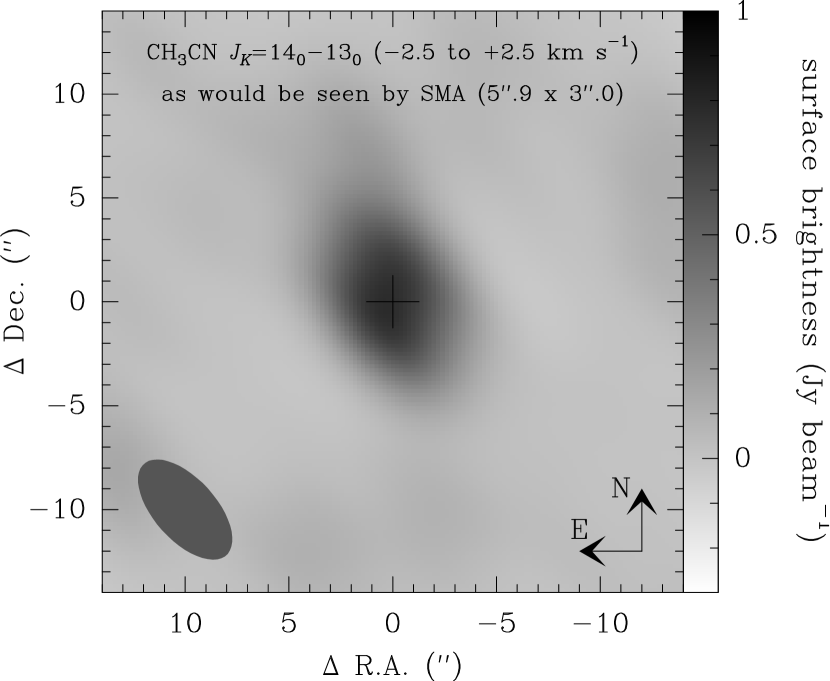
Higher lines of CH3CN were observed in IRC +10216 with the Submillimeter Array (SMA) by Patel et al. (2011) in their spectral survey covering the frequency range 293.9-354.8 GHz. These authors find a compact brightness distribution for the CH3CN lines, observed at angular resolutions ranging from to , i.e., noticeably poorer than the angular resolution of the ALMA observations presented here. Moreover, these authors assign various emission lines to rotational transitions of CH3CN in the vibrational state on the basis of a good agreement between the observed and laboratory rest frequencies. These results may lead to the conclusion that in IRC +10216, CH3CN is present in the warm surroundings of the AGB star, as occurs with other molecules such as SiS (Fonfría Expósito et al., 2006; Agúndez et al., 2012; Velilla Prieto et al., 2015), which is in conflict with our results. On the one hand, the identification of CH3CN by Patel et al. (2011) is not convincing taking into account that for many transitions, components that should be more intense than those identified are missing. For example, in the case of the transition in the state, only the components are identified, but not the lines, which should be far more intense. Therefore, the lines assigned to CH3CN must arise from other carriers. On the other hand, as concerns the rotational lines of CH3CN in the ground vibrational state observed with SMA, the compact emission distribution observed is probably a consequence of the limited angular resolution, which does not allow to resolve the inner hole seen by ALMA. This is illustrated in Fig. 4, where we have applied a tapering procedure to the ALMA data to suppress long baselines and simulate what would be seen with a synthesized beam of 5.′′9 3.′′0, as in the SMA observations of, e.g., the (see Patel et al. 2011). It is seen that with such limited angular resolution the inner hole in the emission is not resolved. Moreover, since the CH3CN lines observed by SMA are higher in than the one observed with ALMA, their emission could be shifted inwards due to excitation requirements, and thus a higher angular resolution would be needed to resolve the inner hole. We thus conclude that the hollow shell structure seen by ALMA in CH3CN emission is not in conflict with the compact distribution observed for higher transitions with SMA.
4. Discussion
According to the interferometric maps carried out during the past 20 years, the molecular emission in IRC +10216 appears either concentrated around the central star, as in the case of HCN, CS, SiO, SiS, and NaCN, or distributed in a hollow shell located at a radius of from the star, as occurs for HC5N, HNC, MgNC, and the radicals CN, C2H, C3H, and C4H (Lucas et al., 1995; Dayal & Bieging, 1995; Guélin et al., 1997; Fonfría et al., 2014; Velilla Prieto et al., 2015). However, in the case of CH3CN, the shell is not located at from the star but at just .
4.1. Excitation and radiative transfer model
| Vibrational mode | Sym.a | Freq.b | b |
|---|---|---|---|
| (cm-1) | (s-1) | ||
| CH3 symmetric stretching | A | 2954 | 3.1 |
| CN stretching | A | 2268 | 1.1 |
| CH3 symmetric deformation | A | 1385.2 | – |
| CC stretching | A | 920.290 | 0.21 |
| CH3 antisymmetric stretching | E | 3009 | 1.0 |
| CH3 antisymmetric deformation | E | 1449.7 | 5.3 |
| CH3 rocking | E | 1041.855 | 0.50 |
| CCN bending | E | 365.024 | 0.016 |
In order to use the ALMA observations to put constraints on the abundance, distribution, and excitation of CH3CN in the envelope of IRC +10216 we have carried out excitation and radiative transfer calculations based on a multi-shell LVG formalism. We adopted the model of the envelope of Agúndez et al. (2012), with the downward revision of the density of particles derived by Cernicharo et al. (2013) for the innermost layers (). The adopted mass loss rate and distance are M⊙ yr-1 and 130 pc (see Table 9 of Agúndez et al. 2012 for other parameters). As concerns the spectroscopy of CH3CN we consider separately the A and E species with the A:E statistical ratio of 1:1 and compute the energy levels from the spectroscopic constants reported by S̆imec̆kova et al. (2004) and Cazzoli & Puzzarini (2006, 2008) and the line strengths from the dipole moment of D measured by Gadhi et al. (1995). Infrared pumping to excited vibrational states may also play a role in the excitation of CH3CN. This molecule has eight vibrational modes, whose fundamental bands lie at wavelengths from 3.3 m to 27 m (see Table 1), and the radiation field in the highly reddened envelope of IRC +10216 is intense in the mid-infrared, especially around 10 m (Cernicharo et al., 1999). A detailed analysis of the complete pumping scheme of CH3CN is beyond the scope of this article. However, to have an idea of the effect of infrared pumping we included the first excited state of the vibrational mode , which can be pumped by 6.9 m photons. Other vibrational bands could also be important, e.g., the fundamental band of , whose strength is unfortunately not available, and overtones and hot bands of low-frequency modes such as . Vibrational modes such as , , or have also strong fundamental bands, although they lie at shorter wavelengths where the radiation field in IRC +10216 is less intense. The spectroscopic constants of the state have been taken from Paso et al. (1994). The strength of the vibrational band has been measured by Cerceau et al. (1985). We considered rotational levels within the ground and vibrational states up to . We adopted the rate coefficients of pure rotational excitation through inelastic collisions with H2 from the calculations by Green (1986), which extend up to 140 K, and extrapolated at higher temperatures assuming that the rate coefficients scale with the square root of temperature. Collisional excitation for ro-vibrational transitions was neglected.
As radial abundance profile for CH3CN we used an expression of Gaussian type which takes the form
| (1) |
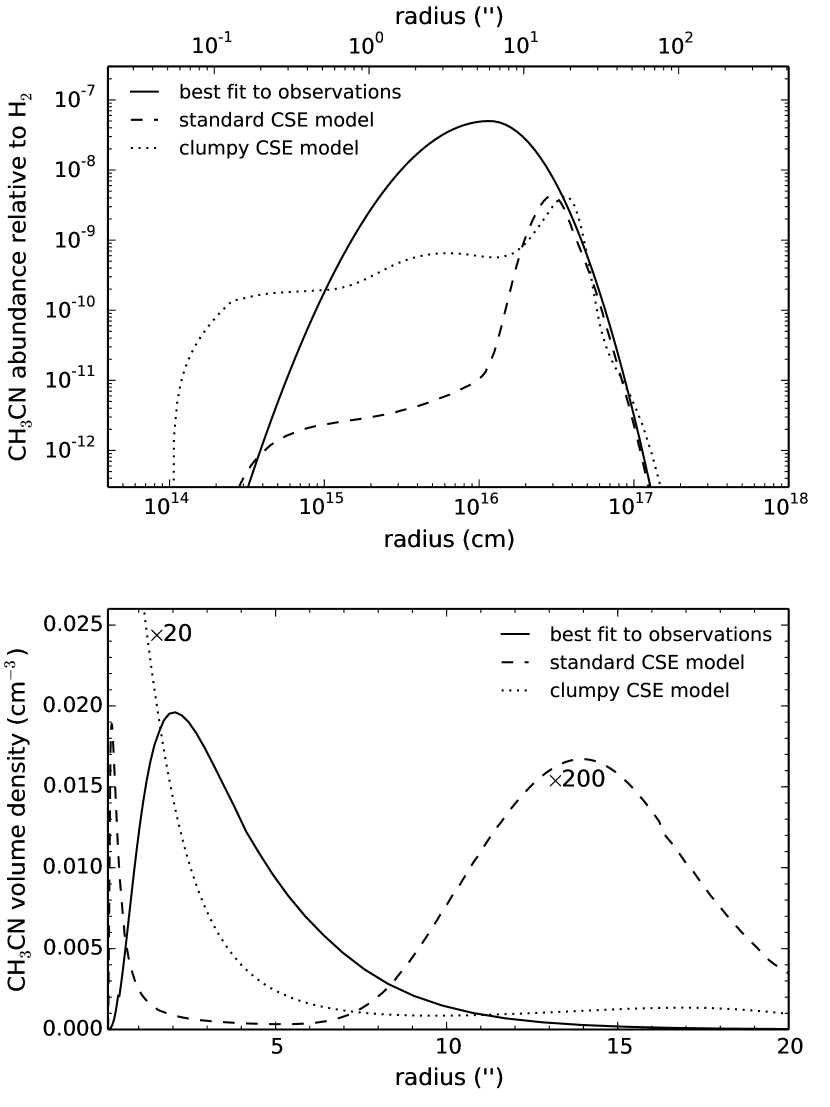
where is the fractional abundance with respect to H2, is the radius where peaks, and is a measure of the radial extent. The radial abundance profile which best reproduces the transition observed with ALMA is given by Eq. (1) with cm, , and for and 0.3 for (see solid lines in Fig. 5). It is seen that the fractional abundance relative to H2 reaches a maximum value of at 6′′ (see solid line in upper panel of Fig. 5). However, because of the increase in the gas density with decreasing radius, if the abundance is expressed as number of CH3CN molecules per unit volume, the peak value is reached well before, at about 2′′ (see solid line in lower panel of Fig. 5).
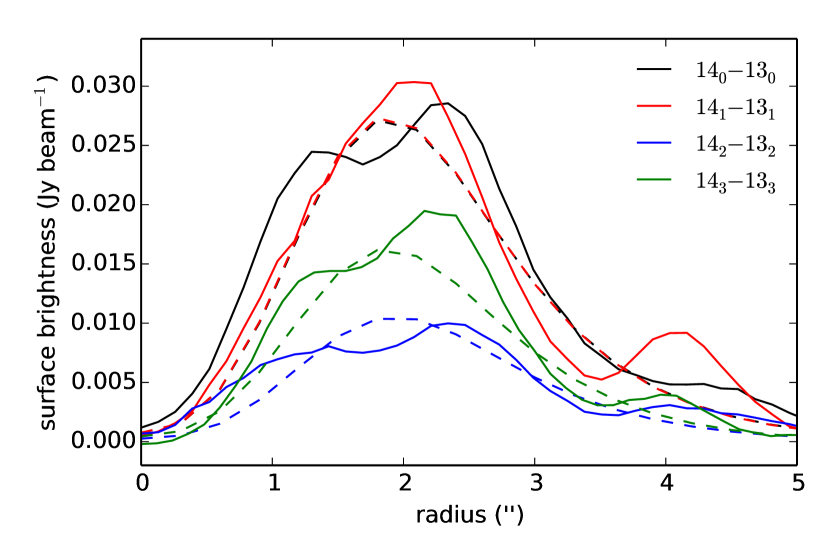
The radial brightness distributions calculated for the various components of the transition are confronted with the observed ones in Fig. 6. According to our calculations, the excitation of the rotational levels involved in the transition is dominated by inelastic collisions with H2, although infrared pumping to the state does also play a role as it induces a slight increase in the line intensity of about 10 % and shifts the emission to slightly outer radii. Including other vibrationally excited states could enhance the importance of infrared pumping. We find that as the quantum number increases, and so does the upper level energy of the corresponding transition, the excitation requirements become more demanding and the maximum of brightness shifts to shorter radii, where the higher gas density and infrared radiation field favor a more efficient excitation. This effect is however noticeable for high transitions. In the case of the to components, all them show a brightness peak at about 2′′, the same radius at which the volume density of CH3CN molecules reaches its maximum. It is also worth noting that the observed radial brightness distribution of three out of the four components shown in Fig. 6 show a more or less marked double-humped shape, which probably arises from the non-uniform character of the CH3CN shell, with subshells at smaller scales, spiral-like structures, etc. Our model of a smooth hollow spherical shell does not aim at reproducing these fine details, but the global shape of the observed brightness distribution.
In any case, it is clear that the CH3CN shell is located in IRC +10216 at a much shorter radius than the molecular shell at 15′′, where the radicals CN, C2H, C3H, and C4H, and molecules such as HNC and HC5N are observed (Guélin et al., 1997).
4.2. Chemical model
Standard chemical models of IRC +10216 cannot reproduce the ALMA observations in that they predict that CH3CN forms at too large radii (Agúndez et al., 2008; Li et al., 2014). Here we have constructed a standard chemical model using a gas phase reaction network built up from the databases UMIST and KIDA (McElroy et al., 2013; Wakelam et al., 2015) and the literature on gas phase chemical kinetics. We have chosen an initial radius of cm, which corresponds to 0.′′1 for an assumed distance of 130 pc, to investigate the possible formation of CH3CN in the inner regions of the envelope. The initial abundances injected into the expanding envelope are taken from Agúndez et al. (2012) and N2 is assumed to have an abundance of relative to H2.
According to the chemical model, the formation of methyl cyanide throughout the envelope of IRC +10216 (see also Agúndez et al. 2008) involves the formation of the precursor ion CH3CNH+ through the radiative association reaction
| (2) |
followed by the dissociative recombination of CH3CNH+ with electrons. Among the reagents in reaction (2), HCN is fairly abundant from the innermost layers out to the photodissociation region (Fonfría et al., 2008; Cernicharo et al., 2011) while the ion CH appears from the first stages of the expansion driven by cosmic rays although the bulk of formation is induced by photochemistry in the outer layers. The calculated abundance of CH3CN relative to H2 is shown as a function of radius in the upper panel of Fig. 5 (dashed line). Note the early appearance driven by cosmic rays at radii shorter than cm and the formation bump induced farther out by photochemistry. As previous chemical models, ours also puts most of CH3CN in the outer envelope, in a shell located at about 15′′ from the star. It is however interesting to note that the non-negligible fractional abundance of CH3CN driven by cosmic rays from the inner layers together with the high gas densities prevailing in these regions lead to a distribution of CH3CN molecules which, appart from the component located at 15′′, has also an inner component within 1′′ from the star. This is more clearly appreciated when expressing the abundance in absolute rather than relative terms (dashed line in lower panel of Fig. 5). The finding of the inner component of methyl cyanide in our chemical model is interesting because it appears closer to the region where this molecule is observed than the outer shell at 15′′. However, this inner component would appear compact rather than showing an inner hole, for angular resolutions poorer than 0.′′1, as is the case of our ALMA data.
Our chemical model underestimates the abundance of CH3CN by more than two orders of magnitude and predict a radial distribution markedly different from that observed. There are however uncertainties in the chemical model which are worth to discuss. Concerning reaction rate constants, that of the dissociative recombination of CH3CNH+ with electrons is known from measurements involving the fully deuterated ion (Vigren et al., 2008), although the branching ratios of the different channels, including that yielding CH3CN, are based on simple guesses (Vigren et al., 2009). The rate constant of reaction (2) is not well constrained. Low pressure experiments suggest a value of cm3 s-1 at 300 K (Anicich, 1993) while statistical calculations point to a value 45 times higher (Herbst, 1985). In the chemical model we adopt the lower experimental value. If the higher theoretical value is adopted, the calculated abundance of CH3CN experiences a ten-fold enhancement, although the shape of the radial profile remains similar. Another important parameter that affects the abundance of methyl cyanide, especially in the regions inner to cm, is the cosmic-ray ionization rate of H2, which in the chemical model is set to a value of s-1. If we adopt a higher rate, the abundance of CH3CN increases at short radii. That is, the inner component gains importance with respect to the outer one. In any case, the ionization rate due to cosmic rays in IRC +10216 is relatively well constrained by observations of HCO+ at millimeter wavelengths (Agúndez & Cernicharo, 2006; Pulliam et al., 2011), and therefore cannot be much higher than a few s-1.
As long as a standard chemical model fails to explain the distribution of CH3CN in IRC +10216, it seems clear that such model misses either some key chemical process or an adequate description of the physical structure of the envelope at arcsecond scales. There are various aspects which are worth to discuss. It is known that the envelope IRC +10216 is not completely smooth, but that it consists of shells and arcs which cross each other (Mauron & Huggins, 2000; Cernicharo et al., 2015). The effect of these shells on the radial distribution of molecules in IRC +10216 has been studied by Cordiner & Millar (2009), although the case of CH3CN was not specifically discussed by these authors. A non-uniform radial density profile could modulate the early appearance of CH3CN in the envelope, making the inner component to appear as a small hollow shell rather than a compact structure. To investigate this possibility it is necessary to have a precise knowledge of how the gas is distributed in the inner circumstellar layers. Another aspect of having a non-uniform distribution of matter in the circumstellar envelope is the clumpy nature, which may allow interstellar UV photons to penetrate in the inner layers, allowing to form some molecules as a result of photochemistry (Decin et al., 2010; Agúndez et al., 2010). In Fig. 5 we show the expected distribution of CH3CN under such scenario adopting the same parametric treatment of clumpiness of Decin et al. (2010). It is seen that the abundance of CH3CN indeed increases in the inner layers (dotted lines in Fig. 5), although the distribution of molecules would appear compact around the star rather than as a hollow shell. It remains to be seen whether a different scenario of clumpy envelope or a combination of clumpiness and shells could result in an abundance distribution of CH3CN compatible with that observed by ALMA. Alternative formation mechanisms such as grain surface processes could also play a role in the synthesis of CH3CN. Such possibility, although difficult to prove, is an interesting one because CH3CN appears soon after the dust condensation region in IRC +10216. Additional clues to understand the puzzling distribution of CH3CN in IRC +10216 could come from further ALMA observations of other species showing similar distributions. In particular, it would be interesting to see whether the chemically related species CH2CN shows a similar spatial distribution, although the lines of this radical are perhaps too faint to be mapped (Agúndez et al., 2008).
5. Conclusions
We used ALMA to observe the rotational transition of CH3CN, lying at 257.5 GHz, with an angular resolution of in the carbon star envelope IRC +10216. The bulk of the emission is distributed as a hollow shell wide located at from the star. The observations, together with an excitation and radiative transfer analysis, indicate that methyl cyanide is not formed neither in the stellar photosphere nor far in the outer envelope, but at radial distances as short as , reaching a maximum abundance of molecules cm-3 at 2′′ from the star. This fact is in conflict with standard chemical models of IRC +10216, which predict that the bulk of CH3CN molecules should be present at a radius of with an additional inner component within 1′′ from the star. It is not yet clear which mechanism is at the origin of the peculiar spatial distribution of methyl cyanide in IRC +10216. The non-uniform structure of the envelope, with shells, arcs, and clumps, and grain surface processes may play an important role on the distribution of CH3CN. Further ALMA observations of other molecules showing spatial distributions similar to that of CH3CN should bring light on the puzzling distribution of methyl cyanide in IRC +10216.
References
- Agúndez & Cernicharo (2006) Agúndez, M. & Cernicharo, J. 2006, ApJ, 743, 36
- Agúndez et al. (2008) Agúndez, M., Fonfría, J. P., Cernicharo, J., et al. 2008, A&A, 479, 493
- Agúndez et al. (2010) Agúndez, M., Cernicharo, J., & Guélin,M. 2010, ApJ, 724, L133
- Agúndez et al. (2012) Agúndez, M., Fonfría, J. P., Cernicharo, J. et al. 2012, A&A, 543, A48
- Agúndez et al. (2014) Agúndez, M., Cernicharo, J., Decin, L., et al. 2014, ApJ, 790, L27
- Anicich (1993) Anicich, V. G. 1993, J. Phys. Chem. Ref. Data, 22, 1469
- Bieging et al. (2000) Bieging, J. H., Shaked, S., & Gensheimer, P. D. 2000, ApJ, 543, 897
- Bujarrabal et al. (1994) Bujarrabal, V., Fuente, A., & Omont, A. 1994, A&A, 285, 247
- Cazzoli & Puzzarini (2006) Cazzoli, G. & Puzzarini, C. 2006, J. Mol. Spectr., 240, 153
- Cazzoli & Puzzarini (2008) Cazzoli, G. & Puzzarini, C. 2008, J. Mol. Spectr., 247, 187
- Cerceau et al. (1985) Cerceau, F., Raulin, F., Courtin, R., & Gautier, D. 1985, Icarus, 62, 207
- Cernicharo et al. (1999) Cernicharo, J., Yamamura, I., González-Alfonso, E., et al. 1999, ApJ, 526, L41
- Cernicharo et al. (2000) Cernicharo, J., Guélin, M., & Kahane, C. 2000, A&AS, 142, 181
- Cernicharo et al. (2011) Cernicharo, J., Agúndez, M., Kahane, C., et al. 2011, A&A, 529, L3
- Cernicharo et al. (2013) Cernicharo, J., Daniel, F., Castro-Carrizo, A., et al. 2013, ApJ, 778, L25
- Cernicharo et al. (2015) Cernicharo, J., Marcelino, N., Agúndez, M., & Guélin, M. 2015, A&A, 575, A91
- Cherchneff (2012) Cherchneff, I. 2012, A&A, 545, 12
- Cordiner & Millar (2009) Cordiner, M. A. & Millar, T. J. 2009, ApJ, 697, 68
- Dayal & Bieging (1995) Dayal, A. & Bieging, J. H. 1995, ApJ, 439, 996
- Decin et al. (2010) Decin, L., Agúndez, M., Barlow, M. J., et al. 2010, Nature, 467, 64
- Fonfría Expósito et al. (2006) Fonfría Expósito, J. P., Agúndez, M., Tercero, B., et al. 2006, ApJ, 646, L127
- Fonfría et al. (2008) Fonfría, J. P., Cernicharo, J., Richter, M. J., & Lacy, J. H. 2008, ApJ, 673, 445
- Fonfría et al. (2014) Fonfría, J. P., Fernández-López, M., Agúndez, M., et al. 2014, MNRAS, 445, 3289
- Gadhi et al. (1995) Gadhi, J., Lahrouni, A., Legrand, J., & Demaison, J. 1995, J. Chim. Phys. Phys.-Chim. Biol., 92, 11
- Gail & Sedlmayr (1988) Gail, H.-P. & Sedlmayr, E. 1988, A&A, 206, 153
- Glassgold (1996) Glassgold, A. E. 1996, ARA&A, 34, 241
- Green (1986) Green, S. 1986, ApJ, 309, 331
- Guélin et al. (1997) Guélin, M., Lucas, R., & Cernicharo, J. 1997, in CO: Twenty-Five Years of Millimeter Wave Spectroscopy, ed. W. B. Latter et al. (Dordrecht: Kluwer), IAU Symp., 170, 359
- Herbst (1985) Herbst, E. 1985, ApJ, 291, 226
- Keady & Ridgway (1993) Keady, J. J. & Ridgway, S. T. 1993, ApJ, 406, 199
- Li et al. (2014) Li, X., Millar, T. J., Walsh, C., et al. 2014, A&A, 568, A111
- Lucas et al. (1995) Lucas, R., Guélin, M., Kahane, C., et al. 1995, Ap&SS, 224, 293
- Mauron & Huggins (2000) Mauron, N. & Huggins, P. J. 2000, A&A, 359, 707
- McElroy et al. (2013) McElroy, D., Walsh, C., Markwick, A. J., et al. 2013, A&A, 550, A36
- Menten et al. (2010) Menten, K. M., Wyrowski, F., Alcolea, J., et al. 2010, A&A, 521, L7
- Müller et al. (2015) Müller, H. S. P., Brown, L. R., Drouin, B. J., et al. 2015, J. Mol. Spectr., 312, 22
- Neufeld et al. (2011) Neufeld, D. A., González-Alfonso, E., Melnick, G., et al. 2011, ApJ, 727, L29
- S̆imec̆kova et al. (2004) S̆imec̆kova, M., Urban, S̆., Fuchs, U., et al. 2004, J. Mol. Spectr., 226, 123
- Paso et al. (1994) Paso, R., Anttila, R., & Koivusaari, M. 1994, J. Mol. Spectr., 165, 470
- Patel et al. (2011) Patel, N. A., Young, K. H., Gottlieb, C. A., et al. 2011, ApJS, 193, 17
- Pulliam et al. (2011) Pulliam, R. L., Edwards, J. L., & Ziurys, L. M. 2011, ApJ, 743, 36
- Tsuji (1973) Tsuji, T. 1973, A&A, 23, 411
- Velilla Prieto et al. (2015) Velilla Prieto, L., Cernicharo, J., Quintana-Lacaci, G., et al. 2015, ApJ, 805, L13
- Vigren et al. (2008) Vigren, E., Kamińska, M., Hamberg, M., et al. 2008, Phys. Chem. Chem. Phys., 10, 4014
- Vigren et al. (2009) Vigren, E., Hamberg, M., Zhaunerchyk, V., et al. 2009, ApJ, 695, 317
- Wakelam et al. (2015) Wakelam, V., Loison, J.-C., Herbst, E., et al. 2015, ApJS, 217, 20